Cities with the Highest Poverty Level Among Families in Ohio
RELATED REPORTS & OPTIONS
Highest Family Poverty
Ohio
Compare Cities
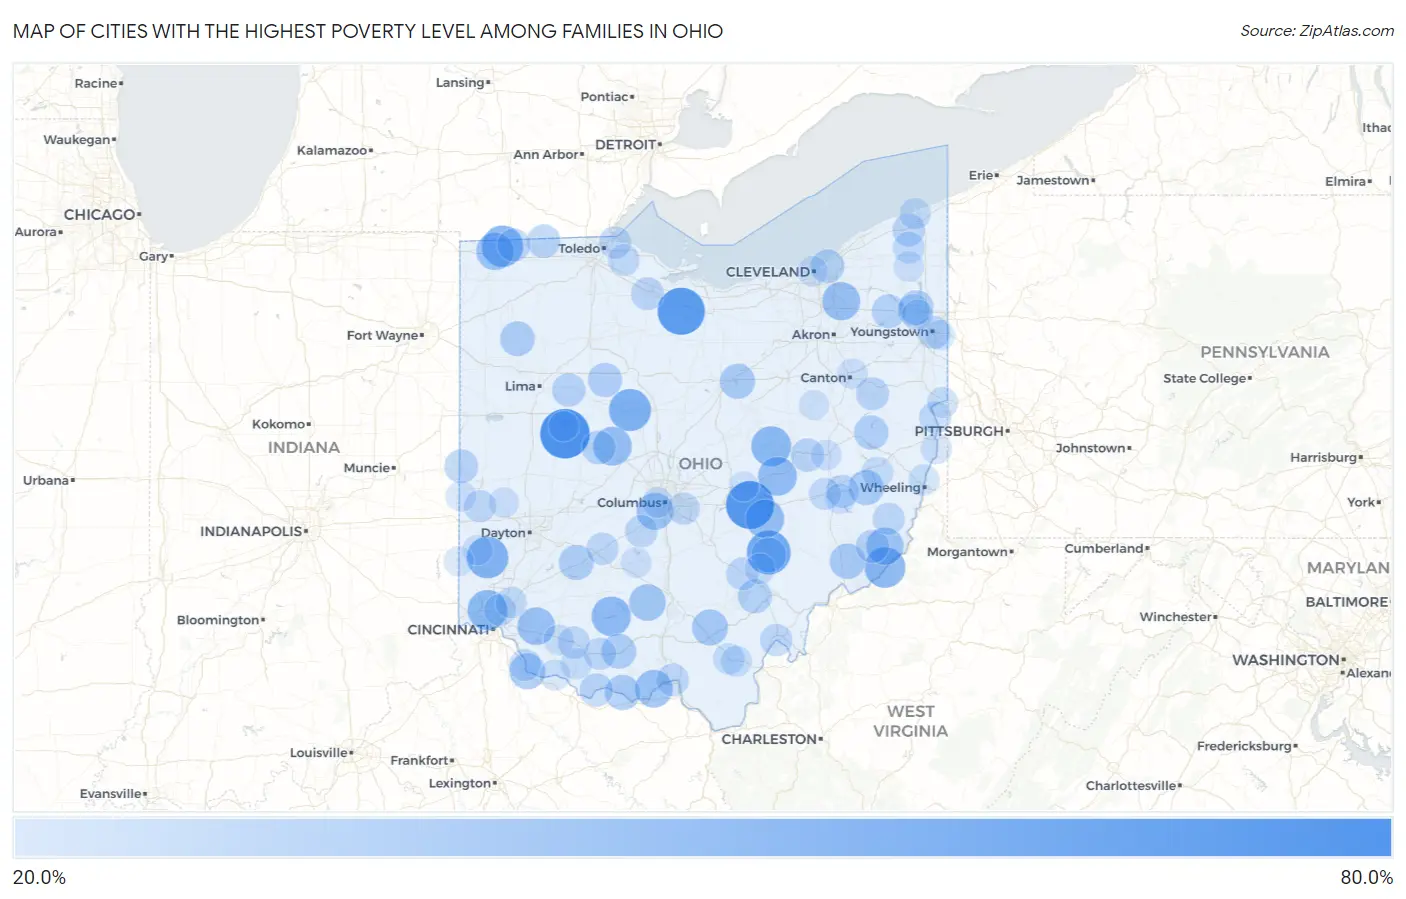
Map of Cities with the Highest Poverty Level Among Families in Ohio
0.0%
80.0%
Cities with the Highest Poverty Level Among Families in Ohio
| City | Family Poverty | vs State | vs National | |
| 1. | Lewistown | 71.1% | 9.3%(+61.9)#1 | 8.8%(+62.3)#236 |
| 2. | Brownsville | 67.1% | 9.3%(+57.8)#2 | 8.8%(+58.3)#262 |
| 3. | Flat Rock | 65.5% | 9.3%(+56.2)#3 | 8.8%(+56.7)#295 |
| 4. | Rendville | 57.1% | 9.3%(+47.9)#4 | 8.8%(+48.4)#443 |
| 5. | South Mount Vernon | 56.9% | 9.3%(+47.6)#5 | 8.8%(+48.1)#451 |
| 6. | New Bloomington | 52.5% | 9.3%(+43.2)#6 | 8.8%(+43.7)#569 |
| 7. | West Elkton | 51.5% | 9.3%(+42.3)#7 | 8.8%(+42.7)#604 |
| 8. | Alvordton | 51.2% | 9.3%(+42.0)#8 | 8.8%(+42.4)#613 |
| 9. | Matamoras | 49.4% | 9.3%(+40.1)#9 | 8.8%(+40.6)#700 |
| 10. | Nellie | 47.6% | 9.3%(+38.4)#10 | 8.8%(+38.8)#770 |
| 11. | Skyline Acres | 47.5% | 9.3%(+38.2)#11 | 8.8%(+38.7)#776 |
| 12. | Highland Holiday | 46.2% | 9.3%(+37.0)#12 | 8.8%(+37.4)#825 |
| 13. | Madison Place | 45.6% | 9.3%(+36.3)#13 | 8.8%(+36.8)#846 |
| 14. | Trinway | 45.0% | 9.3%(+35.7)#14 | 8.8%(+36.2)#880 |
| 15. | Raymond | 44.3% | 9.3%(+35.0)#15 | 8.8%(+35.5)#917 |
| 16. | East Fultonham | 44.2% | 9.3%(+34.9)#16 | 8.8%(+35.4)#921 |
| 17. | Twinsburg Heights | 43.1% | 9.3%(+33.9)#17 | 8.8%(+34.3)#986 |
| 18. | Owensville | 42.1% | 9.3%(+32.8)#18 | 8.8%(+33.3)#1,050 |
| 19. | Friendship | 42.0% | 9.3%(+32.8)#19 | 8.8%(+33.3)#1,052 |
| 20. | Kunkle | 41.8% | 9.3%(+32.5)#20 | 8.8%(+33.0)#1,072 |
| 21. | Antioch | 41.2% | 9.3%(+31.9)#21 | 8.8%(+32.4)#1,132 |
| 22. | Urbancrest | 40.8% | 9.3%(+31.6)#22 | 8.8%(+32.1)#1,148 |
| 23. | Bourneville | 39.6% | 9.3%(+30.4)#23 | 8.8%(+30.8)#1,241 |
| 24. | Coalton | 38.2% | 9.3%(+28.9)#24 | 8.8%(+29.4)#1,339 |
| 25. | Neville | 38.1% | 9.3%(+28.8)#25 | 8.8%(+29.3)#1,345 |
| 26. | Lower Salem | 36.8% | 9.3%(+27.6)#26 | 8.8%(+28.1)#1,441 |
| 27. | Rome Stout | 36.4% | 9.3%(+27.1)#27 | 8.8%(+27.6)#1,480 |
| 28. | Fairview | 36.4% | 9.3%(+27.1)#28 | 8.8%(+27.6)#1,483 |
| 29. | Mifflin | 36.1% | 9.3%(+26.8)#29 | 8.8%(+27.3)#1,501 |
| 30. | Port William | 35.6% | 9.3%(+26.4)#30 | 8.8%(+26.8)#1,547 |
| 31. | Corning | 35.5% | 9.3%(+26.2)#31 | 8.8%(+26.7)#1,559 |
| 32. | Peebles | 35.4% | 9.3%(+26.2)#32 | 8.8%(+26.6)#1,567 |
| 33. | Dupont | 35.3% | 9.3%(+26.0)#33 | 8.8%(+26.5)#1,578 |
| 34. | Morgandale | 34.4% | 9.3%(+25.2)#34 | 8.8%(+25.7)#1,664 |
| 35. | Bowerston | 34.2% | 9.3%(+24.9)#35 | 8.8%(+25.4)#1,692 |
| 36. | Patterson | 33.9% | 9.3%(+24.7)#36 | 8.8%(+25.1)#1,722 |
| 37. | New Marshfield | 33.3% | 9.3%(+24.1)#37 | 8.8%(+24.6)#1,791 |
| 38. | Windham | 33.1% | 9.3%(+23.9)#38 | 8.8%(+24.3)#1,842 |
| 39. | East Liberty | 33.1% | 9.3%(+23.9)#39 | 8.8%(+24.3)#1,843 |
| 40. | East Cleveland | 32.8% | 9.3%(+23.5)#40 | 8.8%(+24.0)#1,859 |
| 41. | Union City | 32.6% | 9.3%(+23.3)#41 | 8.8%(+23.8)#1,876 |
| 42. | Alger | 31.9% | 9.3%(+22.7)#42 | 8.8%(+23.2)#1,934 |
| 43. | Lyons | 31.9% | 9.3%(+22.7)#43 | 8.8%(+23.1)#1,939 |
| 44. | Manchester | 31.9% | 9.3%(+22.6)#44 | 8.8%(+23.1)#1,944 |
| 45. | West Lafayette | 31.8% | 9.3%(+22.6)#45 | 8.8%(+23.0)#1,951 |
| 46. | Graysville | 31.8% | 9.3%(+22.6)#46 | 8.8%(+23.0)#1,956 |
| 47. | Malvern | 31.3% | 9.3%(+22.1)#47 | 8.8%(+22.5)#2,024 |
| 48. | Fayette | 30.9% | 9.3%(+21.7)#48 | 8.8%(+22.1)#2,076 |
| 49. | Old Washington | 30.9% | 9.3%(+21.6)#49 | 8.8%(+22.1)#2,083 |
| 50. | Stony Prairie | 30.8% | 9.3%(+21.5)#50 | 8.8%(+22.0)#2,103 |
| 51. | Youngstown | 30.7% | 9.3%(+21.5)#51 | 8.8%(+21.9)#2,117 |
| 52. | Austinburg | 30.7% | 9.3%(+21.4)#52 | 8.8%(+21.9)#2,126 |
| 53. | Haydenville | 30.2% | 9.3%(+20.9)#53 | 8.8%(+21.4)#2,193 |
| 54. | Portsmouth | 29.9% | 9.3%(+20.7)#54 | 8.8%(+21.2)#2,246 |
| 55. | Derby | 29.6% | 9.3%(+20.4)#55 | 8.8%(+20.8)#2,284 |
| 56. | Pomeroy | 29.5% | 9.3%(+20.3)#56 | 8.8%(+20.8)#2,303 |
| 57. | Harbor View | 29.4% | 9.3%(+20.2)#57 | 8.8%(+20.6)#2,323 |
| 58. | Jeffersonville | 29.3% | 9.3%(+20.1)#58 | 8.8%(+20.5)#2,333 |
| 59. | Seaman | 29.2% | 9.3%(+19.9)#59 | 8.8%(+20.4)#2,347 |
| 60. | Moscow | 29.0% | 9.3%(+19.8)#60 | 8.8%(+20.3)#2,378 |
| 61. | Castine | 29.0% | 9.3%(+19.8)#61 | 8.8%(+20.3)#2,379 |
| 62. | Beallsville | 29.0% | 9.3%(+19.7)#62 | 8.8%(+20.2)#2,383 |
| 63. | Brice | 28.9% | 9.3%(+19.7)#63 | 8.8%(+20.2)#2,389 |
| 64. | Sardinia | 28.9% | 9.3%(+19.6)#64 | 8.8%(+20.1)#2,404 |
| 65. | Warren | 28.8% | 9.3%(+19.6)#65 | 8.8%(+20.1)#2,410 |
| 66. | Stratton | 28.8% | 9.3%(+19.5)#66 | 8.8%(+20.0)#2,419 |
| 67. | Cambridge | 28.4% | 9.3%(+19.2)#67 | 8.8%(+19.6)#2,490 |
| 68. | Rock Creek | 28.4% | 9.3%(+19.1)#68 | 8.8%(+19.6)#2,498 |
| 69. | Clay Center | 28.1% | 9.3%(+18.9)#69 | 8.8%(+19.3)#2,543 |
| 70. | Lockland | 28.0% | 9.3%(+18.8)#70 | 8.8%(+19.2)#2,562 |
| 71. | Holloway | 27.8% | 9.3%(+18.6)#71 | 8.8%(+19.1)#2,603 |
| 72. | New Haven Cdp Huron County | 27.7% | 9.3%(+18.5)#72 | 8.8%(+18.9)#2,628 |
| 73. | Brecon | 27.6% | 9.3%(+18.4)#73 | 8.8%(+18.8)#2,648 |
| 74. | Petersburg | 27.4% | 9.3%(+18.2)#74 | 8.8%(+18.7)#2,681 |
| 75. | Ashtabula | 27.4% | 9.3%(+18.2)#75 | 8.8%(+18.6)#2,684 |
| 76. | Centerville Thurman | 27.3% | 9.3%(+18.0)#76 | 8.8%(+18.5)#2,726 |
| 77. | East Liverpool | 26.9% | 9.3%(+17.6)#77 | 8.8%(+18.1)#2,788 |
| 78. | Rio Grande | 26.8% | 9.3%(+17.5)#78 | 8.8%(+18.0)#2,813 |
| 79. | Russellville | 26.7% | 9.3%(+17.5)#79 | 8.8%(+18.0)#2,822 |
| 80. | Bolindale | 26.5% | 9.3%(+17.3)#80 | 8.8%(+17.7)#2,868 |
| 81. | Martins Ferry | 26.5% | 9.3%(+17.2)#81 | 8.8%(+17.7)#2,876 |
| 82. | Higginsport | 26.0% | 9.3%(+16.7)#82 | 8.8%(+17.2)#2,988 |
| 83. | Mount Orab | 25.7% | 9.3%(+16.5)#83 | 8.8%(+17.0)#3,056 |
| 84. | Mingo Junction | 25.7% | 9.3%(+16.5)#84 | 8.8%(+16.9)#3,064 |
| 85. | Murray City | 25.7% | 9.3%(+16.4)#85 | 8.8%(+16.9)#3,074 |
| 86. | Valleyview | 25.7% | 9.3%(+16.4)#86 | 8.8%(+16.9)#3,075 |
| 87. | Newcomerstown | 25.6% | 9.3%(+16.4)#87 | 8.8%(+16.9)#3,077 |
| 88. | Cleveland | 25.6% | 9.3%(+16.4)#88 | 8.8%(+16.9)#3,078 |
| 89. | Orwell | 25.6% | 9.3%(+16.4)#89 | 8.8%(+16.8)#3,082 |
| 90. | Canton | 25.6% | 9.3%(+16.3)#90 | 8.8%(+16.8)#3,093 |
| 91. | New Holland | 25.6% | 9.3%(+16.3)#91 | 8.8%(+16.8)#3,097 |
| 92. | Hollansburg | 25.4% | 9.3%(+16.1)#92 | 8.8%(+16.6)#3,141 |
| 93. | Camden | 25.0% | 9.3%(+15.8)#93 | 8.8%(+16.3)#3,196 |
| 94. | Potsdam | 25.0% | 9.3%(+15.7)#94 | 8.8%(+16.2)#3,215 |
| 95. | Lore City | 25.0% | 9.3%(+15.7)#95 | 8.8%(+16.2)#3,216 |
| 96. | Russells Point | 24.8% | 9.3%(+15.5)#96 | 8.8%(+16.0)#3,305 |
| 97. | College Corner | 24.7% | 9.3%(+15.5)#97 | 8.8%(+15.9)#3,313 |
| 98. | Winesburg | 24.6% | 9.3%(+15.4)#98 | 8.8%(+15.8)#3,332 |
| 99. | Marne | 24.6% | 9.3%(+15.3)#99 | 8.8%(+15.8)#3,336 |
| 100. | Campbell | 24.5% | 9.3%(+15.2)#100 | 8.8%(+15.7)#3,364 |
Common Questions
What are the Top 10 Cities with the Highest Poverty Level Among Families in Ohio?
Top 10 Cities with the Highest Poverty Level Among Families in Ohio are:
#1
71.1%
#2
67.1%
#3
65.5%
#4
57.1%
#5
52.5%
#6
51.5%
#7
51.2%
#8
49.4%
#9
47.6%
#10
47.5%
What city has the Highest Poverty Level Among Families in Ohio?
Lewistown has the Highest Poverty Level Among Families in Ohio with 71.1%.
What is the Poverty Level Among Families in the State of Ohio?
Poverty Level Among Families in Ohio is 9.3%.
What is the Poverty Level Among Families in the United States?
Poverty Level Among Families in the United States is 8.8%.