Cities with the Highest Percentage of Immigrants from Panama in Ohio
RELATED REPORTS & OPTIONS
Panama
Ohio
Compare Cities
Map of Cities with the Highest Percentage of Immigrants from Panama in Ohio
0.00%
1.00%
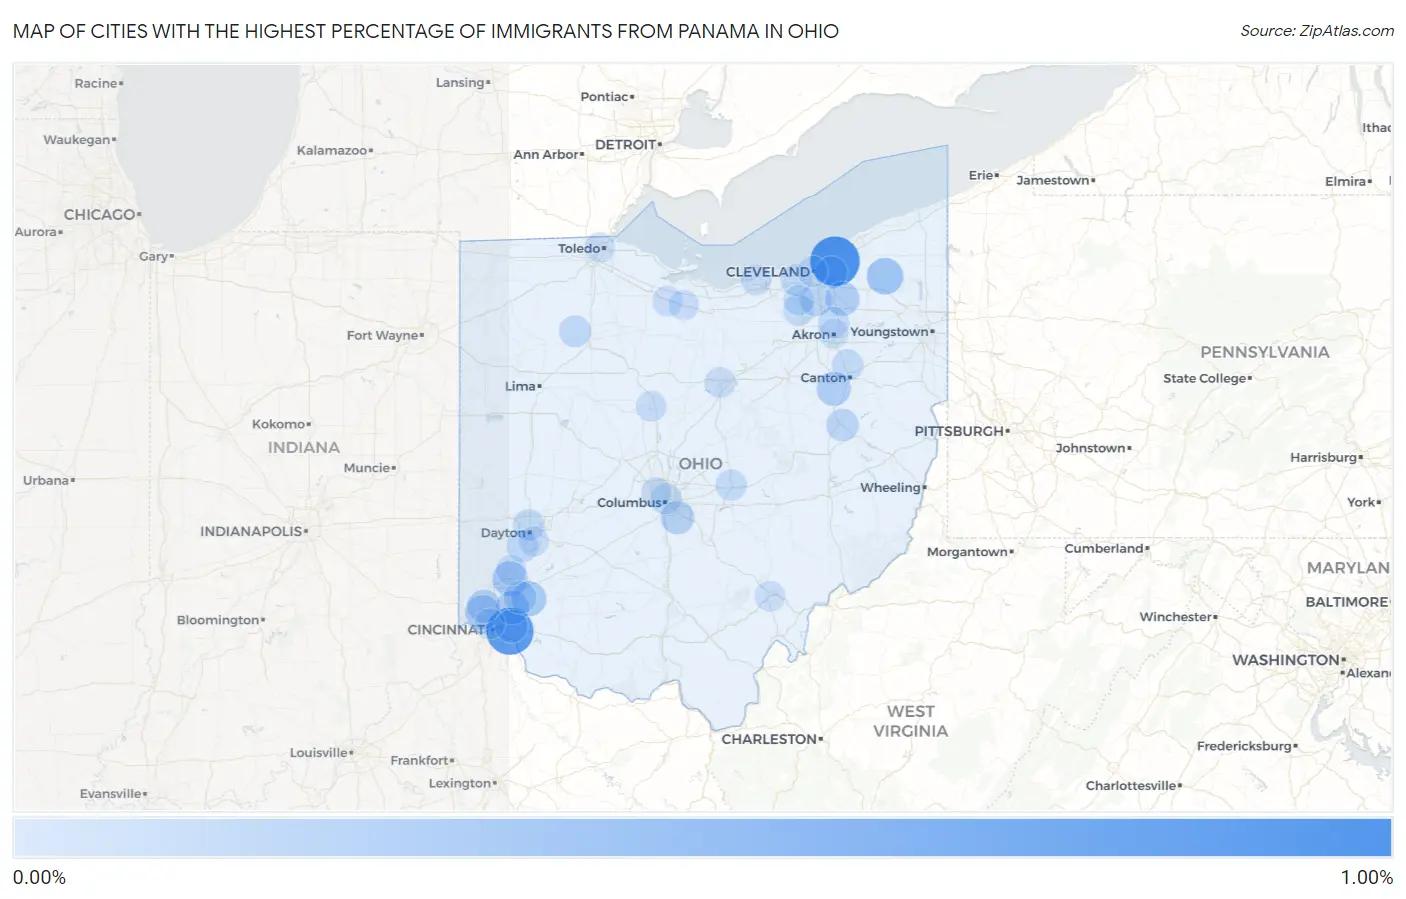
Cities with the Highest Percentage of Immigrants from Panama in Ohio
| City | Panama | vs State | vs National | |
| 1. | Richmond Heights | 0.80% | 0.010%(+0.792)#-1 | 0.032%(+0.771)#0 |
| 2. | Sherwood | 0.70% | 0.010%(+0.694)#0 | 0.032%(+0.672)#1 |
| 3. | Middlefield | 0.25% | 0.010%(+0.244)#1 | 0.032%(+0.222)#2 |
| 4. | Monroe | 0.20% | 0.010%(+0.194)#2 | 0.032%(+0.172)#3 |
| 5. | Maineville | 0.19% | 0.010%(+0.184)#3 | 0.032%(+0.163)#4 |
| 6. | White Oak | 0.17% | 0.010%(+0.162)#4 | 0.032%(+0.141)#5 |
| 7. | Navarre | 0.16% | 0.010%(+0.150)#5 | 0.032%(+0.129)#6 |
| 8. | Twinsburg | 0.16% | 0.010%(+0.145)#6 | 0.032%(+0.124)#7 |
| 9. | Montgomery | 0.15% | 0.010%(+0.138)#7 | 0.032%(+0.116)#8 |
| 10. | Groveport | 0.13% | 0.010%(+0.125)#8 | 0.032%(+0.103)#9 |
| 11. | Northgate | 0.13% | 0.010%(+0.116)#9 | 0.032%(+0.094)#10 |
| 12. | Newtown | 0.11% | 0.010%(+0.101)#10 | 0.032%(+0.080)#11 |
| 13. | Landen | 0.098% | 0.010%(+0.088)#11 | 0.032%(+0.066)#12 |
| 14. | New Philadelphia | 0.097% | 0.010%(+0.086)#12 | 0.032%(+0.065)#13 |
| 15. | University Heights | 0.095% | 0.010%(+0.085)#13 | 0.032%(+0.063)#14 |
| 16. | Broadview Heights | 0.081% | 0.010%(+0.070)#14 | 0.032%(+0.049)#15 |
| 17. | Mccomb | 0.064% | 0.010%(+0.053)#15 | 0.032%(+0.032)#16 |
| 18. | West Carrollton | 0.061% | 0.010%(+0.051)#16 | 0.032%(+0.029)#17 |
| 19. | Dayton | 0.058% | 0.010%(+0.047)#17 | 0.032%(+0.026)#18 |
| 20. | Brunswick | 0.054% | 0.010%(+0.043)#18 | 0.032%(+0.022)#19 |
| 21. | Fairview Park | 0.053% | 0.010%(+0.042)#19 | 0.032%(+0.021)#20 |
| 22. | North Canton | 0.051% | 0.010%(+0.040)#20 | 0.032%(+0.019)#21 |
| 23. | Newark | 0.048% | 0.010%(+0.038)#21 | 0.032%(+0.016)#22 |
| 24. | Cuyahoga Falls | 0.041% | 0.010%(+0.031)#22 | 0.032%(+0.009)#23 |
| 25. | Columbus | 0.034% | 0.010%(+0.024)#23 | 0.032%(+0.002)#24 |
| 26. | Mansfield | 0.029% | 0.010%(+0.019)#24 | 0.032%(-0.002)#25 |
| 27. | Upper Arlington | 0.025% | 0.010%(+0.014)#25 | 0.032%(-0.007)#26 |
| 28. | Lorain | 0.023% | 0.010%(+0.013)#26 | 0.032%(-0.009)#27 |
| 29. | Cincinnati | 0.022% | 0.010%(+0.012)#27 | 0.032%(-0.009)#28 |
| 30. | Marion | 0.022% | 0.010%(+0.012)#28 | 0.032%(-0.010)#29 |
| 31. | Strongsville | 0.022% | 0.010%(+0.011)#29 | 0.032%(-0.010)#30 |
| 32. | Cleveland | 0.021% | 0.010%(+0.011)#30 | 0.032%(-0.010)#144 |
| 33. | Athens | 0.018% | 0.010%(+0.007)#31 | 0.032%(-0.014)#145 |
| 34. | Middletown | 0.016% | 0.010%(+0.005)#32 | 0.032%(-0.016)#146 |
| 35. | Clyde | 0.016% | 0.010%(+0.005)#33 | 0.032%(-0.016)#147 |
| 36. | Bellevue | 0.012% | 0.010%(+0.002)#34 | 0.032%(-0.020)#148 |
| 37. | Kettering | 0.012% | 0.010%(+0.002)#35 | 0.032%(-0.020)#149 |
| 38. | Akron | 0.0042% | 0.010%(-0.006)#36 | 0.032%(-0.028)#150 |
| 39. | Toledo | 0.0011% | 0.010%(-0.009)#37 | 0.032%(-0.031)#151 |
Common Questions
What are the Top 10 Cities with the Highest Percentage of Immigrants from Panama in Ohio?
Top 10 Cities with the Highest Percentage of Immigrants from Panama in Ohio are:
#1
0.80%
#2
0.70%
#3
0.25%
#4
0.20%
#5
0.19%
#6
0.17%
#7
0.16%
#8
0.16%
#9
0.15%
#10
0.13%
What city has the Highest Percentage of Immigrants from Panama in Ohio?
Richmond Heights has the Highest Percentage of Immigrants from Panama in Ohio with 0.80%.
What is the Percentage of Immigrants from Panama in the State of Ohio?
Percentage of Immigrants from Panama in Ohio is 0.010%.
What is the Percentage of Immigrants from Panama in the United States?
Percentage of Immigrants from Panama in the United States is 0.032%.