Cities with the Highest Percentage of Immigrants from Liberia in Ohio
RELATED REPORTS & OPTIONS
Liberia
Ohio
Compare Cities
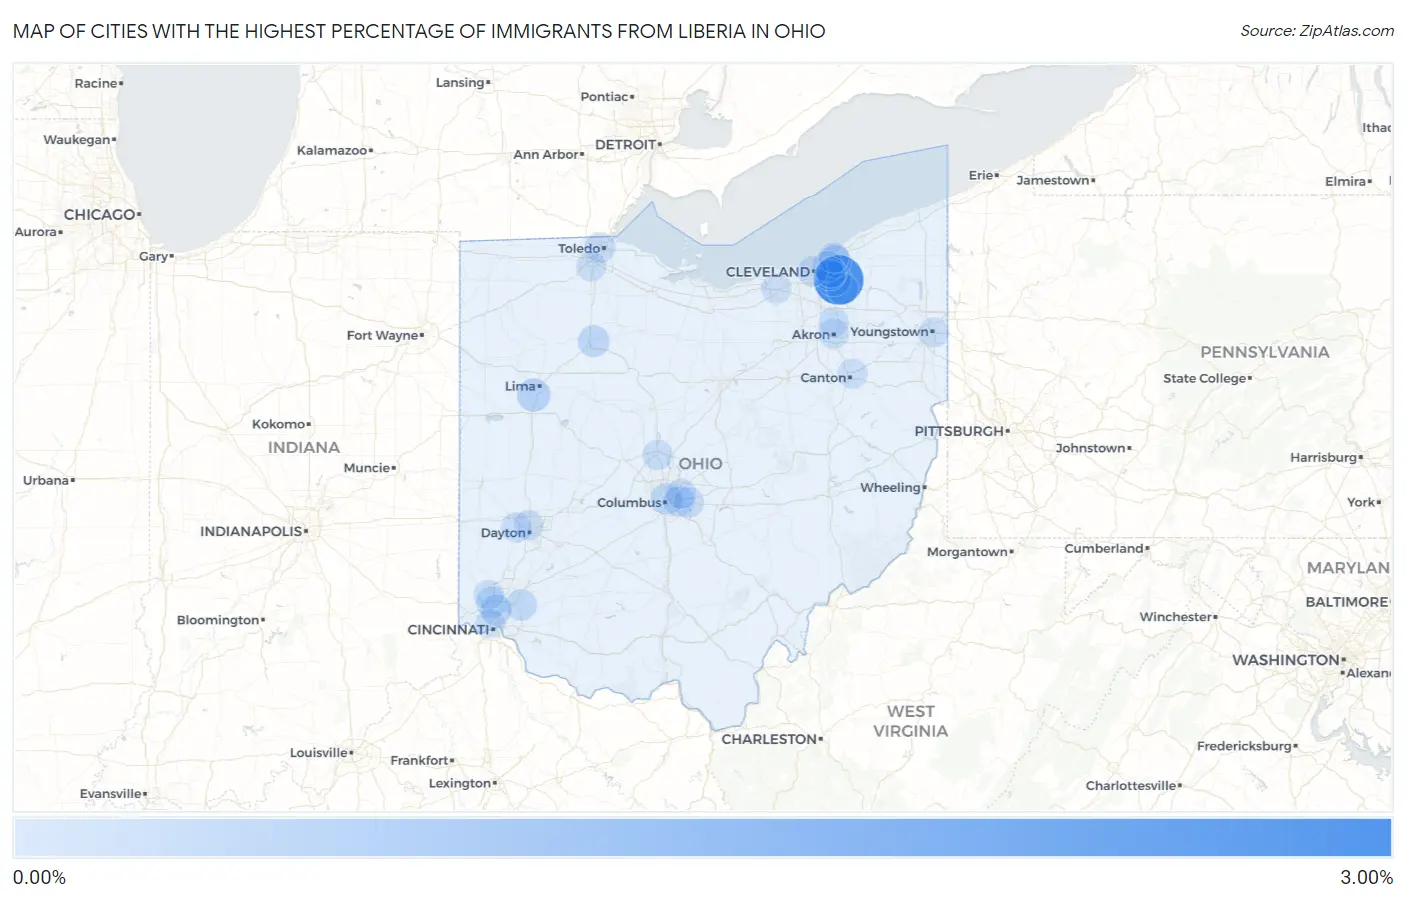
Map of Cities with the Highest Percentage of Immigrants from Liberia in Ohio
0.00%
3.00%
Cities with the Highest Percentage of Immigrants from Liberia in Ohio
| City | Liberia | vs State | vs National | |
| 1. | Orange | 2.91% | 0.022%(+2.89)#-1 | 0.030%(+2.88)#0 |
| 2. | Highland Hills | 0.72% | 0.022%(+0.693)#0 | 0.030%(+0.686)#1 |
| 3. | Fort Shawnee | 0.45% | 0.022%(+0.432)#1 | 0.030%(+0.425)#2 |
| 4. | Richmond Heights | 0.36% | 0.022%(+0.342)#2 | 0.030%(+0.334)#3 |
| 5. | Findlay | 0.24% | 0.022%(+0.215)#3 | 0.030%(+0.208)#4 |
| 6. | Loveland | 0.20% | 0.022%(+0.182)#4 | 0.030%(+0.174)#5 |
| 7. | Solon | 0.20% | 0.022%(+0.181)#25 | 0.030%(+0.174)#851 |
| 8. | Columbus | 0.18% | 0.022%(+0.159)#37 | 0.030%(+0.151)#1,352 |
| 9. | Forest Park | 0.16% | 0.022%(+0.138)#38 | 0.030%(+0.130)#1,353 |
| 10. | Wyoming | 0.14% | 0.022%(+0.115)#39 | 0.030%(+0.108)#1,354 |
| 11. | Whitehall | 0.13% | 0.022%(+0.113)#40 | 0.030%(+0.105)#1,355 |
| 12. | East Cleveland | 0.11% | 0.022%(+0.093)#41 | 0.030%(+0.085)#1,356 |
| 13. | Reynoldsburg | 0.071% | 0.022%(+0.049)#42 | 0.030%(+0.041)#1,357 |
| 14. | Shaker Heights | 0.062% | 0.022%(+0.039)#43 | 0.030%(+0.032)#1,358 |
| 15. | Delaware | 0.048% | 0.022%(+0.025)#52 | 0.030%(+0.018)#1,984 |
| 16. | Toledo | 0.047% | 0.022%(+0.025)#55 | 0.030%(+0.018)#2,023 |
| 17. | Cleveland | 0.044% | 0.022%(+0.022)#56 | 0.030%(+0.014)#2,024 |
| 18. | Trotwood | 0.039% | 0.022%(+0.017)#57 | 0.030%(+0.009)#2,025 |
| 19. | Gahanna | 0.031% | 0.022%(+0.009)#58 | 0.030%(+0.001)#2,026 |
| 20. | Akron | 0.030% | 0.022%(+0.008)#59 | 0.030%(+0.000)#2,046 |
| 21. | Cuyahoga Falls | 0.029% | 0.022%(+0.007)#60 | 0.030%(-0.000)#2,047 |
| 22. | Euclid | 0.028% | 0.022%(+0.006)#61 | 0.030%(-0.001)#2,048 |
| 23. | Perrysburg | 0.028% | 0.022%(+0.006)#62 | 0.030%(-0.002)#2,049 |
| 24. | University Heights | 0.022% | 0.022%(-0.000)#63 | 0.030%(-0.008)#2,050 |
| 25. | Canton | 0.021% | 0.022%(-0.001)#64 | 0.030%(-0.008)#2,051 |
| 26. | North Ridgeville | 0.017% | 0.022%(-0.005)#65 | 0.030%(-0.013)#2,052 |
| 27. | Youngstown | 0.013% | 0.022%(-0.009)#66 | 0.030%(-0.016)#2,053 |
| 28. | Dayton | 0.010% | 0.022%(-0.012)#67 | 0.030%(-0.020)#2,054 |
| 29. | Fairfield | 0.0067% | 0.022%(-0.016)#68 | 0.030%(-0.023)#2,055 |
| 30. | Cincinnati | 0.0029% | 0.022%(-0.019)#69 | 0.030%(-0.027)#2,056 |
Common Questions
What are the Top 10 Cities with the Highest Percentage of Immigrants from Liberia in Ohio?
Top 10 Cities with the Highest Percentage of Immigrants from Liberia in Ohio are:
#1
2.91%
#2
0.72%
#3
0.45%
#4
0.36%
#5
0.24%
#6
0.20%
#7
0.20%
#8
0.18%
#9
0.16%
#10
0.14%
What city has the Highest Percentage of Immigrants from Liberia in Ohio?
Orange has the Highest Percentage of Immigrants from Liberia in Ohio with 2.91%.
What is the Percentage of Immigrants from Liberia in the State of Ohio?
Percentage of Immigrants from Liberia in Ohio is 0.022%.
What is the Percentage of Immigrants from Liberia in the United States?
Percentage of Immigrants from Liberia in the United States is 0.030%.