Cities with the Highest Percentage of Lebanese Population in Ohio
RELATED REPORTS & OPTIONS
Lebanese
Ohio
Compare Cities
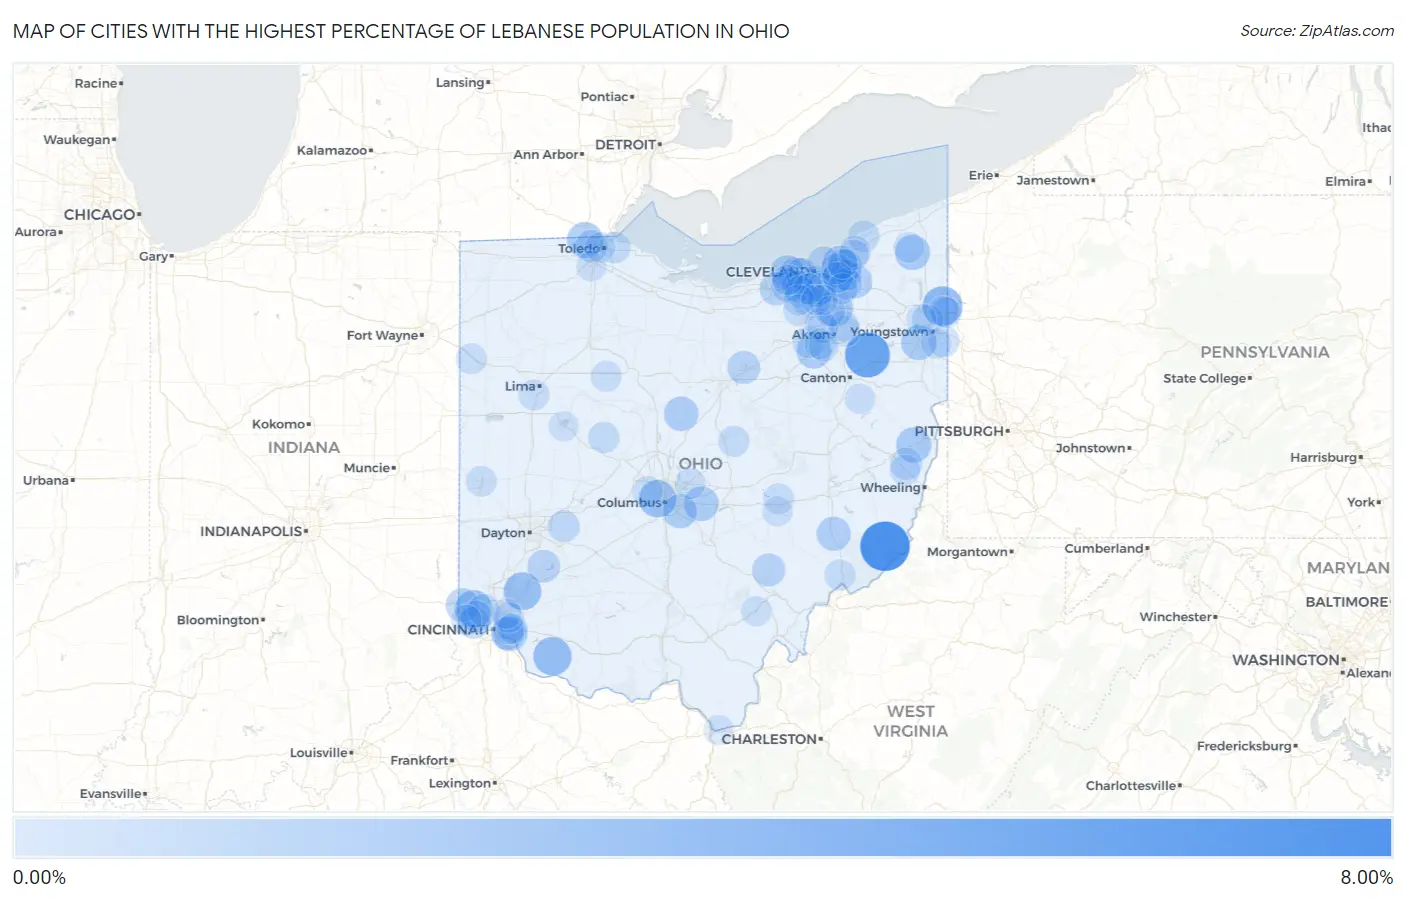
Map of Cities with the Highest Percentage of Lebanese Population in Ohio
0.00%
8.00%
Cities with the Highest Percentage of Lebanese Population in Ohio
| City | Lebanese | vs State | vs National | |
| 1. | Antioch | 6.38% | 0.24%(+6.15)#1 | 0.17%(+6.22)#25 |
| 2. | Marlboro | 4.94% | 0.24%(+4.70)#2 | 0.17%(+4.77)#41 |
| 3. | Ridgewood | 3.37% | 0.24%(+3.14)#3 | 0.17%(+3.21)#84 |
| 4. | Yankee Lake | 3.37% | 0.24%(+3.14)#4 | 0.17%(+3.21)#85 |
| 5. | Hamersville | 2.96% | 0.24%(+2.72)#5 | 0.17%(+2.79)#100 |
| 6. | Kings Mills | 2.76% | 0.24%(+2.53)#6 | 0.17%(+2.60)#116 |
| 7. | Marble Cliff | 2.68% | 0.24%(+2.44)#7 | 0.17%(+2.51)#122 |
| 8. | Taylor Creek | 2.58% | 0.24%(+2.35)#8 | 0.17%(+2.42)#129 |
| 9. | Sylvania | 2.22% | 0.24%(+1.99)#9 | 0.17%(+2.06)#167 |
| 10. | Boston Heights | 2.17% | 0.24%(+1.94)#10 | 0.17%(+2.01)#172 |
| 11. | Seven Hills | 2.17% | 0.24%(+1.93)#11 | 0.17%(+2.00)#174 |
| 12. | Highland Heights | 2.12% | 0.24%(+1.88)#12 | 0.17%(+1.95)#180 |
| 13. | Roaming Shores | 2.04% | 0.24%(+1.81)#13 | 0.17%(+1.88)#193 |
| 14. | Bloomingdale | 2.02% | 0.24%(+1.78)#14 | 0.17%(+1.86)#196 |
| 15. | Canfield | 2.00% | 0.24%(+1.76)#15 | 0.17%(+1.83)#203 |
| 16. | Rocky River | 1.95% | 0.24%(+1.71)#16 | 0.17%(+1.78)#209 |
| 17. | Brooklyn Heights | 1.93% | 0.24%(+1.70)#17 | 0.17%(+1.77)#215 |
| 18. | Etna | 1.88% | 0.24%(+1.64)#18 | 0.17%(+1.71)#224 |
| 19. | Fruit Hill | 1.88% | 0.24%(+1.64)#19 | 0.17%(+1.71)#225 |
| 20. | Doylestown | 1.87% | 0.24%(+1.63)#20 | 0.17%(+1.70)#227 |
| 21. | Edison | 1.81% | 0.24%(+1.58)#21 | 0.17%(+1.65)#242 |
| 22. | Bay Village | 1.78% | 0.24%(+1.55)#22 | 0.17%(+1.62)#251 |
| 23. | Pepper Pike | 1.77% | 0.24%(+1.53)#23 | 0.17%(+1.61)#254 |
| 24. | South Russell | 1.74% | 0.24%(+1.50)#24 | 0.17%(+1.57)#259 |
| 25. | Blacklick Estates | 1.73% | 0.24%(+1.50)#25 | 0.17%(+1.57)#261 |
| 26. | Caldwell | 1.71% | 0.24%(+1.47)#26 | 0.17%(+1.54)#269 |
| 27. | Harrison | 1.55% | 0.24%(+1.32)#27 | 0.17%(+1.39)#314 |
| 28. | Gates Mills | 1.53% | 0.24%(+1.29)#28 | 0.17%(+1.36)#324 |
| 29. | North Ridgeville | 1.46% | 0.24%(+1.22)#29 | 0.17%(+1.29)#350 |
| 30. | North Olmsted | 1.45% | 0.24%(+1.22)#30 | 0.17%(+1.29)#352 |
| 31. | Glouster | 1.41% | 0.24%(+1.18)#31 | 0.17%(+1.25)#366 |
| 32. | Ashland | 1.40% | 0.24%(+1.17)#32 | 0.17%(+1.24)#368 |
| 33. | Salem Heights | 1.32% | 0.24%(+1.08)#33 | 0.17%(+1.15)#407 |
| 34. | Corwin | 1.31% | 0.24%(+1.07)#34 | 0.17%(+1.14)#411 |
| 35. | Ottawa Hills | 1.13% | 0.24%(+0.894)#35 | 0.17%(+0.964)#501 |
| 36. | Bratenahl | 1.13% | 0.24%(+0.890)#36 | 0.17%(+0.960)#504 |
| 37. | Mack | 1.11% | 0.24%(+0.870)#37 | 0.17%(+0.940)#519 |
| 38. | Yellow Springs | 1.07% | 0.24%(+0.834)#38 | 0.17%(+0.905)#536 |
| 39. | Adena | 1.06% | 0.24%(+0.827)#39 | 0.17%(+0.897)#540 |
| 40. | Groesbeck | 1.05% | 0.24%(+0.815)#40 | 0.17%(+0.885)#548 |
| 41. | Lakewood | 1.03% | 0.24%(+0.798)#41 | 0.17%(+0.868)#556 |
| 42. | Bentleyville | 1.00% | 0.24%(+0.766)#42 | 0.17%(+0.836)#586 |
| 43. | Brook Park | 0.99% | 0.24%(+0.753)#43 | 0.17%(+0.824)#592 |
| 44. | Oregon | 0.95% | 0.24%(+0.719)#44 | 0.17%(+0.790)#620 |
| 45. | Painesville | 0.94% | 0.24%(+0.706)#45 | 0.17%(+0.777)#628 |
| 46. | Dent | 0.93% | 0.24%(+0.699)#46 | 0.17%(+0.769)#636 |
| 47. | Independence | 0.93% | 0.24%(+0.693)#47 | 0.17%(+0.763)#643 |
| 48. | Wadsworth | 0.92% | 0.24%(+0.683)#48 | 0.17%(+0.753)#652 |
| 49. | Middleburg Heights | 0.91% | 0.24%(+0.675)#49 | 0.17%(+0.746)#657 |
| 50. | Lowellville | 0.91% | 0.24%(+0.672)#50 | 0.17%(+0.742)#660 |
| 51. | West Mansfield | 0.91% | 0.24%(+0.672)#51 | 0.17%(+0.742)#663 |
| 52. | Kirtland Hills | 0.88% | 0.24%(+0.649)#52 | 0.17%(+0.720)#690 |
| 53. | Hunting Valley | 0.88% | 0.24%(+0.640)#53 | 0.17%(+0.710)#700 |
| 54. | Turpin Hills | 0.86% | 0.24%(+0.622)#54 | 0.17%(+0.692)#717 |
| 55. | Girard | 0.85% | 0.24%(+0.611)#55 | 0.17%(+0.682)#726 |
| 56. | North Royalton | 0.85% | 0.24%(+0.610)#56 | 0.17%(+0.680)#728 |
| 57. | Brunswick | 0.84% | 0.24%(+0.606)#57 | 0.17%(+0.676)#732 |
| 58. | Tallmadge | 0.83% | 0.24%(+0.590)#58 | 0.17%(+0.660)#747 |
| 59. | Gambier | 0.80% | 0.24%(+0.565)#59 | 0.17%(+0.635)#769 |
| 60. | Devola | 0.79% | 0.24%(+0.551)#60 | 0.17%(+0.622)#789 |
| 61. | Parma | 0.79% | 0.24%(+0.551)#61 | 0.17%(+0.622)#790 |
| 62. | Montrose Ghent | 0.77% | 0.24%(+0.533)#62 | 0.17%(+0.604)#818 |
| 63. | Fairlawn | 0.77% | 0.24%(+0.531)#63 | 0.17%(+0.601)#825 |
| 64. | Strongsville | 0.76% | 0.24%(+0.529)#64 | 0.17%(+0.600)#828 |
| 65. | Forest | 0.76% | 0.24%(+0.521)#65 | 0.17%(+0.591)#838 |
| 66. | Lyndhurst | 0.75% | 0.24%(+0.517)#66 | 0.17%(+0.587)#843 |
| 67. | Kirtland | 0.74% | 0.24%(+0.502)#67 | 0.17%(+0.572)#857 |
| 68. | Solon | 0.74% | 0.24%(+0.500)#68 | 0.17%(+0.571)#862 |
| 69. | Westlake | 0.73% | 0.24%(+0.499)#69 | 0.17%(+0.570)#864 |
| 70. | Woodmere | 0.73% | 0.24%(+0.497)#70 | 0.17%(+0.567)#871 |
| 71. | New Albany | 0.72% | 0.24%(+0.487)#71 | 0.17%(+0.558)#881 |
| 72. | North Zanesville | 0.72% | 0.24%(+0.486)#72 | 0.17%(+0.556)#882 |
| 73. | Norton | 0.72% | 0.24%(+0.486)#73 | 0.17%(+0.556)#883 |
| 74. | Fort Shawnee | 0.72% | 0.24%(+0.486)#74 | 0.17%(+0.556)#885 |
| 75. | Convoy | 0.72% | 0.24%(+0.482)#75 | 0.17%(+0.552)#891 |
| 76. | Munroe Falls | 0.72% | 0.24%(+0.480)#76 | 0.17%(+0.550)#894 |
| 77. | Cleves | 0.71% | 0.24%(+0.471)#77 | 0.17%(+0.542)#901 |
| 78. | Greenville | 0.70% | 0.24%(+0.469)#78 | 0.17%(+0.540)#906 |
| 79. | Rock Creek | 0.69% | 0.24%(+0.458)#79 | 0.17%(+0.528)#923 |
| 80. | Hilliard | 0.69% | 0.24%(+0.451)#80 | 0.17%(+0.522)#935 |
| 81. | West Hill | 0.67% | 0.24%(+0.437)#81 | 0.17%(+0.507)#971 |
| 82. | Harrisville | 0.66% | 0.24%(+0.427)#82 | 0.17%(+0.497)#990 |
| 83. | Brookfield Center | 0.64% | 0.24%(+0.402)#83 | 0.17%(+0.472)#1,028 |
| 84. | Peninsula | 0.63% | 0.24%(+0.396)#84 | 0.17%(+0.467)#1,044 |
| 85. | Brecksville | 0.63% | 0.24%(+0.396)#85 | 0.17%(+0.466)#1,046 |
| 86. | Broadview Heights | 0.62% | 0.24%(+0.385)#86 | 0.17%(+0.456)#1,067 |
| 87. | Barberton | 0.61% | 0.24%(+0.376)#87 | 0.17%(+0.447)#1,076 |
| 88. | Madeira | 0.60% | 0.24%(+0.369)#88 | 0.17%(+0.440)#1,086 |
| 89. | Magnolia | 0.60% | 0.24%(+0.362)#89 | 0.17%(+0.432)#1,096 |
| 90. | Albany | 0.59% | 0.24%(+0.357)#90 | 0.17%(+0.427)#1,107 |
| 91. | South Zanesville | 0.59% | 0.24%(+0.351)#91 | 0.17%(+0.421)#1,120 |
| 92. | Poland | 0.58% | 0.24%(+0.348)#92 | 0.17%(+0.418)#1,127 |
| 93. | Deer Park | 0.57% | 0.24%(+0.339)#93 | 0.17%(+0.409)#1,146 |
| 94. | Dry Run | 0.57% | 0.24%(+0.331)#94 | 0.17%(+0.401)#1,167 |
| 95. | Russells Point | 0.56% | 0.24%(+0.329)#95 | 0.17%(+0.399)#1,172 |
| 96. | Niles | 0.56% | 0.24%(+0.328)#96 | 0.17%(+0.398)#1,177 |
| 97. | Toledo | 0.54% | 0.24%(+0.309)#97 | 0.17%(+0.379)#1,224 |
| 98. | Burlington | 0.54% | 0.24%(+0.304)#98 | 0.17%(+0.374)#1,230 |
| 99. | Perrysburg | 0.54% | 0.24%(+0.304)#99 | 0.17%(+0.374)#1,231 |
| 100. | Mayfield | 0.54% | 0.24%(+0.303)#100 | 0.17%(+0.373)#1,232 |
Common Questions
What are the Top 10 Cities with the Highest Percentage of Lebanese Population in Ohio?
Top 10 Cities with the Highest Percentage of Lebanese Population in Ohio are:
#1
6.38%
#2
4.94%
#3
3.37%
#4
2.96%
#5
2.76%
#6
2.68%
#7
2.58%
#8
2.22%
#9
2.17%
#10
2.17%
What city has the Highest Percentage of Lebanese Population in Ohio?
Antioch has the Highest Percentage of Lebanese Population in Ohio with 6.38%.
What is the Percentage of Lebanese Population in the State of Ohio?
Percentage of Lebanese Population in Ohio is 0.24%.
What is the Percentage of Lebanese Population in the United States?
Percentage of Lebanese Population in the United States is 0.17%.