Cities with the Highest Percentage of Not-for-profit Organizations in Ohio
RELATED REPORTS & OPTIONS
Not-for-profit Organizations
Ohio
Compare Cities
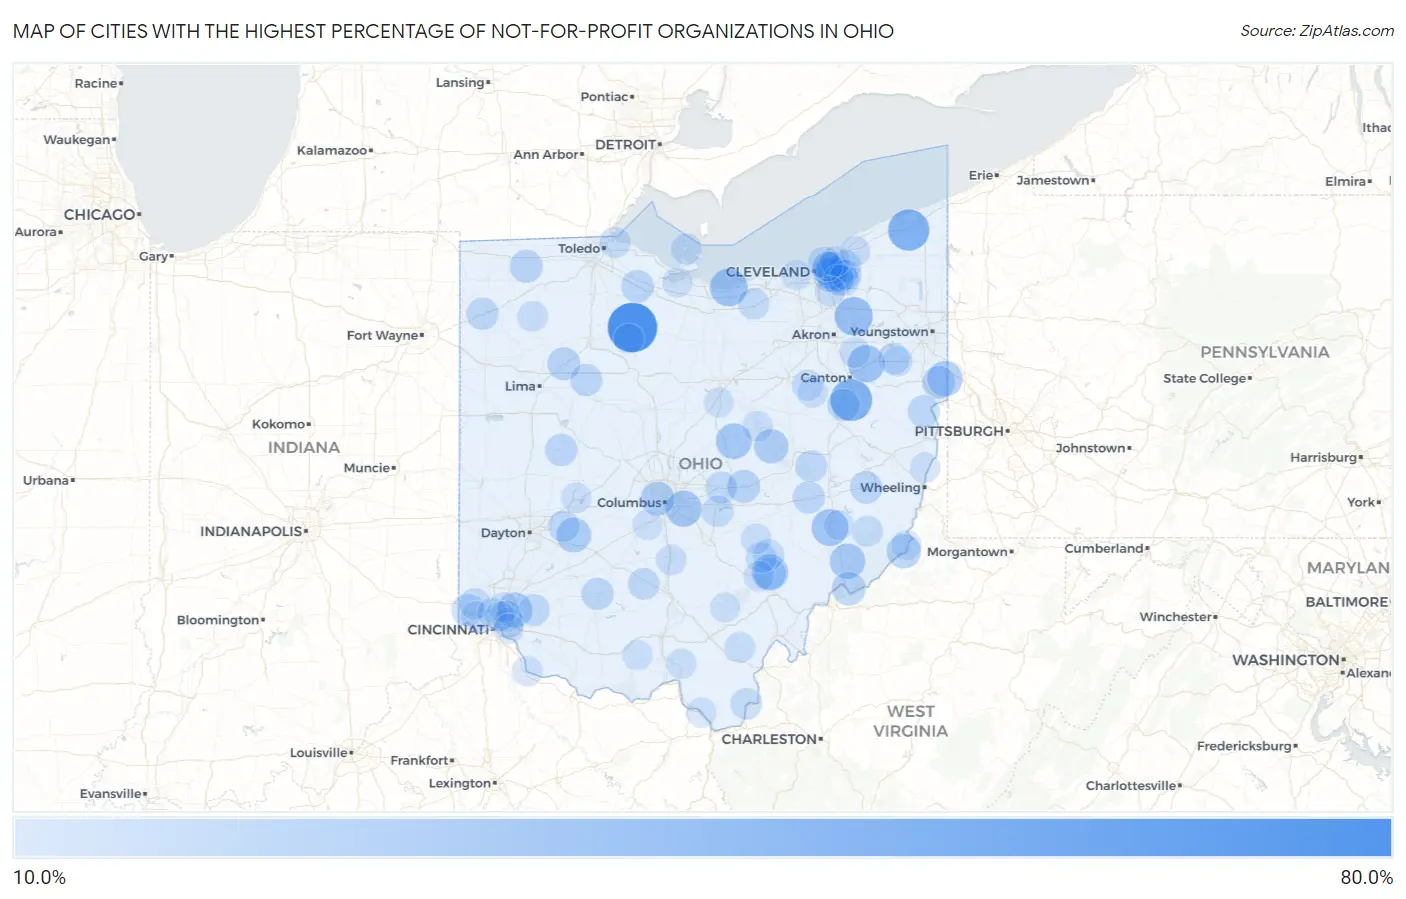
Map of Cities with the Highest Percentage of Not-for-profit Organizations in Ohio
0.0%
80.0%
Cities with the Highest Percentage of Not-for-profit Organizations in Ohio
| City | % Employed in Not-for-profit | vs State | vs National | |
| 1. | Bascom | 71.2% | 9.8%(+61.3)#1 | 8.4%(+62.7)#71 |
| 2. | Sandyville | 48.7% | 9.8%(+38.9)#2 | 8.4%(+40.3)#193 |
| 3. | Austinburg | 47.4% | 9.8%(+37.5)#3 | 8.4%(+38.9)#198 |
| 4. | Sugar Bush Knolls | 38.6% | 9.8%(+28.8)#4 | 8.4%(+30.2)#325 |
| 5. | Ridgewood | 38.2% | 9.8%(+28.4)#5 | 8.4%(+29.8)#332 |
| 6. | Beulah Beach | 36.8% | 9.8%(+27.0)#6 | 8.4%(+28.4)#354 |
| 7. | Harrisburg | 35.2% | 9.8%(+25.4)#7 | 8.4%(+26.8)#386 |
| 8. | Belle Valley | 34.8% | 9.8%(+24.9)#8 | 8.4%(+26.3)#404 |
| 9. | Trimble | 33.1% | 9.8%(+23.3)#9 | 8.4%(+24.7)#467 |
| 10. | Brice | 32.6% | 9.8%(+22.8)#10 | 8.4%(+24.2)#475 |
| 11. | Nashport | 31.9% | 9.8%(+22.0)#11 | 8.4%(+23.4)#503 |
| 12. | Gambier | 31.7% | 9.8%(+21.9)#12 | 8.4%(+23.3)#514 |
| 13. | Lower Salem | 30.8% | 9.8%(+20.9)#13 | 8.4%(+22.3)#545 |
| 14. | Negley | 30.6% | 9.8%(+20.7)#14 | 8.4%(+22.1)#559 |
| 15. | Remington | 29.2% | 9.8%(+19.4)#15 | 8.4%(+20.8)#619 |
| 16. | Cedarville | 28.9% | 9.8%(+19.1)#16 | 8.4%(+20.5)#635 |
| 17. | Nellie | 28.0% | 9.8%(+18.2)#17 | 8.4%(+19.6)#683 |
| 18. | Beachwood | 27.5% | 9.8%(+17.6)#18 | 8.4%(+19.0)#716 |
| 19. | Marble Cliff | 27.2% | 9.8%(+17.3)#19 | 8.4%(+18.8)#733 |
| 20. | Sardis | 27.0% | 9.8%(+17.1)#20 | 8.4%(+18.5)#750 |
| 21. | Shaker Heights | 25.8% | 9.8%(+15.9)#21 | 8.4%(+17.3)#829 |
| 22. | Reno | 25.5% | 9.8%(+15.7)#22 | 8.4%(+17.1)#847 |
| 23. | University Heights | 25.4% | 9.8%(+15.5)#23 | 8.4%(+16.9)#857 |
| 24. | Pepper Pike | 24.6% | 9.8%(+14.7)#24 | 8.4%(+16.1)#934 |
| 25. | Bluffton | 24.5% | 9.8%(+14.7)#25 | 8.4%(+16.1)#941 |
| 26. | Cleveland Heights | 24.4% | 9.8%(+14.6)#26 | 8.4%(+16.0)#949 |
| 27. | Lake Tomahawk | 24.2% | 9.8%(+14.3)#27 | 8.4%(+15.7)#979 |
| 28. | Marne | 24.1% | 9.8%(+14.2)#28 | 8.4%(+15.6)#988 |
| 29. | Pettisville | 24.0% | 9.8%(+14.2)#29 | 8.4%(+15.6)#993 |
| 30. | Jersey | 23.7% | 9.8%(+13.8)#30 | 8.4%(+15.2)#1,026 |
| 31. | Hessville | 22.9% | 9.8%(+13.0)#31 | 8.4%(+14.4)#1,119 |
| 32. | Zoar | 22.8% | 9.8%(+12.9)#32 | 8.4%(+14.3)#1,128 |
| 33. | Gates Mills | 22.5% | 9.8%(+12.6)#33 | 8.4%(+14.0)#1,163 |
| 34. | De Graff | 22.3% | 9.8%(+12.5)#34 | 8.4%(+13.9)#1,177 |
| 35. | Fairview | 22.2% | 9.8%(+12.4)#35 | 8.4%(+13.8)#1,197 |
| 36. | New Concord | 22.1% | 9.8%(+12.2)#36 | 8.4%(+13.6)#1,216 |
| 37. | Highland | 21.9% | 9.8%(+12.1)#37 | 8.4%(+13.5)#1,241 |
| 38. | Cecil | 21.9% | 9.8%(+12.0)#38 | 8.4%(+13.4)#1,245 |
| 39. | Dola | 21.9% | 9.8%(+12.0)#39 | 8.4%(+13.4)#1,246 |
| 40. | Irondale | 21.6% | 9.8%(+11.7)#40 | 8.4%(+13.1)#1,285 |
| 41. | South Euclid | 21.3% | 9.8%(+11.5)#41 | 8.4%(+12.9)#1,327 |
| 42. | Granville | 21.3% | 9.8%(+11.4)#42 | 8.4%(+12.8)#1,329 |
| 43. | New Haven Cdp Hamilton County | 21.3% | 9.8%(+11.4)#43 | 8.4%(+12.8)#1,334 |
| 44. | Blue Jay | 21.1% | 9.8%(+11.2)#44 | 8.4%(+12.6)#1,361 |
| 45. | Plainfield | 21.0% | 9.8%(+11.1)#45 | 8.4%(+12.5)#1,383 |
| 46. | Goshen | 20.9% | 9.8%(+11.0)#46 | 8.4%(+12.4)#1,404 |
| 47. | Bratenahl | 20.7% | 9.8%(+10.8)#47 | 8.4%(+12.2)#1,439 |
| 48. | Jacksonville | 20.7% | 9.8%(+10.8)#48 | 8.4%(+12.2)#1,442 |
| 49. | Bidwell | 20.6% | 9.8%(+10.8)#49 | 8.4%(+12.2)#1,446 |
| 50. | Yellow Springs | 20.6% | 9.8%(+10.7)#50 | 8.4%(+12.1)#1,458 |
| 51. | Frankfort | 20.4% | 9.8%(+10.6)#51 | 8.4%(+12.0)#1,475 |
| 52. | Millersport | 20.3% | 9.8%(+10.4)#52 | 8.4%(+11.8)#1,497 |
| 53. | Oberlin | 20.1% | 9.8%(+10.3)#53 | 8.4%(+11.7)#1,510 |
| 54. | Moreland Hills | 20.0% | 9.8%(+10.2)#54 | 8.4%(+11.6)#1,529 |
| 55. | Beloit | 20.0% | 9.8%(+10.2)#55 | 8.4%(+11.6)#1,532 |
| 56. | Crown City | 20.0% | 9.8%(+10.2)#56 | 8.4%(+11.6)#1,543 |
| 57. | New Baltimore | 19.5% | 9.8%(+9.67)#57 | 8.4%(+11.1)#1,644 |
| 58. | Corning | 19.3% | 9.8%(+9.46)#58 | 8.4%(+10.9)#1,684 |
| 59. | Hemlock | 19.1% | 9.8%(+9.27)#59 | 8.4%(+10.7)#1,733 |
| 60. | Silverton | 19.1% | 9.8%(+9.27)#60 | 8.4%(+10.7)#1,734 |
| 61. | Kidron | 19.1% | 9.8%(+9.26)#61 | 8.4%(+10.7)#1,737 |
| 62. | Harbor View | 19.0% | 9.8%(+9.12)#62 | 8.4%(+10.5)#1,770 |
| 63. | Birmingham | 18.9% | 9.8%(+9.07)#63 | 8.4%(+10.5)#1,778 |
| 64. | Put In Bay | 18.8% | 9.8%(+8.90)#64 | 8.4%(+10.3)#1,821 |
| 65. | Lewisville | 18.6% | 9.8%(+8.76)#65 | 8.4%(+10.2)#1,861 |
| 66. | Orange | 18.3% | 9.8%(+8.46)#66 | 8.4%(+9.86)#1,945 |
| 67. | Hartville | 18.0% | 9.8%(+8.14)#67 | 8.4%(+9.55)#2,048 |
| 68. | Logan Elm Village | 17.9% | 9.8%(+8.00)#68 | 8.4%(+9.41)#2,090 |
| 69. | Vinton | 17.8% | 9.8%(+7.95)#69 | 8.4%(+9.35)#2,102 |
| 70. | New Bavaria | 17.7% | 9.8%(+7.90)#70 | 8.4%(+9.30)#2,116 |
| 71. | Buchtel | 17.6% | 9.8%(+7.71)#71 | 8.4%(+9.11)#2,176 |
| 72. | Mount Eaton | 17.4% | 9.8%(+7.59)#72 | 8.4%(+9.00)#2,215 |
| 73. | Neville | 17.4% | 9.8%(+7.54)#73 | 8.4%(+8.95)#2,240 |
| 74. | New Lexington | 17.4% | 9.8%(+7.54)#74 | 8.4%(+8.94)#2,243 |
| 75. | Mariemont | 17.4% | 9.8%(+7.52)#75 | 8.4%(+8.93)#2,248 |
| 76. | Hunting Valley | 17.4% | 9.8%(+7.51)#76 | 8.4%(+8.92)#2,254 |
| 77. | Gann Brinkhaven | 17.3% | 9.8%(+7.49)#77 | 8.4%(+8.89)#2,262 |
| 78. | Richmond Heights | 17.2% | 9.8%(+7.35)#78 | 8.4%(+8.75)#2,293 |
| 79. | Dent | 17.2% | 9.8%(+7.32)#79 | 8.4%(+8.72)#2,302 |
| 80. | Damascus | 17.1% | 9.8%(+7.27)#80 | 8.4%(+8.67)#2,324 |
| 81. | Connorville | 17.1% | 9.8%(+7.23)#81 | 8.4%(+8.63)#2,341 |
| 82. | Minford | 17.0% | 9.8%(+7.15)#82 | 8.4%(+8.56)#2,363 |
| 83. | Evendale | 17.0% | 9.8%(+7.15)#83 | 8.4%(+8.55)#2,364 |
| 84. | Walton Hills | 16.9% | 9.8%(+7.07)#84 | 8.4%(+8.47)#2,401 |
| 85. | New Riegel | 16.8% | 9.8%(+6.97)#85 | 8.4%(+8.37)#2,428 |
| 86. | Kirtland Hills | 16.8% | 9.8%(+6.93)#86 | 8.4%(+8.33)#2,439 |
| 87. | Northridge | 16.7% | 9.8%(+6.90)#87 | 8.4%(+8.30)#2,445 |
| 88. | Mcarthur | 16.7% | 9.8%(+6.84)#88 | 8.4%(+8.25)#2,456 |
| 89. | Finneytown | 16.7% | 9.8%(+6.84)#89 | 8.4%(+8.24)#2,457 |
| 90. | Whites Landing | 16.7% | 9.8%(+6.82)#90 | 8.4%(+8.22)#2,470 |
| 91. | Orient | 16.7% | 9.8%(+6.82)#91 | 8.4%(+8.22)#2,478 |
| 92. | Rarden | 16.7% | 9.8%(+6.82)#92 | 8.4%(+8.22)#2,483 |
| 93. | Golf Manor | 16.5% | 9.8%(+6.69)#93 | 8.4%(+8.09)#2,545 |
| 94. | Ironton | 16.5% | 9.8%(+6.68)#94 | 8.4%(+8.08)#2,548 |
| 95. | Turpin Hills | 16.4% | 9.8%(+6.55)#95 | 8.4%(+7.95)#2,593 |
| 96. | Hannibal | 16.4% | 9.8%(+6.55)#96 | 8.4%(+7.95)#2,600 |
| 97. | East Cleveland | 16.3% | 9.8%(+6.49)#97 | 8.4%(+7.89)#2,624 |
| 98. | Bellville | 16.3% | 9.8%(+6.45)#98 | 8.4%(+7.85)#2,639 |
| 99. | Sarahsville | 16.3% | 9.8%(+6.43)#99 | 8.4%(+7.83)#2,651 |
| 100. | Rocky River | 16.3% | 9.8%(+6.42)#100 | 8.4%(+7.82)#2,655 |
Common Questions
What are the Top 10 Cities with the Highest Percentage of Not-for-profit Organizations in Ohio?
Top 10 Cities with the Highest Percentage of Not-for-profit Organizations in Ohio are:
#1
71.2%
#2
48.7%
#3
47.4%
#4
38.6%
#5
36.8%
#6
35.2%
#7
34.8%
#8
33.1%
#9
32.6%
#10
31.7%
What city has the Highest Percentage of Not-for-profit Organizations in Ohio?
Bascom has the Highest Percentage of Not-for-profit Organizations in Ohio with 71.2%.
What is the Percentage of Not-for-profit Organizations in the State of Ohio?
Percentage of Not-for-profit Organizations in Ohio is 9.8%.
What is the Percentage of Not-for-profit Organizations in the United States?
Percentage of Not-for-profit Organizations in the United States is 8.4%.