Cities with the Highest Percentage of Immigrants from Ecuador in Ohio
RELATED REPORTS & OPTIONS
Ecuador
Ohio
Compare Cities
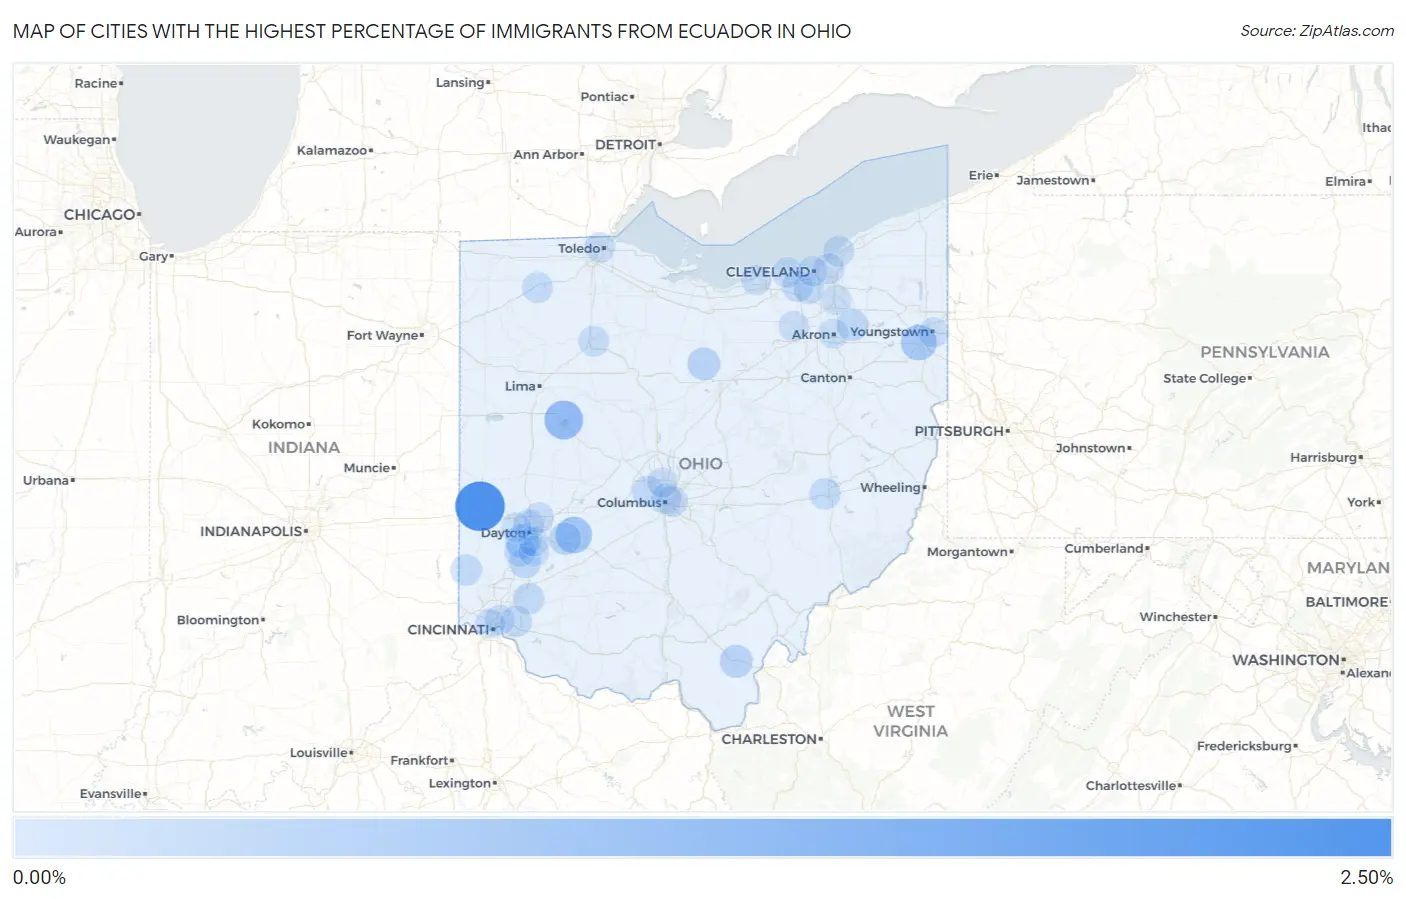
Map of Cities with the Highest Percentage of Immigrants from Ecuador in Ohio
0.00%
2.50%
Cities with the Highest Percentage of Immigrants from Ecuador in Ohio
| City | Ecuador | vs State | vs National | |
| 1. | Castine | 2.48% | 0.016%(+2.46)#-1 | 0.15%(+2.33)#0 |
| 2. | Chippewa Park | 1.08% | 0.016%(+1.06)#0 | 0.15%(+0.932)#1 |
| 3. | Cedarville | 0.79% | 0.016%(+0.776)#1 | 0.15%(+0.647)#2 |
| 4. | Canfield | 0.68% | 0.016%(+0.662)#261 | 0.15%(+0.533)#11,924 |
| 5. | Moraine | 0.51% | 0.016%(+0.493)#262 | 0.15%(+0.364)#11,925 |
| 6. | Rio Grande | 0.35% | 0.016%(+0.334)#263 | 0.15%(+0.205)#11,926 |
| 7. | Shelby | 0.32% | 0.016%(+0.307)#264 | 0.15%(+0.178)#11,927 |
| 8. | Wilberforce | 0.27% | 0.016%(+0.258)#265 | 0.15%(+0.129)#11,928 |
| 9. | Kent | 0.21% | 0.016%(+0.192)#266 | 0.15%(+0.063)#11,929 |
| 10. | Springboro | 0.19% | 0.016%(+0.171)#267 | 0.15%(+0.042)#11,930 |
| 11. | Oxford | 0.16% | 0.016%(+0.147)#289 | 0.15%(+0.018)#12,233 |
| 12. | Miamisburg | 0.16% | 0.016%(+0.145)#290 | 0.15%(+0.016)#12,234 |
| 13. | Maineville | 0.15% | 0.016%(+0.130)#291 | 0.15%(+0.001)#12,235 |
| 14. | Hilliard | 0.14% | 0.016%(+0.128)#292 | 0.15%(-0.001)#12,236 |
| 15. | Terrace Park | 0.14% | 0.016%(+0.123)#293 | 0.15%(-0.006)#12,237 |
| 16. | Cambridge | 0.14% | 0.016%(+0.123)#294 | 0.15%(-0.006)#12,238 |
| 17. | Brook Park | 0.13% | 0.016%(+0.113)#295 | 0.15%(-0.016)#12,239 |
| 18. | Napoleon | 0.11% | 0.016%(+0.096)#296 | 0.15%(-0.033)#12,240 |
| 19. | Parma | 0.11% | 0.016%(+0.095)#297 | 0.15%(-0.034)#12,241 |
| 20. | Willowick | 0.099% | 0.016%(+0.082)#298 | 0.15%(-0.047)#12,242 |
| 21. | Findlay | 0.087% | 0.016%(+0.070)#299 | 0.15%(-0.059)#12,243 |
| 22. | Dayton | 0.077% | 0.016%(+0.061)#300 | 0.15%(-0.068)#12,244 |
| 23. | Bexley | 0.074% | 0.016%(+0.058)#301 | 0.15%(-0.071)#12,245 |
| 24. | Cleveland Heights | 0.073% | 0.016%(+0.057)#302 | 0.15%(-0.072)#12,246 |
| 25. | Columbus | 0.060% | 0.016%(+0.044)#303 | 0.15%(-0.085)#12,247 |
| 26. | Medina | 0.054% | 0.016%(+0.037)#304 | 0.15%(-0.092)#12,248 |
| 27. | Bay Village | 0.050% | 0.016%(+0.034)#305 | 0.15%(-0.095)#12,249 |
| 28. | Huber Heights | 0.042% | 0.016%(+0.025)#306 | 0.15%(-0.103)#12,250 |
| 29. | Lorain | 0.040% | 0.016%(+0.024)#307 | 0.15%(-0.105)#12,251 |
| 30. | Cleveland | 0.040% | 0.016%(+0.023)#308 | 0.15%(-0.106)#12,252 |
| 31. | Centerville | 0.037% | 0.016%(+0.020)#309 | 0.15%(-0.109)#12,253 |
| 32. | Toledo | 0.033% | 0.016%(+0.017)#310 | 0.15%(-0.112)#12,254 |
| 33. | Kettering | 0.033% | 0.016%(+0.017)#311 | 0.15%(-0.112)#12,255 |
| 34. | Norwood | 0.032% | 0.016%(+0.015)#312 | 0.15%(-0.114)#12,256 |
| 35. | Youngstown | 0.030% | 0.016%(+0.014)#313 | 0.15%(-0.115)#12,257 |
| 36. | Worthington | 0.027% | 0.016%(+0.010)#314 | 0.15%(-0.119)#12,258 |
| 37. | Trotwood | 0.013% | 0.016%(-0.003)#315 | 0.15%(-0.132)#12,259 |
| 38. | Macedonia | 0.0082% | 0.016%(-0.008)#316 | 0.15%(-0.137)#12,260 |
| 39. | Cincinnati | 0.0039% | 0.016%(-0.012)#317 | 0.15%(-0.141)#12,261 |
| 40. | Akron | 0.0037% | 0.016%(-0.013)#318 | 0.15%(-0.142)#12,262 |
Common Questions
What are the Top 10 Cities with the Highest Percentage of Immigrants from Ecuador in Ohio?
Top 10 Cities with the Highest Percentage of Immigrants from Ecuador in Ohio are:
#1
2.48%
#2
1.08%
#3
0.79%
#4
0.68%
#5
0.51%
#6
0.35%
#7
0.32%
#8
0.27%
#9
0.21%
#10
0.19%
What city has the Highest Percentage of Immigrants from Ecuador in Ohio?
Castine has the Highest Percentage of Immigrants from Ecuador in Ohio with 2.48%.
What is the Percentage of Immigrants from Ecuador in the State of Ohio?
Percentage of Immigrants from Ecuador in Ohio is 0.016%.
What is the Percentage of Immigrants from Ecuador in the United States?
Percentage of Immigrants from Ecuador in the United States is 0.15%.