Cities with the Highest Percentage of Immigrants from Europe in Ohio
RELATED REPORTS & OPTIONS
Europe
Ohio
Compare Cities
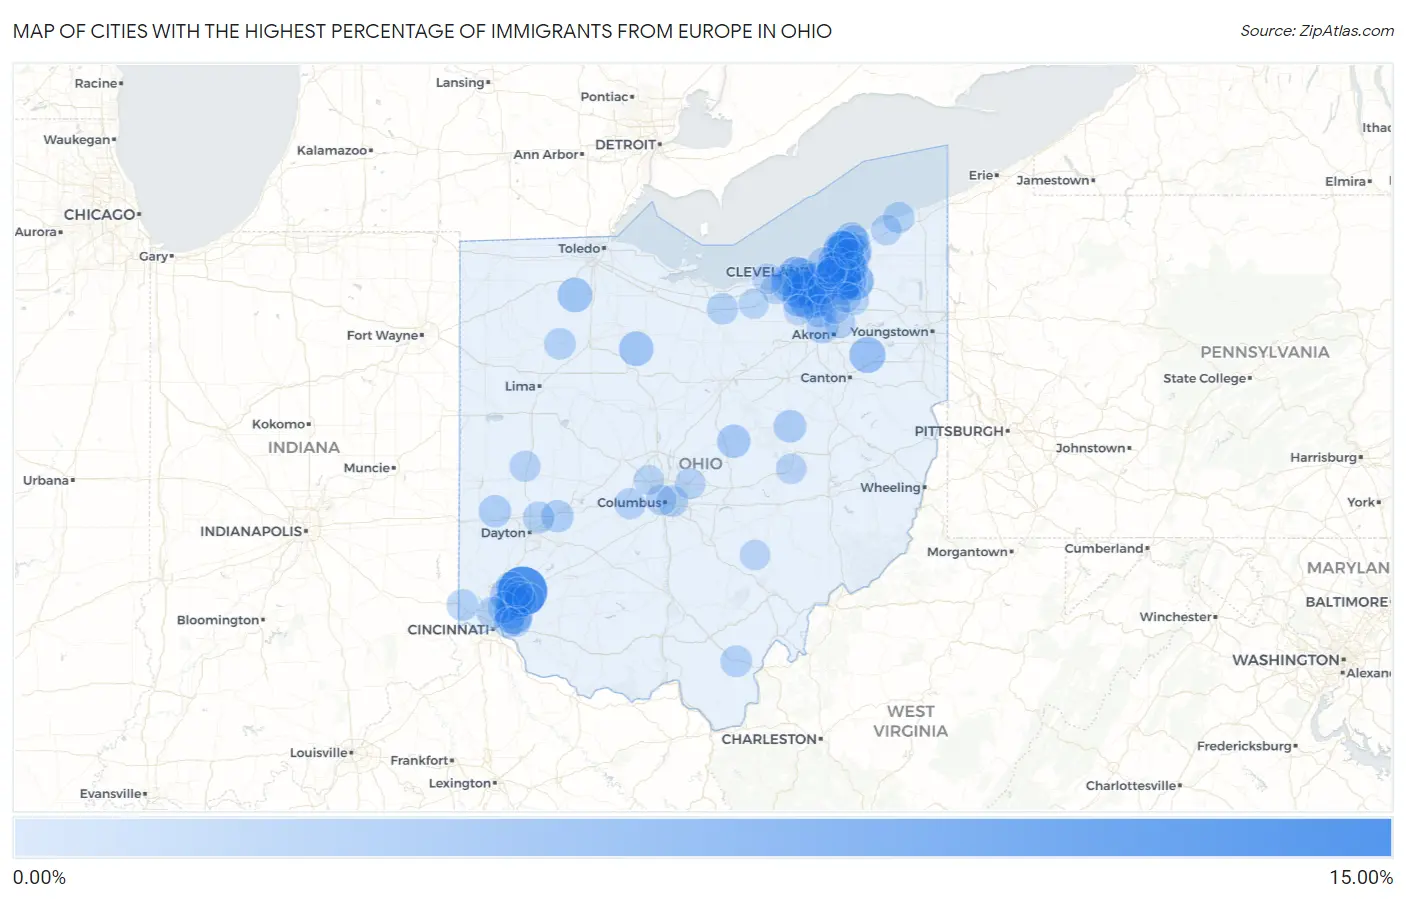
Map of Cities with the Highest Percentage of Immigrants from Europe in Ohio
0.00%
15.00%
Cities with the Highest Percentage of Immigrants from Europe in Ohio
| City | Europe | vs State | vs National | |
| 1. | Kings Mills | 14.15% | 0.85%(+13.3)#1 | 1.46%(+12.7)#99 |
| 2. | Gates Mills | 8.71% | 0.85%(+7.86)#2 | 1.46%(+7.26)#293 |
| 3. | Mayfield Heights | 7.87% | 0.85%(+7.02)#3 | 1.46%(+6.41)#370 |
| 4. | Beachwood | 6.96% | 0.85%(+6.11)#4 | 1.46%(+5.51)#482 |
| 5. | Seven Hills | 6.96% | 0.85%(+6.11)#5 | 1.46%(+5.50)#483 |
| 6. | Bass Lake | 6.89% | 0.85%(+6.04)#6 | 1.46%(+5.43)#494 |
| 7. | The Village Of Indian Hill | 6.59% | 0.85%(+5.74)#7 | 1.46%(+5.14)#543 |
| 8. | South Russell | 6.48% | 0.85%(+5.63)#8 | 1.46%(+5.02)#569 |
| 9. | Moreland Hills | 6.45% | 0.85%(+5.60)#9 | 1.46%(+5.00)#578 |
| 10. | North Royalton | 6.00% | 0.85%(+5.15)#10 | 1.46%(+4.54)#677 |
| 11. | Rocky River | 5.67% | 0.85%(+4.82)#11 | 1.46%(+4.21)#760 |
| 12. | Parma | 5.54% | 0.85%(+4.69)#12 | 1.46%(+4.08)#804 |
| 13. | Mayfield | 5.44% | 0.85%(+4.59)#13 | 1.46%(+3.99)#829 |
| 14. | Marlboro | 5.35% | 0.85%(+4.50)#14 | 1.46%(+3.89)#864 |
| 15. | Parma Heights | 5.08% | 0.85%(+4.23)#15 | 1.46%(+3.62)#941 |
| 16. | Chagrin Falls | 5.08% | 0.85%(+4.23)#16 | 1.46%(+3.62)#945 |
| 17. | Willoughby | 4.82% | 0.85%(+3.97)#17 | 1.46%(+3.37)#1,025 |
| 18. | Broadview Heights | 4.80% | 0.85%(+3.96)#18 | 1.46%(+3.35)#1,034 |
| 19. | Highpoint | 4.68% | 0.85%(+3.83)#19 | 1.46%(+3.22)#1,099 |
| 20. | Middleburg Heights | 4.68% | 0.85%(+3.83)#20 | 1.46%(+3.22)#1,100 |
| 21. | Lakeline | 4.55% | 0.85%(+3.70)#21 | 1.46%(+3.09)#1,168 |
| 22. | Weston | 4.49% | 0.85%(+3.64)#22 | 1.46%(+3.03)#1,189 |
| 23. | Mccutchenville | 4.47% | 0.85%(+3.62)#23 | 1.46%(+3.01)#1,197 |
| 24. | Sixteen Mile Stand | 4.32% | 0.85%(+3.47)#24 | 1.46%(+2.87)#1,265 |
| 25. | Lyndhurst | 4.16% | 0.85%(+3.31)#25 | 1.46%(+2.70)#1,325 |
| 26. | Willoughby Hills | 4.13% | 0.85%(+3.28)#26 | 1.46%(+2.68)#1,342 |
| 27. | Brooklyn | 4.05% | 0.85%(+3.20)#27 | 1.46%(+2.59)#1,382 |
| 28. | Richmond Heights | 3.99% | 0.85%(+3.14)#28 | 1.46%(+2.53)#1,429 |
| 29. | Kirtland | 3.89% | 0.85%(+3.04)#29 | 1.46%(+2.43)#1,483 |
| 30. | Newburgh Heights | 3.86% | 0.85%(+3.01)#30 | 1.46%(+2.41)#1,496 |
| 31. | Kirtland Hills | 3.83% | 0.85%(+2.99)#31 | 1.46%(+2.38)#1,520 |
| 32. | North Lima | 3.81% | 0.85%(+2.96)#32 | 1.46%(+2.36)#1,529 |
| 33. | Strongsville | 3.74% | 0.85%(+2.89)#33 | 1.46%(+2.28)#1,574 |
| 34. | Orange | 3.70% | 0.85%(+2.85)#34 | 1.46%(+2.24)#1,593 |
| 35. | Gambier | 3.70% | 0.85%(+2.85)#35 | 1.46%(+2.24)#1,594 |
| 36. | Pepper Pike | 3.69% | 0.85%(+2.84)#36 | 1.46%(+2.23)#1,602 |
| 37. | Mentor On The Lake | 3.62% | 0.85%(+2.77)#37 | 1.46%(+2.17)#1,655 |
| 38. | North Olmsted | 3.59% | 0.85%(+2.74)#38 | 1.46%(+2.13)#1,689 |
| 39. | Concorde Hills | 3.52% | 0.85%(+2.67)#39 | 1.46%(+2.07)#1,735 |
| 40. | Solon | 3.52% | 0.85%(+2.67)#40 | 1.46%(+2.06)#1,740 |
| 41. | Bentleyville | 3.43% | 0.85%(+2.58)#41 | 1.46%(+1.98)#1,803 |
| 42. | Lake Buckhorn | 3.29% | 0.85%(+2.44)#42 | 1.46%(+1.83)#1,916 |
| 43. | Kingsville | 3.26% | 0.85%(+2.41)#43 | 1.46%(+1.80)#1,953 |
| 44. | Olde West Chester | 3.20% | 0.85%(+2.35)#44 | 1.46%(+1.74)#1,996 |
| 45. | Verona | 3.17% | 0.85%(+2.32)#45 | 1.46%(+1.71)#2,025 |
| 46. | Brecksville | 3.13% | 0.85%(+2.28)#46 | 1.46%(+1.67)#2,063 |
| 47. | Green Meadows | 3.10% | 0.85%(+2.25)#47 | 1.46%(+1.65)#2,089 |
| 48. | Eastlake | 3.09% | 0.85%(+2.24)#48 | 1.46%(+1.63)#2,106 |
| 49. | Richfield | 3.04% | 0.85%(+2.19)#49 | 1.46%(+1.58)#2,153 |
| 50. | Westlake | 3.02% | 0.85%(+2.17)#50 | 1.46%(+1.56)#2,177 |
| 51. | Fairlawn | 2.94% | 0.85%(+2.09)#51 | 1.46%(+1.48)#2,253 |
| 52. | Willowick | 2.91% | 0.85%(+2.06)#52 | 1.46%(+1.45)#2,284 |
| 53. | Loveland Park | 2.91% | 0.85%(+2.06)#53 | 1.46%(+1.45)#2,285 |
| 54. | Reno Beach | 2.84% | 0.85%(+1.99)#54 | 1.46%(+1.39)#2,359 |
| 55. | Mentor | 2.79% | 0.85%(+1.94)#55 | 1.46%(+1.34)#2,421 |
| 56. | Sharon Center | 2.79% | 0.85%(+1.94)#56 | 1.46%(+1.33)#2,430 |
| 57. | Lakewood | 2.75% | 0.85%(+1.90)#57 | 1.46%(+1.29)#2,474 |
| 58. | Oakwood Village Cuyahoga County | 2.70% | 0.85%(+1.85)#58 | 1.46%(+1.25)#2,521 |
| 59. | Huber Heights | 2.70% | 0.85%(+1.85)#59 | 1.46%(+1.24)#2,531 |
| 60. | Rio Grande | 2.69% | 0.85%(+1.84)#60 | 1.46%(+1.23)#2,545 |
| 61. | Harrison | 2.68% | 0.85%(+1.83)#61 | 1.46%(+1.23)#2,552 |
| 62. | Four Bridges | 2.65% | 0.85%(+1.80)#62 | 1.46%(+1.19)#2,599 |
| 63. | Highland Heights | 2.62% | 0.85%(+1.77)#63 | 1.46%(+1.17)#2,635 |
| 64. | Gilboa | 2.61% | 0.85%(+1.76)#64 | 1.46%(+1.15)#2,654 |
| 65. | Timberlake | 2.60% | 0.85%(+1.75)#65 | 1.46%(+1.14)#2,675 |
| 66. | Evendale | 2.59% | 0.85%(+1.74)#66 | 1.46%(+1.14)#2,681 |
| 67. | Finneytown | 2.57% | 0.85%(+1.72)#67 | 1.46%(+1.12)#2,708 |
| 68. | Guilford Lake | 2.51% | 0.85%(+1.66)#68 | 1.46%(+1.05)#2,790 |
| 69. | Bexley | 2.50% | 0.85%(+1.65)#69 | 1.46%(+1.05)#2,800 |
| 70. | Collins | 2.49% | 0.85%(+1.64)#70 | 1.46%(+1.03)#2,827 |
| 71. | Geneva On The Lake | 2.49% | 0.85%(+1.64)#71 | 1.46%(+1.03)#2,828 |
| 72. | Landen | 2.48% | 0.85%(+1.63)#72 | 1.46%(+1.02)#2,845 |
| 73. | Chesterland | 2.45% | 0.85%(+1.60)#73 | 1.46%(+0.991)#2,890 |
| 74. | Silver Lake | 2.40% | 0.85%(+1.55)#74 | 1.46%(+0.948)#2,931 |
| 75. | Lockington | 2.31% | 0.85%(+1.46)#75 | 1.46%(+0.856)#3,076 |
| 76. | Valley View | 2.30% | 0.85%(+1.45)#76 | 1.46%(+0.845)#3,094 |
| 77. | West Jefferson | 2.27% | 0.85%(+1.42)#77 | 1.46%(+0.814)#3,137 |
| 78. | Maineville | 2.24% | 0.85%(+1.39)#78 | 1.46%(+0.780)#3,194 |
| 79. | North Ridgeville | 2.13% | 0.85%(+1.28)#79 | 1.46%(+0.678)#3,357 |
| 80. | Hunting Valley | 2.13% | 0.85%(+1.28)#80 | 1.46%(+0.669)#3,371 |
| 81. | Grandview Heights | 2.12% | 0.85%(+1.27)#81 | 1.46%(+0.663)#3,380 |
| 82. | New Albany | 2.09% | 0.85%(+1.24)#82 | 1.46%(+0.636)#3,433 |
| 83. | Shaker Heights | 2.06% | 0.85%(+1.21)#83 | 1.46%(+0.602)#3,491 |
| 84. | Madison | 2.05% | 0.85%(+1.20)#84 | 1.46%(+0.593)#3,507 |
| 85. | Bratenahl | 2.04% | 0.85%(+1.19)#85 | 1.46%(+0.584)#3,526 |
| 86. | Mariemont | 2.00% | 0.85%(+1.15)#86 | 1.46%(+0.548)#3,604 |
| 87. | Brunswick | 1.98% | 0.85%(+1.13)#87 | 1.46%(+0.524)#3,651 |
| 88. | Sheffield | 1.96% | 0.85%(+1.12)#88 | 1.46%(+0.509)#3,692 |
| 89. | Terrace Park | 1.95% | 0.85%(+1.10)#89 | 1.46%(+0.498)#3,717 |
| 90. | Conesville | 1.95% | 0.85%(+1.10)#90 | 1.46%(+0.495)#3,725 |
| 91. | South Euclid | 1.95% | 0.85%(+1.10)#91 | 1.46%(+0.493)#3,732 |
| 92. | Shawnee | 1.95% | 0.85%(+1.10)#92 | 1.46%(+0.491)#3,735 |
| 93. | Aurora | 1.92% | 0.85%(+1.07)#93 | 1.46%(+0.460)#3,786 |
| 94. | University Heights | 1.90% | 0.85%(+1.05)#94 | 1.46%(+0.442)#3,823 |
| 95. | Boston Heights | 1.85% | 0.85%(+1.00)#95 | 1.46%(+0.396)#3,917 |
| 96. | Reminderville | 1.83% | 0.85%(+0.979)#96 | 1.46%(+0.373)#3,978 |
| 97. | Mason | 1.83% | 0.85%(+0.977)#97 | 1.46%(+0.371)#3,980 |
| 98. | Oberlin | 1.82% | 0.85%(+0.969)#98 | 1.46%(+0.363)#3,997 |
| 99. | Waite Hill | 1.81% | 0.85%(+0.956)#99 | 1.46%(+0.349)#4,023 |
| 100. | Dublin | 1.78% | 0.85%(+0.934)#100 | 1.46%(+0.328)#4,069 |
Common Questions
What are the Top 10 Cities with the Highest Percentage of Immigrants from Europe in Ohio?
Top 10 Cities with the Highest Percentage of Immigrants from Europe in Ohio are:
#1
14.15%
#2
8.71%
#3
7.87%
#4
6.96%
#5
6.96%
#6
6.59%
#7
6.48%
#8
6.45%
#9
6.00%
#10
5.67%
What city has the Highest Percentage of Immigrants from Europe in Ohio?
Kings Mills has the Highest Percentage of Immigrants from Europe in Ohio with 14.15%.
What is the Percentage of Immigrants from Europe in the State of Ohio?
Percentage of Immigrants from Europe in Ohio is 0.85%.
What is the Percentage of Immigrants from Europe in the United States?
Percentage of Immigrants from Europe in the United States is 1.46%.