Cities with the Highest Unemployment Rate in Ohio
RELATED REPORTS & OPTIONS
Highest Unemployment
Ohio
Compare Cities
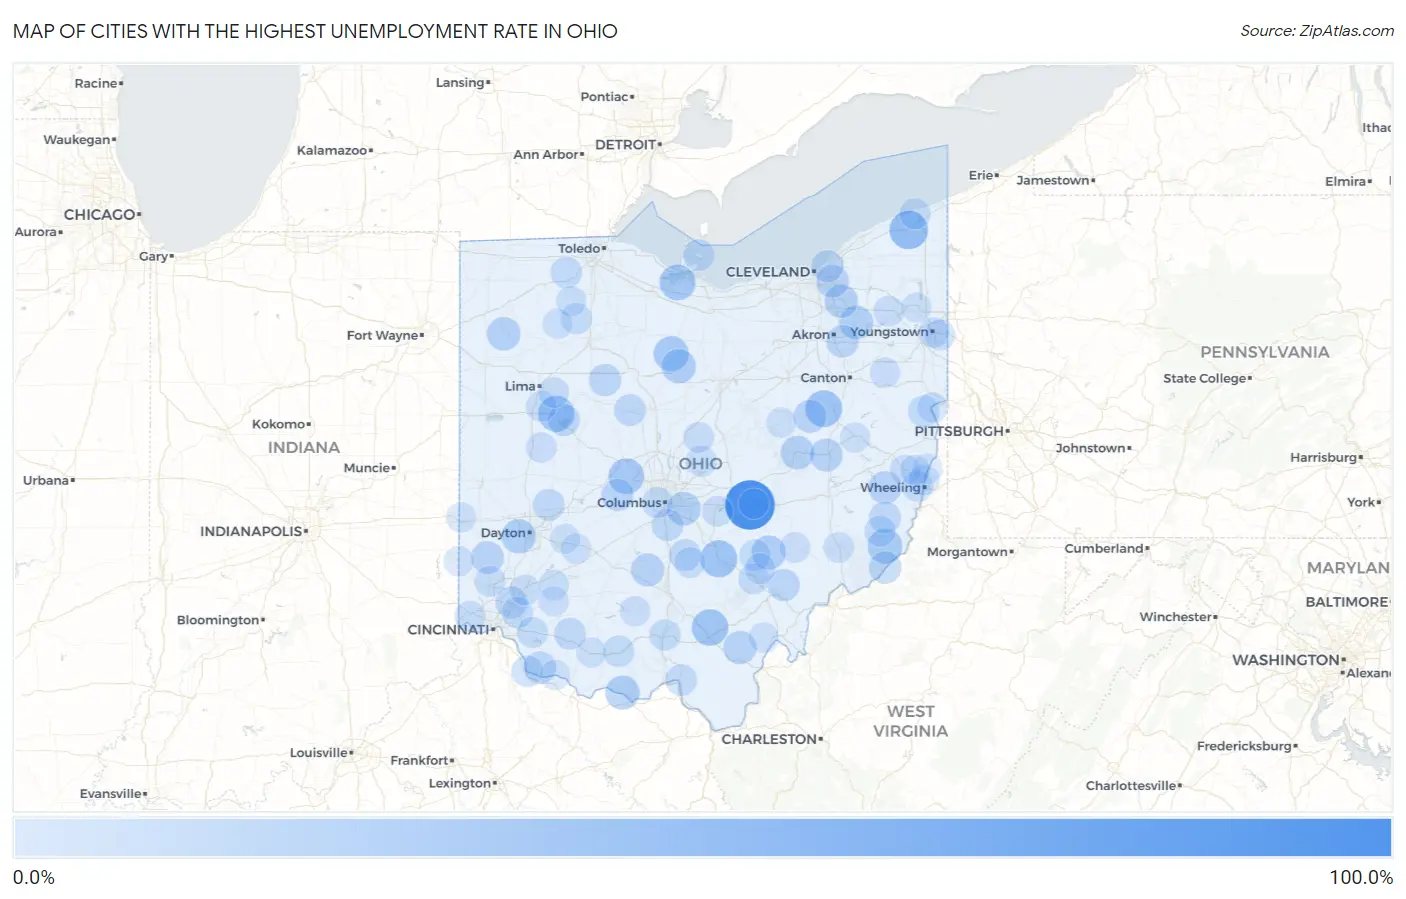
Map of Cities with the Highest Unemployment Rate in Ohio
0.0%
100.0%
Cities with the Highest Unemployment Rate in Ohio
| City | Unemployment Rate | vs State | vs National | |
| 1. | Brownsville | 100.0% | 4.6%(+95.4)#1 | 5.0%(+95.0)#1 |
| 2. | Austinburg | 48.6% | 4.6%(+44.0)#2 | 5.0%(+43.6)#180 |
| 3. | Rockbridge | 41.4% | 4.6%(+36.8)#3 | 5.0%(+36.4)#237 |
| 4. | Dundee | 41.3% | 4.6%(+36.7)#4 | 5.0%(+36.3)#238 |
| 5. | Coalton | 39.6% | 4.6%(+35.0)#5 | 5.0%(+34.6)#268 |
| 6. | New Hampshire | 37.4% | 4.6%(+32.8)#6 | 5.0%(+32.4)#304 |
| 7. | Whites Landing | 36.5% | 4.6%(+31.9)#7 | 5.0%(+31.5)#316 |
| 8. | Unionville Center | 35.5% | 4.6%(+30.9)#8 | 5.0%(+30.5)#345 |
| 9. | Chatfield | 33.3% | 4.6%(+28.7)#9 | 5.0%(+28.3)#394 |
| 10. | Antioch | 31.6% | 4.6%(+27.0)#10 | 5.0%(+26.6)#443 |
| 11. | Sulphur Springs | 29.8% | 4.6%(+25.2)#11 | 5.0%(+24.8)#508 |
| 12. | Drexel | 29.7% | 4.6%(+25.1)#12 | 5.0%(+24.7)#509 |
| 13. | Rendville | 28.6% | 4.6%(+24.0)#13 | 5.0%(+23.6)#561 |
| 14. | Rome Stout | 28.6% | 4.6%(+24.0)#14 | 5.0%(+23.6)#562 |
| 15. | Brady Lake | 27.4% | 4.6%(+22.8)#15 | 5.0%(+22.4)#611 |
| 16. | Brice | 27.4% | 4.6%(+22.8)#16 | 5.0%(+22.4)#616 |
| 17. | Canal Lewisville | 26.0% | 4.6%(+21.4)#17 | 5.0%(+21.0)#688 |
| 18. | Melrose | 25.8% | 4.6%(+21.2)#18 | 5.0%(+20.8)#696 |
| 19. | Twinsburg Heights | 25.5% | 4.6%(+20.9)#19 | 5.0%(+20.5)#708 |
| 20. | Vinton | 25.2% | 4.6%(+20.6)#20 | 5.0%(+20.2)#727 |
| 21. | Clarksburg | 24.5% | 4.6%(+19.9)#21 | 5.0%(+19.5)#785 |
| 22. | Newcomerstown | 24.0% | 4.6%(+19.4)#22 | 5.0%(+19.0)#813 |
| 23. | Morristown | 23.6% | 4.6%(+19.0)#23 | 5.0%(+18.6)#846 |
| 24. | Walnut Creek | 23.5% | 4.6%(+18.9)#24 | 5.0%(+18.5)#848 |
| 25. | West Elkton | 23.3% | 4.6%(+18.7)#25 | 5.0%(+18.3)#868 |
| 26. | North Randall | 22.8% | 4.6%(+18.2)#26 | 5.0%(+17.8)#902 |
| 27. | Sawyerwood | 21.3% | 4.6%(+16.7)#27 | 5.0%(+16.3)#1,037 |
| 28. | Plumwood | 21.1% | 4.6%(+16.5)#28 | 5.0%(+16.1)#1,057 |
| 29. | Patterson | 20.8% | 4.6%(+16.2)#29 | 5.0%(+15.8)#1,084 |
| 30. | Matamoras | 20.4% | 4.6%(+15.8)#30 | 5.0%(+15.4)#1,122 |
| 31. | Amesville | 20.4% | 4.6%(+15.8)#31 | 5.0%(+15.4)#1,129 |
| 32. | Chippewa Park | 19.8% | 4.6%(+15.2)#32 | 5.0%(+14.8)#1,213 |
| 33. | Felicity | 19.8% | 4.6%(+15.2)#33 | 5.0%(+14.8)#1,214 |
| 34. | East Cleveland | 19.6% | 4.6%(+15.0)#34 | 5.0%(+14.6)#1,232 |
| 35. | Brecon | 19.1% | 4.6%(+14.5)#35 | 5.0%(+14.1)#1,315 |
| 36. | New Bloomington | 19.1% | 4.6%(+14.5)#36 | 5.0%(+14.1)#1,318 |
| 37. | Lockbourne | 19.0% | 4.6%(+14.4)#37 | 5.0%(+14.0)#1,335 |
| 38. | New Carlisle | 18.9% | 4.6%(+14.3)#38 | 5.0%(+13.9)#1,345 |
| 39. | Stoutsville | 18.7% | 4.6%(+14.1)#39 | 5.0%(+13.7)#1,380 |
| 40. | Wilson | 18.4% | 4.6%(+13.8)#40 | 5.0%(+13.4)#1,417 |
| 41. | Buford | 18.3% | 4.6%(+13.7)#41 | 5.0%(+13.3)#1,423 |
| 42. | East Alliance | 18.0% | 4.6%(+13.4)#42 | 5.0%(+13.0)#1,481 |
| 43. | Peebles | 17.9% | 4.6%(+13.3)#43 | 5.0%(+12.9)#1,486 |
| 44. | Irondale | 17.9% | 4.6%(+13.3)#44 | 5.0%(+12.9)#1,495 |
| 45. | Neapolis | 17.6% | 4.6%(+13.0)#45 | 5.0%(+12.6)#1,534 |
| 46. | Sciotodale | 16.8% | 4.6%(+12.2)#46 | 5.0%(+11.8)#1,673 |
| 47. | Piketon | 16.7% | 4.6%(+12.1)#47 | 5.0%(+11.7)#1,691 |
| 48. | Kelleys Island | 16.7% | 4.6%(+12.1)#48 | 5.0%(+11.7)#1,707 |
| 49. | Neville | 16.7% | 4.6%(+12.1)#49 | 5.0%(+11.7)#1,716 |
| 50. | Brunersburg | 16.2% | 4.6%(+11.6)#50 | 5.0%(+11.2)#1,796 |
| 51. | Miamiville | 16.2% | 4.6%(+11.6)#51 | 5.0%(+11.2)#1,804 |
| 52. | Hoytville | 16.1% | 4.6%(+11.5)#52 | 5.0%(+11.1)#1,819 |
| 53. | Shawnee | 15.8% | 4.6%(+11.2)#53 | 5.0%(+10.8)#1,883 |
| 54. | Batavia | 15.4% | 4.6%(+10.8)#54 | 5.0%(+10.4)#1,960 |
| 55. | Woodsfield | 15.4% | 4.6%(+10.8)#55 | 5.0%(+10.4)#1,961 |
| 56. | Ashtabula | 15.3% | 4.6%(+10.7)#56 | 5.0%(+10.3)#1,995 |
| 57. | Valleyview | 15.1% | 4.6%(+10.5)#57 | 5.0%(+10.1)#2,048 |
| 58. | New Miami | 15.0% | 4.6%(+10.4)#58 | 5.0%(+10.00)#2,069 |
| 59. | Hartford Croton | 15.0% | 4.6%(+10.4)#59 | 5.0%(+10.00)#2,083 |
| 60. | Nelsonville | 14.9% | 4.6%(+10.3)#60 | 5.0%(+9.90)#2,092 |
| 61. | South Lebanon | 14.7% | 4.6%(+10.1)#61 | 5.0%(+9.70)#2,129 |
| 62. | South Mount Vernon | 14.7% | 4.6%(+10.1)#62 | 5.0%(+9.70)#2,138 |
| 63. | Millersport | 14.6% | 4.6%(+10.00)#63 | 5.0%(+9.60)#2,150 |
| 64. | Tarlton | 14.5% | 4.6%(+9.90)#64 | 5.0%(+9.50)#2,176 |
| 65. | Murray City | 14.4% | 4.6%(+9.80)#65 | 5.0%(+9.40)#2,208 |
| 66. | Uniopolis | 14.4% | 4.6%(+9.80)#66 | 5.0%(+9.40)#2,211 |
| 67. | Wolfhurst | 14.1% | 4.6%(+9.50)#67 | 5.0%(+9.10)#2,280 |
| 68. | Sparta | 14.1% | 4.6%(+9.50)#68 | 5.0%(+9.10)#2,290 |
| 69. | Windham | 13.9% | 4.6%(+9.30)#69 | 5.0%(+8.90)#2,329 |
| 70. | Westminster | 13.9% | 4.6%(+9.30)#70 | 5.0%(+8.90)#2,337 |
| 71. | Campbell | 13.8% | 4.6%(+9.20)#71 | 5.0%(+8.80)#2,354 |
| 72. | Grandview | 13.8% | 4.6%(+9.20)#72 | 5.0%(+8.80)#2,361 |
| 73. | Harrisville | 13.5% | 4.6%(+8.90)#73 | 5.0%(+8.50)#2,458 |
| 74. | Martins Ferry | 13.3% | 4.6%(+8.70)#74 | 5.0%(+8.30)#2,490 |
| 75. | Port Jefferson | 13.2% | 4.6%(+8.60)#75 | 5.0%(+8.20)#2,554 |
| 76. | Wellsville | 12.9% | 4.6%(+8.30)#76 | 5.0%(+7.90)#2,636 |
| 77. | Dexter City | 12.9% | 4.6%(+8.30)#77 | 5.0%(+7.90)#2,661 |
| 78. | Massieville | 12.7% | 4.6%(+8.10)#78 | 5.0%(+7.70)#2,729 |
| 79. | Malta | 12.7% | 4.6%(+8.10)#79 | 5.0%(+7.70)#2,730 |
| 80. | Gratiot | 12.6% | 4.6%(+8.00)#80 | 5.0%(+7.60)#2,776 |
| 81. | Fort Mckinley | 12.5% | 4.6%(+7.90)#81 | 5.0%(+7.50)#2,781 |
| 82. | Youngstown | 12.3% | 4.6%(+7.70)#82 | 5.0%(+7.30)#2,879 |
| 83. | Homeworth | 12.3% | 4.6%(+7.70)#83 | 5.0%(+7.30)#2,913 |
| 84. | Milton Center | 12.3% | 4.6%(+7.70)#84 | 5.0%(+7.30)#2,922 |
| 85. | Bainbridge | 12.2% | 4.6%(+7.60)#85 | 5.0%(+7.20)#2,953 |
| 86. | Clarksville | 12.2% | 4.6%(+7.60)#86 | 5.0%(+7.20)#2,954 |
| 87. | Dennison | 12.1% | 4.6%(+7.50)#87 | 5.0%(+7.10)#2,980 |
| 88. | Killbuck | 12.1% | 4.6%(+7.50)#88 | 5.0%(+7.10)#2,990 |
| 89. | Rayland | 12.1% | 4.6%(+7.50)#89 | 5.0%(+7.10)#3,000 |
| 90. | Belmore | 12.1% | 4.6%(+7.50)#90 | 5.0%(+7.10)#3,006 |
| 91. | Blanchester | 12.0% | 4.6%(+7.40)#91 | 5.0%(+7.00)#3,017 |
| 92. | Shawnee Hills | 12.0% | 4.6%(+7.40)#92 | 5.0%(+7.00)#3,021 |
| 93. | Mount Pleasant | 12.0% | 4.6%(+7.40)#93 | 5.0%(+7.00)#3,047 |
| 94. | College Corner | 11.9% | 4.6%(+7.30)#94 | 5.0%(+6.90)#3,089 |
| 95. | New Paris | 11.6% | 4.6%(+7.00)#95 | 5.0%(+6.60)#3,211 |
| 96. | Higginsport | 11.6% | 4.6%(+7.00)#96 | 5.0%(+6.60)#3,230 |
| 97. | Morgandale | 11.5% | 4.6%(+6.90)#97 | 5.0%(+6.50)#3,260 |
| 98. | Rutland | 11.5% | 4.6%(+6.90)#98 | 5.0%(+6.50)#3,263 |
| 99. | Wilberforce | 11.4% | 4.6%(+6.80)#99 | 5.0%(+6.40)#3,308 |
| 100. | Winchester | 11.4% | 4.6%(+6.80)#100 | 5.0%(+6.40)#3,312 |
Common Questions
What are the Top 10 Cities with the Highest Unemployment Rate in Ohio?
Top 10 Cities with the Highest Unemployment Rate in Ohio are:
#1
100.0%
#2
48.6%
#3
41.4%
#4
41.3%
#5
39.6%
#6
37.4%
#7
36.5%
#8
35.5%
#9
33.3%
#10
31.6%
What city has the Highest Unemployment Rate in Ohio?
Brownsville has the Highest Unemployment Rate in Ohio with 100.0%.
What is the Unemployment Rate in the State of Ohio?
Unemployment Rate in Ohio is 4.6%.
What is the Unemployment Rate in the United States?
Unemployment Rate in the United States is 5.0%.