Cities with the Largest Burmese Community in Ohio
RELATED REPORTS & OPTIONS
Burmese
Ohio
Compare Cities
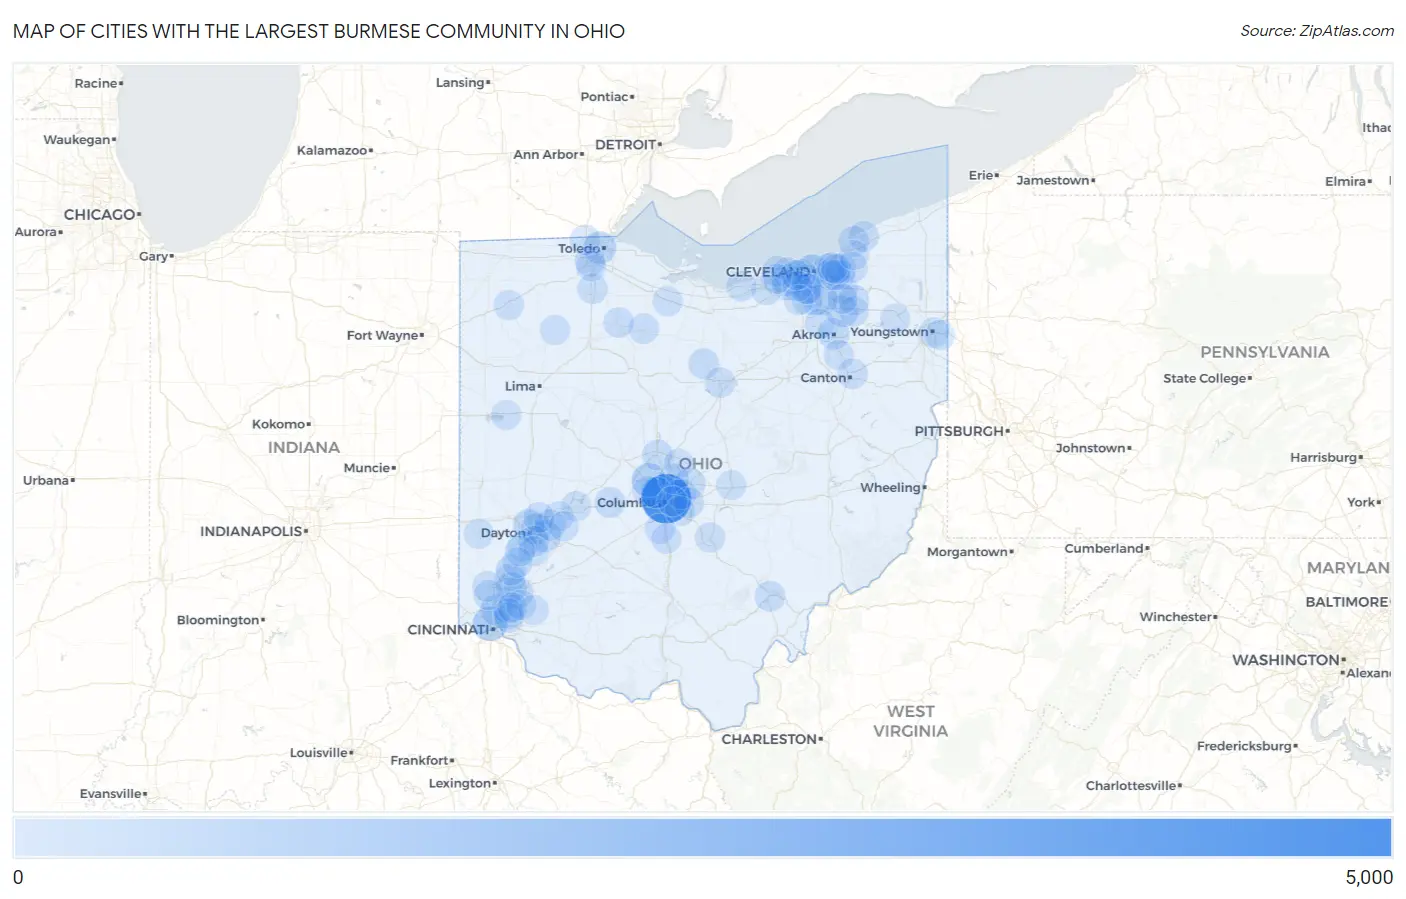
Map of Cities with the Largest Burmese Community in Ohio
0
5,000
Cities with the Largest Burmese Community in Ohio
| City | Burmese | vs State | vs National | |
| 1. | Columbus | 4,280 | 26,343(16.25%)#1 | 1,977,441(0.22%)#40 |
| 2. | Cincinnati | 979 | 26,343(3.72%)#2 | 1,977,441(0.05%)#312 |
| 3. | Dublin | 850 | 26,343(3.23%)#3 | 1,977,441(0.04%)#357 |
| 4. | Cleveland | 790 | 26,343(3.00%)#4 | 1,977,441(0.04%)#380 |
| 5. | Toledo | 514 | 26,343(1.95%)#5 | 1,977,441(0.03%)#565 |
| 6. | Westlake | 430 | 26,343(1.63%)#6 | 1,977,441(0.02%)#675 |
| 7. | Beavercreek | 401 | 26,343(1.52%)#7 | 1,977,441(0.02%)#723 |
| 8. | Hudson | 396 | 26,343(1.50%)#8 | 1,977,441(0.02%)#731 |
| 9. | Dayton | 368 | 26,343(1.40%)#9 | 1,977,441(0.02%)#790 |
| 10. | Mason | 356 | 26,343(1.35%)#10 | 1,977,441(0.02%)#818 |
| 11. | Upper Arlington | 339 | 26,343(1.29%)#11 | 1,977,441(0.02%)#858 |
| 12. | Akron | 306 | 26,343(1.16%)#12 | 1,977,441(0.02%)#940 |
| 13. | Riverside | 287 | 26,343(1.09%)#13 | 1,977,441(0.01%)#993 |
| 14. | Cleveland Heights | 285 | 26,343(1.08%)#14 | 1,977,441(0.01%)#999 |
| 15. | Wyoming | 285 | 26,343(1.08%)#15 | 1,977,441(0.01%)#1,000 |
| 16. | Blue Ash | 283 | 26,343(1.07%)#16 | 1,977,441(0.01%)#1,008 |
| 17. | New Albany | 232 | 26,343(0.88%)#17 | 1,977,441(0.01%)#1,170 |
| 18. | Fairborn | 228 | 26,343(0.87%)#18 | 1,977,441(0.01%)#1,185 |
| 19. | Monroe | 206 | 26,343(0.78%)#19 | 1,977,441(0.01%)#1,271 |
| 20. | Brooklyn | 204 | 26,343(0.77%)#20 | 1,977,441(0.01%)#1,278 |
| 21. | Four Bridges | 202 | 26,343(0.77%)#21 | 1,977,441(0.01%)#1,284 |
| 22. | Choctaw Lake | 188 | 26,343(0.71%)#22 | 1,977,441(0.01%)#1,351 |
| 23. | Kettering | 184 | 26,343(0.70%)#23 | 1,977,441(0.01%)#1,369 |
| 24. | Middletown | 180 | 26,343(0.68%)#24 | 1,977,441(0.01%)#1,394 |
| 25. | Shelby | 173 | 26,343(0.66%)#25 | 1,977,441(0.01%)#1,435 |
| 26. | Delaware | 172 | 26,343(0.65%)#26 | 1,977,441(0.01%)#1,440 |
| 27. | Solon | 161 | 26,343(0.61%)#27 | 1,977,441(0.01%)#1,505 |
| 28. | Avon Lake | 160 | 26,343(0.61%)#28 | 1,977,441(0.01%)#1,516 |
| 29. | Mentor | 155 | 26,343(0.59%)#29 | 1,977,441(0.01%)#1,542 |
| 30. | Athens | 155 | 26,343(0.59%)#30 | 1,977,441(0.01%)#1,546 |
| 31. | Hilliard | 145 | 26,343(0.55%)#31 | 1,977,441(0.01%)#1,612 |
| 32. | Painesville | 143 | 26,343(0.54%)#32 | 1,977,441(0.01%)#1,635 |
| 33. | Gahanna | 142 | 26,343(0.54%)#33 | 1,977,441(0.01%)#1,641 |
| 34. | Reynoldsburg | 134 | 26,343(0.51%)#34 | 1,977,441(0.01%)#1,700 |
| 35. | Canton | 128 | 26,343(0.49%)#35 | 1,977,441(0.01%)#1,748 |
| 36. | Huber Heights | 128 | 26,343(0.49%)#36 | 1,977,441(0.01%)#1,750 |
| 37. | Brecksville | 126 | 26,343(0.48%)#37 | 1,977,441(0.01%)#1,773 |
| 38. | Tiffin | 121 | 26,343(0.46%)#38 | 1,977,441(0.01%)#1,809 |
| 39. | North Olmsted | 119 | 26,343(0.45%)#39 | 1,977,441(0.01%)#1,821 |
| 40. | North Royalton | 119 | 26,343(0.45%)#40 | 1,977,441(0.01%)#1,822 |
| 41. | Westerville | 118 | 26,343(0.45%)#41 | 1,977,441(0.01%)#1,839 |
| 42. | Aurora | 115 | 26,343(0.44%)#42 | 1,977,441(0.01%)#1,874 |
| 43. | Mansfield | 114 | 26,343(0.43%)#43 | 1,977,441(0.01%)#1,884 |
| 44. | Broadview Heights | 113 | 26,343(0.43%)#44 | 1,977,441(0.01%)#1,894 |
| 45. | Shaker Heights | 110 | 26,343(0.42%)#45 | 1,977,441(0.01%)#1,924 |
| 46. | Parma | 105 | 26,343(0.40%)#46 | 1,977,441(0.01%)#1,989 |
| 47. | Fostoria | 105 | 26,343(0.40%)#47 | 1,977,441(0.01%)#1,993 |
| 48. | Chesterland | 99 | 26,343(0.38%)#48 | 1,977,441(0.01%)#2,077 |
| 49. | Hamilton | 98 | 26,343(0.37%)#49 | 1,977,441(0.00%)#2,081 |
| 50. | Pepper Pike | 96 | 26,343(0.36%)#50 | 1,977,441(0.00%)#2,118 |
| 51. | Parma Heights | 95 | 26,343(0.36%)#51 | 1,977,441(0.00%)#2,134 |
| 52. | Vermilion | 91 | 26,343(0.35%)#52 | 1,977,441(0.00%)#2,188 |
| 53. | Streetsboro | 90 | 26,343(0.34%)#53 | 1,977,441(0.00%)#2,198 |
| 54. | Maumee | 90 | 26,343(0.34%)#54 | 1,977,441(0.00%)#2,200 |
| 55. | Bowling Green | 89 | 26,343(0.34%)#55 | 1,977,441(0.00%)#2,208 |
| 56. | Bay Village | 87 | 26,343(0.33%)#56 | 1,977,441(0.00%)#2,240 |
| 57. | Commercial Point | 87 | 26,343(0.33%)#57 | 1,977,441(0.00%)#2,248 |
| 58. | Springfield | 85 | 26,343(0.32%)#58 | 1,977,441(0.00%)#2,263 |
| 59. | Fairfield | 83 | 26,343(0.32%)#59 | 1,977,441(0.00%)#2,303 |
| 60. | Lakewood | 82 | 26,343(0.31%)#60 | 1,977,441(0.00%)#2,317 |
| 61. | Mayfield Heights | 82 | 26,343(0.31%)#61 | 1,977,441(0.00%)#2,320 |
| 62. | Sylvania | 82 | 26,343(0.31%)#62 | 1,977,441(0.00%)#2,321 |
| 63. | Kenwood | 81 | 26,343(0.31%)#63 | 1,977,441(0.00%)#2,341 |
| 64. | Beachwood | 80 | 26,343(0.30%)#64 | 1,977,441(0.00%)#2,362 |
| 65. | Elyria | 79 | 26,343(0.30%)#65 | 1,977,441(0.00%)#2,372 |
| 66. | South Euclid | 78 | 26,343(0.30%)#66 | 1,977,441(0.00%)#2,392 |
| 67. | Lyndhurst | 78 | 26,343(0.30%)#67 | 1,977,441(0.00%)#2,399 |
| 68. | Newton Falls | 74 | 26,343(0.28%)#68 | 1,977,441(0.00%)#2,474 |
| 69. | Brook Park | 71 | 26,343(0.27%)#69 | 1,977,441(0.00%)#2,526 |
| 70. | West Carrollton | 71 | 26,343(0.27%)#70 | 1,977,441(0.00%)#2,529 |
| 71. | Madeira | 65 | 26,343(0.25%)#71 | 1,977,441(0.00%)#2,660 |
| 72. | Kirtland | 65 | 26,343(0.25%)#72 | 1,977,441(0.00%)#2,663 |
| 73. | Newark | 64 | 26,343(0.24%)#73 | 1,977,441(0.00%)#2,665 |
| 74. | Youngstown | 62 | 26,343(0.24%)#74 | 1,977,441(0.00%)#2,705 |
| 75. | Centerville | 62 | 26,343(0.24%)#75 | 1,977,441(0.00%)#2,715 |
| 76. | Defiance | 61 | 26,343(0.23%)#76 | 1,977,441(0.00%)#2,738 |
| 77. | Clyde | 61 | 26,343(0.23%)#77 | 1,977,441(0.00%)#2,744 |
| 78. | Franklin | 58 | 26,343(0.22%)#78 | 1,977,441(0.00%)#2,817 |
| 79. | Campbell | 58 | 26,343(0.22%)#79 | 1,977,441(0.00%)#2,821 |
| 80. | Leipsic | 56 | 26,343(0.21%)#80 | 1,977,441(0.00%)#2,878 |
| 81. | Eaton | 55 | 26,343(0.21%)#81 | 1,977,441(0.00%)#2,899 |
| 82. | Strongsville | 54 | 26,343(0.20%)#82 | 1,977,441(0.00%)#2,909 |
| 83. | Twinsburg | 54 | 26,343(0.20%)#83 | 1,977,441(0.00%)#2,920 |
| 84. | Goshen | 54 | 26,343(0.20%)#84 | 1,977,441(0.00%)#2,940 |
| 85. | Green | 53 | 26,343(0.20%)#85 | 1,977,441(0.00%)#2,944 |
| 86. | Perrysburg | 53 | 26,343(0.20%)#86 | 1,977,441(0.00%)#2,946 |
| 87. | Avon | 53 | 26,343(0.20%)#87 | 1,977,441(0.00%)#2,947 |
| 88. | St Marys | 53 | 26,343(0.20%)#88 | 1,977,441(0.00%)#2,960 |
| 89. | Lancaster | 52 | 26,343(0.20%)#89 | 1,977,441(0.00%)#2,975 |
| 90. | Loveland | 52 | 26,343(0.20%)#90 | 1,977,441(0.00%)#2,986 |
| 91. | Blacklick Estates | 52 | 26,343(0.20%)#91 | 1,977,441(0.00%)#2,996 |
| 92. | Enon | 52 | 26,343(0.20%)#92 | 1,977,441(0.00%)#3,012 |
| 93. | South Bloomfield | 50 | 26,343(0.19%)#93 | 1,977,441(0.00%)#3,065 |
| 94. | Galena | 47 | 26,343(0.18%)#94 | 1,977,441(0.00%)#3,159 |
| 95. | Bexley | 46 | 26,343(0.17%)#95 | 1,977,441(0.00%)#3,170 |
| 96. | Montgomery | 46 | 26,343(0.17%)#96 | 1,977,441(0.00%)#3,174 |
| 97. | Miamisburg | 44 | 26,343(0.17%)#97 | 1,977,441(0.00%)#3,226 |
| 98. | Yellow Springs | 44 | 26,343(0.17%)#98 | 1,977,441(0.00%)#3,248 |
| 99. | Rocky River | 43 | 26,343(0.16%)#99 | 1,977,441(0.00%)#3,261 |
| 100. | Montrose Ghent | 42 | 26,343(0.16%)#100 | 1,977,441(0.00%)#3,314 |
Common Questions
What are the Top 10 Cities with the Largest Burmese Community in Ohio?
Top 10 Cities with the Largest Burmese Community in Ohio are:
#1
4,280
#2
979
#3
850
#4
790
#5
514
#6
430
#7
401
#8
396
#9
368
#10
356
What city has the Largest Burmese Community in Ohio?
Columbus has the Largest Burmese Community in Ohio with 4,280.
What is the Total Burmese Population in the State of Ohio?
Total Burmese Population in Ohio is 26,343.
What is the Total Burmese Population in the United States?
Total Burmese Population in the United States is 1,977,441.