Cities with the Highest Percentage of Hawaiian / Pacific Population in Ohio
RELATED REPORTS & OPTIONS
Hawaiian / Pacific
Ohio
Compare Cities
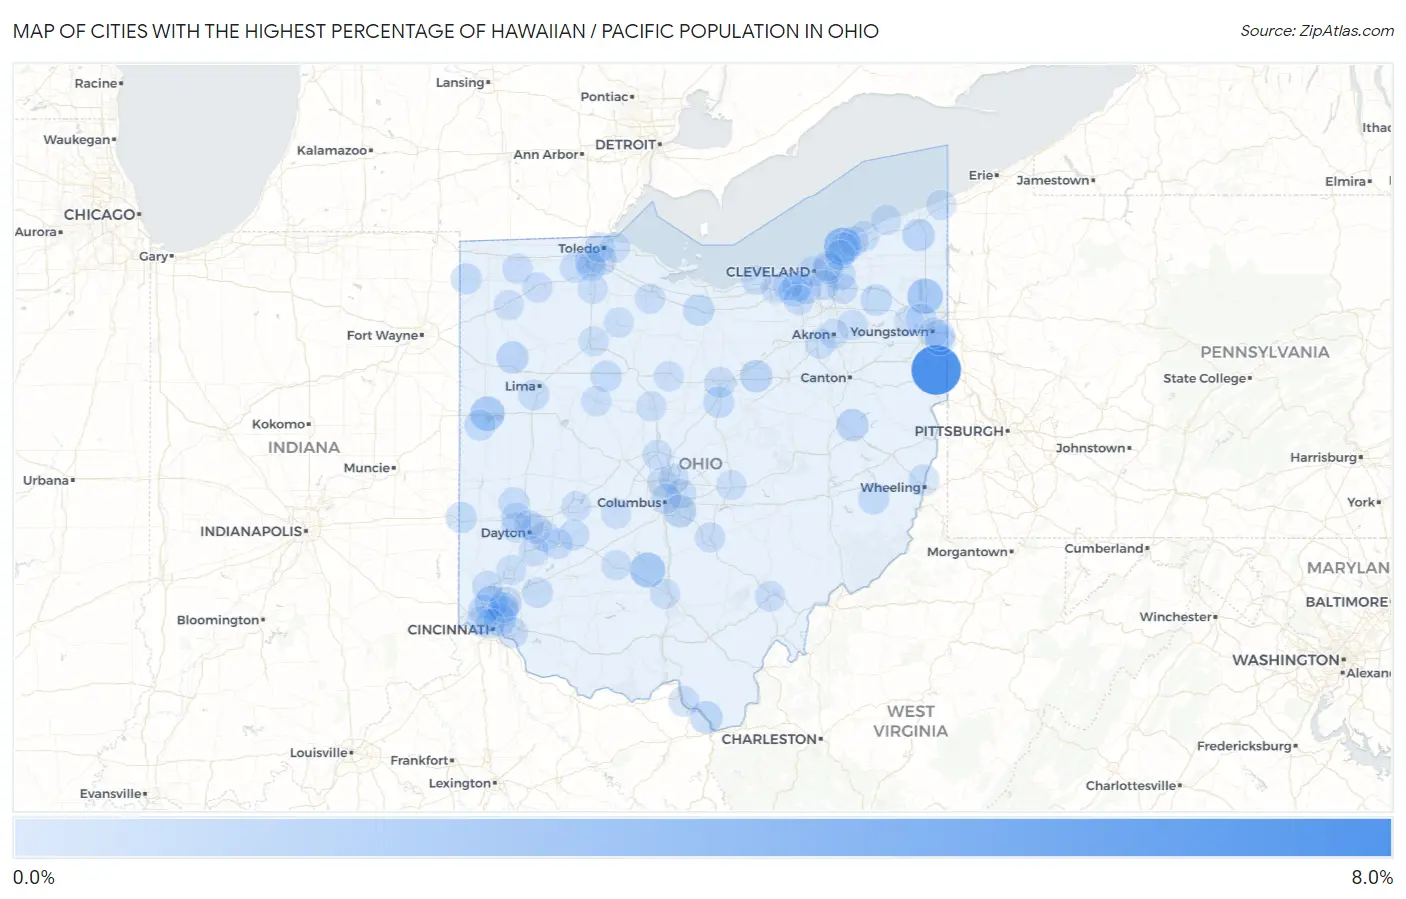
Map of Cities with the Highest Percentage of Hawaiian / Pacific Population in Ohio
0.0%
8.0%
Cities with the Highest Percentage of Hawaiian / Pacific Population in Ohio
| City | Hawaiian / Pacific | vs State | vs National | |
| 1. | New Waterford | 7.9% | 0.034%(+7.88)#1 | 0.19%(+7.73)#124 |
| 2. | Timberlake | 2.9% | 0.034%(+2.87)#2 | 0.19%(+2.71)#319 |
| 3. | Cortland | 2.1% | 0.034%(+2.02)#3 | 0.19%(+1.86)#420 |
| 4. | Clarksburg | 1.9% | 0.034%(+1.91)#4 | 0.19%(+1.76)#442 |
| 5. | Celina | 1.8% | 0.034%(+1.74)#5 | 0.19%(+1.59)#485 |
| 6. | Forest Park | 1.2% | 0.034%(+1.14)#6 | 0.19%(+0.981)#662 |
| 7. | Coal Grove | 0.98% | 0.034%(+0.943)#7 | 0.19%(+0.788)#752 |
| 8. | Blacklick Estates | 0.94% | 0.034%(+0.909)#8 | 0.19%(+0.755)#775 |
| 9. | Jeromesville | 0.93% | 0.034%(+0.900)#9 | 0.19%(+0.746)#782 |
| 10. | Roswell | 0.92% | 0.034%(+0.887)#10 | 0.19%(+0.733)#792 |
| 11. | Jefferson | 0.90% | 0.034%(+0.870)#11 | 0.19%(+0.715)#804 |
| 12. | Ottoville | 0.82% | 0.034%(+0.785)#12 | 0.19%(+0.631)#871 |
| 13. | Norwood | 0.71% | 0.034%(+0.676)#13 | 0.19%(+0.521)#983 |
| 14. | Hiram | 0.55% | 0.034%(+0.520)#14 | 0.19%(+0.365)#1,169 |
| 15. | Monroeville | 0.50% | 0.034%(+0.470)#15 | 0.19%(+0.316)#1,242 |
| 16. | Oakwood Village Paulding County | 0.50% | 0.034%(+0.463)#16 | 0.19%(+0.309)#1,253 |
| 17. | Coldwater | 0.44% | 0.034%(+0.409)#17 | 0.19%(+0.255)#1,355 |
| 18. | New Paris | 0.42% | 0.034%(+0.382)#18 | 0.19%(+0.227)#1,402 |
| 19. | Forest | 0.41% | 0.034%(+0.378)#19 | 0.19%(+0.224)#1,411 |
| 20. | Barnesville | 0.40% | 0.034%(+0.370)#20 | 0.19%(+0.215)#1,431 |
| 21. | Bellville | 0.40% | 0.034%(+0.367)#21 | 0.19%(+0.212)#1,440 |
| 22. | Berea | 0.37% | 0.034%(+0.332)#22 | 0.19%(+0.178)#1,536 |
| 23. | Edgerton | 0.35% | 0.034%(+0.314)#23 | 0.19%(+0.160)#1,588 |
| 24. | Martins Ferry | 0.32% | 0.034%(+0.284)#24 | 0.19%(+0.130)#1,666 |
| 25. | Mansfield | 0.31% | 0.034%(+0.281)#25 | 0.19%(+0.126)#1,676 |
| 26. | Reading | 0.31% | 0.034%(+0.279)#26 | 0.19%(+0.125)#1,679 |
| 27. | Pepper Pike | 0.31% | 0.034%(+0.276)#27 | 0.19%(+0.121)#1,693 |
| 28. | Sharonville | 0.31% | 0.034%(+0.272)#28 | 0.19%(+0.118)#1,707 |
| 29. | Forestville | 0.29% | 0.034%(+0.255)#29 | 0.19%(+0.100)#1,766 |
| 30. | Struthers | 0.29% | 0.034%(+0.254)#30 | 0.19%(+0.100)#1,771 |
| 31. | Rossford | 0.29% | 0.034%(+0.251)#31 | 0.19%(+0.096)#1,784 |
| 32. | Franklin Furnace | 0.26% | 0.034%(+0.229)#32 | 0.19%(+0.075)#1,873 |
| 33. | Evendale | 0.26% | 0.034%(+0.229)#33 | 0.19%(+0.074)#1,876 |
| 34. | Morrow | 0.26% | 0.034%(+0.222)#34 | 0.19%(+0.068)#1,901 |
| 35. | Cedarville | 0.26% | 0.034%(+0.221)#35 | 0.19%(+0.067)#1,904 |
| 36. | Groesbeck | 0.24% | 0.034%(+0.204)#36 | 0.19%(+0.050)#1,976 |
| 37. | Fort Shawnee | 0.24% | 0.034%(+0.201)#37 | 0.19%(+0.046)#1,988 |
| 38. | Hamilton | 0.23% | 0.034%(+0.198)#38 | 0.19%(+0.044)#1,997 |
| 39. | West Milton | 0.21% | 0.034%(+0.178)#39 | 0.19%(+0.023)#2,080 |
| 40. | Xenia | 0.20% | 0.034%(+0.162)#40 | 0.19%(+0.007)#2,151 |
| 41. | Whitehouse | 0.19% | 0.034%(+0.154)#41 | 0.19%(-0.000)#2,185 |
| 42. | Painesville | 0.18% | 0.034%(+0.147)#42 | 0.19%(-0.007)#2,222 |
| 43. | Cheviot | 0.17% | 0.034%(+0.138)#43 | 0.19%(-0.016)#2,263 |
| 44. | Solon | 0.17% | 0.034%(+0.136)#44 | 0.19%(-0.018)#2,277 |
| 45. | Parma Heights | 0.16% | 0.034%(+0.125)#45 | 0.19%(-0.029)#2,347 |
| 46. | Archbold | 0.16% | 0.034%(+0.123)#46 | 0.19%(-0.031)#2,357 |
| 47. | Brook Park | 0.15% | 0.034%(+0.117)#47 | 0.19%(-0.037)#2,395 |
| 48. | Maumee | 0.14% | 0.034%(+0.110)#48 | 0.19%(-0.044)#2,433 |
| 49. | Beavercreek | 0.14% | 0.034%(+0.103)#49 | 0.19%(-0.051)#2,482 |
| 50. | Campbell | 0.13% | 0.034%(+0.094)#50 | 0.19%(-0.061)#2,540 |
| 51. | Niles | 0.12% | 0.034%(+0.087)#51 | 0.19%(-0.067)#2,584 |
| 52. | Lancaster | 0.12% | 0.034%(+0.081)#52 | 0.19%(-0.073)#2,631 |
| 53. | Ballville | 0.11% | 0.034%(+0.076)#53 | 0.19%(-0.079)#2,674 |
| 54. | Perrysburg | 0.10% | 0.034%(+0.070)#54 | 0.19%(-0.084)#2,701 |
| 55. | Cleveland Heights | 0.10% | 0.034%(+0.070)#55 | 0.19%(-0.084)#2,703 |
| 56. | Trotwood | 0.10% | 0.034%(+0.069)#56 | 0.19%(-0.085)#2,708 |
| 57. | Napoleon | 0.10% | 0.034%(+0.067)#57 | 0.19%(-0.087)#2,730 |
| 58. | Worthington | 0.093% | 0.034%(+0.059)#58 | 0.19%(-0.095)#2,795 |
| 59. | Athens | 0.084% | 0.034%(+0.049)#59 | 0.19%(-0.105)#2,872 |
| 60. | Centerville | 0.078% | 0.034%(+0.043)#60 | 0.19%(-0.111)#2,922 |
| 61. | Westerville | 0.077% | 0.034%(+0.043)#61 | 0.19%(-0.112)#2,924 |
| 62. | Marion | 0.072% | 0.034%(+0.038)#62 | 0.19%(-0.116)#2,966 |
| 63. | North Madison | 0.072% | 0.034%(+0.038)#63 | 0.19%(-0.117)#2,969 |
| 64. | Riverside | 0.069% | 0.034%(+0.035)#64 | 0.19%(-0.119)#2,997 |
| 65. | Norton | 0.069% | 0.034%(+0.034)#65 | 0.19%(-0.120)#3,007 |
| 66. | Springfield | 0.067% | 0.034%(+0.032)#66 | 0.19%(-0.122)#3,032 |
| 67. | Kenton | 0.065% | 0.034%(+0.031)#67 | 0.19%(-0.124)#3,044 |
| 68. | Washington Court House | 0.063% | 0.034%(+0.028)#68 | 0.19%(-0.126)#3,070 |
| 69. | North Olmsted | 0.062% | 0.034%(+0.028)#69 | 0.19%(-0.127)#3,076 |
| 70. | Gahanna | 0.062% | 0.034%(+0.028)#70 | 0.19%(-0.127)#3,078 |
| 71. | Toledo | 0.061% | 0.034%(+0.026)#71 | 0.19%(-0.128)#3,093 |
| 72. | Lordstown | 0.060% | 0.034%(+0.026)#72 | 0.19%(-0.129)#3,096 |
| 73. | Oregon | 0.055% | 0.034%(+0.021)#73 | 0.19%(-0.133)#3,153 |
| 74. | Chillicothe | 0.055% | 0.034%(+0.020)#74 | 0.19%(-0.134)#3,159 |
| 75. | Fostoria | 0.054% | 0.034%(+0.020)#75 | 0.19%(-0.134)#3,163 |
| 76. | Delaware | 0.050% | 0.034%(+0.016)#76 | 0.19%(-0.139)#3,202 |
| 77. | Conneaut | 0.048% | 0.034%(+0.014)#77 | 0.19%(-0.140)#3,221 |
| 78. | Mentor | 0.047% | 0.034%(+0.012)#78 | 0.19%(-0.142)#3,243 |
| 79. | Cleveland | 0.046% | 0.034%(+0.012)#79 | 0.19%(-0.142)#3,246 |
| 80. | Newark | 0.046% | 0.034%(+0.012)#80 | 0.19%(-0.143)#3,254 |
| 81. | East Cleveland | 0.043% | 0.034%(+0.009)#81 | 0.19%(-0.146)#3,285 |
| 82. | Englewood | 0.037% | 0.034%(+0.003)#82 | 0.19%(-0.152)#3,353 |
| 83. | Defiance | 0.036% | 0.034%(+0.001)#83 | 0.19%(-0.153)#3,371 |
| 84. | North Ridgeville | 0.034% | 0.034%(-0.000)#84 | 0.19%(-0.155)#3,394 |
| 85. | Findlay | 0.032% | 0.034%(-0.002)#85 | 0.19%(-0.157)#3,417 |
| 86. | Bowling Green | 0.027% | 0.034%(-0.008)#86 | 0.19%(-0.162)#3,496 |
| 87. | Bucyrus | 0.026% | 0.034%(-0.009)#87 | 0.19%(-0.163)#3,508 |
| 88. | Columbus | 0.026% | 0.034%(-0.009)#88 | 0.19%(-0.163)#3,512 |
| 89. | Eastlake | 0.023% | 0.034%(-0.012)#89 | 0.19%(-0.166)#3,550 |
| 90. | Cincinnati | 0.020% | 0.034%(-0.015)#90 | 0.19%(-0.169)#3,592 |
| 91. | London | 0.019% | 0.034%(-0.015)#91 | 0.19%(-0.169)#3,601 |
| 92. | Dayton | 0.019% | 0.034%(-0.015)#92 | 0.19%(-0.170)#3,607 |
| 93. | Kent | 0.018% | 0.034%(-0.016)#93 | 0.19%(-0.170)#3,618 |
| 94. | Middletown | 0.018% | 0.034%(-0.016)#94 | 0.19%(-0.171)#3,624 |
| 95. | Garfield Heights | 0.017% | 0.034%(-0.017)#95 | 0.19%(-0.172)#3,632 |
| 96. | Lorain | 0.017% | 0.034%(-0.017)#96 | 0.19%(-0.172)#3,634 |
| 97. | Wickliffe | 0.016% | 0.034%(-0.018)#97 | 0.19%(-0.173)#3,645 |
| 98. | Strongsville | 0.011% | 0.034%(-0.023)#98 | 0.19%(-0.178)#3,707 |
| 99. | Akron | 0.0095% | 0.034%(-0.025)#99 | 0.19%(-0.179)#3,722 |
| 100. | Youngstown | 0.0067% | 0.034%(-0.028)#100 | 0.19%(-0.182)#3,754 |
Common Questions
What are the Top 10 Cities with the Highest Percentage of Hawaiian / Pacific Population in Ohio?
Top 10 Cities with the Highest Percentage of Hawaiian / Pacific Population in Ohio are:
#1
7.9%
#2
2.9%
#3
2.1%
#4
1.9%
#5
1.8%
#6
1.2%
#7
0.98%
#8
0.94%
#9
0.93%
#10
0.92%
What city has the Highest Percentage of Hawaiian / Pacific Population in Ohio?
New Waterford has the Highest Percentage of Hawaiian / Pacific Population in Ohio with 7.9%.
What is the Percentage of Hawaiian / Pacific Population in the State of Ohio?
Percentage of Hawaiian / Pacific Population in Ohio is 0.034%.
What is the Percentage of Hawaiian / Pacific Population in the United States?
Percentage of Hawaiian / Pacific Population in the United States is 0.19%.