Cities with the Highest Percentage of Population Employed in Management in Ohio
RELATED REPORTS & OPTIONS
Management
Ohio
Compare Cities
Map of Cities with the Highest Percentage of Population Employed in Management in Ohio
0.0%
60.0%
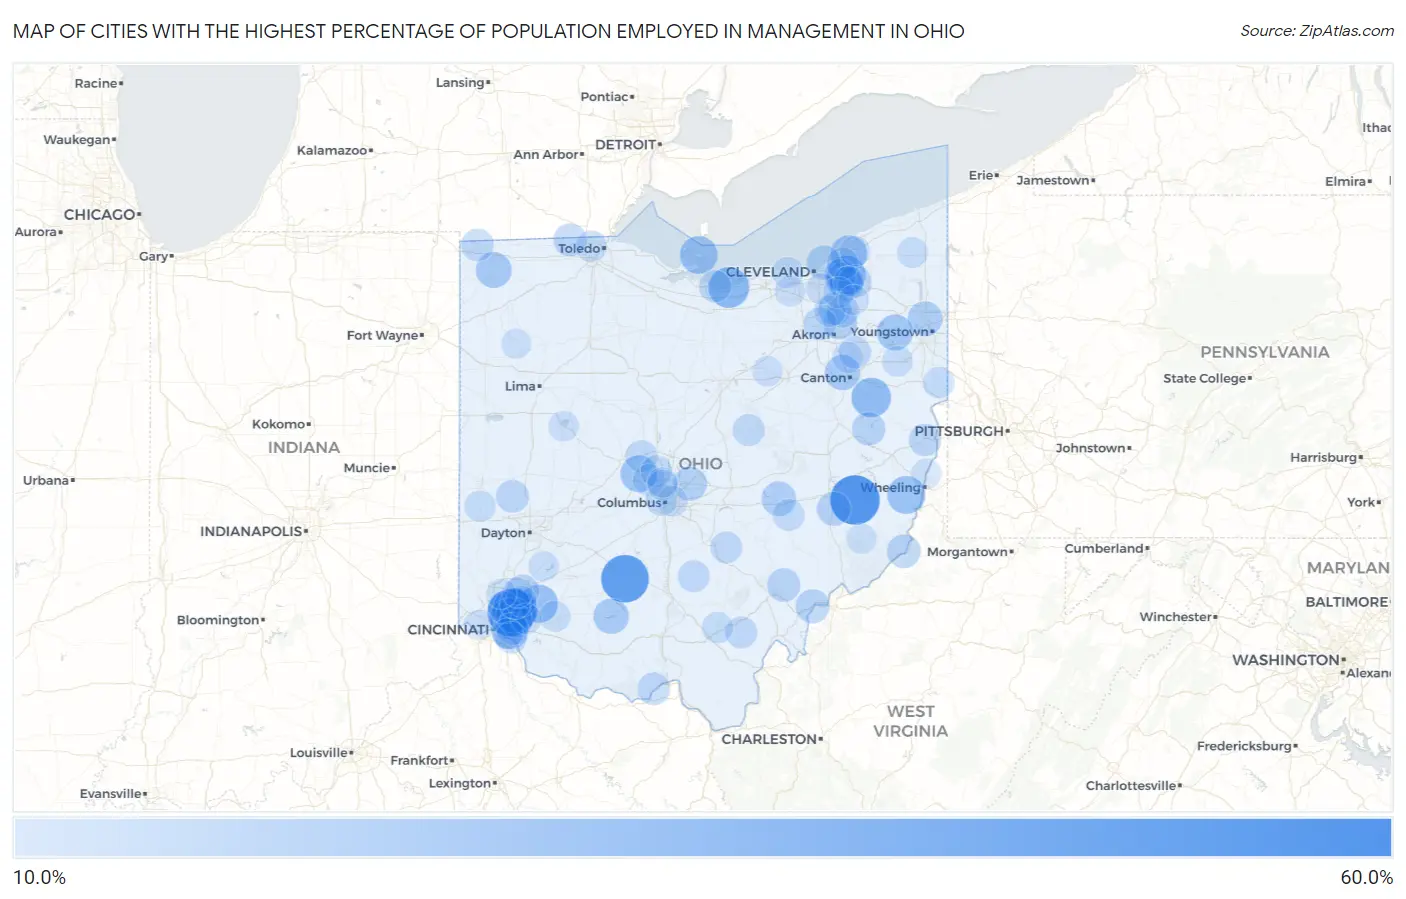
Cities with the Highest Percentage of Population Employed in Management in Ohio
| City | % Employed | vs State | vs National | |
| 1. | Jacksontown | 55.4% | 10.5%(+44.9)#1 | 11.0%(+44.4)#187 |
| 2. | Salesville | 53.1% | 10.5%(+42.6)#2 | 11.0%(+42.1)#210 |
| 3. | Concorde Hills | 49.5% | 10.5%(+39.0)#3 | 11.0%(+38.5)#265 |
| 4. | Good Hope | 49.4% | 10.5%(+38.9)#4 | 11.0%(+38.4)#266 |
| 5. | Remington | 43.6% | 10.5%(+33.0)#5 | 11.0%(+32.5)#355 |
| 6. | Bass Lake | 41.3% | 10.5%(+30.8)#6 | 11.0%(+30.3)#406 |
| 7. | Beulah Beach | 36.8% | 10.5%(+26.3)#7 | 11.0%(+25.8)#529 |
| 8. | Lake Mohawk | 34.5% | 10.5%(+24.0)#8 | 11.0%(+23.5)#636 |
| 9. | Hunting Valley | 33.2% | 10.5%(+22.7)#9 | 11.0%(+22.2)#707 |
| 10. | Pleasant Plain | 32.0% | 10.5%(+21.5)#10 | 11.0%(+21.0)#768 |
| 11. | Madeira | 31.7% | 10.5%(+21.2)#11 | 11.0%(+20.7)#787 |
| 12. | Glencoe | 31.7% | 10.5%(+21.2)#12 | 11.0%(+20.6)#793 |
| 13. | Kelleys Island | 31.3% | 10.5%(+20.8)#13 | 11.0%(+20.3)#809 |
| 14. | Waite Hill | 29.6% | 10.5%(+19.1)#14 | 11.0%(+18.6)#927 |
| 15. | New California | 29.5% | 10.5%(+19.0)#15 | 11.0%(+18.5)#937 |
| 16. | Sherwood | 28.4% | 10.5%(+17.9)#16 | 11.0%(+17.4)#1,048 |
| 17. | Lake Milton | 28.2% | 10.5%(+17.7)#17 | 11.0%(+17.2)#1,065 |
| 18. | Pulaski | 27.9% | 10.5%(+17.4)#18 | 11.0%(+16.9)#1,099 |
| 19. | Highland Holiday | 27.2% | 10.5%(+16.7)#19 | 11.0%(+16.2)#1,168 |
| 20. | The Village Of Indian Hill | 27.1% | 10.5%(+16.6)#20 | 11.0%(+16.1)#1,175 |
| 21. | Hills And Dales | 27.1% | 10.5%(+16.6)#21 | 11.0%(+16.1)#1,180 |
| 22. | Moreland Hills | 26.2% | 10.5%(+15.7)#22 | 11.0%(+15.2)#1,310 |
| 23. | Mckinley Heights | 26.1% | 10.5%(+15.6)#23 | 11.0%(+15.1)#1,329 |
| 24. | North Zanesville | 25.6% | 10.5%(+15.1)#24 | 11.0%(+14.6)#1,407 |
| 25. | Saybrook-On-The-Lake | 25.5% | 10.5%(+15.0)#25 | 11.0%(+14.5)#1,431 |
| 26. | Bratenahl | 24.7% | 10.5%(+14.2)#26 | 11.0%(+13.7)#1,565 |
| 27. | New Albany | 24.7% | 10.5%(+14.1)#27 | 11.0%(+13.6)#1,578 |
| 28. | Silver Lake | 24.5% | 10.5%(+14.0)#28 | 11.0%(+13.5)#1,600 |
| 29. | Little Hocking | 24.4% | 10.5%(+13.9)#29 | 11.0%(+13.4)#1,617 |
| 30. | Buffalo | 24.4% | 10.5%(+13.9)#30 | 11.0%(+13.4)#1,621 |
| 31. | Bentleyville | 24.2% | 10.5%(+13.7)#31 | 11.0%(+13.2)#1,671 |
| 32. | Brandt | 24.1% | 10.5%(+13.6)#32 | 11.0%(+13.1)#1,689 |
| 33. | Kings Mills | 23.7% | 10.5%(+13.1)#33 | 11.0%(+12.6)#1,778 |
| 34. | Sardis | 23.6% | 10.5%(+13.1)#34 | 11.0%(+12.6)#1,793 |
| 35. | Amesville | 23.5% | 10.5%(+13.0)#35 | 11.0%(+12.5)#1,805 |
| 36. | Leesville | 23.4% | 10.5%(+12.9)#36 | 11.0%(+12.4)#1,827 |
| 37. | South Russell | 22.6% | 10.5%(+12.1)#37 | 11.0%(+11.6)#1,995 |
| 38. | Berkey | 22.6% | 10.5%(+12.1)#38 | 11.0%(+11.6)#2,001 |
| 39. | Boston Heights | 22.6% | 10.5%(+12.0)#39 | 11.0%(+11.5)#2,012 |
| 40. | Ludlow Falls | 22.5% | 10.5%(+12.0)#40 | 11.0%(+11.5)#2,024 |
| 41. | Hudson | 22.4% | 10.5%(+11.9)#41 | 11.0%(+11.4)#2,038 |
| 42. | Montrose Ghent | 22.3% | 10.5%(+11.8)#42 | 11.0%(+11.3)#2,059 |
| 43. | Friendship | 22.3% | 10.5%(+11.8)#43 | 11.0%(+11.3)#2,060 |
| 44. | Middlebranch | 22.0% | 10.5%(+11.5)#44 | 11.0%(+11.0)#2,136 |
| 45. | Lake Seneca | 21.9% | 10.5%(+11.4)#45 | 11.0%(+10.9)#2,162 |
| 46. | Nashport | 21.9% | 10.5%(+11.4)#46 | 11.0%(+10.9)#2,169 |
| 47. | Wintersville | 21.9% | 10.5%(+11.3)#47 | 11.0%(+10.8)#2,173 |
| 48. | Terrace Park | 21.8% | 10.5%(+11.3)#48 | 11.0%(+10.8)#2,190 |
| 49. | Hartville | 21.5% | 10.5%(+11.0)#49 | 11.0%(+10.5)#2,257 |
| 50. | Huron | 21.3% | 10.5%(+10.8)#50 | 11.0%(+10.3)#2,328 |
| 51. | Danville | 21.2% | 10.5%(+10.7)#51 | 11.0%(+10.2)#2,356 |
| 52. | Pepper Pike | 21.2% | 10.5%(+10.7)#52 | 11.0%(+10.2)#2,357 |
| 53. | Bidwell | 21.1% | 10.5%(+10.5)#53 | 11.0%(+10.0)#2,400 |
| 54. | Wilkesville | 21.1% | 10.5%(+10.5)#54 | 11.0%(+10.0)#2,404 |
| 55. | Ostrander | 21.0% | 10.5%(+10.5)#55 | 11.0%(+10.0)#2,410 |
| 56. | Mayfield | 21.0% | 10.5%(+10.5)#56 | 11.0%(+10.0)#2,413 |
| 57. | Dry Run | 21.0% | 10.5%(+10.5)#57 | 11.0%(+9.96)#2,432 |
| 58. | Evendale | 20.8% | 10.5%(+10.3)#58 | 11.0%(+9.80)#2,481 |
| 59. | Adelphi | 20.8% | 10.5%(+10.3)#59 | 11.0%(+9.79)#2,485 |
| 60. | Hide A Way Hills | 20.7% | 10.5%(+10.2)#60 | 11.0%(+9.72)#2,502 |
| 61. | Duncan Falls | 20.6% | 10.5%(+10.1)#61 | 11.0%(+9.61)#2,544 |
| 62. | Coldstream | 20.6% | 10.5%(+10.1)#62 | 11.0%(+9.55)#2,556 |
| 63. | Dublin | 20.5% | 10.5%(+9.97)#63 | 11.0%(+9.46)#2,584 |
| 64. | Powell | 20.4% | 10.5%(+9.90)#64 | 11.0%(+9.40)#2,604 |
| 65. | Grandview Heights | 20.1% | 10.5%(+9.54)#65 | 11.0%(+9.04)#2,717 |
| 66. | Peninsula | 20.1% | 10.5%(+9.54)#66 | 11.0%(+9.04)#2,718 |
| 67. | Nankin | 20.0% | 10.5%(+9.49)#67 | 11.0%(+8.98)#2,727 |
| 68. | Castine | 20.0% | 10.5%(+9.49)#68 | 11.0%(+8.98)#2,754 |
| 69. | Bay Village | 20.0% | 10.5%(+9.45)#69 | 11.0%(+8.94)#2,787 |
| 70. | Lake Tomahawk | 19.8% | 10.5%(+9.27)#70 | 11.0%(+8.76)#2,843 |
| 71. | Wellston | 19.7% | 10.5%(+9.15)#71 | 11.0%(+8.64)#2,880 |
| 72. | Glenwillow | 19.6% | 10.5%(+9.07)#72 | 11.0%(+8.56)#2,902 |
| 73. | Ottawa Hills | 19.5% | 10.5%(+9.00)#73 | 11.0%(+8.49)#2,936 |
| 74. | Woodsdale | 19.4% | 10.5%(+8.90)#74 | 11.0%(+8.39)#2,976 |
| 75. | Lake Lorelei | 19.4% | 10.5%(+8.88)#75 | 11.0%(+8.38)#2,983 |
| 76. | Roaming Shores | 19.2% | 10.5%(+8.67)#76 | 11.0%(+8.17)#3,072 |
| 77. | Loveland Park | 18.9% | 10.5%(+8.43)#77 | 11.0%(+7.92)#3,159 |
| 78. | Damascus | 18.9% | 10.5%(+8.40)#78 | 11.0%(+7.90)#3,167 |
| 79. | Bexley | 18.7% | 10.5%(+8.18)#79 | 11.0%(+7.67)#3,265 |
| 80. | Independence | 18.7% | 10.5%(+8.15)#80 | 11.0%(+7.64)#3,277 |
| 81. | Day Heights | 18.6% | 10.5%(+8.07)#81 | 11.0%(+7.57)#3,317 |
| 82. | Greentown | 18.5% | 10.5%(+8.03)#82 | 11.0%(+7.53)#3,339 |
| 83. | Sixteen Mile Stand | 18.5% | 10.5%(+8.00)#83 | 11.0%(+7.49)#3,351 |
| 84. | Salem Heights | 18.4% | 10.5%(+7.93)#84 | 11.0%(+7.42)#3,381 |
| 85. | Kirtland Hills | 18.4% | 10.5%(+7.89)#85 | 11.0%(+7.39)#3,402 |
| 86. | Olmsted Falls | 18.4% | 10.5%(+7.87)#86 | 11.0%(+7.37)#3,419 |
| 87. | Ridgewood | 18.4% | 10.5%(+7.85)#87 | 11.0%(+7.35)#3,426 |
| 88. | Russells Point | 18.3% | 10.5%(+7.82)#88 | 11.0%(+7.32)#3,448 |
| 89. | New Pittsburg | 18.3% | 10.5%(+7.82)#89 | 11.0%(+7.31)#3,450 |
| 90. | Yorkville | 18.3% | 10.5%(+7.81)#90 | 11.0%(+7.30)#3,461 |
| 91. | Chagrin Falls | 18.3% | 10.5%(+7.79)#91 | 11.0%(+7.29)#3,467 |
| 92. | Corwin | 18.2% | 10.5%(+7.70)#92 | 11.0%(+7.20)#3,509 |
| 93. | Riverlea | 18.2% | 10.5%(+7.67)#93 | 11.0%(+7.16)#3,526 |
| 94. | Covedale | 18.1% | 10.5%(+7.63)#94 | 11.0%(+7.13)#3,561 |
| 95. | Aurora | 18.1% | 10.5%(+7.55)#95 | 11.0%(+7.05)#3,594 |
| 96. | Mason | 18.0% | 10.5%(+7.53)#96 | 11.0%(+7.03)#3,606 |
| 97. | Worthington | 18.0% | 10.5%(+7.48)#97 | 11.0%(+6.97)#3,621 |
| 98. | Beckett Ridge | 18.0% | 10.5%(+7.44)#98 | 11.0%(+6.94)#3,639 |
| 99. | Cloverdale | 17.9% | 10.5%(+7.34)#99 | 11.0%(+6.84)#3,701 |
| 100. | Stafford | 17.9% | 10.5%(+7.34)#100 | 11.0%(+6.84)#3,702 |
Common Questions
What are the Top 10 Cities with the Highest Percentage of Population Employed in Management in Ohio?
Top 10 Cities with the Highest Percentage of Population Employed in Management in Ohio are:
#1
53.1%
#2
49.5%
#3
49.4%
#4
43.6%
#5
36.8%
#6
34.5%
#7
33.2%
#8
32.0%
#9
31.7%
#10
31.7%
What city has the Highest Percentage of Population Employed in Management in Ohio?
Salesville has the Highest Percentage of Population Employed in Management in Ohio with 53.1%.
What is the Percentage of Population Employed in Management in the State of Ohio?
Percentage of Population Employed in Management in Ohio is 10.5%.
What is the Percentage of Population Employed in Management in the United States?
Percentage of Population Employed in Management in the United States is 11.0%.