Cities with the Most Immigrants from Jamaica in Ohio
RELATED REPORTS & OPTIONS
Jamaica
Ohio
Compare Cities
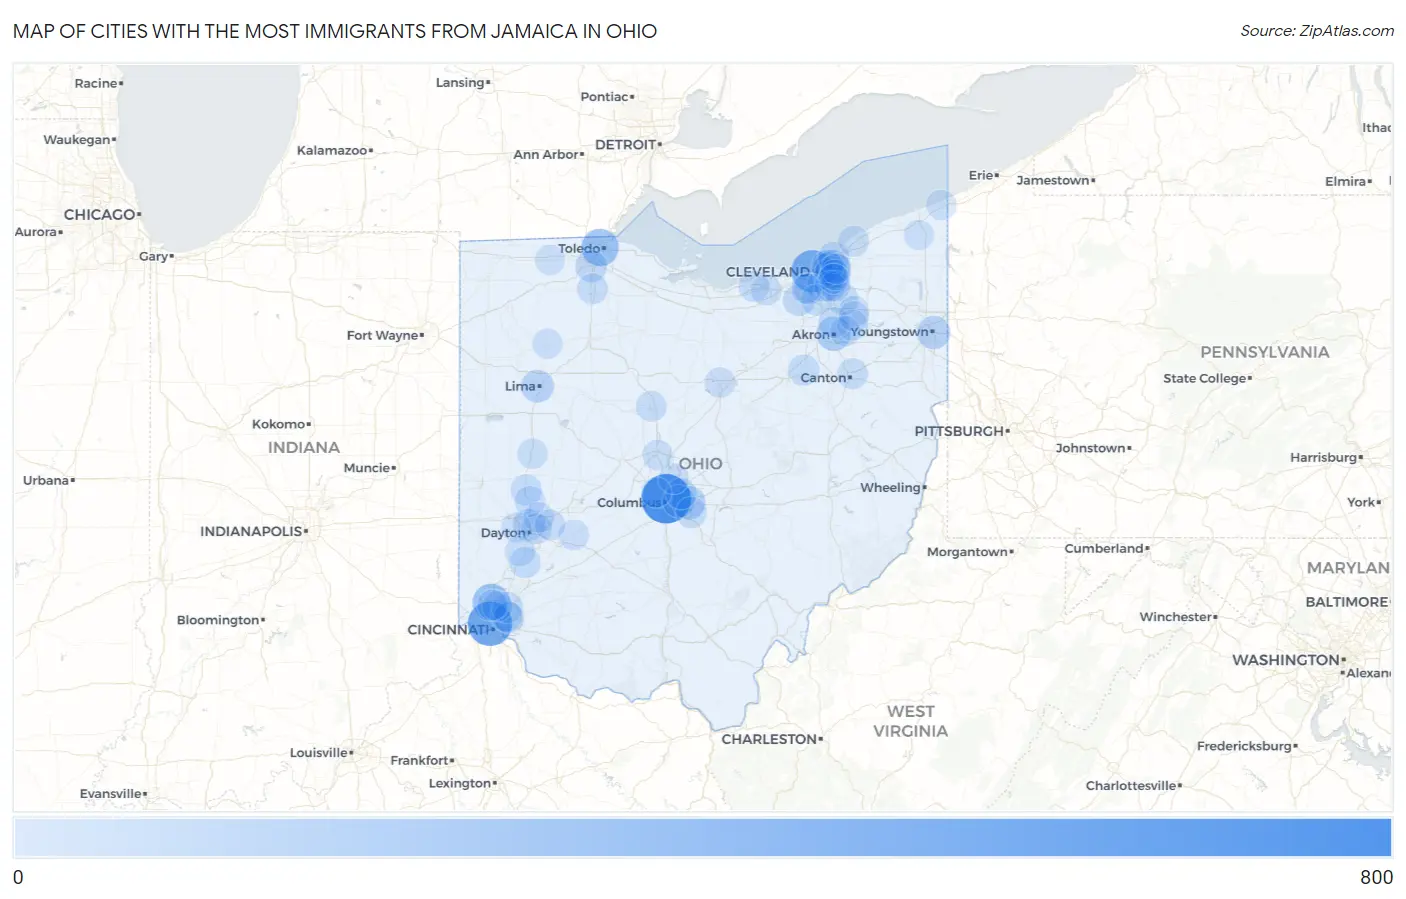
Map of Cities with the Most Immigrants from Jamaica in Ohio
0
800
Cities with the Most Immigrants from Jamaica in Ohio
| City | Jamaica | vs State | vs National | |
| 1. | Columbus | 606 | 4,187(14.47%)#1 | 785,998(0.08%)#150 |
| 2. | Cincinnati | 442 | 4,187(10.56%)#2 | 785,998(0.06%)#205 |
| 3. | Cleveland | 377 | 4,187(9.00%)#3 | 785,998(0.05%)#237 |
| 4. | Toledo | 218 | 4,187(5.21%)#4 | 785,998(0.03%)#357 |
| 5. | Forest Park | 218 | 4,187(5.21%)#5 | 785,998(0.03%)#359 |
| 6. | South Euclid | 150 | 4,187(3.58%)#6 | 785,998(0.02%)#514 |
| 7. | Akron | 130 | 4,187(3.10%)#7 | 785,998(0.02%)#572 |
| 8. | Reynoldsburg | 98 | 4,187(2.34%)#8 | 785,998(0.01%)#735 |
| 9. | Youngstown | 92 | 4,187(2.20%)#9 | 785,998(0.01%)#767 |
| 10. | Garfield Heights | 84 | 4,187(2.01%)#10 | 785,998(0.01%)#818 |
| 11. | Lima | 78 | 4,187(1.86%)#11 | 785,998(0.01%)#857 |
| 12. | Cleveland Heights | 75 | 4,187(1.79%)#12 | 785,998(0.01%)#873 |
| 13. | Warrensville Heights | 72 | 4,187(1.72%)#13 | 785,998(0.01%)#904 |
| 14. | Whitehall | 70 | 4,187(1.67%)#14 | 785,998(0.01%)#930 |
| 15. | Shaker Heights | 62 | 4,187(1.48%)#15 | 785,998(0.01%)#1,015 |
| 16. | University Heights | 60 | 4,187(1.43%)#16 | 785,998(0.01%)#1,042 |
| 17. | East Cleveland | 52 | 4,187(1.24%)#17 | 785,998(0.01%)#1,138 |
| 18. | Dayton | 51 | 4,187(1.22%)#18 | 785,998(0.01%)#1,148 |
| 19. | Perrysburg | 51 | 4,187(1.22%)#19 | 785,998(0.01%)#1,155 |
| 20. | Strongsville | 50 | 4,187(1.19%)#20 | 785,998(0.01%)#1,166 |
| 21. | Twinsburg | 44 | 4,187(1.05%)#21 | 785,998(0.01%)#1,250 |
| 22. | Parma | 35 | 4,187(0.84%)#22 | 785,998(0.00%)#1,411 |
| 23. | Euclid | 34 | 4,187(0.81%)#23 | 785,998(0.00%)#1,431 |
| 24. | Troy | 31 | 4,187(0.74%)#24 | 785,998(0.00%)#1,497 |
| 25. | Silverton | 31 | 4,187(0.74%)#25 | 785,998(0.00%)#1,511 |
| 26. | Pickerington | 30 | 4,187(0.72%)#26 | 785,998(0.00%)#1,526 |
| 27. | Springboro | 30 | 4,187(0.72%)#27 | 785,998(0.00%)#1,528 |
| 28. | Gahanna | 29 | 4,187(0.69%)#28 | 785,998(0.00%)#1,544 |
| 29. | Orrville | 29 | 4,187(0.69%)#29 | 785,998(0.00%)#1,562 |
| 30. | Broadview Heights | 28 | 4,187(0.67%)#30 | 785,998(0.00%)#1,580 |
| 31. | Blue Ash | 27 | 4,187(0.64%)#31 | 785,998(0.00%)#1,622 |
| 32. | Madeira | 27 | 4,187(0.64%)#32 | 785,998(0.00%)#1,626 |
| 33. | Mentor | 25 | 4,187(0.60%)#33 | 785,998(0.00%)#1,672 |
| 34. | Canton | 23 | 4,187(0.55%)#34 | 785,998(0.00%)#1,730 |
| 35. | Amherst | 23 | 4,187(0.55%)#35 | 785,998(0.00%)#1,740 |
| 36. | Elyria | 22 | 4,187(0.53%)#36 | 785,998(0.00%)#1,759 |
| 37. | Streetsboro | 20 | 4,187(0.48%)#37 | 785,998(0.00%)#1,852 |
| 38. | Bowling Green | 18 | 4,187(0.43%)#38 | 785,998(0.00%)#1,935 |
| 39. | Maple Heights | 18 | 4,187(0.43%)#39 | 785,998(0.00%)#1,940 |
| 40. | Cuyahoga Falls | 16 | 4,187(0.38%)#40 | 785,998(0.00%)#2,019 |
| 41. | Marion | 16 | 4,187(0.38%)#41 | 785,998(0.00%)#2,023 |
| 42. | Kent | 14 | 4,187(0.33%)#42 | 785,998(0.00%)#2,118 |
| 43. | Tipp City | 14 | 4,187(0.33%)#43 | 785,998(0.00%)#2,133 |
| 44. | Riverside | 12 | 4,187(0.29%)#44 | 785,998(0.00%)#2,221 |
| 45. | Cedarville | 12 | 4,187(0.29%)#45 | 785,998(0.00%)#2,245 |
| 46. | Westerville | 10 | 4,187(0.24%)#46 | 785,998(0.00%)#2,338 |
| 47. | Bedford Heights | 10 | 4,187(0.24%)#47 | 785,998(0.00%)#2,360 |
| 48. | Woodlawn | 10 | 4,187(0.24%)#48 | 785,998(0.00%)#2,378 |
| 49. | Greenhills | 10 | 4,187(0.24%)#49 | 785,998(0.00%)#2,380 |
| 50. | Huber Heights | 9 | 4,187(0.21%)#50 | 785,998(0.00%)#2,419 |
| 51. | Mansfield | 8 | 4,187(0.19%)#51 | 785,998(0.00%)#2,476 |
| 52. | Sidney | 8 | 4,187(0.19%)#52 | 785,998(0.00%)#2,489 |
| 53. | Beachwood | 8 | 4,187(0.19%)#53 | 785,998(0.00%)#2,495 |
| 54. | Fairborn | 7 | 4,187(0.17%)#54 | 785,998(0.00%)#2,556 |
| 55. | Lyndhurst | 7 | 4,187(0.17%)#55 | 785,998(0.00%)#2,573 |
| 56. | Delaware | 6 | 4,187(0.14%)#56 | 785,998(0.00%)#2,628 |
| 57. | Upper Arlington | 5 | 4,187(0.12%)#57 | 785,998(0.00%)#2,687 |
| 58. | Trotwood | 5 | 4,187(0.12%)#58 | 785,998(0.00%)#2,694 |
| 59. | Miamisburg | 5 | 4,187(0.12%)#59 | 785,998(0.00%)#2,695 |
| 60. | Conneaut | 5 | 4,187(0.12%)#60 | 785,998(0.00%)#2,700 |
| 61. | Parma Heights | 3 | 4,187(0.07%)#61 | 785,998(0.00%)#2,824 |
| 62. | Ottawa | 3 | 4,187(0.07%)#62 | 785,998(0.00%)#2,844 |
| 63. | Tallmadge | 2 | 4,187(0.05%)#63 | 785,998(0.00%)#2,889 |
| 64. | Jefferson | 2 | 4,187(0.05%)#64 | 785,998(0.00%)#2,907 |
| 65. | Delta | 1 | 4,187(0.02%)#65 | 785,998(0.00%)#2,986 |
| 66. | Highland Hills | 1 | 4,187(0.02%)#66 | 785,998(0.00%)#3,002 |
| 67. | Sugar Bush Knolls | 1 | 4,187(0.02%)#67 | 785,998(0.00%)#3,006 |
Common Questions
What are the Top 10 Cities with the Most Immigrants from Jamaica in Ohio?
Top 10 Cities with the Most Immigrants from Jamaica in Ohio are:
#1
606
#2
442
#3
377
#4
218
#5
218
#6
150
#7
130
#8
98
#9
92
#10
84
What city has the Most Immigrants from Jamaica in Ohio?
Columbus has the Most Immigrants from Jamaica in Ohio with 606.
What is the Total Immigrants from Jamaica in the State of Ohio?
Total Immigrants from Jamaica in Ohio is 4,187.
What is the Total Immigrants from Jamaica in the United States?
Total Immigrants from Jamaica in the United States is 785,998.