Cities with the Highest Percentage of Renter-Occupied Units in Ohio
RELATED REPORTS & OPTIONS
Highest Renter-Occupied
Ohio
Compare Cities
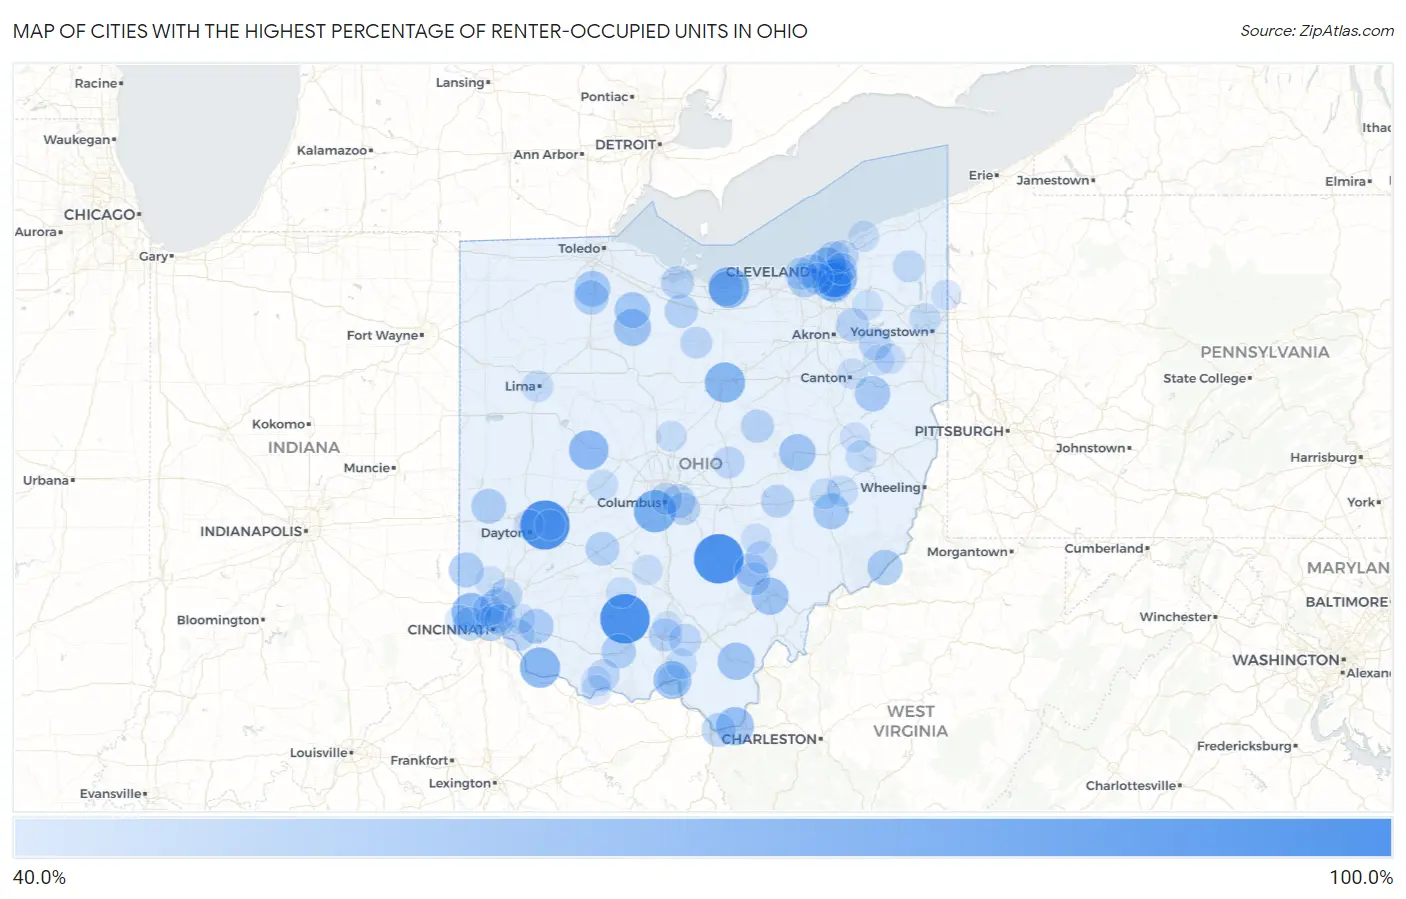
Map of Cities with the Highest Percentage of Renter-Occupied Units in Ohio
0.0%
100.0%
Cities with the Highest Percentage of Renter-Occupied Units in Ohio
| City | % Renter-Occupied | vs State | vs National | |
| 1. | Marathon | 100.0% | 33.2%(+66.8)#1 | 35.2%(+64.8)#112 |
| 2. | Rockbridge | 100.0% | 33.2%(+66.8)#2 | 35.2%(+64.8)#147 |
| 3. | Cynthiana | 100.0% | 33.2%(+66.8)#3 | 35.2%(+64.8)#186 |
| 4. | Wright Patterson Afb | 99.3% | 33.2%(+66.1)#4 | 35.2%(+64.1)#246 |
| 5. | Urbancrest | 80.7% | 33.2%(+47.5)#5 | 35.2%(+45.5)#428 |
| 6. | Beulah Beach | 77.1% | 33.2%(+44.0)#6 | 35.2%(+42.0)#507 |
| 7. | Felicity | 75.6% | 33.2%(+42.5)#7 | 35.2%(+40.5)#530 |
| 8. | Lincoln Heights | 75.5% | 33.2%(+42.3)#8 | 35.2%(+40.3)#534 |
| 9. | North Randall | 74.7% | 33.2%(+41.6)#9 | 35.2%(+39.6)#555 |
| 10. | Valley Hi | 73.7% | 33.2%(+40.5)#10 | 35.2%(+38.5)#579 |
| 11. | Woodmere | 73.2% | 33.2%(+40.0)#11 | 35.2%(+38.0)#592 |
| 12. | Miamitown | 72.8% | 33.2%(+39.6)#12 | 35.2%(+37.6)#602 |
| 13. | Birmingham | 71.3% | 33.2%(+38.1)#13 | 35.2%(+36.1)#660 |
| 14. | Highland Hills | 71.1% | 33.2%(+37.9)#14 | 35.2%(+35.9)#668 |
| 15. | Proctorville | 69.8% | 33.2%(+36.7)#15 | 35.2%(+34.7)#715 |
| 16. | New Boston | 69.2% | 33.2%(+36.0)#16 | 35.2%(+34.0)#754 |
| 17. | East Cleveland | 69.1% | 33.2%(+35.9)#17 | 35.2%(+33.9)#758 |
| 18. | Rio Grande | 67.8% | 33.2%(+34.6)#18 | 35.2%(+32.6)#805 |
| 19. | Athens | 67.8% | 33.2%(+34.6)#19 | 35.2%(+32.6)#807 |
| 20. | Bascom | 67.4% | 33.2%(+34.3)#20 | 35.2%(+32.3)#822 |
| 21. | Canal Lewisville | 66.5% | 33.2%(+33.3)#21 | 35.2%(+31.3)#878 |
| 22. | Pleasant City | 64.4% | 33.2%(+31.2)#22 | 35.2%(+29.2)#995 |
| 23. | Bowling Green | 64.2% | 33.2%(+31.1)#23 | 35.2%(+29.1)#1,009 |
| 24. | Kansas | 64.2% | 33.2%(+31.0)#24 | 35.2%(+29.0)#1,016 |
| 25. | South Mount Vernon | 63.9% | 33.2%(+30.8)#25 | 35.2%(+28.8)#1,030 |
| 26. | Malvern | 63.5% | 33.2%(+30.3)#26 | 35.2%(+28.3)#1,067 |
| 27. | Woodlawn | 63.0% | 33.2%(+29.8)#27 | 35.2%(+27.8)#1,105 |
| 28. | Matamoras | 62.9% | 33.2%(+29.7)#28 | 35.2%(+27.7)#1,112 |
| 29. | Oxford | 61.9% | 33.2%(+28.7)#29 | 35.2%(+26.7)#1,192 |
| 30. | Mitiwanga | 61.9% | 33.2%(+28.7)#30 | 35.2%(+26.7)#1,198 |
| 31. | Ithaca | 61.8% | 33.2%(+28.6)#31 | 35.2%(+26.6)#1,201 |
| 32. | Linndale | 61.8% | 33.2%(+28.6)#32 | 35.2%(+26.6)#1,205 |
| 33. | Owensville | 61.6% | 33.2%(+28.4)#33 | 35.2%(+26.4)#1,227 |
| 34. | Warrensville Heights | 61.5% | 33.2%(+28.3)#34 | 35.2%(+26.3)#1,237 |
| 35. | Portage | 60.9% | 33.2%(+27.7)#35 | 35.2%(+25.7)#1,286 |
| 36. | Cincinnati | 60.7% | 33.2%(+27.5)#36 | 35.2%(+25.5)#1,308 |
| 37. | Peebles | 60.5% | 33.2%(+27.3)#37 | 35.2%(+25.3)#1,320 |
| 38. | Jeffersonville | 59.5% | 33.2%(+26.3)#38 | 35.2%(+24.3)#1,428 |
| 39. | Burlington | 59.4% | 33.2%(+26.3)#39 | 35.2%(+24.2)#1,437 |
| 40. | Cleveland | 59.1% | 33.2%(+25.9)#40 | 35.2%(+23.9)#1,476 |
| 41. | Addyston | 58.8% | 33.2%(+25.6)#41 | 35.2%(+23.6)#1,500 |
| 42. | Whitehall | 58.8% | 33.2%(+25.6)#42 | 35.2%(+23.6)#1,505 |
| 43. | Flat Rock | 57.9% | 33.2%(+24.8)#43 | 35.2%(+22.8)#1,595 |
| 44. | Zanesville | 57.9% | 33.2%(+24.7)#44 | 35.2%(+22.7)#1,610 |
| 45. | Gann Brinkhaven | 57.7% | 33.2%(+24.6)#45 | 35.2%(+22.6)#1,627 |
| 46. | Carbon Hill | 57.7% | 33.2%(+24.5)#46 | 35.2%(+22.5)#1,638 |
| 47. | Whites Landing | 57.4% | 33.2%(+24.2)#47 | 35.2%(+22.2)#1,680 |
| 48. | Piketon | 57.3% | 33.2%(+24.2)#48 | 35.2%(+22.2)#1,686 |
| 49. | Kent | 57.3% | 33.2%(+24.1)#49 | 35.2%(+22.1)#1,697 |
| 50. | New Springfield | 57.2% | 33.2%(+24.0)#50 | 35.2%(+22.0)#1,706 |
| 51. | Nelsonville | 57.2% | 33.2%(+24.0)#51 | 35.2%(+22.0)#1,708 |
| 52. | Atwater | 56.8% | 33.2%(+23.6)#52 | 35.2%(+21.6)#1,748 |
| 53. | Brice | 56.8% | 33.2%(+23.6)#53 | 35.2%(+21.6)#1,749 |
| 54. | Bedford Heights | 56.4% | 33.2%(+23.2)#54 | 35.2%(+21.2)#1,803 |
| 55. | Euclid | 56.3% | 33.2%(+23.1)#55 | 35.2%(+21.1)#1,827 |
| 56. | Lakewood | 56.2% | 33.2%(+23.0)#56 | 35.2%(+21.0)#1,841 |
| 57. | Beaver | 56.0% | 33.2%(+22.8)#57 | 35.2%(+20.8)#1,871 |
| 58. | Willoughby Hills | 55.7% | 33.2%(+22.5)#58 | 35.2%(+20.5)#1,906 |
| 59. | Columbus | 55.3% | 33.2%(+22.1)#59 | 35.2%(+20.1)#1,985 |
| 60. | Bolton | 55.2% | 33.2%(+22.0)#60 | 35.2%(+20.0)#1,996 |
| 61. | Hemlock | 55.1% | 33.2%(+21.9)#61 | 35.2%(+19.9)#2,013 |
| 62. | Mount Healthy | 54.9% | 33.2%(+21.8)#62 | 35.2%(+19.8)#2,043 |
| 63. | Utica | 54.7% | 33.2%(+21.5)#63 | 35.2%(+19.5)#2,075 |
| 64. | Mayfield Heights | 54.7% | 33.2%(+21.5)#64 | 35.2%(+19.5)#2,078 |
| 65. | Celeryville | 54.7% | 33.2%(+21.5)#65 | 35.2%(+19.5)#2,080 |
| 66. | West Union | 54.7% | 33.2%(+21.5)#66 | 35.2%(+19.5)#2,082 |
| 67. | Withamsville | 54.6% | 33.2%(+21.4)#67 | 35.2%(+19.4)#2,097 |
| 68. | Orwell | 54.6% | 33.2%(+21.4)#68 | 35.2%(+19.4)#2,099 |
| 69. | Elmwood Place | 54.3% | 33.2%(+21.1)#69 | 35.2%(+19.1)#2,142 |
| 70. | Newburgh Heights | 54.2% | 33.2%(+21.0)#70 | 35.2%(+19.0)#2,153 |
| 71. | Olde West Chester | 54.0% | 33.2%(+20.8)#71 | 35.2%(+18.8)#2,182 |
| 72. | Tippecanoe | 53.7% | 33.2%(+20.5)#72 | 35.2%(+18.5)#2,238 |
| 73. | Norwood | 53.6% | 33.2%(+20.4)#73 | 35.2%(+18.4)#2,247 |
| 74. | Lima | 53.4% | 33.2%(+20.2)#74 | 35.2%(+18.2)#2,295 |
| 75. | Mckinley Heights | 53.3% | 33.2%(+20.2)#75 | 35.2%(+18.2)#2,302 |
| 76. | Portsmouth | 52.5% | 33.2%(+19.3)#76 | 35.2%(+17.3)#2,484 |
| 77. | Minford | 52.4% | 33.2%(+19.2)#77 | 35.2%(+17.2)#2,505 |
| 78. | Mechanicsburg | 52.2% | 33.2%(+19.1)#78 | 35.2%(+17.0)#2,542 |
| 79. | Old Washington | 52.2% | 33.2%(+19.0)#79 | 35.2%(+17.0)#2,547 |
| 80. | Cambridge | 52.1% | 33.2%(+19.0)#80 | 35.2%(+17.0)#2,564 |
| 81. | Alliance | 52.0% | 33.2%(+18.8)#81 | 35.2%(+16.8)#2,588 |
| 82. | Greenfield | 51.9% | 33.2%(+18.7)#82 | 35.2%(+16.7)#2,610 |
| 83. | Painesville | 51.8% | 33.2%(+18.6)#83 | 35.2%(+16.6)#2,632 |
| 84. | Canton | 51.8% | 33.2%(+18.6)#84 | 35.2%(+16.6)#2,633 |
| 85. | Ashley | 51.7% | 33.2%(+18.5)#85 | 35.2%(+16.5)#2,659 |
| 86. | Dayton | 51.6% | 33.2%(+18.5)#86 | 35.2%(+16.5)#2,666 |
| 87. | Fairborn | 51.4% | 33.2%(+18.3)#87 | 35.2%(+16.3)#2,715 |
| 88. | Clarksburg | 51.3% | 33.2%(+18.1)#88 | 35.2%(+16.1)#2,758 |
| 89. | New Lexington | 51.1% | 33.2%(+17.9)#89 | 35.2%(+15.9)#2,804 |
| 90. | Mantua | 51.1% | 33.2%(+17.9)#90 | 35.2%(+15.9)#2,819 |
| 91. | West Logan | 51.0% | 33.2%(+17.9)#91 | 35.2%(+15.9)#2,836 |
| 92. | Milford | 51.0% | 33.2%(+17.8)#92 | 35.2%(+15.8)#2,842 |
| 93. | Sebring | 50.9% | 33.2%(+17.7)#93 | 35.2%(+15.7)#2,879 |
| 94. | Bentonville | 50.8% | 33.2%(+17.6)#94 | 35.2%(+15.6)#2,900 |
| 95. | Orangeville | 50.8% | 33.2%(+17.6)#95 | 35.2%(+15.6)#2,905 |
| 96. | Dennison | 50.7% | 33.2%(+17.5)#96 | 35.2%(+15.5)#2,912 |
| 97. | Manchester | 50.6% | 33.2%(+17.5)#97 | 35.2%(+15.5)#2,933 |
| 98. | New Miami | 50.3% | 33.2%(+17.1)#98 | 35.2%(+15.1)#3,015 |
| 99. | Waverly | 50.1% | 33.2%(+17.0)#99 | 35.2%(+15.0)#3,053 |
| 100. | Elizabethtown | 50.0% | 33.2%(+16.8)#100 | 35.2%(+14.8)#3,095 |
Common Questions
What are the Top 10 Cities with the Highest Percentage of Renter-Occupied Units in Ohio?
Top 10 Cities with the Highest Percentage of Renter-Occupied Units in Ohio are:
#1
100.0%
#2
100.0%
#3
99.3%
#4
80.7%
#5
77.1%
#6
75.6%
#7
75.5%
#8
74.7%
#9
73.7%
#10
73.2%
What city has the Highest Percentage of Renter-Occupied Units in Ohio?
Rockbridge has the Highest Percentage of Renter-Occupied Units in Ohio with 100.0%.
What is the Percentage of Renter-Occupied Units in the State of Ohio?
Percentage of Renter-Occupied Units in Ohio is 33.2%.
What is the Percentage of Renter-Occupied Units in the United States?
Percentage of Renter-Occupied Units in the United States is 35.2%.