Cities with the Largest Canadian Community in Ohio
RELATED REPORTS & OPTIONS
Canadian
Ohio
Compare Cities
Map of Cities with the Largest Canadian Community in Ohio
0
1,000
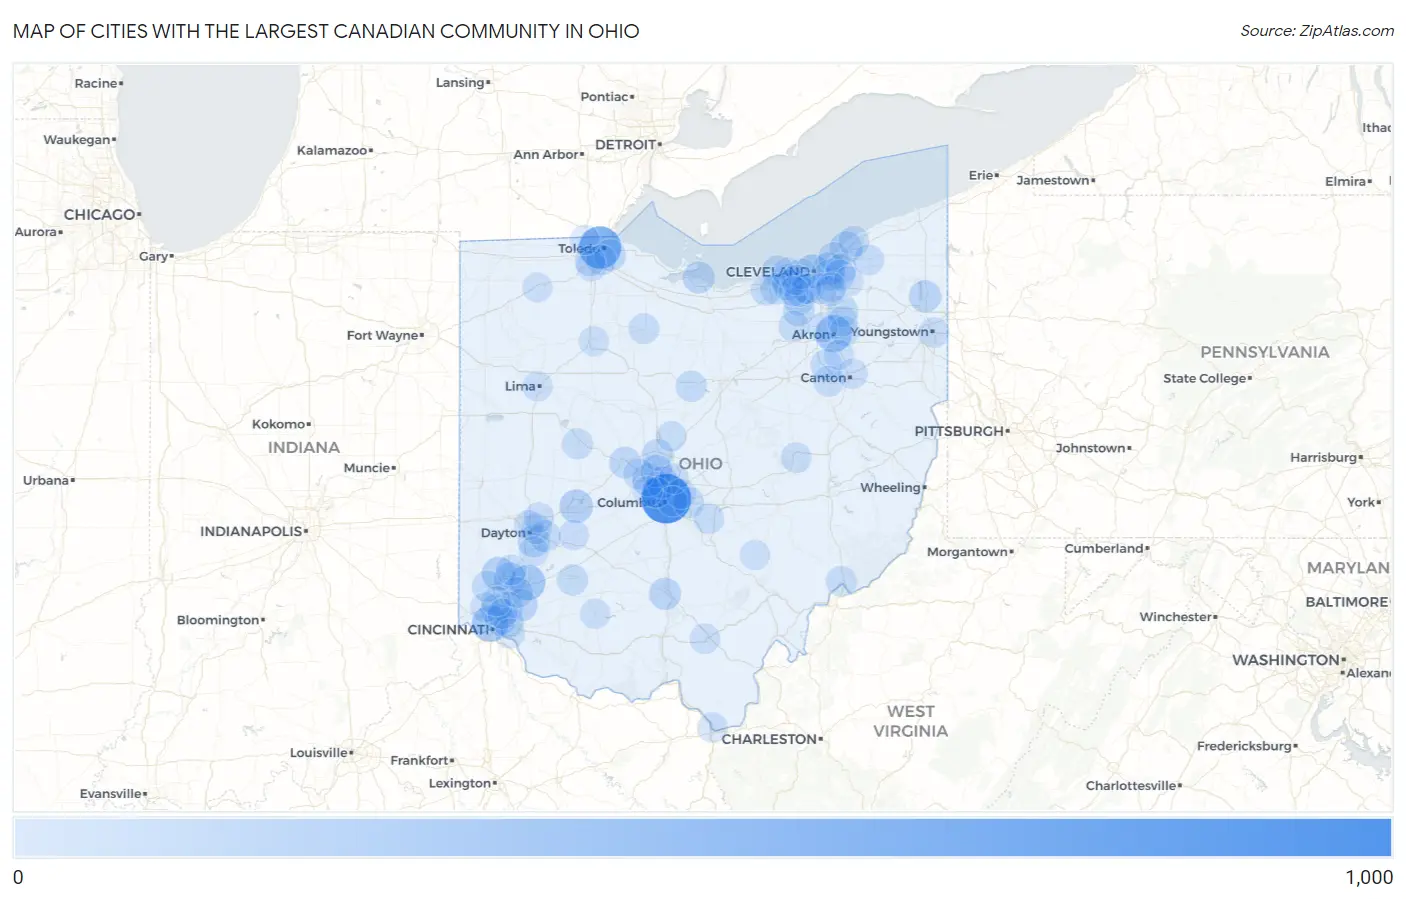
Cities with the Largest Canadian Community in Ohio
| City | Canadian | vs State | vs National | |
| 1. | Columbus | 914 | 13,818(6.61%)#1 | 590,636(0.15%)#34 |
| 2. | Toledo | 571 | 13,818(4.13%)#2 | 590,636(0.10%)#79 |
| 3. | Akron | 324 | 13,818(2.34%)#3 | 590,636(0.05%)#231 |
| 4. | Cincinnati | 294 | 13,818(2.13%)#4 | 590,636(0.05%)#272 |
| 5. | Lebanon | 269 | 13,818(1.95%)#5 | 590,636(0.05%)#295 |
| 6. | Cleveland | 180 | 13,818(1.30%)#6 | 590,636(0.03%)#500 |
| 7. | Trenton | 178 | 13,818(1.29%)#7 | 590,636(0.03%)#515 |
| 8. | Springfield | 176 | 13,818(1.27%)#8 | 590,636(0.03%)#524 |
| 9. | Dublin | 143 | 13,818(1.03%)#9 | 590,636(0.02%)#663 |
| 10. | Cleveland Heights | 133 | 13,818(0.96%)#10 | 590,636(0.02%)#722 |
| 11. | Willoughby | 132 | 13,818(0.96%)#11 | 590,636(0.02%)#732 |
| 12. | Monroe | 129 | 13,818(0.93%)#12 | 590,636(0.02%)#748 |
| 13. | Loveland | 128 | 13,818(0.93%)#13 | 590,636(0.02%)#756 |
| 14. | Powell | 120 | 13,818(0.87%)#14 | 590,636(0.02%)#819 |
| 15. | Cortland | 116 | 13,818(0.84%)#15 | 590,636(0.02%)#854 |
| 16. | Worthington | 115 | 13,818(0.83%)#16 | 590,636(0.02%)#859 |
| 17. | Kettering | 109 | 13,818(0.79%)#17 | 590,636(0.02%)#906 |
| 18. | Chillicothe | 109 | 13,818(0.79%)#18 | 590,636(0.02%)#909 |
| 19. | Sandusky | 106 | 13,818(0.77%)#19 | 590,636(0.02%)#943 |
| 20. | Avon Lake | 99 | 13,818(0.72%)#20 | 590,636(0.02%)#1,020 |
| 21. | Brunswick | 97 | 13,818(0.70%)#21 | 590,636(0.02%)#1,034 |
| 22. | Blue Ash | 95 | 13,818(0.69%)#22 | 590,636(0.02%)#1,055 |
| 23. | Delaware | 92 | 13,818(0.67%)#23 | 590,636(0.02%)#1,086 |
| 24. | Marysville | 92 | 13,818(0.67%)#24 | 590,636(0.02%)#1,089 |
| 25. | Northwood | 90 | 13,818(0.65%)#25 | 590,636(0.02%)#1,112 |
| 26. | Westlake | 89 | 13,818(0.64%)#26 | 590,636(0.02%)#1,119 |
| 27. | Canal Fulton | 88 | 13,818(0.64%)#27 | 590,636(0.01%)#1,128 |
| 28. | Wyoming | 86 | 13,818(0.62%)#28 | 590,636(0.01%)#1,159 |
| 29. | North Ridgeville | 84 | 13,818(0.61%)#29 | 590,636(0.01%)#1,171 |
| 30. | Beavercreek | 83 | 13,818(0.60%)#30 | 590,636(0.01%)#1,187 |
| 31. | Hudson | 80 | 13,818(0.58%)#31 | 590,636(0.01%)#1,245 |
| 32. | Shaker Heights | 76 | 13,818(0.55%)#32 | 590,636(0.01%)#1,294 |
| 33. | Parma | 72 | 13,818(0.52%)#33 | 590,636(0.01%)#1,355 |
| 34. | Hamilton | 71 | 13,818(0.51%)#34 | 590,636(0.01%)#1,374 |
| 35. | Elyria | 70 | 13,818(0.51%)#35 | 590,636(0.01%)#1,387 |
| 36. | Reynoldsburg | 70 | 13,818(0.51%)#36 | 590,636(0.01%)#1,388 |
| 37. | Wilmington | 69 | 13,818(0.50%)#37 | 590,636(0.01%)#1,409 |
| 38. | Galion | 64 | 13,818(0.46%)#38 | 590,636(0.01%)#1,484 |
| 39. | Strongsville | 62 | 13,818(0.45%)#39 | 590,636(0.01%)#1,512 |
| 40. | Euclid | 59 | 13,818(0.43%)#40 | 590,636(0.01%)#1,580 |
| 41. | Mason | 59 | 13,818(0.43%)#41 | 590,636(0.01%)#1,586 |
| 42. | Bellefontaine | 58 | 13,818(0.42%)#42 | 590,636(0.01%)#1,613 |
| 43. | North Olmsted | 57 | 13,818(0.41%)#43 | 590,636(0.01%)#1,634 |
| 44. | New California | 57 | 13,818(0.41%)#44 | 590,636(0.01%)#1,661 |
| 45. | Norwood | 56 | 13,818(0.41%)#45 | 590,636(0.01%)#1,676 |
| 46. | Mentor | 54 | 13,818(0.39%)#46 | 590,636(0.01%)#1,714 |
| 47. | Medina | 54 | 13,818(0.39%)#47 | 590,636(0.01%)#1,719 |
| 48. | Middleburg Heights | 54 | 13,818(0.39%)#48 | 590,636(0.01%)#1,723 |
| 49. | Massillon | 53 | 13,818(0.38%)#49 | 590,636(0.01%)#1,741 |
| 50. | Baltimore | 52 | 13,818(0.38%)#50 | 590,636(0.01%)#1,781 |
| 51. | Tiffin | 49 | 13,818(0.35%)#51 | 590,636(0.01%)#1,843 |
| 52. | Independence | 49 | 13,818(0.35%)#52 | 590,636(0.01%)#1,849 |
| 53. | Mayfield Heights | 48 | 13,818(0.35%)#53 | 590,636(0.01%)#1,872 |
| 54. | Pepper Pike | 48 | 13,818(0.35%)#54 | 590,636(0.01%)#1,884 |
| 55. | Marietta | 47 | 13,818(0.34%)#55 | 590,636(0.01%)#1,911 |
| 56. | Chardon | 47 | 13,818(0.34%)#56 | 590,636(0.01%)#1,922 |
| 57. | Middletown | 44 | 13,818(0.32%)#57 | 590,636(0.01%)#1,992 |
| 58. | Riverside | 41 | 13,818(0.30%)#58 | 590,636(0.01%)#2,127 |
| 59. | Youngstown | 40 | 13,818(0.29%)#59 | 590,636(0.01%)#2,156 |
| 60. | Lakewood | 40 | 13,818(0.29%)#60 | 590,636(0.01%)#2,158 |
| 61. | Cedarville | 39 | 13,818(0.28%)#61 | 590,636(0.01%)#2,230 |
| 62. | Perrysburg | 37 | 13,818(0.27%)#62 | 590,636(0.01%)#2,286 |
| 63. | Coshocton | 37 | 13,818(0.27%)#63 | 590,636(0.01%)#2,300 |
| 64. | Upper Arlington | 36 | 13,818(0.26%)#64 | 590,636(0.01%)#2,327 |
| 65. | Rossford | 36 | 13,818(0.26%)#65 | 590,636(0.01%)#2,362 |
| 66. | Jackson | 36 | 13,818(0.26%)#66 | 590,636(0.01%)#2,364 |
| 67. | South Point | 35 | 13,818(0.25%)#67 | 590,636(0.01%)#2,406 |
| 68. | Canton | 34 | 13,818(0.25%)#68 | 590,636(0.01%)#2,416 |
| 69. | Walton Hills | 34 | 13,818(0.25%)#69 | 590,636(0.01%)#2,441 |
| 70. | Ashley | 33 | 13,818(0.24%)#70 | 590,636(0.01%)#2,492 |
| 71. | Maumee | 32 | 13,818(0.23%)#71 | 590,636(0.01%)#2,521 |
| 72. | Huber Heights | 31 | 13,818(0.22%)#72 | 590,636(0.01%)#2,543 |
| 73. | Westerville | 31 | 13,818(0.22%)#73 | 590,636(0.01%)#2,544 |
| 74. | Mariemont | 30 | 13,818(0.22%)#74 | 590,636(0.01%)#2,636 |
| 75. | Findlay | 29 | 13,818(0.21%)#75 | 590,636(0.00%)#2,650 |
| 76. | Tallmadge | 29 | 13,818(0.21%)#76 | 590,636(0.00%)#2,662 |
| 77. | Hillsboro | 29 | 13,818(0.21%)#77 | 590,636(0.00%)#2,688 |
| 78. | Gahanna | 28 | 13,818(0.20%)#78 | 590,636(0.00%)#2,713 |
| 79. | Bexley | 28 | 13,818(0.20%)#79 | 590,636(0.00%)#2,729 |
| 80. | Fairlawn | 28 | 13,818(0.20%)#80 | 590,636(0.00%)#2,736 |
| 81. | Dayton | 27 | 13,818(0.20%)#81 | 590,636(0.00%)#2,757 |
| 82. | Hilliard | 27 | 13,818(0.20%)#82 | 590,636(0.00%)#2,765 |
| 83. | Stow | 27 | 13,818(0.20%)#83 | 590,636(0.00%)#2,767 |
| 84. | Bay Village | 27 | 13,818(0.20%)#84 | 590,636(0.00%)#2,784 |
| 85. | Northbrook | 27 | 13,818(0.20%)#85 | 590,636(0.00%)#2,794 |
| 86. | Massieville | 27 | 13,818(0.20%)#86 | 590,636(0.00%)#2,837 |
| 87. | Sylvania | 26 | 13,818(0.19%)#87 | 590,636(0.00%)#2,863 |
| 88. | Chagrin Falls | 26 | 13,818(0.19%)#88 | 590,636(0.00%)#2,903 |
| 89. | Amberley | 26 | 13,818(0.19%)#89 | 590,636(0.00%)#2,907 |
| 90. | Lima | 25 | 13,818(0.18%)#90 | 590,636(0.00%)#2,934 |
| 91. | Green | 25 | 13,818(0.18%)#91 | 590,636(0.00%)#2,940 |
| 92. | Bedford | 25 | 13,818(0.18%)#92 | 590,636(0.00%)#2,958 |
| 93. | Fruit Hill | 24 | 13,818(0.17%)#93 | 590,636(0.00%)#3,044 |
| 94. | Shawnee | 24 | 13,818(0.17%)#94 | 590,636(0.00%)#3,071 |
| 95. | Parma Heights | 23 | 13,818(0.17%)#95 | 590,636(0.00%)#3,087 |
| 96. | Fairview Park | 23 | 13,818(0.17%)#96 | 590,636(0.00%)#3,092 |
| 97. | Springdale | 23 | 13,818(0.17%)#97 | 590,636(0.00%)#3,102 |
| 98. | Napoleon | 23 | 13,818(0.17%)#98 | 590,636(0.00%)#3,105 |
| 99. | Centerville | 22 | 13,818(0.16%)#99 | 590,636(0.00%)#3,148 |
| 100. | Berea | 22 | 13,818(0.16%)#100 | 590,636(0.00%)#3,154 |
Common Questions
What are the Top 10 Cities with the Largest Canadian Community in Ohio?
Top 10 Cities with the Largest Canadian Community in Ohio are:
#1
914
#2
571
#3
324
#4
294
#5
269
#6
180
#7
178
#8
176
#9
143
#10
133
What city has the Largest Canadian Community in Ohio?
Columbus has the Largest Canadian Community in Ohio with 914.
What is the Total Canadian Population in the State of Ohio?
Total Canadian Population in Ohio is 13,818.
What is the Total Canadian Population in the United States?
Total Canadian Population in the United States is 590,636.