Cities with the Highest Percentage of South American Population in Ohio
RELATED REPORTS & OPTIONS
South American
Ohio
Compare Cities
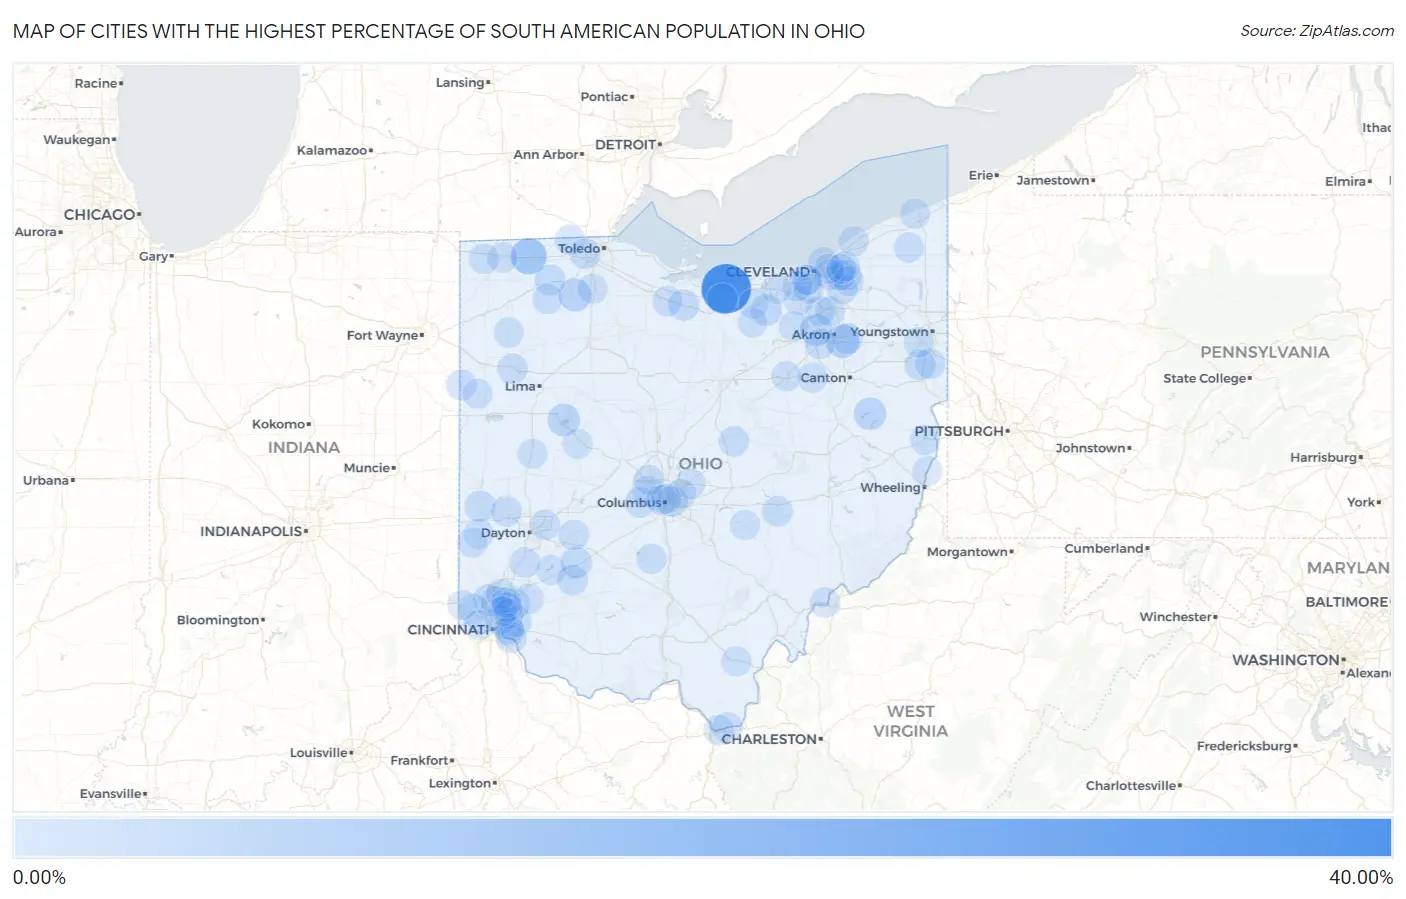
Map of Cities with the Highest Percentage of South American Population in Ohio
0.00%
40.00%
Cities with the Highest Percentage of South American Population in Ohio
| City | South American | vs State | vs National | |
| 1. | Mitiwanga | 36.95% | 0.25%(+36.7)#1 | 1.28%(+35.7)#11 |
| 2. | Tedrow | 11.20% | 0.25%(+10.9)#2 | 1.28%(+9.92)#170 |
| 3. | Sawyerwood | 6.37% | 0.25%(+6.12)#3 | 1.28%(+5.09)#429 |
| 4. | Weston | 5.31% | 0.25%(+5.06)#4 | 1.28%(+4.03)#563 |
| 5. | Chippewa Park | 4.62% | 0.25%(+4.36)#5 | 1.28%(+3.33)#680 |
| 6. | Pigeon Creek | 4.56% | 0.25%(+4.31)#6 | 1.28%(+3.28)#694 |
| 7. | Dellroy | 4.53% | 0.25%(+4.28)#7 | 1.28%(+3.25)#700 |
| 8. | Bass Lake | 3.58% | 0.25%(+3.32)#8 | 1.28%(+2.29)#979 |
| 9. | Lagrange | 2.97% | 0.25%(+2.71)#9 | 1.28%(+1.68)#1,236 |
| 10. | Port William | 2.72% | 0.25%(+2.47)#10 | 1.28%(+1.44)#1,377 |
| 11. | Linndale | 2.54% | 0.25%(+2.28)#11 | 1.28%(+1.25)#1,471 |
| 12. | Castine | 2.48% | 0.25%(+2.23)#12 | 1.28%(+1.20)#1,509 |
| 13. | Pleasant Run Farm | 2.44% | 0.25%(+2.19)#13 | 1.28%(+1.16)#1,533 |
| 14. | Bellevue | 2.30% | 0.25%(+2.05)#14 | 1.28%(+1.02)#1,634 |
| 15. | Liberty Center | 2.14% | 0.25%(+1.89)#15 | 1.28%(+0.858)#1,759 |
| 16. | Leetonia | 2.12% | 0.25%(+1.87)#16 | 1.28%(+0.837)#1,780 |
| 17. | Berlin Heights | 2.05% | 0.25%(+1.80)#17 | 1.28%(+0.769)#1,844 |
| 18. | Hunting Valley | 1.87% | 0.25%(+1.62)#18 | 1.28%(+0.592)#2,006 |
| 19. | Terrace Park | 1.86% | 0.25%(+1.61)#19 | 1.28%(+0.577)#2,028 |
| 20. | Coldstream | 1.80% | 0.25%(+1.54)#20 | 1.28%(+0.514)#2,096 |
| 21. | Bexley | 1.79% | 0.25%(+1.53)#21 | 1.28%(+0.505)#2,106 |
| 22. | Phillipsburg | 1.76% | 0.25%(+1.51)#22 | 1.28%(+0.476)#2,135 |
| 23. | Wilmington | 1.59% | 0.25%(+1.34)#23 | 1.28%(+0.311)#2,333 |
| 24. | Bratenahl | 1.55% | 0.25%(+1.29)#24 | 1.28%(+0.264)#2,389 |
| 25. | South Zanesville | 1.44% | 0.25%(+1.19)#25 | 1.28%(+0.156)#2,537 |
| 26. | Springboro | 1.40% | 0.25%(+1.15)#26 | 1.28%(+0.122)#2,603 |
| 27. | Belpre | 1.38% | 0.25%(+1.12)#27 | 1.28%(+0.092)#2,664 |
| 28. | Lake Darby | 1.36% | 0.25%(+1.10)#28 | 1.28%(+0.074)#2,690 |
| 29. | Hilliard | 1.34% | 0.25%(+1.08)#29 | 1.28%(+0.055)#2,719 |
| 30. | Sixteen Mile Stand | 1.33% | 0.25%(+1.08)#30 | 1.28%(+0.049)#2,728 |
| 31. | Willshire | 1.30% | 0.25%(+1.04)#31 | 1.28%(+0.012)#2,786 |
| 32. | Berkey | 1.29% | 0.25%(+1.04)#32 | 1.28%(+0.007)#2,799 |
| 33. | Holland | 1.28% | 0.25%(+1.03)#33 | 1.28%(-0.002)#2,816 |
| 34. | West Unity | 1.22% | 0.25%(+0.971)#34 | 1.28%(-0.058)#2,925 |
| 35. | Mogadore | 1.22% | 0.25%(+0.971)#35 | 1.28%(-0.059)#2,926 |
| 36. | Delphos | 1.22% | 0.25%(+0.963)#36 | 1.28%(-0.067)#2,945 |
| 37. | Malinta | 1.20% | 0.25%(+0.948)#37 | 1.28%(-0.082)#2,985 |
| 38. | Gambier | 1.20% | 0.25%(+0.946)#38 | 1.28%(-0.083)#2,988 |
| 39. | Solon | 1.19% | 0.25%(+0.940)#39 | 1.28%(-0.090)#3,001 |
| 40. | Clyde | 1.17% | 0.25%(+0.918)#40 | 1.28%(-0.111)#3,052 |
| 41. | Cedarville | 1.12% | 0.25%(+0.870)#41 | 1.28%(-0.159)#3,162 |
| 42. | Chesapeake | 1.03% | 0.25%(+0.778)#42 | 1.28%(-0.251)#3,376 |
| 43. | Wright Patterson Afb | 1.03% | 0.25%(+0.776)#43 | 1.28%(-0.254)#3,381 |
| 44. | Springdale | 1.02% | 0.25%(+0.765)#44 | 1.28%(-0.264)#3,404 |
| 45. | Norton | 1.01% | 0.25%(+0.760)#45 | 1.28%(-0.270)#3,421 |
| 46. | Dublin | 0.99% | 0.25%(+0.734)#46 | 1.28%(-0.295)#3,475 |
| 47. | Taylor Creek | 0.98% | 0.25%(+0.725)#47 | 1.28%(-0.305)#3,499 |
| 48. | Montpelier | 0.97% | 0.25%(+0.714)#48 | 1.28%(-0.316)#3,539 |
| 49. | Shaker Heights | 0.97% | 0.25%(+0.714)#49 | 1.28%(-0.316)#3,541 |
| 50. | Grandview Heights | 0.94% | 0.25%(+0.691)#50 | 1.28%(-0.339)#3,614 |
| 51. | Pepper Pike | 0.93% | 0.25%(+0.676)#51 | 1.28%(-0.354)#3,659 |
| 52. | Columbiana | 0.93% | 0.25%(+0.673)#52 | 1.28%(-0.356)#3,664 |
| 53. | Norwood | 0.93% | 0.25%(+0.672)#53 | 1.28%(-0.358)#3,666 |
| 54. | Richfield | 0.86% | 0.25%(+0.607)#54 | 1.28%(-0.423)#3,855 |
| 55. | Williamsport | 0.84% | 0.25%(+0.582)#55 | 1.28%(-0.448)#3,931 |
| 56. | Rock Creek | 0.83% | 0.25%(+0.579)#56 | 1.28%(-0.451)#3,941 |
| 57. | Burlington | 0.83% | 0.25%(+0.574)#57 | 1.28%(-0.456)#3,957 |
| 58. | Beckett Ridge | 0.82% | 0.25%(+0.566)#58 | 1.28%(-0.463)#3,979 |
| 59. | Strongsville | 0.77% | 0.25%(+0.520)#59 | 1.28%(-0.510)#4,147 |
| 60. | Medina | 0.77% | 0.25%(+0.517)#60 | 1.28%(-0.513)#4,160 |
| 61. | Eaton | 0.74% | 0.25%(+0.488)#61 | 1.28%(-0.542)#4,263 |
| 62. | Oberlin | 0.73% | 0.25%(+0.479)#62 | 1.28%(-0.551)#4,287 |
| 63. | Maineville | 0.73% | 0.25%(+0.476)#63 | 1.28%(-0.554)#4,304 |
| 64. | Bellefontaine | 0.73% | 0.25%(+0.472)#64 | 1.28%(-0.558)#4,317 |
| 65. | Kenwood | 0.71% | 0.25%(+0.458)#65 | 1.28%(-0.571)#4,367 |
| 66. | Dalton | 0.70% | 0.25%(+0.451)#66 | 1.28%(-0.578)#4,402 |
| 67. | Chagrin Falls | 0.70% | 0.25%(+0.451)#67 | 1.28%(-0.579)#4,404 |
| 68. | Sherwood | 0.70% | 0.25%(+0.451)#68 | 1.28%(-0.579)#4,406 |
| 69. | New Albany | 0.70% | 0.25%(+0.450)#69 | 1.28%(-0.579)#4,408 |
| 70. | Gates Mills | 0.70% | 0.25%(+0.442)#70 | 1.28%(-0.588)#4,444 |
| 71. | Canfield | 0.68% | 0.25%(+0.425)#71 | 1.28%(-0.604)#4,513 |
| 72. | Wooster | 0.68% | 0.25%(+0.424)#72 | 1.28%(-0.606)#4,521 |
| 73. | Cleveland Heights | 0.67% | 0.25%(+0.420)#73 | 1.28%(-0.610)#4,536 |
| 74. | Tiltonsville | 0.66% | 0.25%(+0.409)#74 | 1.28%(-0.621)#4,573 |
| 75. | Bowling Green | 0.65% | 0.25%(+0.400)#75 | 1.28%(-0.630)#4,611 |
| 76. | Wellington | 0.65% | 0.25%(+0.392)#76 | 1.28%(-0.638)#4,639 |
| 77. | Parma | 0.64% | 0.25%(+0.388)#77 | 1.28%(-0.642)#4,657 |
| 78. | Mentor | 0.64% | 0.25%(+0.387)#78 | 1.28%(-0.643)#4,664 |
| 79. | Covedale | 0.64% | 0.25%(+0.384)#79 | 1.28%(-0.645)#4,670 |
| 80. | Mayfield Heights | 0.64% | 0.25%(+0.382)#80 | 1.28%(-0.647)#4,680 |
| 81. | Peninsula | 0.63% | 0.25%(+0.378)#81 | 1.28%(-0.651)#4,694 |
| 82. | Turpin Hills | 0.62% | 0.25%(+0.364)#82 | 1.28%(-0.666)#4,747 |
| 83. | Rockford | 0.61% | 0.25%(+0.355)#83 | 1.28%(-0.675)#4,787 |
| 84. | Wintersville | 0.60% | 0.25%(+0.349)#84 | 1.28%(-0.681)#4,809 |
| 85. | Rio Grande | 0.58% | 0.25%(+0.331)#85 | 1.28%(-0.699)#4,888 |
| 86. | Brook Park | 0.57% | 0.25%(+0.319)#86 | 1.28%(-0.710)#4,935 |
| 87. | Blue Ash | 0.57% | 0.25%(+0.317)#87 | 1.28%(-0.713)#4,951 |
| 88. | Ashtabula | 0.56% | 0.25%(+0.307)#88 | 1.28%(-0.722)#4,999 |
| 89. | Brooklyn | 0.56% | 0.25%(+0.306)#89 | 1.28%(-0.724)#5,008 |
| 90. | Oakwood | 0.55% | 0.25%(+0.294)#90 | 1.28%(-0.736)#5,052 |
| 91. | Harrison | 0.54% | 0.25%(+0.289)#91 | 1.28%(-0.741)#5,075 |
| 92. | Lake Lakengren | 0.54% | 0.25%(+0.289)#92 | 1.28%(-0.741)#5,078 |
| 93. | Sharonville | 0.54% | 0.25%(+0.288)#93 | 1.28%(-0.741)#5,082 |
| 94. | Reading | 0.54% | 0.25%(+0.288)#94 | 1.28%(-0.742)#5,085 |
| 95. | Gahanna | 0.53% | 0.25%(+0.278)#95 | 1.28%(-0.751)#5,133 |
| 96. | North Ridgeville | 0.53% | 0.25%(+0.276)#96 | 1.28%(-0.753)#5,138 |
| 97. | Somerset | 0.52% | 0.25%(+0.265)#97 | 1.28%(-0.765)#5,186 |
| 98. | Sidney | 0.52% | 0.25%(+0.262)#98 | 1.28%(-0.767)#5,193 |
| 99. | Harveysburg | 0.51% | 0.25%(+0.261)#99 | 1.28%(-0.768)#5,199 |
| 100. | Columbus | 0.51% | 0.25%(+0.261)#100 | 1.28%(-0.769)#5,204 |
Common Questions
What are the Top 10 Cities with the Highest Percentage of South American Population in Ohio?
Top 10 Cities with the Highest Percentage of South American Population in Ohio are:
#1
36.95%
#2
11.20%
#3
6.37%
#4
5.31%
#5
4.62%
#6
4.56%
#7
4.53%
#8
2.97%
#9
2.72%
#10
2.54%
What city has the Highest Percentage of South American Population in Ohio?
Mitiwanga has the Highest Percentage of South American Population in Ohio with 36.95%.
What is the Percentage of South American Population in the State of Ohio?
Percentage of South American Population in Ohio is 0.25%.
What is the Percentage of South American Population in the United States?
Percentage of South American Population in the United States is 1.28%.