Cities with the Highest Percentage of Ghanaian Population in Ohio
RELATED REPORTS & OPTIONS
Ghanaian
Ohio
Compare Cities
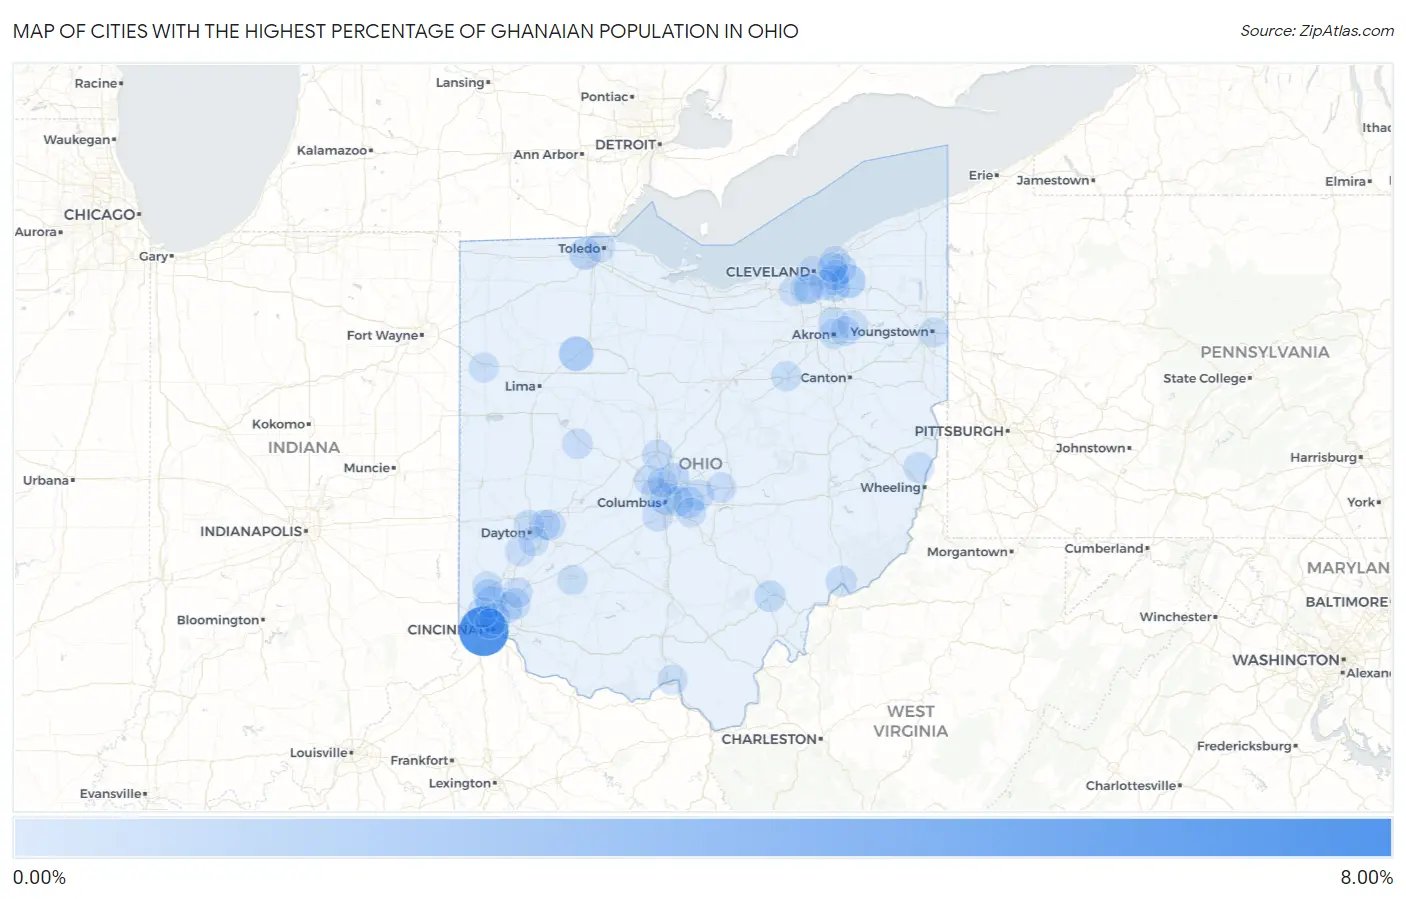
Map of Cities with the Highest Percentage of Ghanaian Population in Ohio
0.00%
8.00%
Cities with the Highest Percentage of Ghanaian Population in Ohio
| City | Ghanaian | vs State | vs National | |
| 1. | Delshire | 7.22% | 0.085%(+7.13)#1 | 0.056%(+7.16)#2 |
| 2. | Rawson | 1.59% | 0.085%(+1.51)#2 | 0.056%(+1.54)#72 |
| 3. | Chagrin Falls | 1.31% | 0.085%(+1.23)#3 | 0.056%(+1.26)#95 |
| 4. | Holland | 0.70% | 0.085%(+0.619)#4 | 0.056%(+0.649)#181 |
| 5. | Forest Park | 0.64% | 0.085%(+0.555)#5 | 0.056%(+0.584)#204 |
| 6. | Columbus | 0.63% | 0.085%(+0.546)#6 | 0.056%(+0.575)#206 |
| 7. | Westerville | 0.58% | 0.085%(+0.498)#7 | 0.056%(+0.527)#226 |
| 8. | Fairfield | 0.51% | 0.085%(+0.424)#8 | 0.056%(+0.453)#262 |
| 9. | Reynoldsburg | 0.47% | 0.085%(+0.381)#9 | 0.056%(+0.411)#282 |
| 10. | Parma Heights | 0.45% | 0.085%(+0.369)#10 | 0.056%(+0.398)#290 |
| 11. | Athens | 0.44% | 0.085%(+0.355)#11 | 0.056%(+0.385)#295 |
| 12. | St Bernard | 0.42% | 0.085%(+0.337)#12 | 0.056%(+0.366)#304 |
| 13. | Bedford Heights | 0.40% | 0.085%(+0.317)#13 | 0.056%(+0.346)#317 |
| 14. | Dillonvale | 0.31% | 0.085%(+0.228)#14 | 0.056%(+0.257)#376 |
| 15. | Cuyahoga Falls | 0.30% | 0.085%(+0.217)#15 | 0.056%(+0.246)#384 |
| 16. | Marietta | 0.29% | 0.085%(+0.207)#16 | 0.056%(+0.236)#389 |
| 17. | Pataskala | 0.29% | 0.085%(+0.201)#17 | 0.056%(+0.230)#395 |
| 18. | Fairborn | 0.28% | 0.085%(+0.196)#18 | 0.056%(+0.225)#402 |
| 19. | Sixteen Mile Stand | 0.27% | 0.085%(+0.187)#19 | 0.056%(+0.216)#413 |
| 20. | Delaware | 0.25% | 0.085%(+0.165)#20 | 0.056%(+0.194)#430 |
| 21. | Blue Ash | 0.25% | 0.085%(+0.162)#21 | 0.056%(+0.192)#436 |
| 22. | Richmond Heights | 0.21% | 0.085%(+0.129)#22 | 0.056%(+0.159)#483 |
| 23. | White Oak | 0.20% | 0.085%(+0.114)#23 | 0.056%(+0.143)#502 |
| 24. | Mayfield Heights | 0.20% | 0.085%(+0.113)#24 | 0.056%(+0.143)#503 |
| 25. | Wright Patterson Afb | 0.19% | 0.085%(+0.108)#25 | 0.056%(+0.137)#512 |
| 26. | Granville | 0.16% | 0.085%(+0.071)#26 | 0.056%(+0.100)#574 |
| 27. | Grove City | 0.15% | 0.085%(+0.062)#27 | 0.056%(+0.091)#588 |
| 28. | Bellefontaine | 0.15% | 0.085%(+0.060)#28 | 0.056%(+0.089)#591 |
| 29. | Portsmouth | 0.14% | 0.085%(+0.058)#29 | 0.056%(+0.087)#599 |
| 30. | Wilmington | 0.14% | 0.085%(+0.057)#30 | 0.056%(+0.086)#604 |
| 31. | Warrensville Heights | 0.12% | 0.085%(+0.032)#31 | 0.056%(+0.061)#664 |
| 32. | Upper Arlington | 0.12% | 0.085%(+0.030)#32 | 0.056%(+0.059)#673 |
| 33. | Whitehall | 0.10% | 0.085%(+0.020)#33 | 0.056%(+0.049)#697 |
| 34. | Dublin | 0.094% | 0.085%(+0.009)#34 | 0.056%(+0.038)#729 |
| 35. | Beachwood | 0.094% | 0.085%(+0.009)#35 | 0.056%(+0.038)#732 |
| 36. | Wooster | 0.093% | 0.085%(+0.007)#36 | 0.056%(+0.037)#739 |
| 37. | Dayton | 0.092% | 0.085%(+0.007)#37 | 0.056%(+0.037)#740 |
| 38. | Mason | 0.092% | 0.085%(+0.007)#38 | 0.056%(+0.036)#744 |
| 39. | Hamilton | 0.081% | 0.085%(-0.004)#39 | 0.056%(+0.025)#794 |
| 40. | Cincinnati | 0.080% | 0.085%(-0.006)#40 | 0.056%(+0.024)#797 |
| 41. | Akron | 0.078% | 0.085%(-0.007)#41 | 0.056%(+0.022)#810 |
| 42. | Miamisburg | 0.075% | 0.085%(-0.010)#42 | 0.056%(+0.019)#822 |
| 43. | Van Wert | 0.065% | 0.085%(-0.021)#43 | 0.056%(+0.009)#867 |
| 44. | Cleveland | 0.064% | 0.085%(-0.021)#44 | 0.056%(+0.008)#870 |
| 45. | Toledo | 0.062% | 0.085%(-0.023)#45 | 0.056%(+0.006)#876 |
| 46. | Worthington | 0.060% | 0.085%(-0.025)#46 | 0.056%(+0.004)#888 |
| 47. | Berea | 0.059% | 0.085%(-0.026)#47 | 0.056%(+0.003)#891 |
| 48. | Garfield Heights | 0.047% | 0.085%(-0.038)#48 | 0.056%(-0.009)#943 |
| 49. | South Euclid | 0.046% | 0.085%(-0.039)#49 | 0.056%(-0.010)#951 |
| 50. | Kettering | 0.043% | 0.085%(-0.042)#50 | 0.056%(-0.013)#969 |
| 51. | Kent | 0.040% | 0.085%(-0.045)#51 | 0.056%(-0.016)#986 |
| 52. | Youngstown | 0.040% | 0.085%(-0.045)#52 | 0.056%(-0.016)#989 |
| 53. | Pickerington | 0.039% | 0.085%(-0.047)#53 | 0.056%(-0.017)#997 |
| 54. | Tallmadge | 0.038% | 0.085%(-0.047)#54 | 0.056%(-0.018)#999 |
| 55. | Parma | 0.015% | 0.085%(-0.070)#55 | 0.056%(-0.041)#1,177 |
Common Questions
What are the Top 10 Cities with the Highest Percentage of Ghanaian Population in Ohio?
Top 10 Cities with the Highest Percentage of Ghanaian Population in Ohio are:
#1
7.22%
#2
1.59%
#3
1.31%
#4
0.70%
#5
0.64%
#6
0.63%
#7
0.58%
#8
0.51%
#9
0.47%
#10
0.45%
What city has the Highest Percentage of Ghanaian Population in Ohio?
Delshire has the Highest Percentage of Ghanaian Population in Ohio with 7.22%.
What is the Percentage of Ghanaian Population in the State of Ohio?
Percentage of Ghanaian Population in Ohio is 0.085%.
What is the Percentage of Ghanaian Population in the United States?
Percentage of Ghanaian Population in the United States is 0.056%.