Cities with the Largest Chilean Community in Ohio
RELATED REPORTS & OPTIONS
Chilean
Ohio
Compare Cities
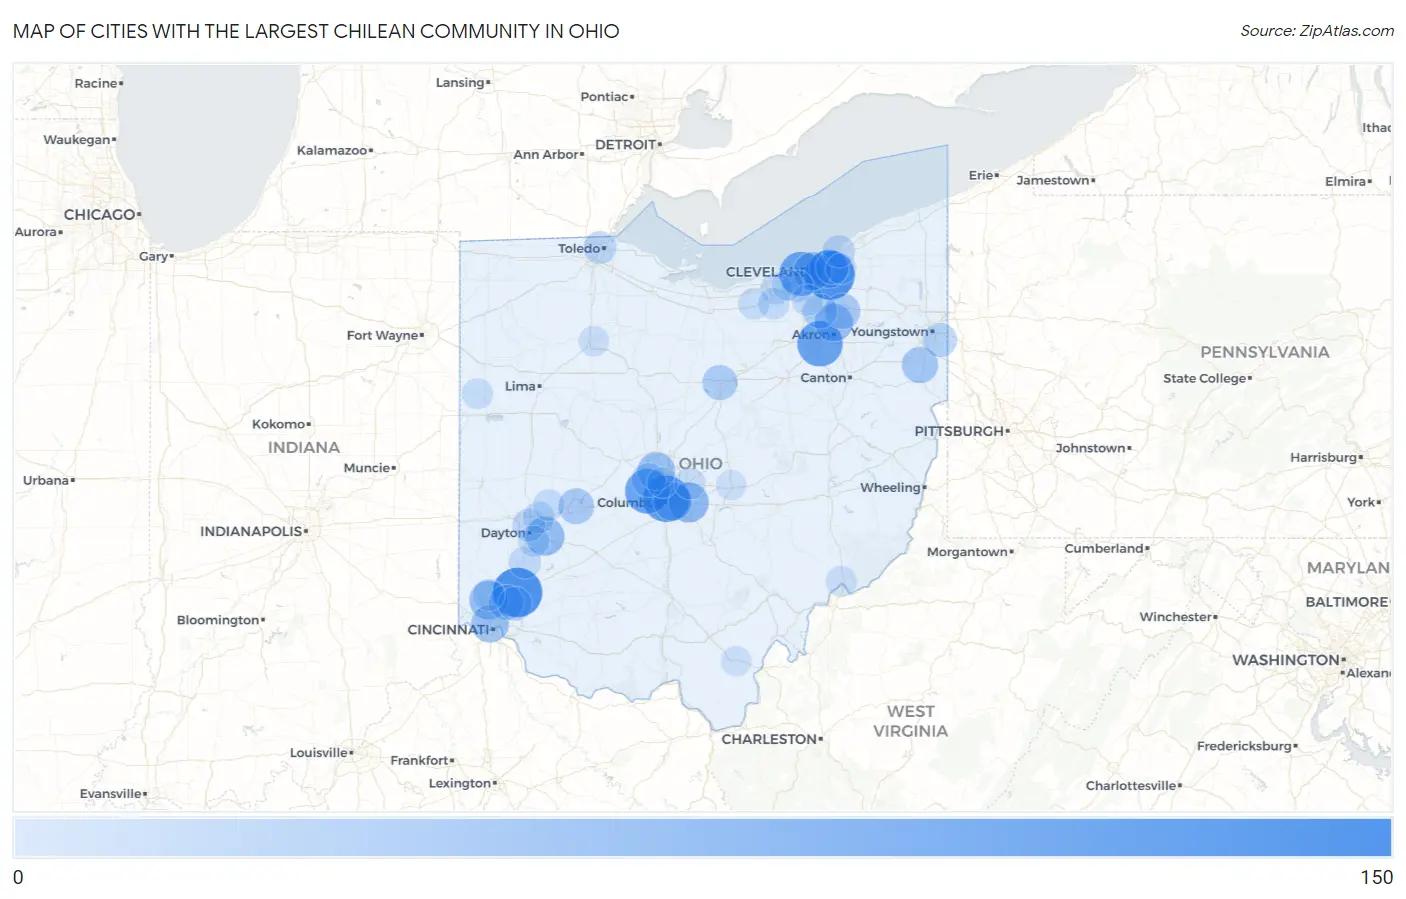
Map of Cities with the Largest Chilean Community in Ohio
0
150
Cities with the Largest Chilean Community in Ohio
| City | Chilean | vs State | vs National | |
| 1. | Mason | 141 | 2,319(6.08%)#1 | 182,671(0.08%)#242 |
| 2. | Shaker Heights | 141 | 2,319(6.08%)#2 | 182,671(0.08%)#244 |
| 3. | Columbus | 120 | 2,319(5.17%)#3 | 182,671(0.07%)#300 |
| 4. | Norton | 111 | 2,319(4.79%)#4 | 182,671(0.06%)#326 |
| 5. | Hilliard | 106 | 2,319(4.57%)#5 | 182,671(0.06%)#341 |
| 6. | Lakewood | 101 | 2,319(4.36%)#6 | 182,671(0.06%)#360 |
| 7. | Reynoldsburg | 70 | 2,319(3.02%)#7 | 182,671(0.04%)#528 |
| 8. | Beavercreek | 62 | 2,319(2.67%)#8 | 182,671(0.03%)#589 |
| 9. | Pleasant Run Farm | 61 | 2,319(2.63%)#9 | 182,671(0.03%)#612 |
| 10. | Cleveland Heights | 60 | 2,319(2.59%)#10 | 182,671(0.03%)#615 |
| 11. | Bexley | 60 | 2,319(2.59%)#11 | 182,671(0.03%)#622 |
| 12. | Cleveland | 58 | 2,319(2.50%)#12 | 182,671(0.03%)#631 |
| 13. | Cuyahoga Falls | 57 | 2,319(2.46%)#13 | 182,671(0.03%)#648 |
| 14. | Powell | 55 | 2,319(2.37%)#14 | 182,671(0.03%)#666 |
| 15. | Cincinnati | 54 | 2,319(2.33%)#15 | 182,671(0.03%)#671 |
| 16. | Leetonia | 44 | 2,319(1.90%)#16 | 182,671(0.02%)#799 |
| 17. | Springfield | 40 | 2,319(1.72%)#17 | 182,671(0.02%)#838 |
| 18. | Hudson | 38 | 2,319(1.64%)#18 | 182,671(0.02%)#885 |
| 19. | Sharonville | 36 | 2,319(1.55%)#19 | 182,671(0.02%)#930 |
| 20. | Mansfield | 35 | 2,319(1.51%)#20 | 182,671(0.02%)#938 |
| 21. | Richfield | 32 | 2,319(1.38%)#21 | 182,671(0.02%)#1,003 |
| 22. | Dublin | 28 | 2,319(1.21%)#22 | 182,671(0.02%)#1,072 |
| 23. | Struthers | 27 | 2,319(1.16%)#23 | 182,671(0.01%)#1,096 |
| 24. | Sixteen Mile Stand | 26 | 2,319(1.12%)#24 | 182,671(0.01%)#1,121 |
| 25. | South Euclid | 23 | 2,319(0.99%)#25 | 182,671(0.01%)#1,181 |
| 26. | Toledo | 19 | 2,319(0.82%)#26 | 182,671(0.01%)#1,282 |
| 27. | Dayton | 18 | 2,319(0.78%)#27 | 182,671(0.01%)#1,309 |
| 28. | Willowick | 17 | 2,319(0.73%)#28 | 182,671(0.01%)#1,365 |
| 29. | Springboro | 14 | 2,319(0.60%)#29 | 182,671(0.01%)#1,468 |
| 30. | Fairfield | 12 | 2,319(0.52%)#30 | 182,671(0.01%)#1,526 |
| 31. | Huber Heights | 11 | 2,319(0.47%)#31 | 182,671(0.01%)#1,575 |
| 32. | North Ridgeville | 11 | 2,319(0.47%)#32 | 182,671(0.01%)#1,580 |
| 33. | Brook Park | 11 | 2,319(0.47%)#33 | 182,671(0.01%)#1,588 |
| 34. | North Royalton | 10 | 2,319(0.43%)#34 | 182,671(0.01%)#1,623 |
| 35. | New Carlisle | 10 | 2,319(0.43%)#35 | 182,671(0.01%)#1,649 |
| 36. | Oberlin | 9 | 2,319(0.39%)#36 | 182,671(0.00%)#1,692 |
| 37. | Grafton | 9 | 2,319(0.39%)#37 | 182,671(0.00%)#1,695 |
| 38. | Kettering | 8 | 2,319(0.34%)#38 | 182,671(0.00%)#1,706 |
| 39. | North Olmsted | 8 | 2,319(0.34%)#39 | 182,671(0.00%)#1,715 |
| 40. | New Albany | 7 | 2,319(0.30%)#40 | 182,671(0.00%)#1,777 |
| 41. | Rockford | 6 | 2,319(0.26%)#41 | 182,671(0.00%)#1,838 |
| 42. | Marietta | 5 | 2,319(0.22%)#42 | 182,671(0.00%)#1,851 |
| 43. | Findlay | 4 | 2,319(0.17%)#43 | 182,671(0.00%)#1,884 |
| 44. | Mayfield Heights | 4 | 2,319(0.17%)#44 | 182,671(0.00%)#1,889 |
| 45. | Worthington | 4 | 2,319(0.17%)#45 | 182,671(0.00%)#1,893 |
| 46. | Newark | 3 | 2,319(0.13%)#46 | 182,671(0.00%)#1,924 |
| 47. | Rio Grande | 2 | 2,319(0.09%)#47 | 182,671(0.00%)#1,976 |
Common Questions
What are the Top 10 Cities with the Largest Chilean Community in Ohio?
Top 10 Cities with the Largest Chilean Community in Ohio are:
#1
141
#2
141
#3
120
#4
111
#5
106
#6
101
#7
70
#8
62
#9
61
#10
60
What city has the Largest Chilean Community in Ohio?
Mason has the Largest Chilean Community in Ohio with 141.
What is the Total Chilean Population in the State of Ohio?
Total Chilean Population in Ohio is 2,319.
What is the Total Chilean Population in the United States?
Total Chilean Population in the United States is 182,671.