Cities with the Highest Percentage of Immigrants from Latvia in Ohio
RELATED REPORTS & OPTIONS
Latvia
Ohio
Compare Cities
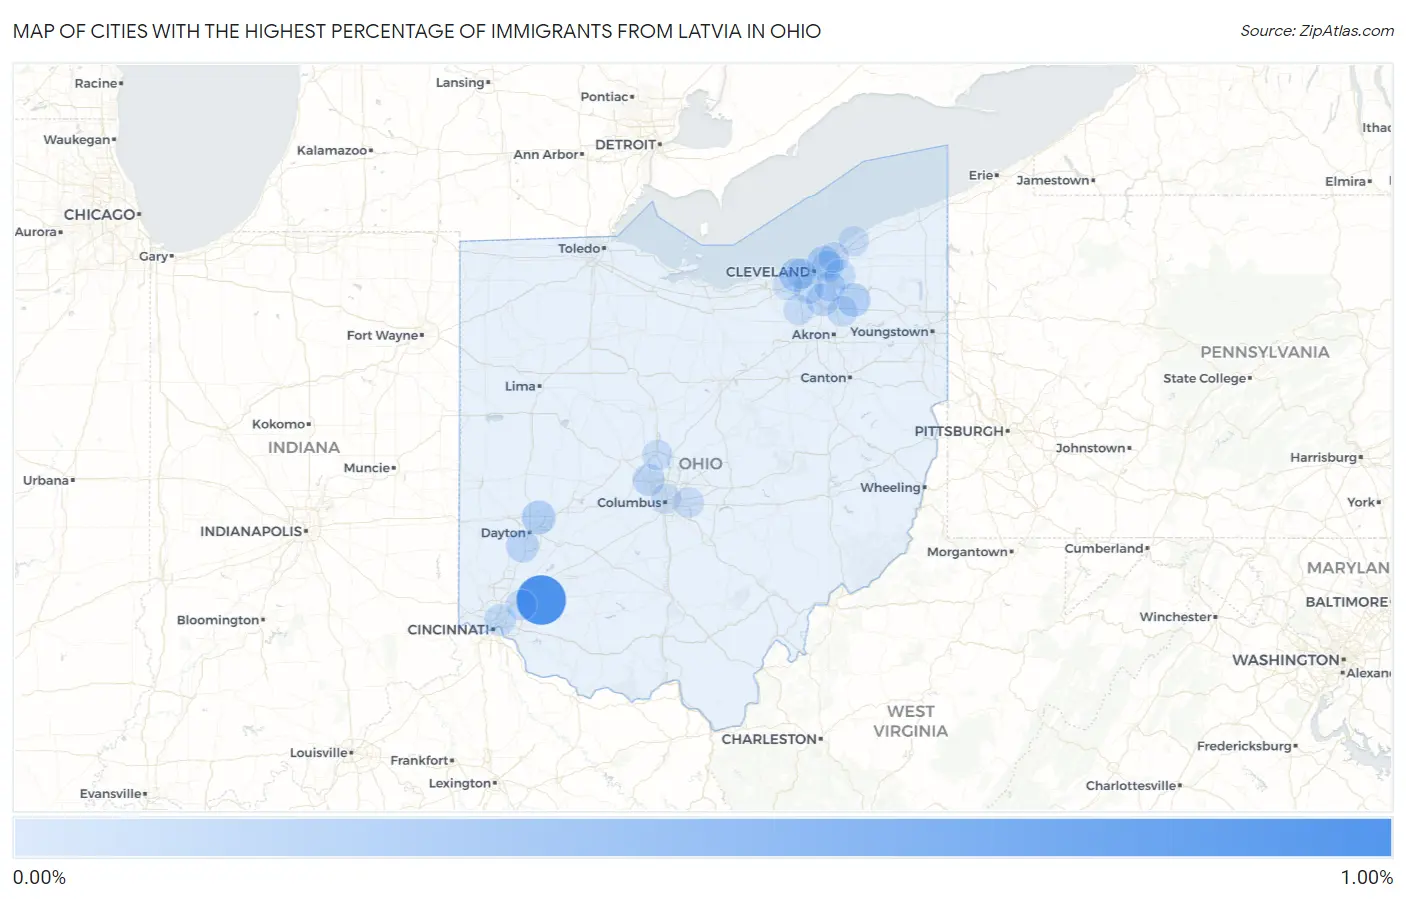
Map of Cities with the Highest Percentage of Immigrants from Latvia in Ohio
0.00%
1.00%
Cities with the Highest Percentage of Immigrants from Latvia in Ohio
| City | Latvia | vs State | vs National | |
| 1. | Butlerville | 0.94% | 0.0042%(+0.935)#1 | 0.0071%(+0.932)#16 |
| 2. | Huber Heights | 0.18% | 0.0042%(+0.172)#2 | 0.0071%(+0.169)#148 |
| 3. | Aurora | 0.16% | 0.0042%(+0.153)#3 | 0.0071%(+0.150)#161 |
| 4. | Rocky River | 0.15% | 0.0042%(+0.149)#4 | 0.0071%(+0.146)#166 |
| 5. | Bratenahl | 0.14% | 0.0042%(+0.136)#5 | 0.0071%(+0.134)#175 |
| 6. | West Carrollton | 0.11% | 0.0042%(+0.111)#6 | 0.0071%(+0.108)#203 |
| 7. | Brecksville | 0.095% | 0.0042%(+0.091)#7 | 0.0071%(+0.088)#229 |
| 8. | Dublin | 0.090% | 0.0042%(+0.086)#8 | 0.0071%(+0.083)#236 |
| 9. | East Cleveland | 0.072% | 0.0042%(+0.068)#9 | 0.0071%(+0.065)#272 |
| 10. | Norwood | 0.063% | 0.0042%(+0.059)#10 | 0.0071%(+0.056)#293 |
| 11. | Pepper Pike | 0.044% | 0.0042%(+0.040)#11 | 0.0071%(+0.037)#356 |
| 12. | Maple Heights | 0.038% | 0.0042%(+0.034)#12 | 0.0071%(+0.031)#372 |
| 13. | Loveland | 0.038% | 0.0042%(+0.034)#13 | 0.0071%(+0.031)#374 |
| 14. | Euclid | 0.032% | 0.0042%(+0.028)#14 | 0.0071%(+0.025)#401 |
| 15. | Brunswick | 0.028% | 0.0042%(+0.024)#15 | 0.0071%(+0.021)#423 |
| 16. | Hudson | 0.026% | 0.0042%(+0.022)#16 | 0.0071%(+0.019)#434 |
| 17. | Delaware | 0.024% | 0.0042%(+0.020)#17 | 0.0071%(+0.017)#451 |
| 18. | Parma | 0.024% | 0.0042%(+0.019)#18 | 0.0071%(+0.016)#453 |
| 19. | Reynoldsburg | 0.017% | 0.0042%(+0.013)#19 | 0.0071%(+0.010)#492 |
| 20. | Mentor | 0.013% | 0.0042%(+0.008)#20 | 0.0071%(+0.006)#542 |
| 21. | Lakewood | 0.012% | 0.0042%(+0.008)#21 | 0.0071%(+0.005)#552 |
| 22. | North Olmsted | 0.0031% | 0.0042%(-0.001)#22 | 0.0071%(-0.004)#637 |
| 23. | Columbus | 0.0013% | 0.0042%(-0.003)#23 | 0.0071%(-0.006)#650 |
Common Questions
What are the Top 10 Cities with the Highest Percentage of Immigrants from Latvia in Ohio?
Top 10 Cities with the Highest Percentage of Immigrants from Latvia in Ohio are:
#1
0.94%
#2
0.18%
#3
0.16%
#4
0.15%
#5
0.14%
#6
0.11%
#7
0.095%
#8
0.090%
#9
0.072%
#10
0.063%
What city has the Highest Percentage of Immigrants from Latvia in Ohio?
Butlerville has the Highest Percentage of Immigrants from Latvia in Ohio with 0.94%.
What is the Percentage of Immigrants from Latvia in the State of Ohio?
Percentage of Immigrants from Latvia in Ohio is 0.0042%.
What is the Percentage of Immigrants from Latvia in the United States?
Percentage of Immigrants from Latvia in the United States is 0.0071%.