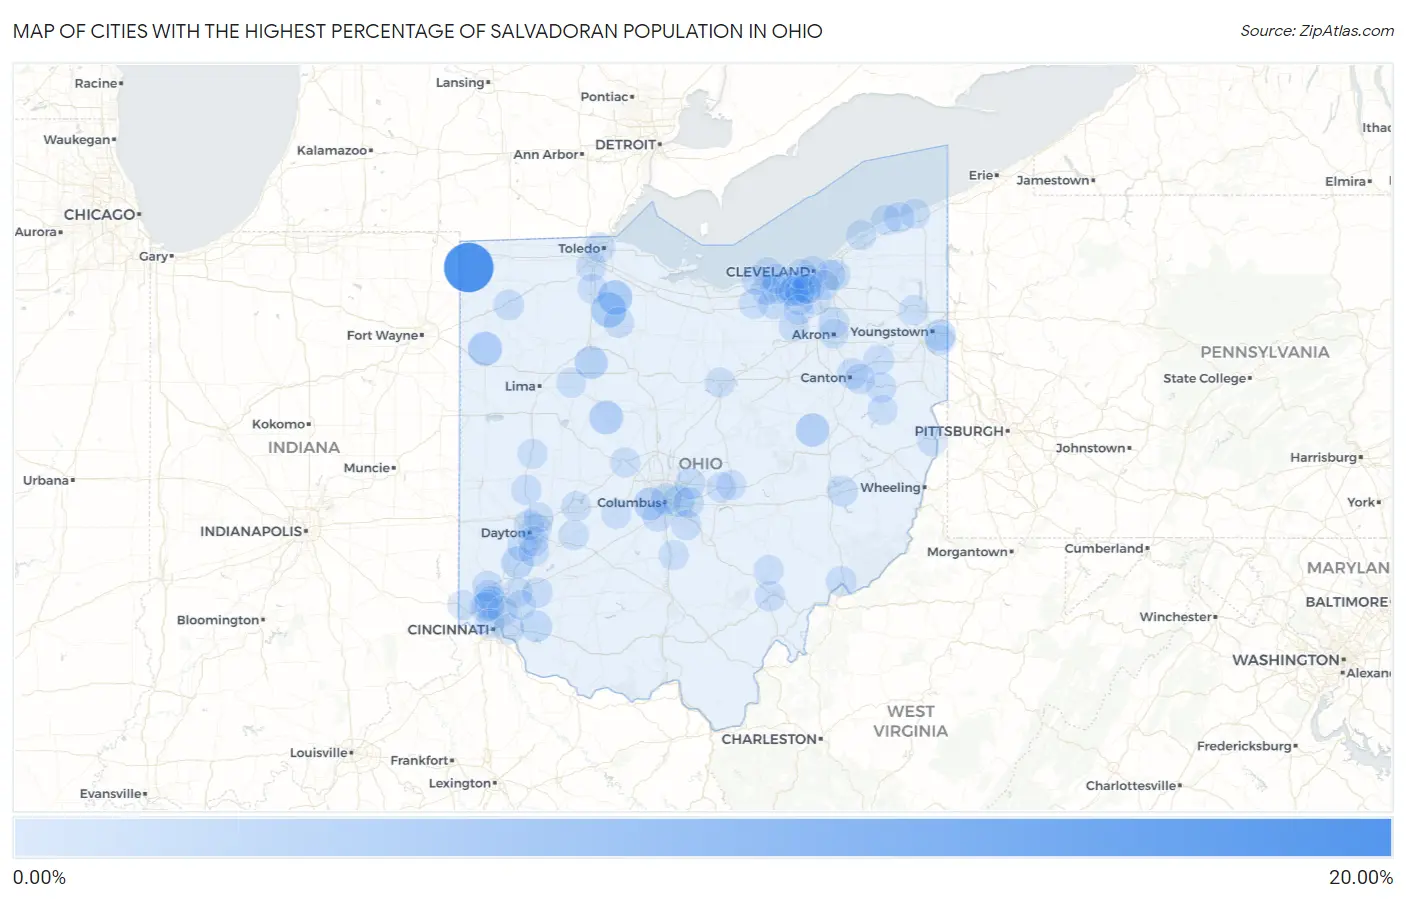
Cities with the Highest Percentage of Salvadoran Population in Ohio
RELATED REPORTS & OPTIONS
Salvadoran
Ohio
Compare Cities
Map of Cities with the Highest Percentage of Salvadoran Population in Ohio
0.00%
20.00%
Cities with the Highest Percentage of Salvadoran Population in Ohio
| City | Salvadoran | vs State | vs National | |
| 1. | Blakeslee | 15.62% | 0.12%(+15.5)#1 | 0.72%(+14.9)#75 |
| 2. | West Millgrove | 3.64% | 0.12%(+3.52)#2 | 0.72%(+2.91)#493 |
| 3. | Bradner | 3.34% | 0.12%(+3.22)#3 | 0.72%(+2.62)#556 |
| 4. | Scott | 3.10% | 0.12%(+2.98)#4 | 0.72%(+2.38)#591 |
| 5. | Mount Victory | 2.71% | 0.12%(+2.59)#5 | 0.72%(+1.99)#696 |
| 6. | Baltic | 2.57% | 0.12%(+2.45)#6 | 0.72%(+1.85)#732 |
| 7. | Arlington | 2.23% | 0.12%(+2.11)#7 | 0.72%(+1.51)#841 |
| 8. | Lincoln Village | 2.04% | 0.12%(+1.92)#8 | 0.72%(+1.32)#896 |
| 9. | Forest Park | 1.72% | 0.12%(+1.61)#9 | 0.72%(+1.00)#1,035 |
| 10. | Franklin | 1.63% | 0.12%(+1.51)#10 | 0.72%(+0.906)#1,101 |
| 11. | Campbell | 1.16% | 0.12%(+1.05)#11 | 0.72%(+0.442)#1,437 |
| 12. | Owensville | 1.14% | 0.12%(+1.02)#12 | 0.72%(+0.420)#1,452 |
| 13. | Whitehall | 1.13% | 0.12%(+1.01)#13 | 0.72%(+0.406)#1,464 |
| 14. | Turpin Hills | 0.65% | 0.12%(+0.533)#14 | 0.72%(-0.070)#2,141 |
| 15. | Cuyahoga Falls | 0.64% | 0.12%(+0.520)#15 | 0.72%(-0.083)#2,170 |
| 16. | Old Washington | 0.62% | 0.12%(+0.505)#16 | 0.72%(-0.098)#2,199 |
| 17. | Columbus | 0.58% | 0.12%(+0.465)#17 | 0.72%(-0.139)#2,294 |
| 18. | Grafton | 0.56% | 0.12%(+0.440)#18 | 0.72%(-0.163)#2,345 |
| 19. | Canton | 0.55% | 0.12%(+0.431)#19 | 0.72%(-0.172)#2,365 |
| 20. | North Ridgeville | 0.53% | 0.12%(+0.412)#20 | 0.72%(-0.192)#2,417 |
| 21. | New Burlington | 0.51% | 0.12%(+0.389)#21 | 0.72%(-0.214)#2,462 |
| 22. | Defiance | 0.50% | 0.12%(+0.386)#22 | 0.72%(-0.217)#2,471 |
| 23. | Beachwood | 0.49% | 0.12%(+0.373)#23 | 0.72%(-0.231)#2,496 |
| 24. | West Carrollton | 0.48% | 0.12%(+0.364)#24 | 0.72%(-0.239)#2,525 |
| 25. | Hamilton | 0.48% | 0.12%(+0.363)#25 | 0.72%(-0.240)#2,527 |
| 26. | New Albany | 0.46% | 0.12%(+0.338)#26 | 0.72%(-0.265)#2,596 |
| 27. | Brook Park | 0.44% | 0.12%(+0.325)#27 | 0.72%(-0.279)#2,629 |
| 28. | Fostoria | 0.44% | 0.12%(+0.323)#28 | 0.72%(-0.280)#2,630 |
| 29. | Reynoldsburg | 0.40% | 0.12%(+0.282)#29 | 0.72%(-0.321)#2,758 |
| 30. | Medina | 0.39% | 0.12%(+0.273)#30 | 0.72%(-0.331)#2,786 |
| 31. | North Madison | 0.38% | 0.12%(+0.267)#31 | 0.72%(-0.337)#2,814 |
| 32. | Riverside | 0.38% | 0.12%(+0.258)#32 | 0.72%(-0.346)#2,851 |
| 33. | Geneva On The Lake | 0.37% | 0.12%(+0.250)#33 | 0.72%(-0.353)#2,876 |
| 34. | Struthers | 0.36% | 0.12%(+0.240)#34 | 0.72%(-0.364)#2,922 |
| 35. | Centerville | 0.35% | 0.12%(+0.237)#35 | 0.72%(-0.367)#2,937 |
| 36. | Grove City | 0.34% | 0.12%(+0.225)#36 | 0.72%(-0.379)#2,974 |
| 37. | Marietta | 0.32% | 0.12%(+0.203)#37 | 0.72%(-0.400)#3,054 |
| 38. | Athens | 0.31% | 0.12%(+0.195)#38 | 0.72%(-0.409)#3,086 |
| 39. | Perrysburg | 0.30% | 0.12%(+0.179)#39 | 0.72%(-0.424)#3,155 |
| 40. | North Olmsted | 0.28% | 0.12%(+0.164)#40 | 0.72%(-0.439)#3,219 |
| 41. | Minerva | 0.25% | 0.12%(+0.128)#41 | 0.72%(-0.475)#3,364 |
| 42. | Granville | 0.24% | 0.12%(+0.124)#42 | 0.72%(-0.479)#3,386 |
| 43. | Alliance | 0.24% | 0.12%(+0.122)#43 | 0.72%(-0.481)#3,397 |
| 44. | Shaker Heights | 0.24% | 0.12%(+0.122)#44 | 0.72%(-0.482)#3,401 |
| 45. | Northbrook | 0.23% | 0.12%(+0.114)#45 | 0.72%(-0.490)#3,433 |
| 46. | Cleveland | 0.23% | 0.12%(+0.110)#46 | 0.72%(-0.494)#3,456 |
| 47. | Morrow | 0.21% | 0.12%(+0.096)#47 | 0.72%(-0.508)#3,535 |
| 48. | Sheffield Lake | 0.21% | 0.12%(+0.094)#48 | 0.72%(-0.510)#3,549 |
| 49. | Dayton | 0.20% | 0.12%(+0.081)#49 | 0.72%(-0.522)#3,603 |
| 50. | Broadview Heights | 0.19% | 0.12%(+0.068)#50 | 0.72%(-0.535)#3,664 |
| 51. | Strongsville | 0.18% | 0.12%(+0.066)#51 | 0.72%(-0.538)#3,677 |
| 52. | Troy | 0.18% | 0.12%(+0.059)#52 | 0.72%(-0.544)#3,711 |
| 53. | Lithopolis | 0.17% | 0.12%(+0.048)#53 | 0.72%(-0.555)#3,760 |
| 54. | Grand River | 0.15% | 0.12%(+0.029)#54 | 0.72%(-0.574)#3,838 |
| 55. | Elyria | 0.14% | 0.12%(+0.024)#55 | 0.72%(-0.580)#3,881 |
| 56. | East Canton | 0.14% | 0.12%(+0.023)#56 | 0.72%(-0.581)#3,892 |
| 57. | Cedarville | 0.13% | 0.12%(+0.009)#57 | 0.72%(-0.594)#3,986 |
| 58. | Mason | 0.13% | 0.12%(+0.008)#58 | 0.72%(-0.595)#3,992 |
| 59. | Avon | 0.12% | 0.12%(+0.007)#59 | 0.72%(-0.597)#4,001 |
| 60. | Marysville | 0.12% | 0.12%(-0.002)#60 | 0.72%(-0.605)#4,051 |
| 61. | Brooklyn | 0.12% | 0.12%(-0.003)#61 | 0.72%(-0.606)#4,054 |
| 62. | Reading | 0.11% | 0.12%(-0.004)#62 | 0.72%(-0.608)#4,067 |
| 63. | Harrison | 0.099% | 0.12%(-0.019)#63 | 0.72%(-0.622)#4,177 |
| 64. | Parma | 0.097% | 0.12%(-0.021)#64 | 0.72%(-0.625)#4,192 |
| 65. | Steubenville | 0.094% | 0.12%(-0.025)#65 | 0.72%(-0.628)#4,213 |
| 66. | Olmsted Falls | 0.092% | 0.12%(-0.026)#66 | 0.72%(-0.629)#4,218 |
| 67. | Ashtabula | 0.089% | 0.12%(-0.029)#67 | 0.72%(-0.633)#4,242 |
| 68. | Berea | 0.086% | 0.12%(-0.032)#68 | 0.72%(-0.635)#4,260 |
| 69. | Ada | 0.079% | 0.12%(-0.040)#69 | 0.72%(-0.643)#4,311 |
| 70. | Bowling Green | 0.076% | 0.12%(-0.042)#70 | 0.72%(-0.645)#4,323 |
| 71. | Oberlin | 0.073% | 0.12%(-0.045)#71 | 0.72%(-0.648)#4,345 |
| 72. | Huber Heights | 0.070% | 0.12%(-0.049)#72 | 0.72%(-0.652)#4,375 |
| 73. | Middleburg Heights | 0.069% | 0.12%(-0.049)#73 | 0.72%(-0.653)#4,380 |
| 74. | Lorain | 0.066% | 0.12%(-0.052)#74 | 0.72%(-0.656)#4,398 |
| 75. | Brunswick | 0.065% | 0.12%(-0.053)#75 | 0.72%(-0.657)#4,409 |
| 76. | Glouster | 0.064% | 0.12%(-0.054)#76 | 0.72%(-0.658)#4,419 |
| 77. | London | 0.058% | 0.12%(-0.060)#77 | 0.72%(-0.664)#4,474 |
| 78. | Fairfield | 0.056% | 0.12%(-0.062)#78 | 0.72%(-0.666)#4,484 |
| 79. | Lakewood | 0.055% | 0.12%(-0.063)#79 | 0.72%(-0.666)#4,487 |
| 80. | Toledo | 0.051% | 0.12%(-0.067)#80 | 0.72%(-0.670)#4,513 |
| 81. | Warren | 0.048% | 0.12%(-0.070)#81 | 0.72%(-0.673)#4,542 |
| 82. | Garfield Heights | 0.047% | 0.12%(-0.071)#82 | 0.72%(-0.674)#4,549 |
| 83. | Loveland | 0.045% | 0.12%(-0.073)#83 | 0.72%(-0.676)#4,566 |
| 84. | Sidney | 0.044% | 0.12%(-0.074)#84 | 0.72%(-0.677)#4,571 |
| 85. | Parma Heights | 0.043% | 0.12%(-0.075)#85 | 0.72%(-0.678)#4,578 |
| 86. | Newark | 0.038% | 0.12%(-0.080)#86 | 0.72%(-0.684)#4,622 |
| 87. | Mansfield | 0.038% | 0.12%(-0.080)#87 | 0.72%(-0.684)#4,624 |
| 88. | Carrollton | 0.031% | 0.12%(-0.088)#88 | 0.72%(-0.691)#4,659 |
| 89. | Circleville | 0.021% | 0.12%(-0.097)#89 | 0.72%(-0.700)#4,716 |
| 90. | Cincinnati | 0.021% | 0.12%(-0.097)#90 | 0.72%(-0.700)#4,717 |
| 91. | Kettering | 0.021% | 0.12%(-0.097)#91 | 0.72%(-0.701)#4,721 |
| 92. | Springfield | 0.020% | 0.12%(-0.098)#92 | 0.72%(-0.701)#4,724 |
| 93. | Akron | 0.0068% | 0.12%(-0.111)#93 | 0.72%(-0.715)#4,799 |
Common Questions
What are the Top 10 Cities with the Highest Percentage of Salvadoran Population in Ohio?
Top 10 Cities with the Highest Percentage of Salvadoran Population in Ohio are:
#1
15.62%
#2
3.64%
#3
3.34%
#4
3.10%
#5
2.71%
#6
2.57%
#7
2.23%
#8
2.04%
#9
1.72%
#10
1.63%
What city has the Highest Percentage of Salvadoran Population in Ohio?
Blakeslee has the Highest Percentage of Salvadoran Population in Ohio with 15.62%.
What is the Percentage of Salvadoran Population in the State of Ohio?
Percentage of Salvadoran Population in Ohio is 0.12%.
What is the Percentage of Salvadoran Population in the United States?
Percentage of Salvadoran Population in the United States is 0.72%.