Cities with the Highest Percentage of Puerto Rican Population in Ohio
RELATED REPORTS & OPTIONS
Puerto Rican
Ohio
Compare Cities
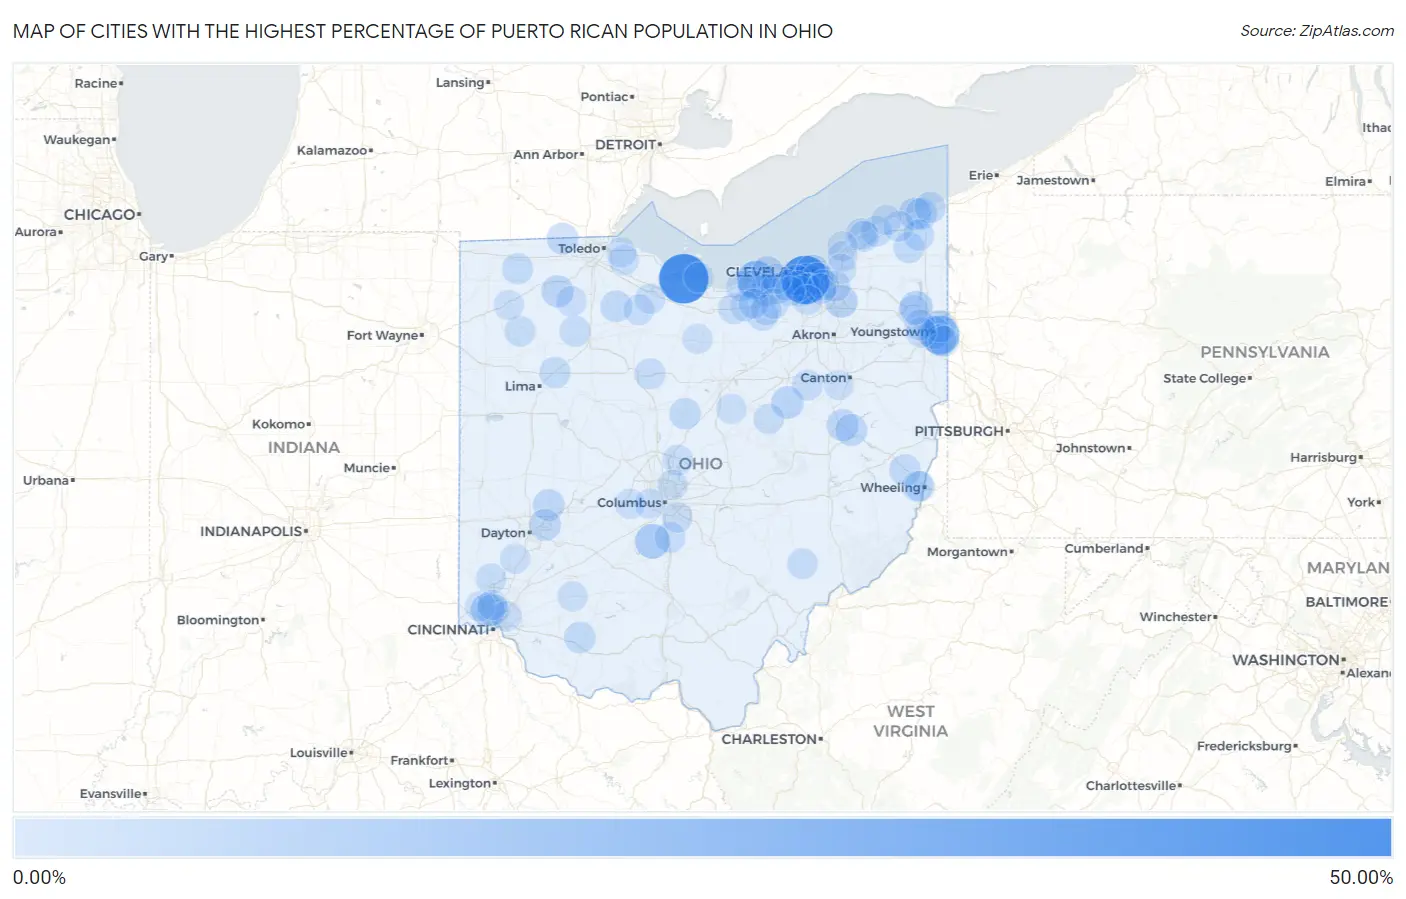
Map of Cities with the Highest Percentage of Puerto Rican Population in Ohio
0.00%
50.00%
Cities with the Highest Percentage of Puerto Rican Population in Ohio
| City | Puerto Rican | vs State | vs National | |
| 1. | Crystal Rock | 49.07% | 1.20%(+47.9)#1 | 1.78%(+47.3)#292 |
| 2. | Linndale | 46.38% | 1.20%(+45.2)#2 | 1.78%(+44.6)#298 |
| 3. | Campbell | 22.27% | 1.20%(+21.1)#3 | 1.78%(+20.5)#369 |
| 4. | Lorain | 21.46% | 1.20%(+20.3)#4 | 1.78%(+19.7)#373 |
| 5. | Darbyville | 12.83% | 1.20%(+11.6)#5 | 1.78%(+11.0)#547 |
| 6. | Skyline Acres | 9.92% | 1.20%(+8.73)#6 | 1.78%(+8.14)#699 |
| 7. | Brooklyn | 9.22% | 1.20%(+8.02)#7 | 1.78%(+7.44)#762 |
| 8. | Cleveland | 8.91% | 1.20%(+7.71)#8 | 1.78%(+7.13)#792 |
| 9. | Morgandale | 8.82% | 1.20%(+7.62)#9 | 1.78%(+7.03)#800 |
| 10. | Youngstown | 8.01% | 1.20%(+6.81)#10 | 1.78%(+6.22)#888 |
| 11. | Twinsburg Heights | 7.92% | 1.20%(+6.72)#11 | 1.78%(+6.13)#902 |
| 12. | Holmesville | 7.14% | 1.20%(+5.94)#12 | 1.78%(+5.36)#1,012 |
| 13. | Ashtabula | 7.12% | 1.20%(+5.92)#13 | 1.78%(+5.34)#1,020 |
| 14. | Pleasant Hills | 6.78% | 1.20%(+5.58)#14 | 1.78%(+4.99)#1,087 |
| 15. | Sheffield Lake | 6.41% | 1.20%(+5.21)#15 | 1.78%(+4.63)#1,163 |
| 16. | Newburgh Heights | 6.36% | 1.20%(+5.17)#16 | 1.78%(+4.58)#1,172 |
| 17. | Mcclure | 6.23% | 1.20%(+5.03)#17 | 1.78%(+4.44)#1,213 |
| 18. | Maplewood Park | 6.18% | 1.20%(+4.98)#18 | 1.78%(+4.40)#1,224 |
| 19. | New Philadelphia | 6.07% | 1.20%(+4.87)#19 | 1.78%(+4.28)#1,255 |
| 20. | Elyria | 6.06% | 1.20%(+4.86)#20 | 1.78%(+4.27)#1,258 |
| 21. | Barnhill | 5.99% | 1.20%(+4.79)#21 | 1.78%(+4.21)#1,278 |
| 22. | New Carlisle | 5.93% | 1.20%(+4.73)#22 | 1.78%(+4.15)#1,293 |
| 23. | Wright Patterson Afb | 5.79% | 1.20%(+4.59)#23 | 1.78%(+4.01)#1,337 |
| 24. | Metamora | 5.44% | 1.20%(+4.24)#24 | 1.78%(+3.66)#1,423 |
| 25. | Mowrystown | 5.42% | 1.20%(+4.22)#25 | 1.78%(+3.64)#1,427 |
| 26. | Risingsun | 5.35% | 1.20%(+4.16)#26 | 1.78%(+3.57)#1,446 |
| 27. | Edgewood | 5.32% | 1.20%(+4.12)#27 | 1.78%(+3.54)#1,456 |
| 28. | Harrisville | 5.30% | 1.20%(+4.10)#28 | 1.78%(+3.52)#1,461 |
| 29. | Struthers | 5.30% | 1.20%(+4.10)#29 | 1.78%(+3.52)#1,462 |
| 30. | Mount Gilead | 4.68% | 1.20%(+3.48)#30 | 1.78%(+2.90)#1,641 |
| 31. | Beaverdam | 4.59% | 1.20%(+3.40)#31 | 1.78%(+2.81)#1,673 |
| 32. | Pheasant Run | 4.46% | 1.20%(+3.26)#32 | 1.78%(+2.67)#1,731 |
| 33. | Parma | 4.40% | 1.20%(+3.20)#33 | 1.78%(+2.62)#1,753 |
| 34. | Amherst | 4.40% | 1.20%(+3.20)#34 | 1.78%(+2.61)#1,755 |
| 35. | Wolfhurst | 4.19% | 1.20%(+2.99)#35 | 1.78%(+2.40)#1,857 |
| 36. | Fairport Harbor | 4.16% | 1.20%(+2.96)#36 | 1.78%(+2.38)#1,870 |
| 37. | Rock Creek | 4.16% | 1.20%(+2.96)#37 | 1.78%(+2.38)#1,871 |
| 38. | Archbold | 4.12% | 1.20%(+2.92)#38 | 1.78%(+2.34)#1,893 |
| 39. | North Kingsville | 4.11% | 1.20%(+2.91)#39 | 1.78%(+2.33)#1,898 |
| 40. | Perry | 4.06% | 1.20%(+2.86)#40 | 1.78%(+2.27)#1,937 |
| 41. | Jefferson | 4.04% | 1.20%(+2.84)#41 | 1.78%(+2.25)#1,949 |
| 42. | North Ridgeville | 3.83% | 1.20%(+2.63)#42 | 1.78%(+2.04)#2,069 |
| 43. | Geneva | 3.82% | 1.20%(+2.63)#43 | 1.78%(+2.04)#2,075 |
| 44. | Mccomb | 3.77% | 1.20%(+2.57)#44 | 1.78%(+1.98)#2,113 |
| 45. | Nevada | 3.73% | 1.20%(+2.53)#45 | 1.78%(+1.95)#2,140 |
| 46. | Kidron | 3.70% | 1.20%(+2.50)#46 | 1.78%(+1.91)#2,166 |
| 47. | Continental | 3.70% | 1.20%(+2.50)#47 | 1.78%(+1.91)#2,167 |
| 48. | Painesville | 3.65% | 1.20%(+2.45)#48 | 1.78%(+1.87)#2,194 |
| 49. | Bedford Heights | 3.59% | 1.20%(+2.39)#49 | 1.78%(+1.80)#2,236 |
| 50. | Wakeman | 3.51% | 1.20%(+2.31)#50 | 1.78%(+1.72)#2,288 |
| 51. | Ashville | 3.45% | 1.20%(+2.25)#51 | 1.78%(+1.67)#2,328 |
| 52. | South Mount Vernon | 3.28% | 1.20%(+2.08)#52 | 1.78%(+1.50)#2,423 |
| 53. | Parma Heights | 3.26% | 1.20%(+2.07)#53 | 1.78%(+1.48)#2,431 |
| 54. | Mineral Ridge | 3.26% | 1.20%(+2.06)#54 | 1.78%(+1.48)#2,433 |
| 55. | Williamsdale | 3.21% | 1.20%(+2.01)#55 | 1.78%(+1.43)#2,466 |
| 56. | Stockport | 3.09% | 1.20%(+1.89)#56 | 1.78%(+1.31)#2,538 |
| 57. | Lowellville | 3.09% | 1.20%(+1.89)#57 | 1.78%(+1.30)#2,542 |
| 58. | Fairview Park | 3.07% | 1.20%(+1.87)#58 | 1.78%(+1.29)#2,548 |
| 59. | Bettsville | 3.03% | 1.20%(+1.83)#59 | 1.78%(+1.25)#2,574 |
| 60. | Middleburg Heights | 2.91% | 1.20%(+1.71)#60 | 1.78%(+1.13)#2,679 |
| 61. | Garfield Heights | 2.86% | 1.20%(+1.67)#61 | 1.78%(+1.08)#2,716 |
| 62. | North Olmsted | 2.78% | 1.20%(+1.58)#62 | 1.78%(+0.993)#2,800 |
| 63. | Milton Center | 2.66% | 1.20%(+1.46)#63 | 1.78%(+0.877)#2,890 |
| 64. | Groveport | 2.65% | 1.20%(+1.45)#64 | 1.78%(+0.866)#2,897 |
| 65. | Brook Park | 2.64% | 1.20%(+1.44)#65 | 1.78%(+0.854)#2,907 |
| 66. | Sunbury | 2.61% | 1.20%(+1.41)#66 | 1.78%(+0.828)#2,933 |
| 67. | Vermilion | 2.58% | 1.20%(+1.38)#67 | 1.78%(+0.799)#2,959 |
| 68. | Minerva Park | 2.53% | 1.20%(+1.34)#68 | 1.78%(+0.752)#3,024 |
| 69. | Independence | 2.53% | 1.20%(+1.34)#69 | 1.78%(+0.751)#3,025 |
| 70. | Clay Center | 2.52% | 1.20%(+1.32)#70 | 1.78%(+0.738)#3,044 |
| 71. | Lagrange | 2.52% | 1.20%(+1.32)#71 | 1.78%(+0.734)#3,051 |
| 72. | Silverton | 2.46% | 1.20%(+1.26)#72 | 1.78%(+0.675)#3,111 |
| 73. | Glenmont | 2.37% | 1.20%(+1.17)#73 | 1.78%(+0.590)#3,182 |
| 74. | North Royalton | 2.36% | 1.20%(+1.16)#74 | 1.78%(+0.576)#3,194 |
| 75. | Grafton | 2.34% | 1.20%(+1.14)#75 | 1.78%(+0.556)#3,210 |
| 76. | Austintown | 2.33% | 1.20%(+1.13)#76 | 1.78%(+0.543)#3,224 |
| 77. | Ballville | 2.31% | 1.20%(+1.11)#77 | 1.78%(+0.528)#3,238 |
| 78. | Willard | 2.26% | 1.20%(+1.06)#78 | 1.78%(+0.479)#3,295 |
| 79. | Lincoln Village | 2.26% | 1.20%(+1.06)#79 | 1.78%(+0.478)#3,297 |
| 80. | Dry Ridge | 2.19% | 1.20%(+0.993)#80 | 1.78%(+0.409)#3,389 |
| 81. | Butler | 2.15% | 1.20%(+0.947)#81 | 1.78%(+0.363)#3,443 |
| 82. | Woodworth | 2.14% | 1.20%(+0.941)#82 | 1.78%(+0.356)#3,447 |
| 83. | Timberlake | 2.14% | 1.20%(+0.939)#83 | 1.78%(+0.355)#3,450 |
| 84. | North Madison | 2.12% | 1.20%(+0.919)#84 | 1.78%(+0.334)#3,468 |
| 85. | Brookside | 2.11% | 1.20%(+0.907)#85 | 1.78%(+0.323)#3,482 |
| 86. | Kipton | 2.11% | 1.20%(+0.907)#86 | 1.78%(+0.323)#3,483 |
| 87. | Sandusky | 2.10% | 1.20%(+0.897)#87 | 1.78%(+0.312)#3,501 |
| 88. | Defiance | 2.07% | 1.20%(+0.873)#88 | 1.78%(+0.288)#3,533 |
| 89. | Warren | 2.05% | 1.20%(+0.855)#89 | 1.78%(+0.271)#3,556 |
| 90. | West Jefferson | 2.01% | 1.20%(+0.809)#90 | 1.78%(+0.224)#3,602 |
| 91. | Curtice | 2.00% | 1.20%(+0.801)#91 | 1.78%(+0.216)#3,612 |
| 92. | Carlisle | 1.99% | 1.20%(+0.788)#92 | 1.78%(+0.203)#3,623 |
| 93. | Martinsville | 1.97% | 1.20%(+0.776)#93 | 1.78%(+0.191)#3,639 |
| 94. | Richville | 1.95% | 1.20%(+0.754)#94 | 1.78%(+0.169)#3,679 |
| 95. | Willoughby Hills | 1.95% | 1.20%(+0.747)#95 | 1.78%(+0.163)#3,691 |
| 96. | Oberlin | 1.94% | 1.20%(+0.742)#96 | 1.78%(+0.158)#3,701 |
| 97. | Mayfield Heights | 1.93% | 1.20%(+0.730)#97 | 1.78%(+0.145)#3,727 |
| 98. | Greenhills | 1.92% | 1.20%(+0.719)#98 | 1.78%(+0.135)#3,737 |
| 99. | Olmsted Falls | 1.90% | 1.20%(+0.705)#99 | 1.78%(+0.120)#3,762 |
| 100. | Avon | 1.90% | 1.20%(+0.699)#100 | 1.78%(+0.115)#3,768 |
Common Questions
What are the Top 10 Cities with the Highest Percentage of Puerto Rican Population in Ohio?
Top 10 Cities with the Highest Percentage of Puerto Rican Population in Ohio are:
#1
49.07%
#2
46.38%
#3
22.27%
#4
21.46%
#5
12.83%
#6
9.92%
#7
9.22%
#8
8.91%
#9
8.82%
#10
8.01%
What city has the Highest Percentage of Puerto Rican Population in Ohio?
Crystal Rock has the Highest Percentage of Puerto Rican Population in Ohio with 49.07%.
What is the Percentage of Puerto Rican Population in the State of Ohio?
Percentage of Puerto Rican Population in Ohio is 1.20%.
What is the Percentage of Puerto Rican Population in the United States?
Percentage of Puerto Rican Population in the United States is 1.78%.