Cities with the Most Immigrants from Serbia in Ohio
RELATED REPORTS & OPTIONS
Serbia
Ohio
Compare Cities
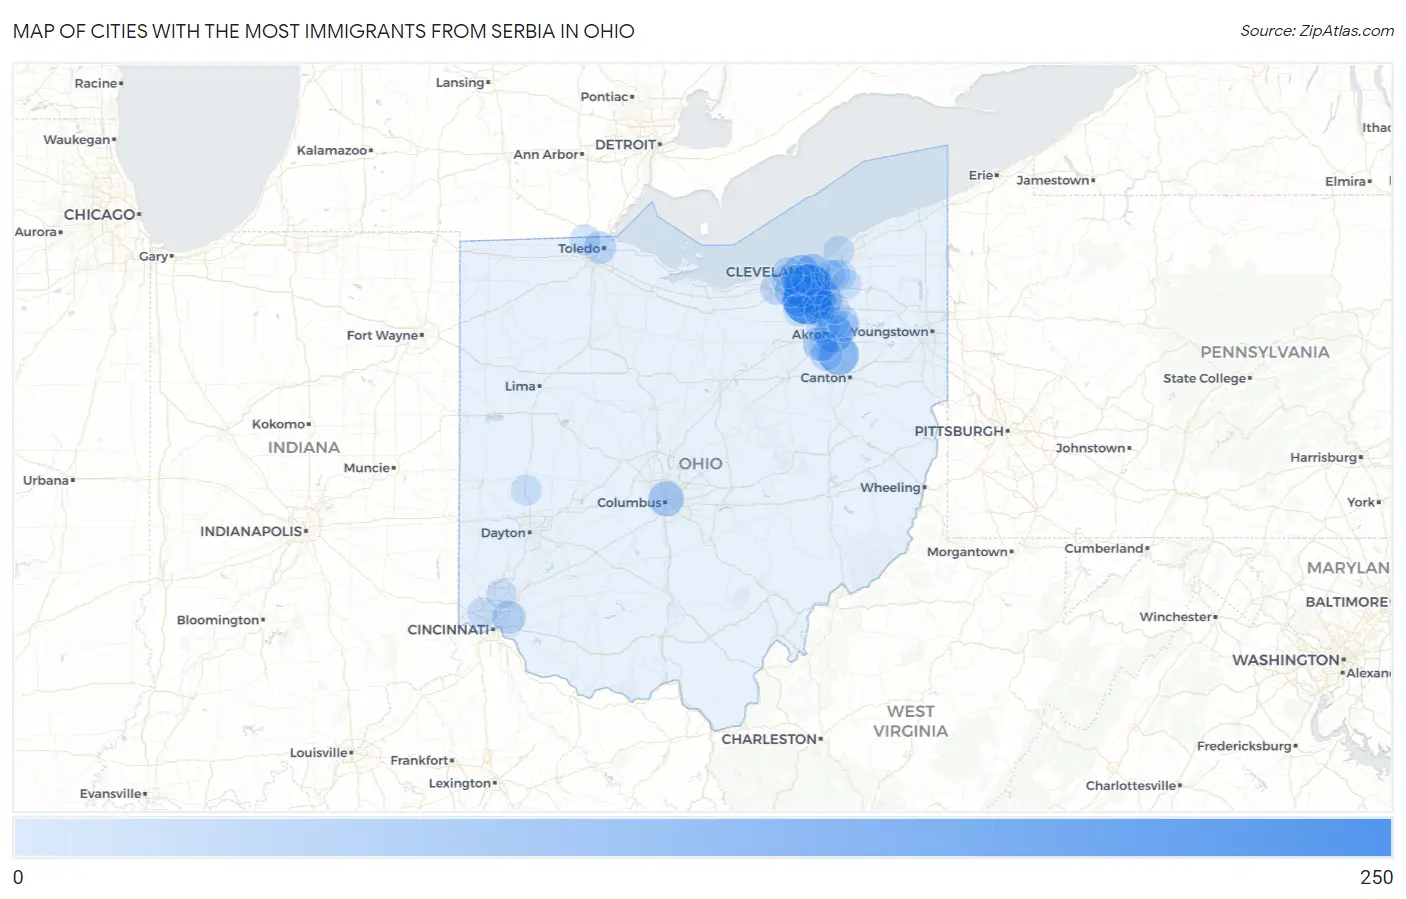
Map of Cities with the Most Immigrants from Serbia in Ohio
0
250
Cities with the Most Immigrants from Serbia in Ohio
| City | Serbia | vs State | vs National | |
| 1. | Parma | 235 | 1,875(12.53%)#1 | 42,332(0.56%)#16 |
| 2. | North Royalton | 225 | 1,875(12.00%)#2 | 42,332(0.53%)#19 |
| 3. | Green | 114 | 1,875(6.08%)#3 | 42,332(0.27%)#53 |
| 4. | Broadview Heights | 108 | 1,875(5.76%)#4 | 42,332(0.26%)#60 |
| 5. | Brecksville | 104 | 1,875(5.55%)#5 | 42,332(0.25%)#62 |
| 6. | Akron | 97 | 1,875(5.17%)#6 | 42,332(0.23%)#69 |
| 7. | Lakewood | 88 | 1,875(4.69%)#7 | 42,332(0.21%)#79 |
| 8. | Columbus | 61 | 1,875(3.25%)#8 | 42,332(0.14%)#127 |
| 9. | Cleveland | 58 | 1,875(3.09%)#9 | 42,332(0.14%)#136 |
| 10. | Norton | 51 | 1,875(2.72%)#10 | 42,332(0.12%)#162 |
| 11. | Strongsville | 43 | 1,875(2.29%)#11 | 42,332(0.10%)#200 |
| 12. | Madeira | 38 | 1,875(2.03%)#12 | 42,332(0.09%)#225 |
| 13. | Toledo | 27 | 1,875(1.44%)#13 | 42,332(0.06%)#299 |
| 14. | Middleburg Heights | 27 | 1,875(1.44%)#14 | 42,332(0.06%)#306 |
| 15. | Seven Hills | 24 | 1,875(1.28%)#15 | 42,332(0.06%)#335 |
| 16. | North Ridgeville | 23 | 1,875(1.23%)#16 | 42,332(0.05%)#343 |
| 17. | Westlake | 23 | 1,875(1.23%)#17 | 42,332(0.05%)#345 |
| 18. | Fairlawn | 23 | 1,875(1.23%)#18 | 42,332(0.05%)#353 |
| 19. | New Franklin | 22 | 1,875(1.17%)#19 | 42,332(0.05%)#361 |
| 20. | Stow | 19 | 1,875(1.01%)#20 | 42,332(0.04%)#402 |
| 21. | Olmsted Falls | 18 | 1,875(0.96%)#21 | 42,332(0.04%)#426 |
| 22. | Cuyahoga Falls | 17 | 1,875(0.91%)#22 | 42,332(0.04%)#434 |
| 23. | Brunswick | 17 | 1,875(0.91%)#23 | 42,332(0.04%)#436 |
| 24. | Pepper Pike | 16 | 1,875(0.85%)#24 | 42,332(0.04%)#464 |
| 25. | Brooklyn | 14 | 1,875(0.75%)#25 | 42,332(0.03%)#495 |
| 26. | Sylvania | 13 | 1,875(0.69%)#26 | 42,332(0.03%)#515 |
| 27. | Willowick | 13 | 1,875(0.69%)#27 | 42,332(0.03%)#517 |
| 28. | Munroe Falls | 13 | 1,875(0.69%)#28 | 42,332(0.03%)#522 |
| 29. | Bay Village | 12 | 1,875(0.64%)#29 | 42,332(0.03%)#536 |
| 30. | Beachwood | 12 | 1,875(0.64%)#30 | 42,332(0.03%)#537 |
| 31. | Barberton | 11 | 1,875(0.59%)#31 | 42,332(0.03%)#548 |
| 32. | Richfield | 10 | 1,875(0.53%)#32 | 42,332(0.02%)#601 |
| 33. | Troy | 9 | 1,875(0.48%)#33 | 42,332(0.02%)#616 |
| 34. | Fairview Park | 8 | 1,875(0.43%)#34 | 42,332(0.02%)#646 |
| 35. | Shaker Heights | 7 | 1,875(0.37%)#35 | 42,332(0.02%)#666 |
| 36. | White Oak | 6 | 1,875(0.32%)#36 | 42,332(0.01%)#698 |
| 37. | Boston Heights | 5 | 1,875(0.27%)#37 | 42,332(0.01%)#732 |
| 38. | Bentleyville | 4 | 1,875(0.21%)#38 | 42,332(0.01%)#749 |
| 39. | Beckett Ridge | 3 | 1,875(0.16%)#39 | 42,332(0.01%)#755 |
Common Questions
What are the Top 10 Cities with the Most Immigrants from Serbia in Ohio?
Top 10 Cities with the Most Immigrants from Serbia in Ohio are:
#1
235
#2
225
#3
114
#4
108
#5
104
#6
97
#7
88
#8
61
#9
58
#10
51
What city has the Most Immigrants from Serbia in Ohio?
Parma has the Most Immigrants from Serbia in Ohio with 235.
What is the Total Immigrants from Serbia in the State of Ohio?
Total Immigrants from Serbia in Ohio is 1,875.
What is the Total Immigrants from Serbia in the United States?
Total Immigrants from Serbia in the United States is 42,332.