Cities with the Highest Percentage of Canadian Population in Ohio
RELATED REPORTS & OPTIONS
Canadian
Ohio
Compare Cities
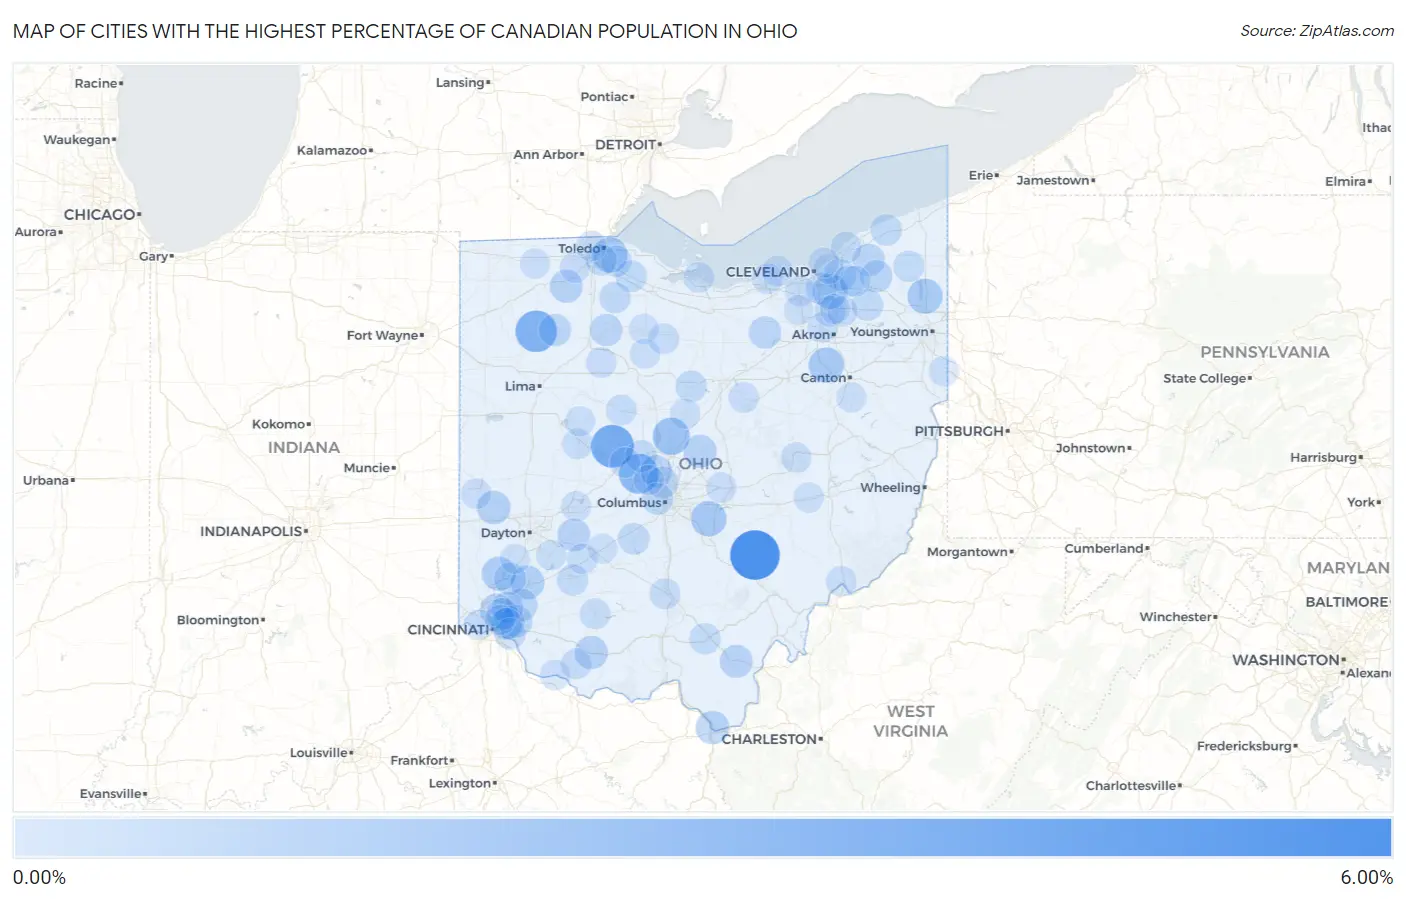
Map of Cities with the Highest Percentage of Canadian Population in Ohio
0.00%
6.00%
Cities with the Highest Percentage of Canadian Population in Ohio
| City | Canadian | vs State | vs National | |
| 1. | Shawnee | 5.84% | 0.12%(+5.72)#1 | 0.18%(+5.66)#78 |
| 2. | Raymond | 3.87% | 0.12%(+3.75)#2 | 0.18%(+3.69)#150 |
| 3. | Massieville | 3.86% | 0.12%(+3.74)#3 | 0.18%(+3.68)#152 |
| 4. | Miller City | 3.47% | 0.12%(+3.35)#4 | 0.18%(+3.29)#181 |
| 5. | New California | 2.99% | 0.12%(+2.87)#5 | 0.18%(+2.81)#235 |
| 6. | Ashley | 2.21% | 0.12%(+2.09)#6 | 0.18%(+2.03)#344 |
| 7. | Baltimore | 1.75% | 0.12%(+1.63)#7 | 0.18%(+1.57)#494 |
| 8. | Northwood | 1.74% | 0.12%(+1.62)#8 | 0.18%(+1.56)#502 |
| 9. | Canal Fulton | 1.66% | 0.12%(+1.54)#9 | 0.18%(+1.48)#526 |
| 10. | Cortland | 1.64% | 0.12%(+1.52)#10 | 0.18%(+1.46)#535 |
| 11. | Walton Hills | 1.59% | 0.12%(+1.47)#11 | 0.18%(+1.41)#566 |
| 12. | Trenton | 1.36% | 0.12%(+1.24)#12 | 0.18%(+1.18)#700 |
| 13. | Saybrook-On-The-Lake | 1.35% | 0.12%(+1.23)#13 | 0.18%(+1.17)#708 |
| 14. | Lebanon | 1.28% | 0.12%(+1.16)#14 | 0.18%(+1.10)#762 |
| 15. | Nashport | 1.27% | 0.12%(+1.15)#15 | 0.18%(+1.09)#771 |
| 16. | Oakwood Village Paulding County | 1.24% | 0.12%(+1.13)#16 | 0.18%(+1.07)#797 |
| 17. | Gordon | 1.21% | 0.12%(+1.10)#17 | 0.18%(+1.04)#819 |
| 18. | South Point | 1.17% | 0.12%(+1.05)#18 | 0.18%(+0.988)#864 |
| 19. | Winchester | 1.13% | 0.12%(+1.01)#19 | 0.18%(+0.949)#904 |
| 20. | Centerburg | 1.07% | 0.12%(+0.949)#20 | 0.18%(+0.888)#955 |
| 21. | Grand Rapids | 1.06% | 0.12%(+0.948)#21 | 0.18%(+0.886)#957 |
| 22. | Rio Grande | 1.05% | 0.12%(+0.934)#22 | 0.18%(+0.873)#964 |
| 23. | Cedarville | 1.00% | 0.12%(+0.879)#23 | 0.18%(+0.818)#1,027 |
| 24. | Wyoming | 0.99% | 0.12%(+0.869)#24 | 0.18%(+0.808)#1,038 |
| 25. | Loveland | 0.97% | 0.12%(+0.849)#25 | 0.18%(+0.788)#1,061 |
| 26. | Spencer | 0.90% | 0.12%(+0.780)#26 | 0.18%(+0.719)#1,151 |
| 27. | Chardon | 0.90% | 0.12%(+0.778)#27 | 0.18%(+0.717)#1,154 |
| 28. | Terrace Park | 0.88% | 0.12%(+0.766)#28 | 0.18%(+0.705)#1,181 |
| 29. | Arcadia | 0.87% | 0.12%(+0.755)#29 | 0.18%(+0.694)#1,198 |
| 30. | Mariemont | 0.86% | 0.12%(+0.742)#30 | 0.18%(+0.680)#1,217 |
| 31. | Burton | 0.85% | 0.12%(+0.735)#31 | 0.18%(+0.674)#1,236 |
| 32. | Powell | 0.85% | 0.12%(+0.733)#32 | 0.18%(+0.672)#1,239 |
| 33. | Monroe | 0.85% | 0.12%(+0.731)#33 | 0.18%(+0.670)#1,241 |
| 34. | Leipsic | 0.81% | 0.12%(+0.695)#34 | 0.18%(+0.634)#1,307 |
| 35. | Worthington | 0.77% | 0.12%(+0.649)#35 | 0.18%(+0.588)#1,411 |
| 36. | Ostrander | 0.74% | 0.12%(+0.618)#36 | 0.18%(+0.557)#1,486 |
| 37. | Blue Ash | 0.71% | 0.12%(+0.596)#37 | 0.18%(+0.535)#1,541 |
| 38. | Pepper Pike | 0.71% | 0.12%(+0.591)#38 | 0.18%(+0.530)#1,560 |
| 39. | Marble Cliff | 0.69% | 0.12%(+0.576)#39 | 0.18%(+0.515)#1,595 |
| 40. | Mount Sterling | 0.69% | 0.12%(+0.570)#40 | 0.18%(+0.509)#1,606 |
| 41. | Elmore | 0.69% | 0.12%(+0.570)#41 | 0.18%(+0.509)#1,609 |
| 42. | Amberley | 0.68% | 0.12%(+0.563)#42 | 0.18%(+0.502)#1,632 |
| 43. | Fairfax | 0.66% | 0.12%(+0.545)#43 | 0.18%(+0.484)#1,672 |
| 44. | Mantua | 0.65% | 0.12%(+0.535)#44 | 0.18%(+0.474)#1,703 |
| 45. | Independence | 0.65% | 0.12%(+0.533)#45 | 0.18%(+0.472)#1,708 |
| 46. | Madison | 0.64% | 0.12%(+0.526)#46 | 0.18%(+0.465)#1,725 |
| 47. | Chagrin Falls | 0.63% | 0.12%(+0.514)#47 | 0.18%(+0.453)#1,760 |
| 48. | Galion | 0.62% | 0.12%(+0.499)#48 | 0.18%(+0.438)#1,799 |
| 49. | Bradner | 0.60% | 0.12%(+0.482)#49 | 0.18%(+0.421)#1,843 |
| 50. | Millbury | 0.60% | 0.12%(+0.478)#50 | 0.18%(+0.417)#1,853 |
| 51. | Jackson | 0.58% | 0.12%(+0.461)#51 | 0.18%(+0.400)#1,906 |
| 52. | Fruit Hill | 0.58% | 0.12%(+0.460)#52 | 0.18%(+0.399)#1,909 |
| 53. | Rossford | 0.57% | 0.12%(+0.453)#53 | 0.18%(+0.392)#1,930 |
| 54. | Orwell | 0.55% | 0.12%(+0.437)#54 | 0.18%(+0.376)#1,999 |
| 55. | Willoughby | 0.55% | 0.12%(+0.437)#55 | 0.18%(+0.376)#2,003 |
| 56. | Wilmington | 0.54% | 0.12%(+0.427)#56 | 0.18%(+0.366)#2,034 |
| 57. | Chillicothe | 0.50% | 0.12%(+0.378)#57 | 0.18%(+0.317)#2,240 |
| 58. | Peninsula | 0.47% | 0.12%(+0.357)#58 | 0.18%(+0.296)#2,317 |
| 59. | Bloomville | 0.46% | 0.12%(+0.343)#59 | 0.18%(+0.282)#2,385 |
| 60. | South Russell | 0.45% | 0.12%(+0.337)#60 | 0.18%(+0.275)#2,417 |
| 61. | Hillsboro | 0.45% | 0.12%(+0.329)#61 | 0.18%(+0.268)#2,449 |
| 62. | Russellville | 0.45% | 0.12%(+0.329)#62 | 0.18%(+0.268)#2,454 |
| 63. | Sheffield | 0.43% | 0.12%(+0.309)#63 | 0.18%(+0.248)#2,565 |
| 64. | La Rue | 0.42% | 0.12%(+0.308)#64 | 0.18%(+0.247)#2,569 |
| 65. | Sandusky | 0.42% | 0.12%(+0.307)#65 | 0.18%(+0.246)#2,571 |
| 66. | Bellefontaine | 0.42% | 0.12%(+0.303)#66 | 0.18%(+0.242)#2,596 |
| 67. | Avon Lake | 0.39% | 0.12%(+0.275)#67 | 0.18%(+0.214)#2,764 |
| 68. | Mount Blanchard | 0.39% | 0.12%(+0.268)#68 | 0.18%(+0.207)#2,808 |
| 69. | Granville | 0.38% | 0.12%(+0.263)#69 | 0.18%(+0.202)#2,835 |
| 70. | Whitehouse | 0.38% | 0.12%(+0.260)#70 | 0.18%(+0.199)#2,858 |
| 71. | Perrysville | 0.37% | 0.12%(+0.256)#71 | 0.18%(+0.195)#2,887 |
| 72. | Fairlawn | 0.36% | 0.12%(+0.246)#72 | 0.18%(+0.185)#2,956 |
| 73. | Wayne Lakes | 0.36% | 0.12%(+0.245)#73 | 0.18%(+0.184)#2,965 |
| 74. | Marysville | 0.36% | 0.12%(+0.239)#74 | 0.18%(+0.178)#3,004 |
| 75. | Marietta | 0.35% | 0.12%(+0.234)#75 | 0.18%(+0.173)#3,035 |
| 76. | Higginsport | 0.35% | 0.12%(+0.231)#76 | 0.18%(+0.170)#3,059 |
| 77. | Hudson | 0.35% | 0.12%(+0.230)#77 | 0.18%(+0.169)#3,062 |
| 78. | Covedale | 0.34% | 0.12%(+0.225)#78 | 0.18%(+0.164)#3,095 |
| 79. | Bowersville | 0.34% | 0.12%(+0.224)#79 | 0.18%(+0.163)#3,105 |
| 80. | Middleburg Heights | 0.34% | 0.12%(+0.222)#80 | 0.18%(+0.161)#3,123 |
| 81. | Coshocton | 0.33% | 0.12%(+0.217)#81 | 0.18%(+0.156)#3,161 |
| 82. | Ottawa Hills | 0.33% | 0.12%(+0.217)#82 | 0.18%(+0.156)#3,163 |
| 83. | Spring Valley | 0.33% | 0.12%(+0.213)#83 | 0.18%(+0.152)#3,195 |
| 84. | Boston Heights | 0.32% | 0.12%(+0.205)#84 | 0.18%(+0.144)#3,255 |
| 85. | New Concord | 0.31% | 0.12%(+0.191)#85 | 0.18%(+0.130)#3,358 |
| 86. | Mount Gilead | 0.31% | 0.12%(+0.190)#86 | 0.18%(+0.129)#3,364 |
| 87. | Wauseon | 0.30% | 0.12%(+0.184)#87 | 0.18%(+0.123)#3,418 |
| 88. | East Sparta | 0.30% | 0.12%(+0.184)#88 | 0.18%(+0.123)#3,421 |
| 89. | Springfield | 0.30% | 0.12%(+0.183)#89 | 0.18%(+0.122)#3,428 |
| 90. | East Palestine | 0.30% | 0.12%(+0.179)#90 | 0.18%(+0.118)#3,465 |
| 91. | Cleveland Heights | 0.30% | 0.12%(+0.178)#91 | 0.18%(+0.117)#3,472 |
| 92. | Norwood | 0.29% | 0.12%(+0.177)#92 | 0.18%(+0.116)#3,479 |
| 93. | Dublin | 0.29% | 0.12%(+0.175)#93 | 0.18%(+0.114)#3,495 |
| 94. | Belle Center | 0.28% | 0.12%(+0.165)#94 | 0.18%(+0.104)#3,597 |
| 95. | Bratenahl | 0.28% | 0.12%(+0.164)#95 | 0.18%(+0.103)#3,604 |
| 96. | Jeffersonville | 0.28% | 0.12%(+0.159)#96 | 0.18%(+0.098)#3,642 |
| 97. | Brunswick | 0.27% | 0.12%(+0.157)#97 | 0.18%(+0.096)#3,663 |
| 98. | Tiffin | 0.27% | 0.12%(+0.156)#98 | 0.18%(+0.095)#3,673 |
| 99. | Carlisle | 0.27% | 0.12%(+0.156)#99 | 0.18%(+0.095)#3,681 |
| 100. | Sycamore | 0.27% | 0.12%(+0.155)#100 | 0.18%(+0.094)#3,685 |
Common Questions
What are the Top 10 Cities with the Highest Percentage of Canadian Population in Ohio?
Top 10 Cities with the Highest Percentage of Canadian Population in Ohio are:
#1
5.84%
#2
3.87%
#3
3.47%
#4
2.99%
#5
2.21%
#6
1.75%
#7
1.74%
#8
1.66%
#9
1.64%
#10
1.59%
What city has the Highest Percentage of Canadian Population in Ohio?
Shawnee has the Highest Percentage of Canadian Population in Ohio with 5.84%.
What is the Percentage of Canadian Population in the State of Ohio?
Percentage of Canadian Population in Ohio is 0.12%.
What is the Percentage of Canadian Population in the United States?
Percentage of Canadian Population in the United States is 0.18%.