Cities with the Lowest Poverty Level Among Single Mothers in Ohio
RELATED REPORTS & OPTIONS
Lowest Poverty | Single Mother
Ohio
Compare Cities
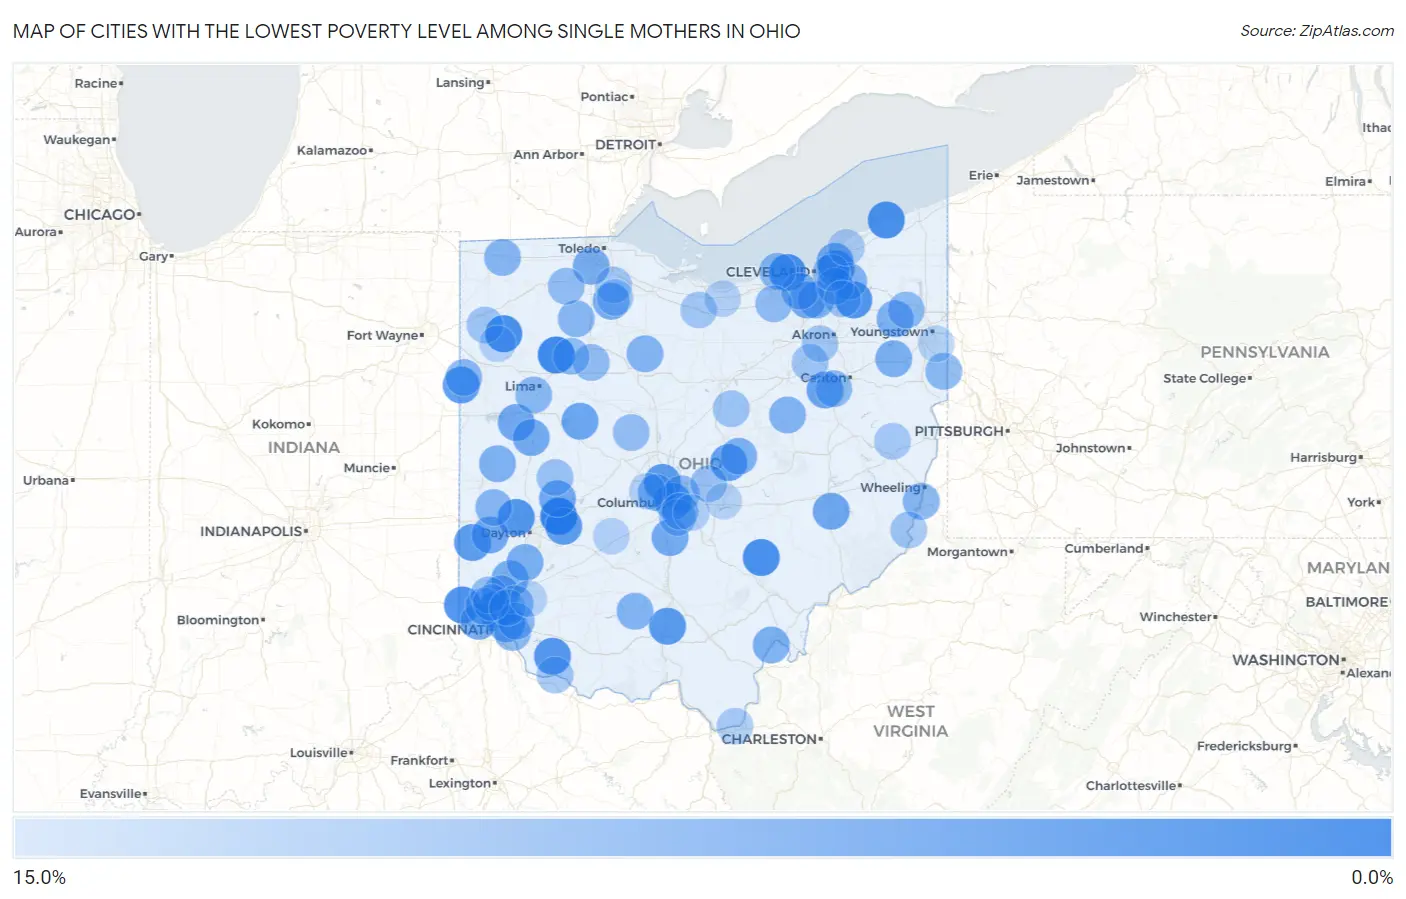
Map of Cities with the Lowest Poverty Level Among Single Mothers in Ohio
15.0%
0.0%
Cities with the Lowest Poverty Level Among Single Mothers in Ohio
| City | Single Mother Poverty | vs State | vs National | |
| 1. | Enon | 1.8% | 38.7%(-36.9)#1 | 33.1%(-31.3)#28 |
| 2. | Pandora | 2.7% | 38.7%(-36.0)#2 | 33.1%(-30.4)#72 |
| 3. | Melrose | 3.4% | 38.7%(-35.2)#3 | 33.1%(-29.7)#130 |
| 4. | Hemlock | 3.6% | 38.7%(-35.1)#4 | 33.1%(-29.6)#141 |
| 5. | North Madison | 3.7% | 38.7%(-35.0)#5 | 33.1%(-29.4)#155 |
| 6. | Bay Village | 3.8% | 38.7%(-34.9)#6 | 33.1%(-29.3)#162 |
| 7. | Harrison | 4.3% | 38.7%(-34.4)#7 | 33.1%(-28.9)#201 |
| 8. | Aurora | 4.5% | 38.7%(-34.2)#8 | 33.1%(-28.7)#217 |
| 9. | Englewood | 4.7% | 38.7%(-34.0)#9 | 33.1%(-28.4)#254 |
| 10. | Hamersville | 4.8% | 38.7%(-33.9)#10 | 33.1%(-28.4)#260 |
| 11. | Wyoming | 5.3% | 38.7%(-33.4)#11 | 33.1%(-27.8)#341 |
| 12. | Waverly | 5.3% | 38.7%(-33.4)#12 | 33.1%(-27.8)#342 |
| 13. | Lyndhurst | 5.4% | 38.7%(-33.2)#13 | 33.1%(-27.7)#357 |
| 14. | Worthington | 5.4% | 38.7%(-33.2)#14 | 33.1%(-27.7)#358 |
| 15. | Willshire | 5.6% | 38.7%(-33.1)#15 | 33.1%(-27.6)#375 |
| 16. | Yellow Springs | 5.6% | 38.7%(-33.1)#16 | 33.1%(-27.5)#382 |
| 17. | Lake Lakengren | 5.7% | 38.7%(-33.0)#17 | 33.1%(-27.4)#399 |
| 18. | Bexley | 6.0% | 38.7%(-32.7)#18 | 33.1%(-27.2)#433 |
| 19. | Utica | 6.1% | 38.7%(-32.6)#19 | 33.1%(-27.0)#453 |
| 20. | Brewster | 7.0% | 38.7%(-31.6)#20 | 33.1%(-26.1)#600 |
| 21. | Belle Center | 7.1% | 38.7%(-31.5)#21 | 33.1%(-26.0)#621 |
| 22. | Fairfax | 7.2% | 38.7%(-31.5)#22 | 33.1%(-25.9)#641 |
| 23. | Pleasant City | 7.4% | 38.7%(-31.3)#23 | 33.1%(-25.8)#661 |
| 24. | West Alexandria | 7.7% | 38.7%(-31.0)#24 | 33.1%(-25.4)#721 |
| 25. | New Knoxville | 7.7% | 38.7%(-31.0)#25 | 33.1%(-25.4)#726 |
| 26. | North Hampton | 7.7% | 38.7%(-31.0)#26 | 33.1%(-25.4)#734 |
| 27. | Bridgetown | 7.8% | 38.7%(-30.9)#27 | 33.1%(-25.3)#748 |
| 28. | Richmond Heights | 7.9% | 38.7%(-30.8)#28 | 33.1%(-25.2)#767 |
| 29. | Anna | 8.1% | 38.7%(-30.6)#29 | 33.1%(-25.0)#800 |
| 30. | Ashville | 8.2% | 38.7%(-30.5)#30 | 33.1%(-24.9)#816 |
| 31. | North Royalton | 8.2% | 38.7%(-30.4)#31 | 33.1%(-24.9)#830 |
| 32. | Monroe | 8.3% | 38.7%(-30.4)#32 | 33.1%(-24.8)#833 |
| 33. | Wayne | 8.3% | 38.7%(-30.4)#33 | 33.1%(-24.8)#846 |
| 34. | Perrysburg | 8.6% | 38.7%(-30.1)#34 | 33.1%(-24.5)#899 |
| 35. | Beloit | 8.7% | 38.7%(-30.0)#35 | 33.1%(-24.4)#914 |
| 36. | Middleport | 8.7% | 38.7%(-30.0)#36 | 33.1%(-24.4)#932 |
| 37. | Springboro | 8.8% | 38.7%(-29.9)#37 | 33.1%(-24.3)#944 |
| 38. | Reedurban | 8.9% | 38.7%(-29.7)#38 | 33.1%(-24.2)#974 |
| 39. | Versailles | 9.1% | 38.7%(-29.6)#39 | 33.1%(-24.0)#995 |
| 40. | Martinsburg | 9.1% | 38.7%(-29.6)#40 | 33.1%(-24.0)#1,016 |
| 41. | Broadview Heights | 9.1% | 38.7%(-29.6)#41 | 33.1%(-24.0)#1,018 |
| 42. | Beckett Ridge | 9.3% | 38.7%(-29.4)#42 | 33.1%(-23.9)#1,035 |
| 43. | Newton Falls | 9.3% | 38.7%(-29.4)#43 | 33.1%(-23.9)#1,036 |
| 44. | Middleburg Heights | 9.4% | 38.7%(-29.3)#44 | 33.1%(-23.7)#1,053 |
| 45. | Chagrin Falls | 9.5% | 38.7%(-29.2)#45 | 33.1%(-23.7)#1,064 |
| 46. | Sycamore | 9.5% | 38.7%(-29.2)#46 | 33.1%(-23.6)#1,080 |
| 47. | Bainbridge | 9.5% | 38.7%(-29.2)#47 | 33.1%(-23.6)#1,082 |
| 48. | Millersburg | 9.6% | 38.7%(-29.1)#48 | 33.1%(-23.5)#1,092 |
| 49. | Upper Arlington | 9.7% | 38.7%(-29.0)#49 | 33.1%(-23.5)#1,104 |
| 50. | Shadyside | 9.9% | 38.7%(-28.8)#50 | 33.1%(-23.3)#1,137 |
| 51. | Bedford Heights | 9.9% | 38.7%(-28.8)#51 | 33.1%(-23.2)#1,148 |
| 52. | Sixteen Mile Stand | 10.0% | 38.7%(-28.7)#52 | 33.1%(-23.1)#1,162 |
| 53. | West Unity | 10.0% | 38.7%(-28.7)#53 | 33.1%(-23.1)#1,165 |
| 54. | Hoytville | 10.0% | 38.7%(-28.7)#54 | 33.1%(-23.1)#1,188 |
| 55. | Gordon | 10.0% | 38.7%(-28.7)#55 | 33.1%(-23.1)#1,197 |
| 56. | Wren | 10.0% | 38.7%(-28.7)#56 | 33.1%(-23.1)#1,198 |
| 57. | Fort Shawnee | 10.2% | 38.7%(-28.4)#57 | 33.1%(-22.9)#1,222 |
| 58. | East Palestine | 10.3% | 38.7%(-28.4)#58 | 33.1%(-22.8)#1,238 |
| 59. | Avon Lake | 10.3% | 38.7%(-28.3)#59 | 33.1%(-22.8)#1,246 |
| 60. | Forestville | 10.4% | 38.7%(-28.3)#60 | 33.1%(-22.8)#1,254 |
| 61. | Navarre | 10.4% | 38.7%(-28.3)#61 | 33.1%(-22.7)#1,264 |
| 62. | Northgate | 10.5% | 38.7%(-28.2)#62 | 33.1%(-22.7)#1,271 |
| 63. | Terrace Park | 10.5% | 38.7%(-28.2)#63 | 33.1%(-22.6)#1,276 |
| 64. | Leavittsburg | 10.5% | 38.7%(-28.2)#64 | 33.1%(-22.6)#1,278 |
| 65. | Gahanna | 10.5% | 38.7%(-28.1)#65 | 33.1%(-22.6)#1,294 |
| 66. | University Heights | 10.6% | 38.7%(-28.1)#66 | 33.1%(-22.5)#1,300 |
| 67. | Wilkshire Hills | 10.8% | 38.7%(-27.9)#67 | 33.1%(-22.4)#1,346 |
| 68. | Grafton | 10.8% | 38.7%(-27.8)#68 | 33.1%(-22.3)#1,356 |
| 69. | Fairfield | 11.1% | 38.7%(-27.6)#69 | 33.1%(-22.1)#1,389 |
| 70. | Arlington | 11.1% | 38.7%(-27.6)#70 | 33.1%(-22.0)#1,407 |
| 71. | Grand Rapids | 11.1% | 38.7%(-27.6)#71 | 33.1%(-22.0)#1,415 |
| 72. | Mount Cory | 11.1% | 38.7%(-27.6)#72 | 33.1%(-22.0)#1,442 |
| 73. | Richwood | 11.3% | 38.7%(-27.4)#73 | 33.1%(-21.8)#1,475 |
| 74. | Groveport | 11.4% | 38.7%(-27.3)#74 | 33.1%(-21.8)#1,488 |
| 75. | Blacklick Estates | 11.4% | 38.7%(-27.3)#75 | 33.1%(-21.7)#1,495 |
| 76. | Alexandria | 11.8% | 38.7%(-26.9)#76 | 33.1%(-21.4)#1,568 |
| 77. | St Paris | 12.1% | 38.7%(-26.6)#77 | 33.1%(-21.0)#1,638 |
| 78. | Butler | 12.1% | 38.7%(-26.6)#78 | 33.1%(-21.0)#1,648 |
| 79. | Paulding | 12.2% | 38.7%(-26.5)#79 | 33.1%(-21.0)#1,657 |
| 80. | Twinsburg | 12.3% | 38.7%(-26.4)#80 | 33.1%(-20.8)#1,687 |
| 81. | Marshallville | 12.5% | 38.7%(-26.2)#81 | 33.1%(-20.6)#1,736 |
| 82. | Clarington | 12.5% | 38.7%(-26.2)#82 | 33.1%(-20.6)#1,752 |
| 83. | Higginsport | 12.5% | 38.7%(-26.2)#83 | 33.1%(-20.6)#1,756 |
| 84. | Pemberville | 12.6% | 38.7%(-26.1)#84 | 33.1%(-20.5)#1,774 |
| 85. | Norton | 12.9% | 38.7%(-25.7)#85 | 33.1%(-20.2)#1,846 |
| 86. | Monroeville | 13.0% | 38.7%(-25.7)#86 | 33.1%(-20.2)#1,848 |
| 87. | Jewett | 13.0% | 38.7%(-25.6)#87 | 33.1%(-20.1)#1,878 |
| 88. | Bradner | 13.3% | 38.7%(-25.4)#88 | 33.1%(-19.9)#1,916 |
| 89. | Proctorville | 13.3% | 38.7%(-25.4)#89 | 33.1%(-19.8)#1,945 |
| 90. | Willoughby | 13.5% | 38.7%(-25.2)#90 | 33.1%(-19.6)#1,991 |
| 91. | Forest Park | 13.8% | 38.7%(-24.8)#91 | 33.1%(-19.3)#2,058 |
| 92. | Pickerington | 14.3% | 38.7%(-24.4)#92 | 33.1%(-18.9)#2,132 |
| 93. | Berlin Heights | 14.3% | 38.7%(-24.4)#93 | 33.1%(-18.8)#2,163 |
| 94. | Grover Hill | 14.3% | 38.7%(-24.4)#94 | 33.1%(-18.8)#2,170 |
| 95. | Midway | 14.3% | 38.7%(-24.4)#95 | 33.1%(-18.8)#2,192 |
| 96. | Hilliard | 14.5% | 38.7%(-24.2)#96 | 33.1%(-18.6)#2,239 |
| 97. | Blue Ash | 14.6% | 38.7%(-24.1)#97 | 33.1%(-18.5)#2,257 |
| 98. | Maineville | 14.6% | 38.7%(-24.1)#98 | 33.1%(-18.5)#2,261 |
| 99. | Poland | 14.7% | 38.7%(-24.0)#99 | 33.1%(-18.4)#2,280 |
| 100. | Hebron | 14.8% | 38.7%(-23.9)#100 | 33.1%(-18.3)#2,304 |
Common Questions
What are the Top 10 Cities with the Lowest Poverty Level Among Single Mothers in Ohio?
Top 10 Cities with the Lowest Poverty Level Among Single Mothers in Ohio are:
#1
1.8%
#2
2.7%
#3
3.4%
#4
3.6%
#5
3.7%
#6
3.8%
#7
4.3%
#8
4.5%
#9
4.7%
#10
4.8%
What city has the Lowest Poverty Level Among Single Mothers in Ohio?
Enon has the Lowest Poverty Level Among Single Mothers in Ohio with 1.8%.
What is the Poverty Level Among Single Mothers in the State of Ohio?
Poverty Level Among Single Mothers in Ohio is 38.7%.
What is the Poverty Level Among Single Mothers in the United States?
Poverty Level Among Single Mothers in the United States is 33.1%.