New Baltimore, OH
New Baltimore Map
New Baltimore Overview
1,457
TOTAL POPULATION
662
MALE POPULATION
795
FEMALE POPULATION
83.27
MALES / 100 FEMALES
120.09
FEMALES / 100 MALES
37.1
MEDIAN AGE
3.4
AVG FAMILY SIZE
3.0
AVG HOUSEHOLD SIZE
$41,823
PER CAPITA INCOME
$148,466
AVG FAMILY INCOME
$130,625
AVG HOUSEHOLD INCOME
36.7%
WAGE / INCOME GAP [ % ]
63.3¢/ $1
WAGE / INCOME GAP [ $ ]
0.31
INEQUALITY / GINI INDEX
842
LABOR FORCE [ PEOPLE ]
84.5%
PERCENT IN LABOR FORCE
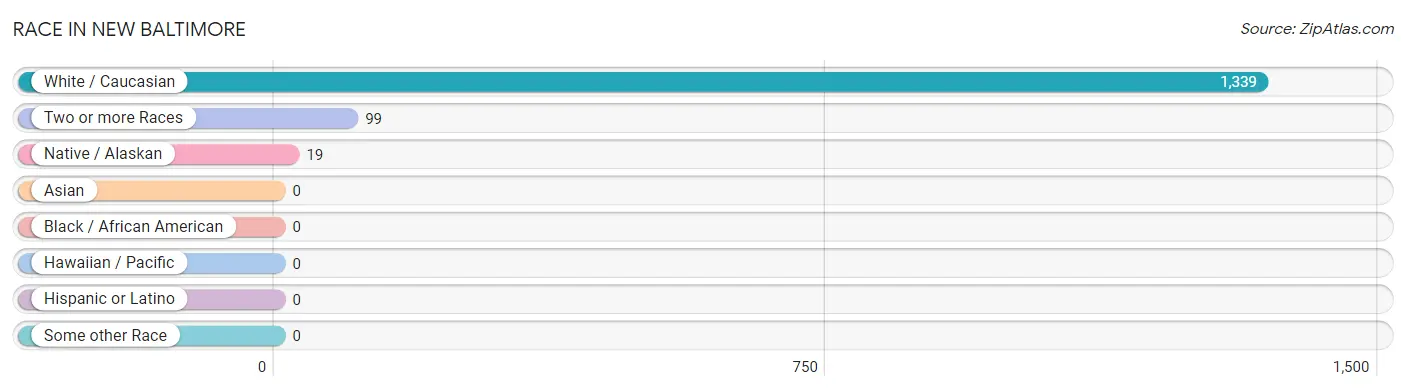
Race in New Baltimore
The most populous races in New Baltimore are White / Caucasian (1,339 | 91.9%), Two or more Races (99 | 6.8%), and Native / Alaskan (19 | 1.3%).
| Race | # Population | % Population |
| Asian | 0 | 0.0% |
| Black / African American | 0 | 0.0% |
| Hawaiian / Pacific | 0 | 0.0% |
| Hispanic or Latino | 0 | 0.0% |
| Native / Alaskan | 19 | 1.3% |
| White / Caucasian | 1,339 | 91.9% |
| Two or more Races | 99 | 6.8% |
| Some other Race | 0 | 0.0% |
| Total | 1,457 | 100.0% |
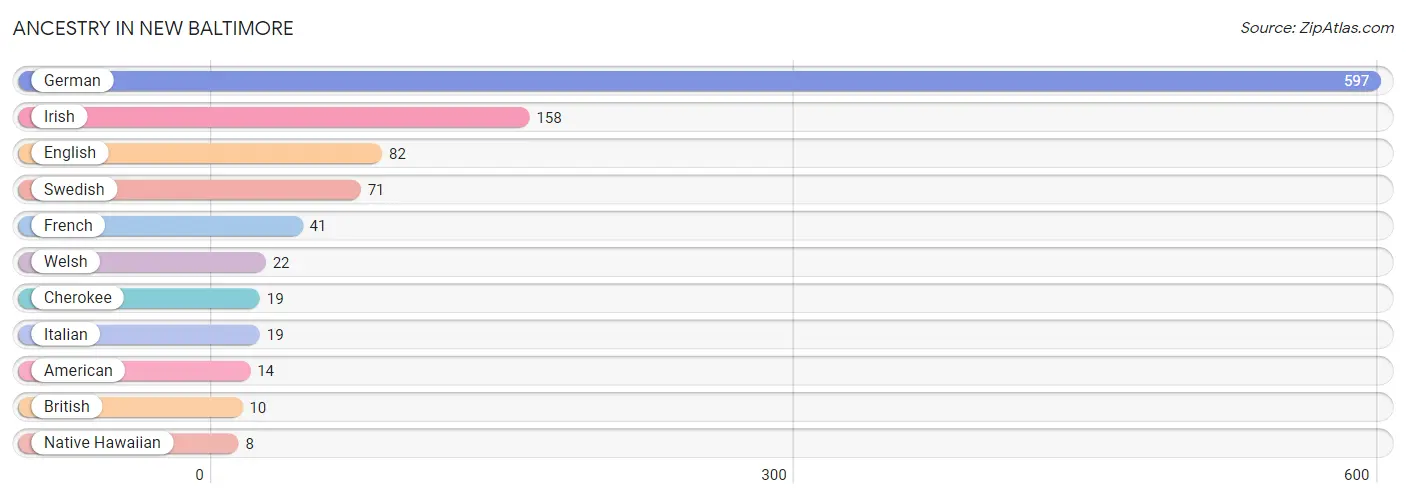
Ancestry in New Baltimore
The most populous ancestries reported in New Baltimore are German (597 | 41.0%), Irish (158 | 10.8%), English (82 | 5.6%), Swedish (71 | 4.9%), and French (41 | 2.8%), together accounting for 65.1% of all New Baltimore residents.
| Ancestry | # Population | % Population |
| American | 14 | 1.0% |
| British | 10 | 0.7% |
| Cherokee | 19 | 1.3% |
| English | 82 | 5.6% |
| French | 41 | 2.8% |
| German | 597 | 41.0% |
| Irish | 158 | 10.8% |
| Italian | 19 | 1.3% |
| Native Hawaiian | 8 | 0.5% |
| Swedish | 71 | 4.9% |
| Welsh | 22 | 1.5% | View All 11 Rows |
Immigrants in New Baltimore

| Immigration Origin | # Population | % Population | View All 0 Rows |
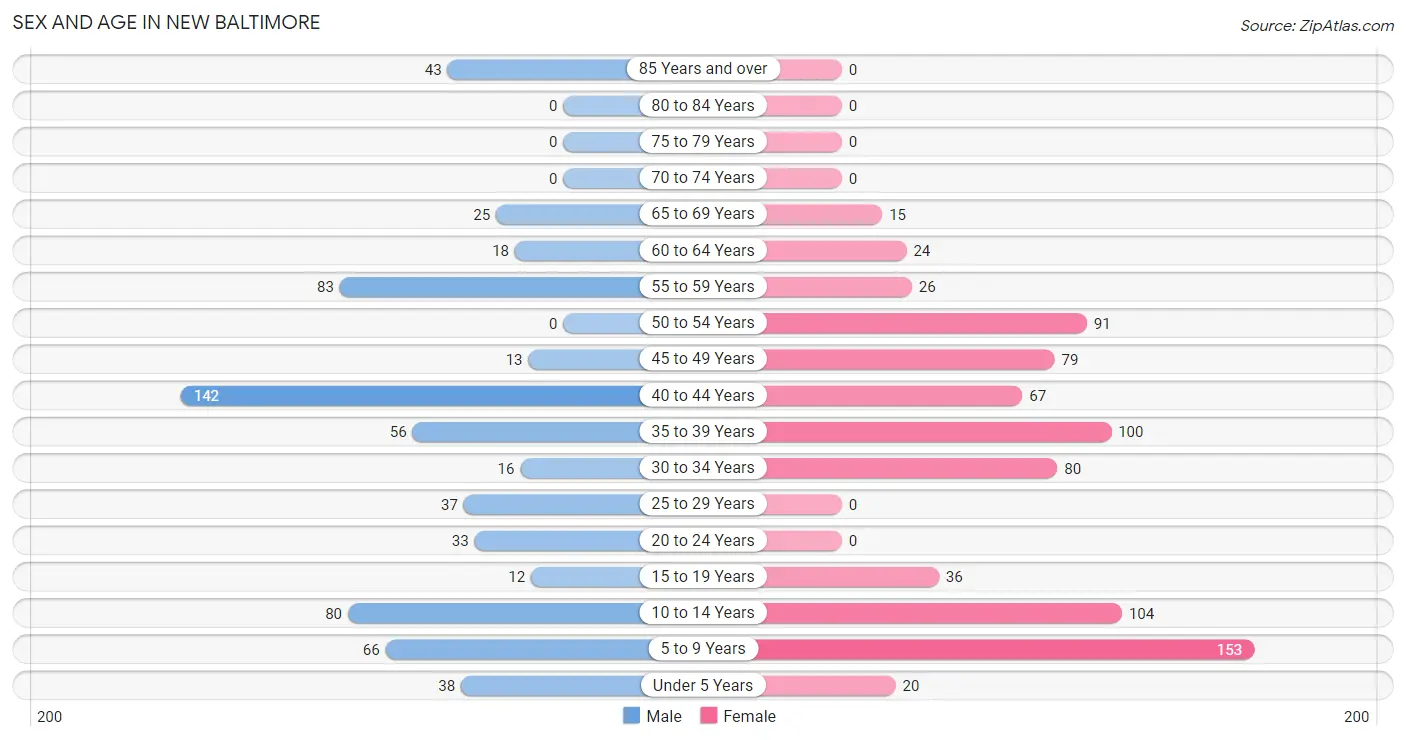
Sex and Age in New Baltimore
Sex and Age in New Baltimore
The most populous age groups in New Baltimore are 40 to 44 Years (142 | 21.4%) for men and 5 to 9 Years (153 | 19.3%) for women.
| Age Bracket | Male | Female |
| Under 5 Years | 38 (5.7%) | 20 (2.5%) |
| 5 to 9 Years | 66 (10.0%) | 153 (19.3%) |
| 10 to 14 Years | 80 (12.1%) | 104 (13.1%) |
| 15 to 19 Years | 12 (1.8%) | 36 (4.5%) |
| 20 to 24 Years | 33 (5.0%) | 0 (0.0%) |
| 25 to 29 Years | 37 (5.6%) | 0 (0.0%) |
| 30 to 34 Years | 16 (2.4%) | 80 (10.1%) |
| 35 to 39 Years | 56 (8.5%) | 100 (12.6%) |
| 40 to 44 Years | 142 (21.4%) | 67 (8.4%) |
| 45 to 49 Years | 13 (2.0%) | 79 (9.9%) |
| 50 to 54 Years | 0 (0.0%) | 91 (11.5%) |
| 55 to 59 Years | 83 (12.5%) | 26 (3.3%) |
| 60 to 64 Years | 18 (2.7%) | 24 (3.0%) |
| 65 to 69 Years | 25 (3.8%) | 15 (1.9%) |
| 70 to 74 Years | 0 (0.0%) | 0 (0.0%) |
| 75 to 79 Years | 0 (0.0%) | 0 (0.0%) |
| 80 to 84 Years | 0 (0.0%) | 0 (0.0%) |
| 85 Years and over | 43 (6.5%) | 0 (0.0%) |
| Total | 662 (100.0%) | 795 (100.0%) |
Families and Households in New Baltimore
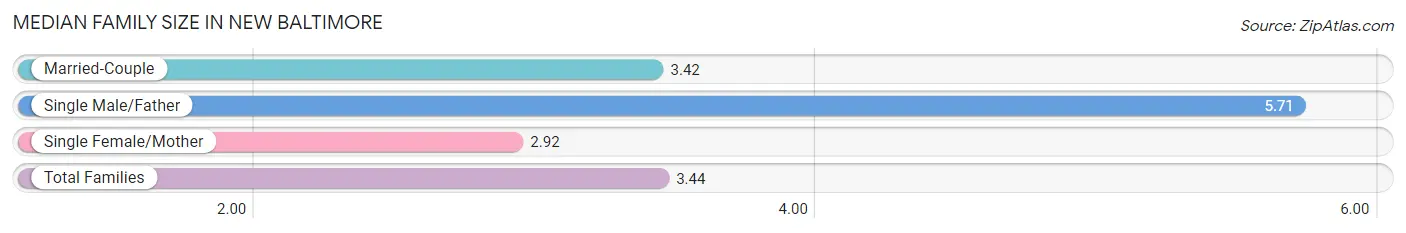
Median Family Size in New Baltimore
The median family size in New Baltimore is 3.44 persons per family, with single male/father families (14 | 3.7%) accounting for the largest median family size of 5.71 persons per family. On the other hand, single female/mother families (49 | 13.0%) represent the smallest median family size with 2.92 persons per family.
| Family Type | # Families | Family Size |
| Married-Couple | 314 (83.3%) | 3.42 |
| Single Male/Father | 14 (3.7%) | 5.71 |
| Single Female/Mother | 49 (13.0%) | 2.92 |
| Total Families | 377 (100.0%) | 3.44 |
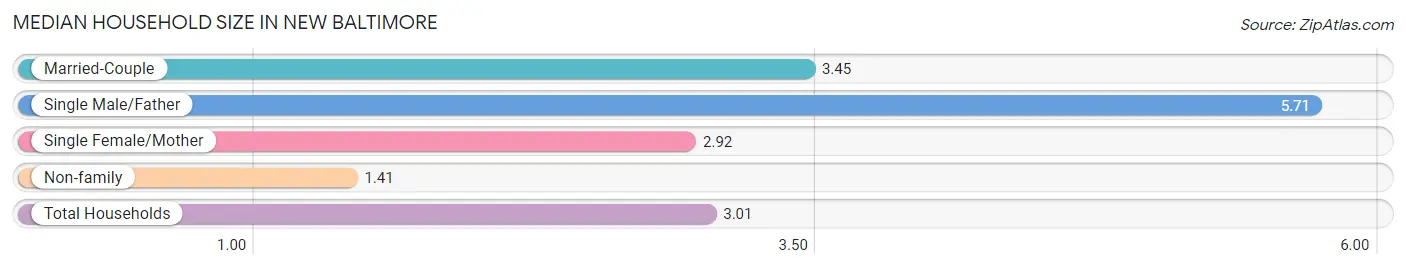
Median Household Size in New Baltimore
The median household size in New Baltimore is 3.01 persons per household, with single male/father households (14 | 2.9%) accounting for the largest median household size of 5.71 persons per household. non-family households (107 | 22.1%) represent the smallest median household size with 1.41 persons per household.
| Household Type | # Households | Household Size |
| Married-Couple | 314 (64.9%) | 3.45 |
| Single Male/Father | 14 (2.9%) | 5.71 |
| Single Female/Mother | 49 (10.1%) | 2.92 |
| Non-family | 107 (22.1%) | 1.41 |
| Total Households | 484 (100.0%) | 3.01 |
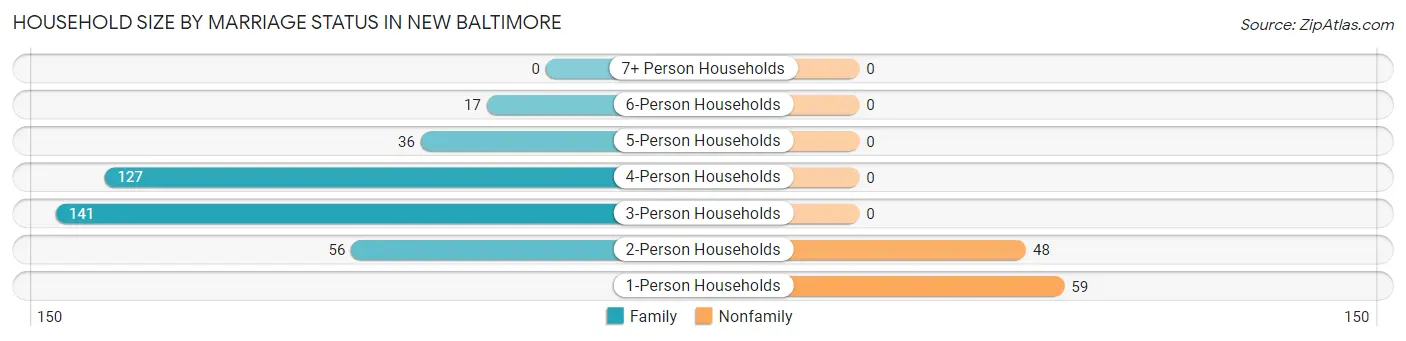
Household Size by Marriage Status in New Baltimore
Out of a total of 484 households in New Baltimore, 377 (77.9%) are family households, while 107 (22.1%) are nonfamily households. The most numerous type of family households are 3-person households, comprising 141, and the most common type of nonfamily households are 1-person households, comprising 59.
| Household Size | Family Households | Nonfamily Households |
| 1-Person Households | - | 59 (12.2%) |
| 2-Person Households | 56 (11.6%) | 48 (9.9%) |
| 3-Person Households | 141 (29.1%) | 0 (0.0%) |
| 4-Person Households | 127 (26.2%) | 0 (0.0%) |
| 5-Person Households | 36 (7.4%) | 0 (0.0%) |
| 6-Person Households | 17 (3.5%) | 0 (0.0%) |
| 7+ Person Households | 0 (0.0%) | 0 (0.0%) |
| Total | 377 (77.9%) | 107 (22.1%) |
Female Fertility in New Baltimore
Fertility by Age in New Baltimore
| Age Bracket | Women with Births | Births / 1,000 Women |
| 15 to 19 years | 0 (0.0%) | 0.0 |
| 20 to 34 years | 0 (0.0%) | 0.0 |
| 35 to 50 years | 0 (0.0%) | 0.0 |
| Total | 0 (0.0%) | 0.0 |
Fertility by Age by Marriage Status in New Baltimore
| Age Bracket | Married | Unmarried |
| 15 to 19 years | 0 (0.0%) | 0 (0.0%) |
| 20 to 34 years | 0 (0.0%) | 0 (0.0%) |
| 35 to 50 years | 0 (0.0%) | 0 (0.0%) |
| Total | 0 (0.0%) | 0 (0.0%) |
Fertility by Education in New Baltimore
| Educational Attainment | Women with Births | Births / 1,000 Women |
| Less than High School | 0 (0.0%) | 0.0 |
| High School Diploma | 0 (0.0%) | 0.0 |
| College or Associate's Degree | 0 (0.0%) | 0.0 |
| Bachelor's Degree | 0 (0.0%) | 0.0 |
| Graduate Degree | 0 (0.0%) | 0.0 |
| Total | 0 (0.0%) | 0.0 |
Fertility by Education by Marriage Status in New Baltimore
| Educational Attainment | Married | Unmarried |
| Less than High School | 0 (0.0%) | 0 (0.0%) |
| High School Diploma | 0 (0.0%) | 0 (0.0%) |
| College or Associate's Degree | 0 (0.0%) | 0 (0.0%) |
| Bachelor's Degree | 0 (0.0%) | 0 (0.0%) |
| Graduate Degree | 0 (0.0%) | 0 (0.0%) |
| Total | 0 (0.0%) | 0 (0.0%) |
Income in New Baltimore
Income Overview in New Baltimore
Per Capita Income in New Baltimore is $41,823, while median incomes of families and households are $148,466 and $130,625 respectively.
| Characteristic | Number | Measure |
| Per Capita Income | 1,457 | $41,823 |
| Median Family Income | 377 | $148,466 |
| Mean Family Income | 377 | $144,543 |
| Median Household Income | 484 | $130,625 |
| Mean Household Income | 484 | $126,028 |
| Income Deficit | 377 | $0 |
| Wage / Income Gap (%) | 1,457 | 36.68% |
| Wage / Income Gap ($) | 1,457 | 63.32¢ per $1 |
| Gini / Inequality Index | 1,457 | 0.31 |
Earnings by Sex in New Baltimore
Average Earnings in New Baltimore are $60,573, $70,966 for men and $44,934 for women, a difference of 36.7%.
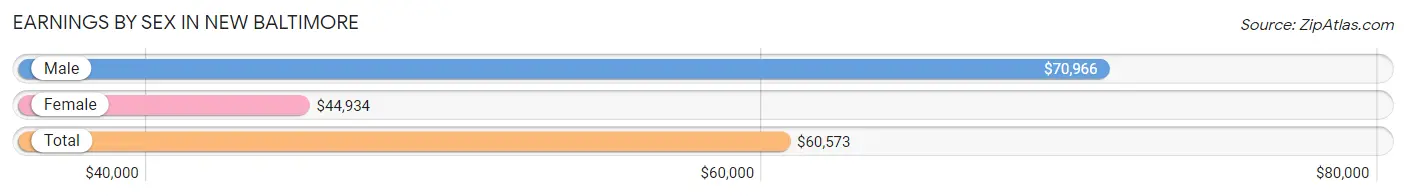
| Sex | Number | Average Earnings |
| Male | 387 (45.3%) | $70,966 |
| Female | 467 (54.7%) | $44,934 |
| Total | 854 (100.0%) | $60,573 |
Earnings by Sex by Income Bracket in New Baltimore
The most common earnings brackets in New Baltimore are $100,000+ for men (89 | 23.0%) and $100,000+ for women (95 | 20.3%).
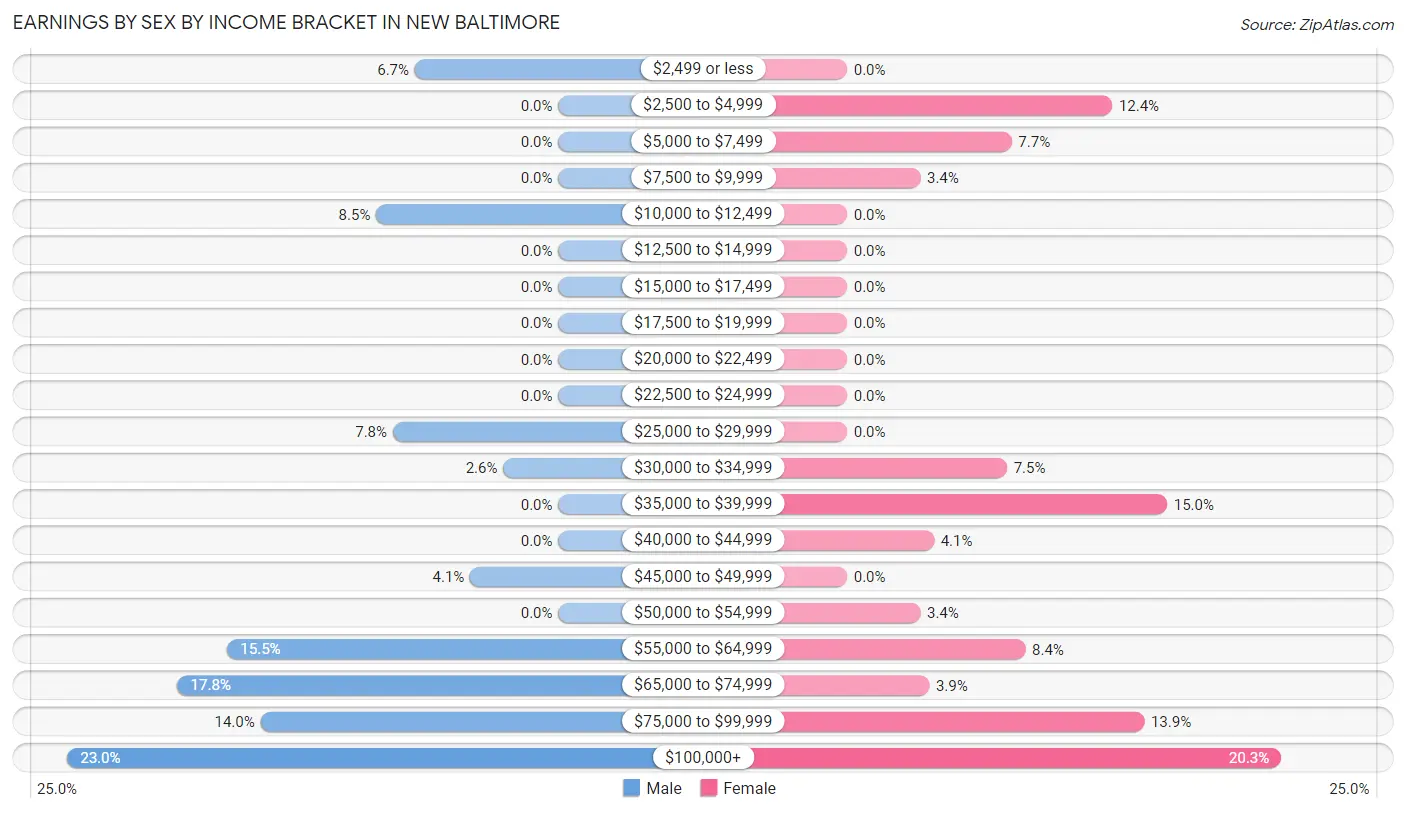
| Income | Male | Female |
| $2,499 or less | 26 (6.7%) | 0 (0.0%) |
| $2,500 to $4,999 | 0 (0.0%) | 58 (12.4%) |
| $5,000 to $7,499 | 0 (0.0%) | 36 (7.7%) |
| $7,500 to $9,999 | 0 (0.0%) | 16 (3.4%) |
| $10,000 to $12,499 | 33 (8.5%) | 0 (0.0%) |
| $12,500 to $14,999 | 0 (0.0%) | 0 (0.0%) |
| $15,000 to $17,499 | 0 (0.0%) | 0 (0.0%) |
| $17,500 to $19,999 | 0 (0.0%) | 0 (0.0%) |
| $20,000 to $22,499 | 0 (0.0%) | 0 (0.0%) |
| $22,500 to $24,999 | 0 (0.0%) | 0 (0.0%) |
| $25,000 to $29,999 | 30 (7.7%) | 0 (0.0%) |
| $30,000 to $34,999 | 10 (2.6%) | 35 (7.5%) |
| $35,000 to $39,999 | 0 (0.0%) | 70 (15.0%) |
| $40,000 to $44,999 | 0 (0.0%) | 19 (4.1%) |
| $45,000 to $49,999 | 16 (4.1%) | 0 (0.0%) |
| $50,000 to $54,999 | 0 (0.0%) | 16 (3.4%) |
| $55,000 to $64,999 | 60 (15.5%) | 39 (8.4%) |
| $65,000 to $74,999 | 69 (17.8%) | 18 (3.8%) |
| $75,000 to $99,999 | 54 (14.0%) | 65 (13.9%) |
| $100,000+ | 89 (23.0%) | 95 (20.3%) |
| Total | 387 (100.0%) | 467 (100.0%) |
Earnings by Sex by Educational Attainment in New Baltimore
Average earnings in New Baltimore are $73,108 for men and $44,934 for women, a difference of 38.5%. Men with an educational attainment of bachelor's degree enjoy the highest average annual earnings of $72,905, while those with bachelor's degree education earn the least with $72,905. Women with an educational attainment of graduate degree earn the most with the average annual earnings of $104,148, while those with college or associate's degree education have the smallest earnings of $55,801.
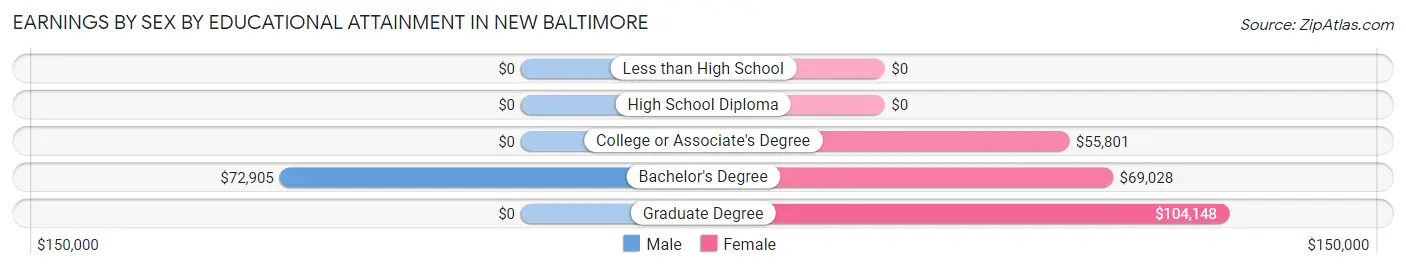
| Educational Attainment | Male Income | Female Income |
| Less than High School | - | - |
| High School Diploma | - | - |
| College or Associate's Degree | - | - |
| Bachelor's Degree | $72,905 | $69,028 |
| Graduate Degree | - | - |
| Total | $73,108 | $44,934 |
Family Income in New Baltimore
Family Income Brackets in New Baltimore
According to the New Baltimore family income data, there are 147 families falling into the $150,000 to $199,999 income range, which is the most common income bracket and makes up 39.0% of all families.
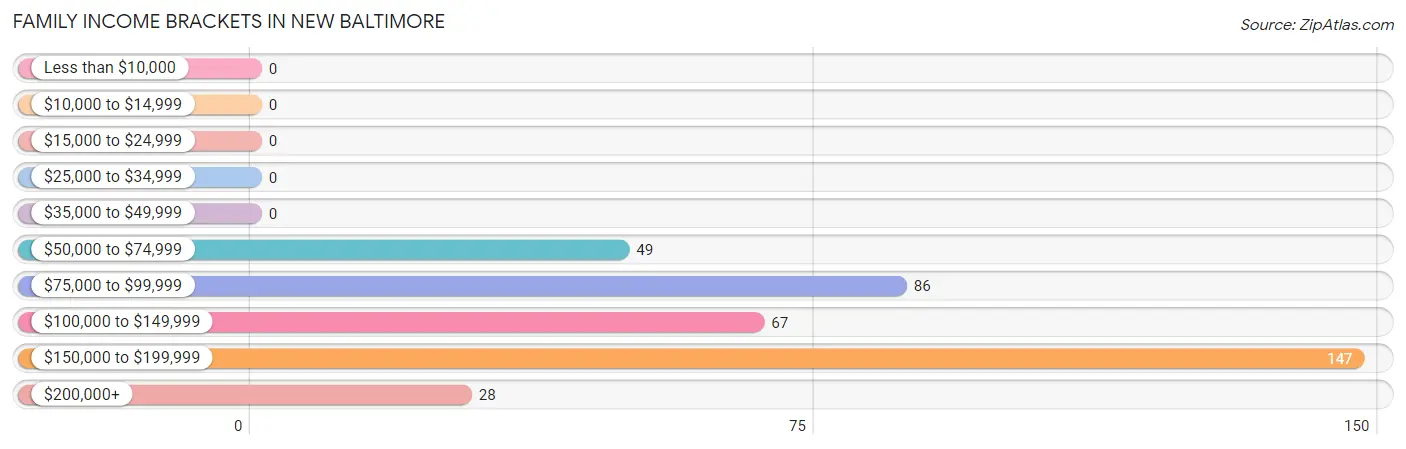
| Income Bracket | # Families | % Families |
| Less than $10,000 | 0 | 0.0% |
| $10,000 to $14,999 | 0 | 0.0% |
| $15,000 to $24,999 | 0 | 0.0% |
| $25,000 to $34,999 | 0 | 0.0% |
| $35,000 to $49,999 | 0 | 0.0% |
| $50,000 to $74,999 | 49 | 13.0% |
| $75,000 to $99,999 | 86 | 22.8% |
| $100,000 to $149,999 | 67 | 17.8% |
| $150,000 to $199,999 | 147 | 39.0% |
| $200,000+ | 28 | 7.4% |
Family Income by Famaliy Size in New Baltimore
4-person families (118 | 31.3%) account for the highest median family income in New Baltimore with $183,654 per family, while 2-person families (56 | 14.8%) have the highest median income of $71,875 per family member.
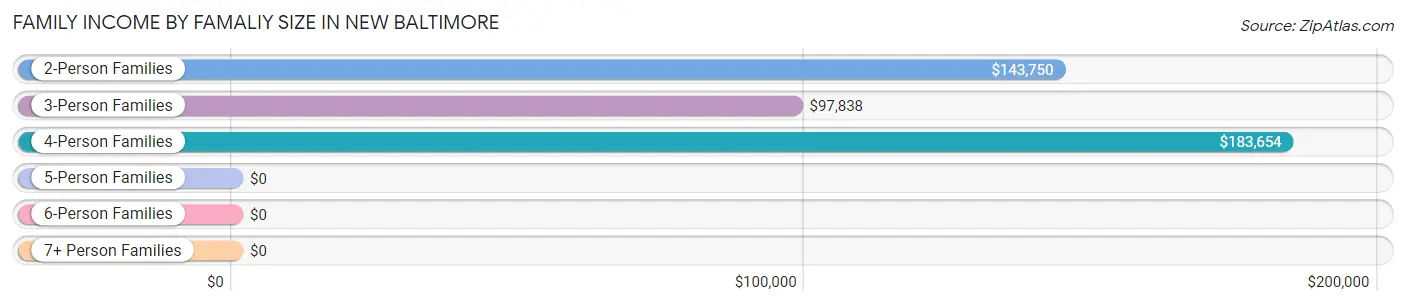
| Income Bracket | # Families | Median Income |
| 2-Person Families | 56 (14.8%) | $143,750 |
| 3-Person Families | 150 (39.8%) | $97,838 |
| 4-Person Families | 118 (31.3%) | $183,654 |
| 5-Person Families | 36 (9.6%) | $0 |
| 6-Person Families | 17 (4.5%) | $0 |
| 7+ Person Families | 0 (0.0%) | $0 |
| Total | 377 (100.0%) | $148,466 |
Family Income by Number of Earners in New Baltimore
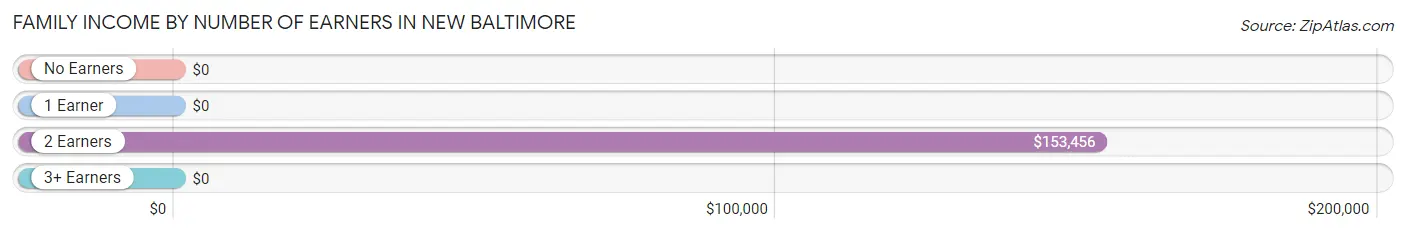
| Number of Earners | # Families | Median Income |
| No Earners | 0 (0.0%) | $0 |
| 1 Earner | 28 (7.4%) | $0 |
| 2 Earners | 291 (77.2%) | $153,456 |
| 3+ Earners | 58 (15.4%) | $0 |
| Total | 377 (100.0%) | $148,466 |
Household Income in New Baltimore
Household Income Brackets in New Baltimore
With 147 households falling in the category, the $150,000 to $199,999 income range is the most frequent in New Baltimore, accounting for 30.4% of all households.
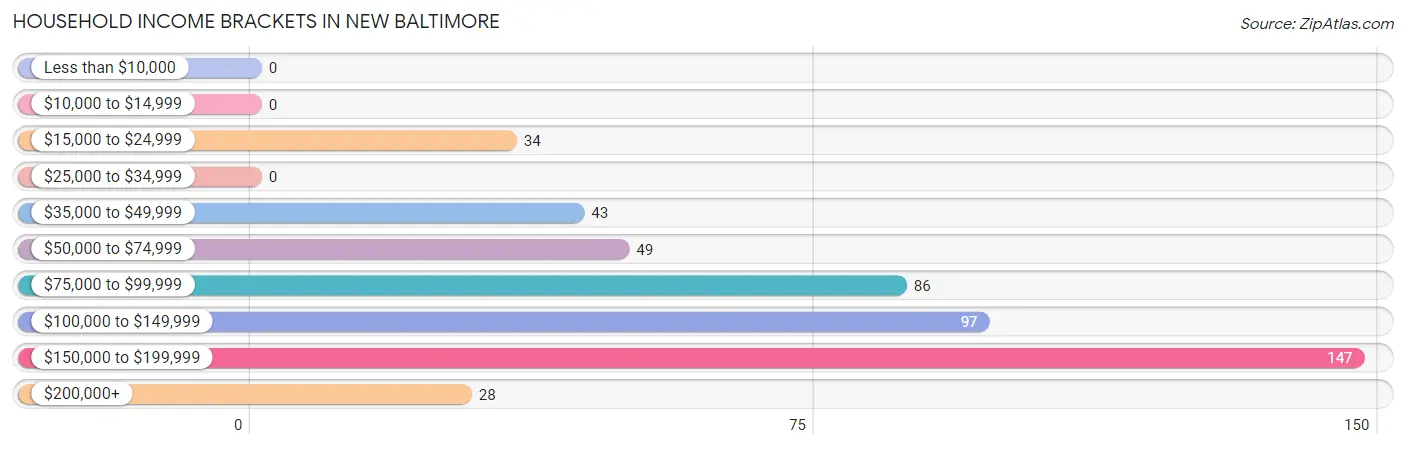
| Income Bracket | # Households | % Households |
| Less than $10,000 | 0 | 0.0% |
| $10,000 to $14,999 | 0 | 0.0% |
| $15,000 to $24,999 | 34 | 7.0% |
| $25,000 to $34,999 | 0 | 0.0% |
| $35,000 to $49,999 | 43 | 8.9% |
| $50,000 to $74,999 | 49 | 10.1% |
| $75,000 to $99,999 | 86 | 17.8% |
| $100,000 to $149,999 | 97 | 20.0% |
| $150,000 to $199,999 | 147 | 30.4% |
| $200,000+ | 28 | 5.8% |
Household Income by Householder Age in New Baltimore
The median household income in New Baltimore is $130,625, with the highest median household income of $154,412 found in the 25 to 44 years age bracket for the primary householder. A total of 252 households (52.1%) fall into this category.
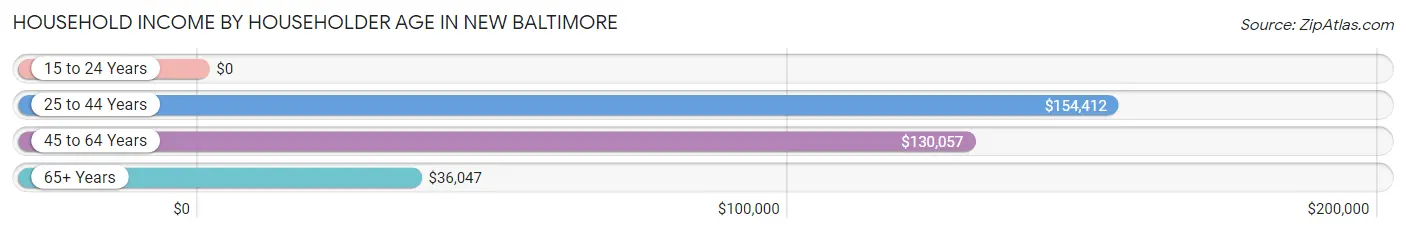
| Income Bracket | # Households | Median Income |
| 15 to 24 Years | 0 (0.0%) | $0 |
| 25 to 44 Years | 252 (52.1%) | $154,412 |
| 45 to 64 Years | 164 (33.9%) | $130,057 |
| 65+ Years | 68 (14.1%) | $36,047 |
| Total | 484 (100.0%) | $130,625 |
Poverty in New Baltimore
Income Below Poverty by Sex and Age in New Baltimore
With 2.7% poverty level for males and 2.0% for females among the residents of New Baltimore, 55 to 64 year old males and 45 to 54 year old females are the most vulnerable to poverty, with 18 males (17.8%) and 16 females (9.4%) in their respective age groups living below the poverty level.
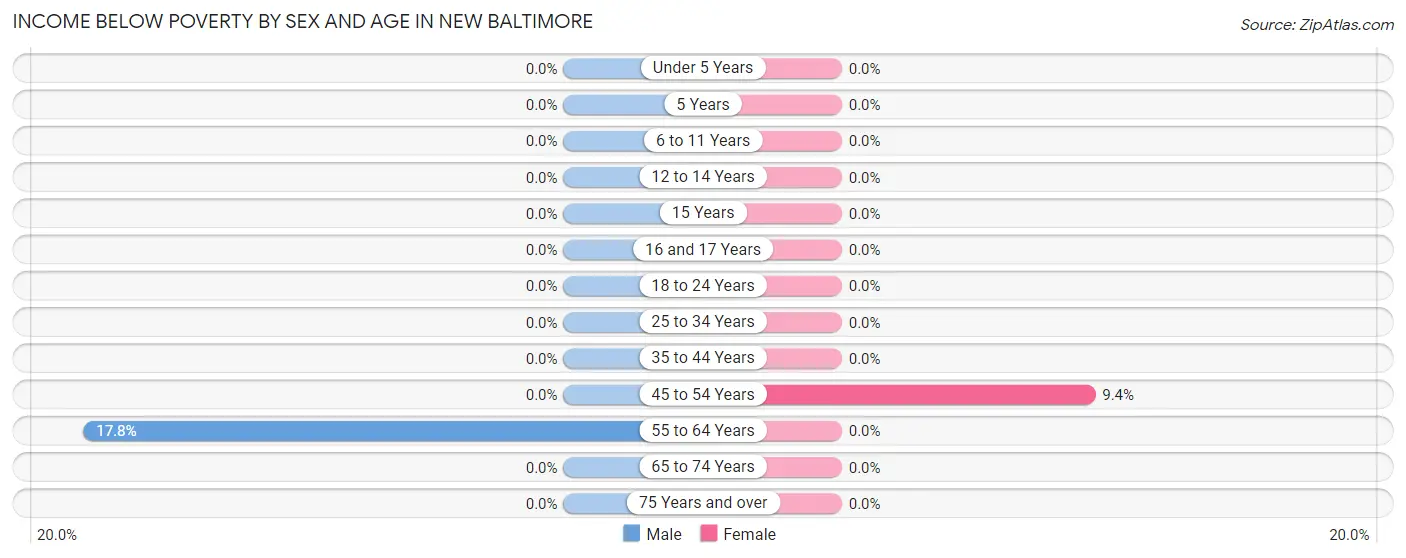
| Age Bracket | Male | Female |
| Under 5 Years | 0 (0.0%) | 0 (0.0%) |
| 5 Years | 0 (0.0%) | 0 (0.0%) |
| 6 to 11 Years | 0 (0.0%) | 0 (0.0%) |
| 12 to 14 Years | 0 (0.0%) | 0 (0.0%) |
| 15 Years | 0 (0.0%) | 0 (0.0%) |
| 16 and 17 Years | 0 (0.0%) | 0 (0.0%) |
| 18 to 24 Years | 0 (0.0%) | 0 (0.0%) |
| 25 to 34 Years | 0 (0.0%) | 0 (0.0%) |
| 35 to 44 Years | 0 (0.0%) | 0 (0.0%) |
| 45 to 54 Years | 0 (0.0%) | 16 (9.4%) |
| 55 to 64 Years | 18 (17.8%) | 0 (0.0%) |
| 65 to 74 Years | 0 (0.0%) | 0 (0.0%) |
| 75 Years and over | 0 (0.0%) | 0 (0.0%) |
| Total | 18 (2.7%) | 16 (2.0%) |
Income Above Poverty by Sex and Age in New Baltimore
According to the poverty statistics in New Baltimore, males aged under 5 years and females aged under 5 years are the age groups that are most secure financially, with 100.0% of males and 100.0% of females in these age groups living above the poverty line.
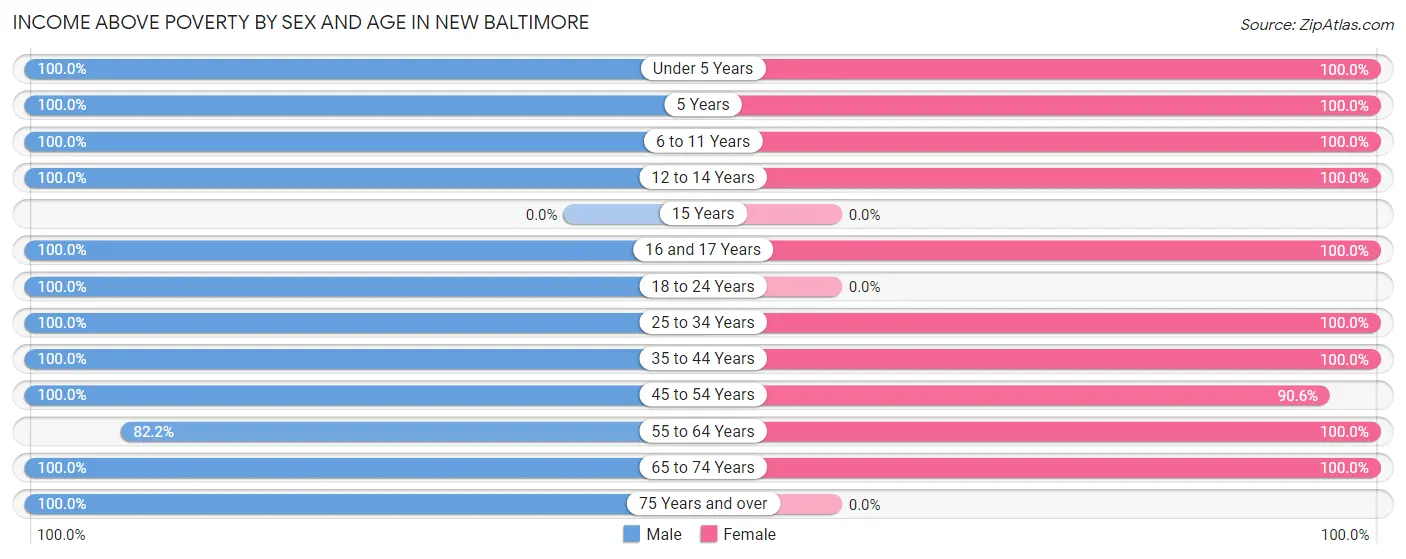
| Age Bracket | Male | Female |
| Under 5 Years | 38 (100.0%) | 20 (100.0%) |
| 5 Years | 39 (100.0%) | 41 (100.0%) |
| 6 to 11 Years | 71 (100.0%) | 152 (100.0%) |
| 12 to 14 Years | 36 (100.0%) | 64 (100.0%) |
| 15 Years | 0 (0.0%) | 0 (0.0%) |
| 16 and 17 Years | 12 (100.0%) | 36 (100.0%) |
| 18 to 24 Years | 33 (100.0%) | 0 (0.0%) |
| 25 to 34 Years | 53 (100.0%) | 80 (100.0%) |
| 35 to 44 Years | 198 (100.0%) | 167 (100.0%) |
| 45 to 54 Years | 13 (100.0%) | 154 (90.6%) |
| 55 to 64 Years | 83 (82.2%) | 50 (100.0%) |
| 65 to 74 Years | 25 (100.0%) | 15 (100.0%) |
| 75 Years and over | 43 (100.0%) | 0 (0.0%) |
| Total | 644 (97.3%) | 779 (98.0%) |
Income Below Poverty Among Married-Couple Families in New Baltimore
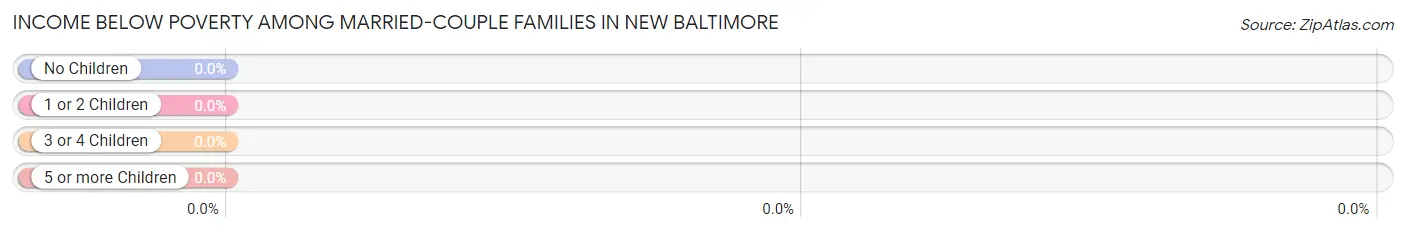
| Children | Above Poverty | Below Poverty |
| No Children | 51 (100.0%) | 0 (0.0%) |
| 1 or 2 Children | 224 (100.0%) | 0 (0.0%) |
| 3 or 4 Children | 39 (100.0%) | 0 (0.0%) |
| 5 or more Children | 0 (0.0%) | 0 (0.0%) |
| Total | 314 (100.0%) | 0 (0.0%) |
Income Below Poverty Among Single-Parent Households in New Baltimore
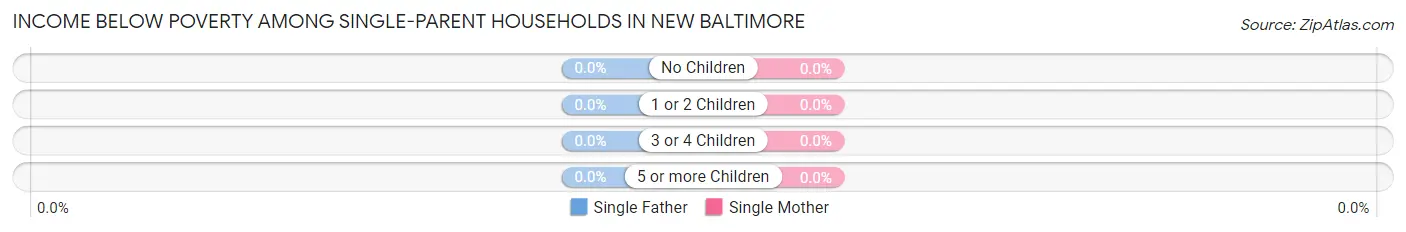
| Children | Single Father | Single Mother |
| No Children | 0 (0.0%) | 0 (0.0%) |
| 1 or 2 Children | 0 (0.0%) | 0 (0.0%) |
| 3 or 4 Children | 0 (0.0%) | 0 (0.0%) |
| 5 or more Children | 0 (0.0%) | 0 (0.0%) |
| Total | 0 (0.0%) | 0 (0.0%) |
Income Below Poverty Among Married-Couple vs Single-Parent Households in New Baltimore
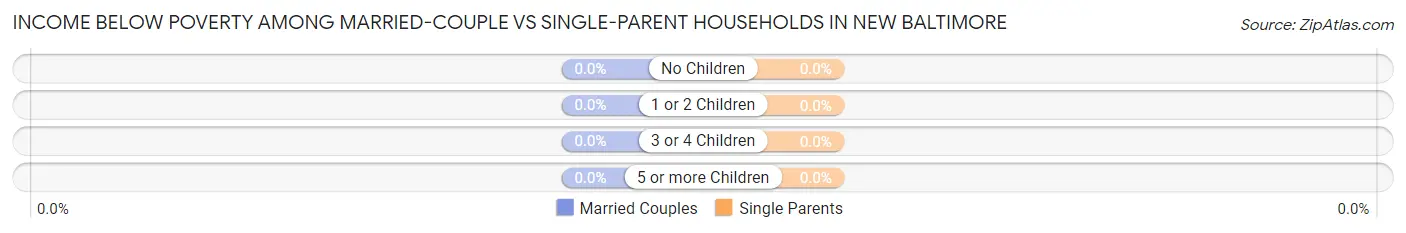
| Children | Married-Couple Families | Single-Parent Households |
| No Children | 0 (0.0%) | 0 (0.0%) |
| 1 or 2 Children | 0 (0.0%) | 0 (0.0%) |
| 3 or 4 Children | 0 (0.0%) | 0 (0.0%) |
| 5 or more Children | 0 (0.0%) | 0 (0.0%) |
| Total | 0 (0.0%) | 0 (0.0%) |
Employment Characteristics in New Baltimore
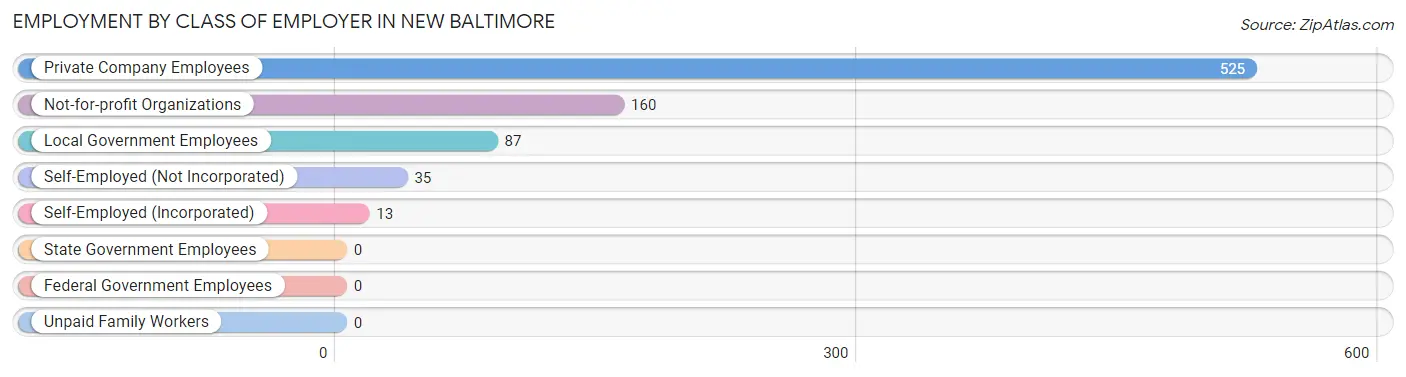
Employment by Class of Employer in New Baltimore
Among the 820 employed individuals in New Baltimore, private company employees (525 | 64.0%), not-for-profit organizations (160 | 19.5%), and local government employees (87 | 10.6%) make up the most common classes of employment.
| Employer Class | # Employees | % Employees |
| Private Company Employees | 525 | 64.0% |
| Self-Employed (Incorporated) | 13 | 1.6% |
| Self-Employed (Not Incorporated) | 35 | 4.3% |
| Not-for-profit Organizations | 160 | 19.5% |
| Local Government Employees | 87 | 10.6% |
| State Government Employees | 0 | 0.0% |
| Federal Government Employees | 0 | 0.0% |
| Unpaid Family Workers | 0 | 0.0% |
| Total | 820 | 100.0% |
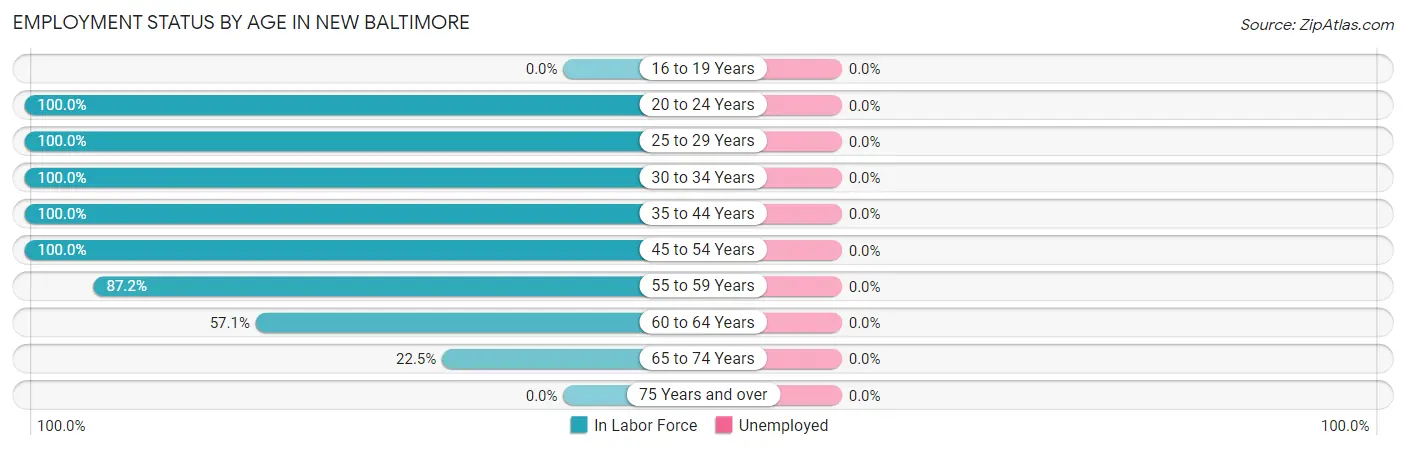
Employment Status by Age in New Baltimore
| Age Bracket | In Labor Force | Unemployed |
| 16 to 19 Years | 0 (0.0%) | 0 (0.0%) |
| 20 to 24 Years | 33 (100.0%) | 0 (0.0%) |
| 25 to 29 Years | 37 (100.0%) | 0 (0.0%) |
| 30 to 34 Years | 96 (100.0%) | 0 (0.0%) |
| 35 to 44 Years | 365 (100.0%) | 0 (0.0%) |
| 45 to 54 Years | 183 (100.0%) | 0 (0.0%) |
| 55 to 59 Years | 95 (87.2%) | 0 (0.0%) |
| 60 to 64 Years | 24 (57.1%) | 0 (0.0%) |
| 65 to 74 Years | 9 (22.5%) | 0 (0.0%) |
| 75 Years and over | 0 (0.0%) | 0 (0.0%) |
| Total | 842 (84.5%) | 0 (0.0%) |
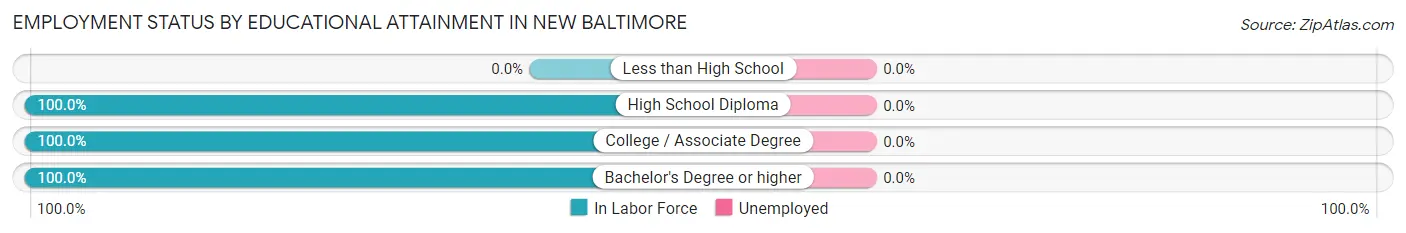
Employment Status by Educational Attainment in New Baltimore
| Educational Attainment | In Labor Force | Unemployed |
| Less than High School | 0 (0.0%) | 0 (0.0%) |
| High School Diploma | 213 (100.0%) | 0 (0.0%) |
| College / Associate Degree | 151 (100.0%) | 0 (0.0%) |
| Bachelor's Degree or higher | 436 (100.0%) | 0 (0.0%) |
| Total | 800 (96.2%) | 0 (0.0%) |
Employment Occupations by Sex in New Baltimore
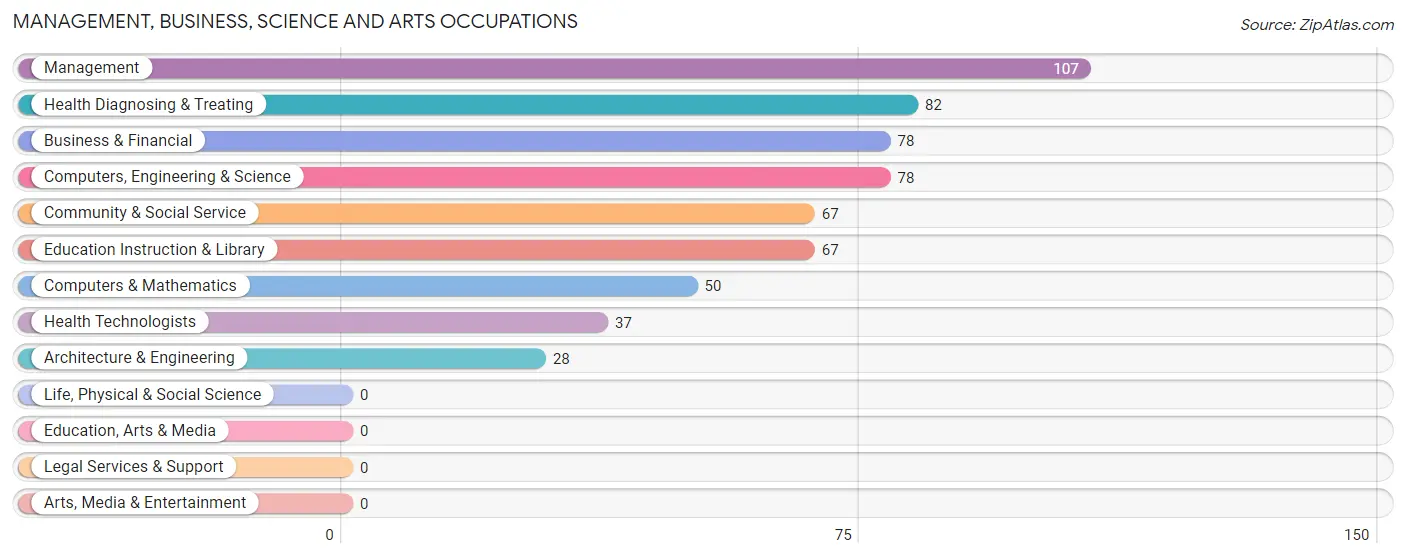
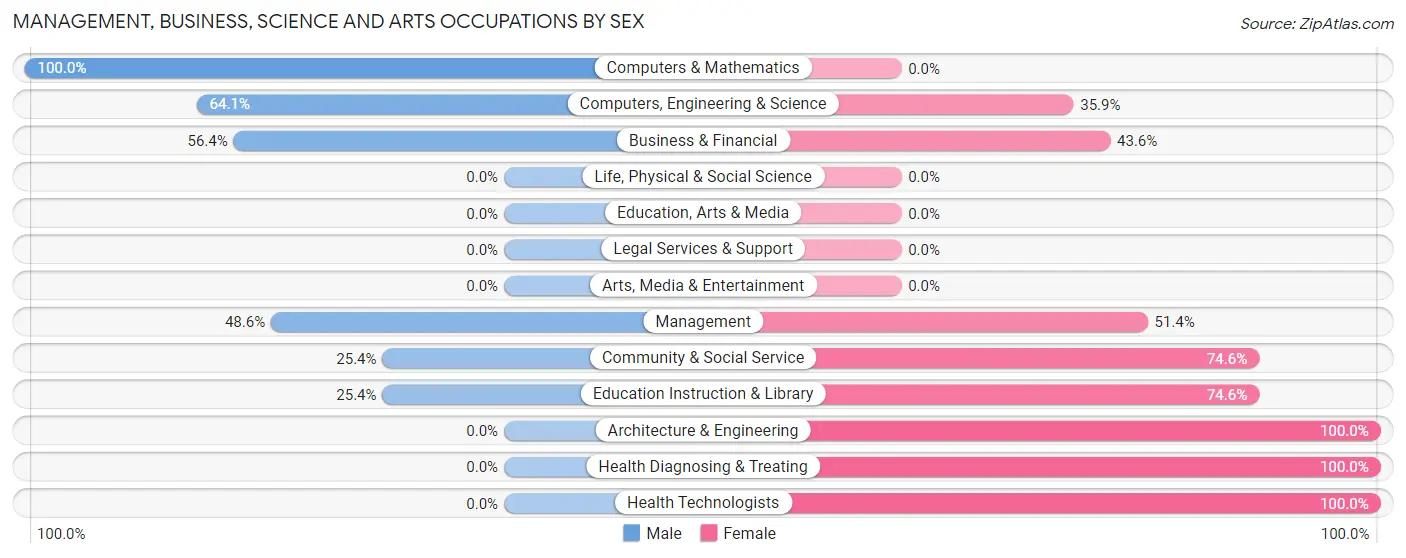
Management, Business, Science and Arts Occupations
The most common Management, Business, Science and Arts occupations in New Baltimore are Management (107 | 12.7%), Health Diagnosing & Treating (82 | 9.7%), Business & Financial (78 | 9.3%), Computers, Engineering & Science (78 | 9.3%), and Community & Social Service (67 | 8.0%).
Management, Business, Science and Arts Occupations by Sex
Within the Management, Business, Science and Arts occupations in New Baltimore, the most male-oriented occupations are Computers & Mathematics (100.0%), Computers, Engineering & Science (64.1%), and Business & Financial (56.4%), while the most female-oriented occupations are Architecture & Engineering (100.0%), Health Diagnosing & Treating (100.0%), and Health Technologists (100.0%).
| Occupation | Male | Female |
| Management | 52 (48.6%) | 55 (51.4%) |
| Business & Financial | 44 (56.4%) | 34 (43.6%) |
| Computers, Engineering & Science | 50 (64.1%) | 28 (35.9%) |
| Computers & Mathematics | 50 (100.0%) | 0 (0.0%) |
| Architecture & Engineering | 0 (0.0%) | 28 (100.0%) |
| Life, Physical & Social Science | 0 (0.0%) | 0 (0.0%) |
| Community & Social Service | 17 (25.4%) | 50 (74.6%) |
| Education, Arts & Media | 0 (0.0%) | 0 (0.0%) |
| Legal Services & Support | 0 (0.0%) | 0 (0.0%) |
| Education Instruction & Library | 17 (25.4%) | 50 (74.6%) |
| Arts, Media & Entertainment | 0 (0.0%) | 0 (0.0%) |
| Health Diagnosing & Treating | 0 (0.0%) | 82 (100.0%) |
| Health Technologists | 0 (0.0%) | 37 (100.0%) |
| Total (Category) | 163 (39.6%) | 249 (60.4%) |
| Total (Overall) | 375 (44.5%) | 467 (55.5%) |
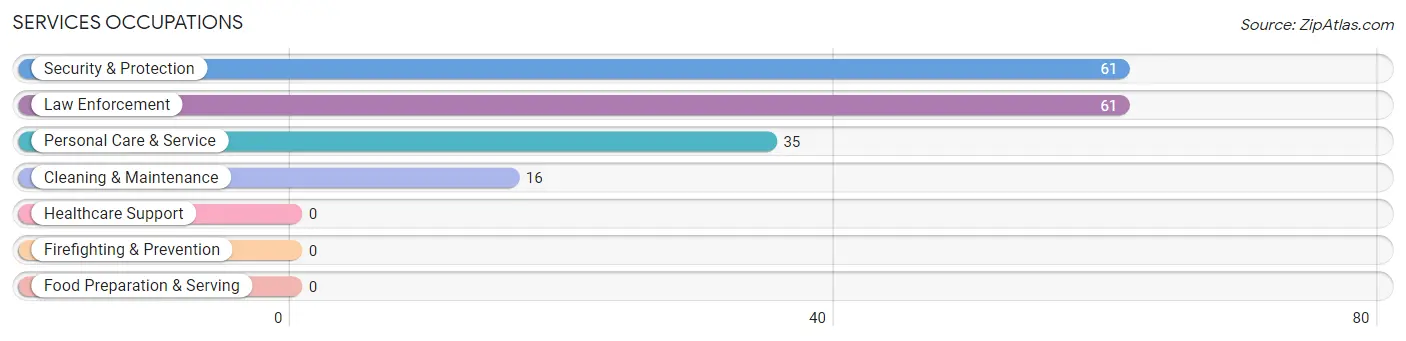
Services Occupations
The most common Services occupations in New Baltimore are Security & Protection (61 | 7.2%), Law Enforcement (61 | 7.2%), Personal Care & Service (35 | 4.2%), and Cleaning & Maintenance (16 | 1.9%).
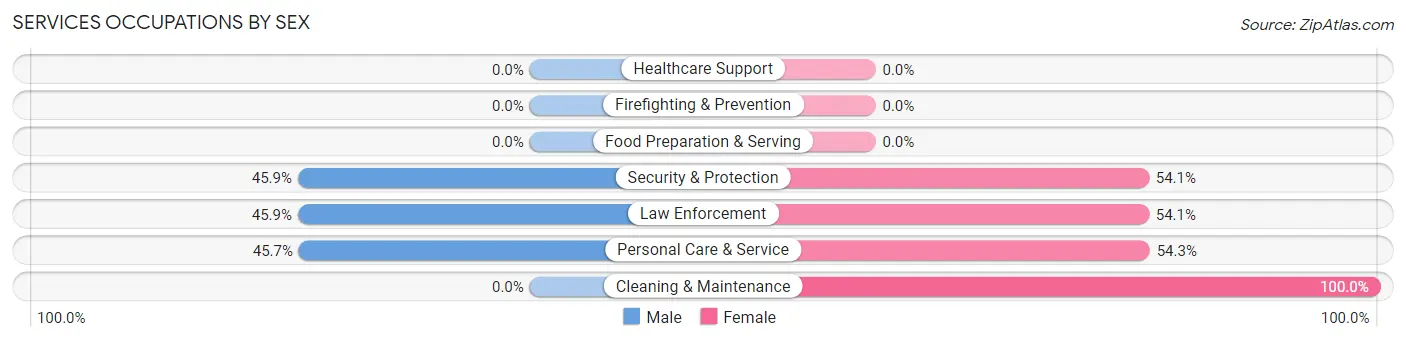
Services Occupations by Sex
Within the Services occupations in New Baltimore, the most male-oriented occupations are Security & Protection (45.9%), Law Enforcement (45.9%), and Personal Care & Service (45.7%), while the most female-oriented occupations are Cleaning & Maintenance (100.0%), Personal Care & Service (54.3%), and Security & Protection (54.1%).
| Occupation | Male | Female |
| Healthcare Support | 0 (0.0%) | 0 (0.0%) |
| Security & Protection | 28 (45.9%) | 33 (54.1%) |
| Firefighting & Prevention | 0 (0.0%) | 0 (0.0%) |
| Law Enforcement | 28 (45.9%) | 33 (54.1%) |
| Food Preparation & Serving | 0 (0.0%) | 0 (0.0%) |
| Cleaning & Maintenance | 0 (0.0%) | 16 (100.0%) |
| Personal Care & Service | 16 (45.7%) | 19 (54.3%) |
| Total (Category) | 44 (39.3%) | 68 (60.7%) |
| Total (Overall) | 375 (44.5%) | 467 (55.5%) |
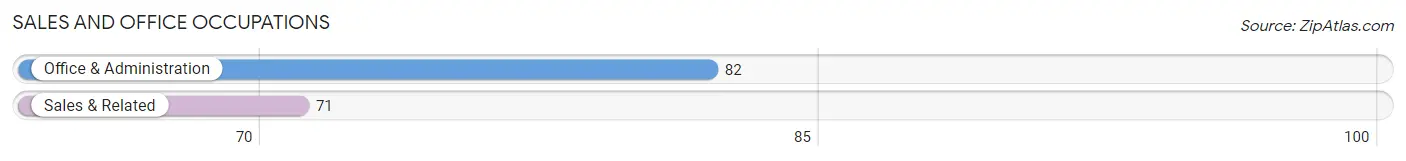
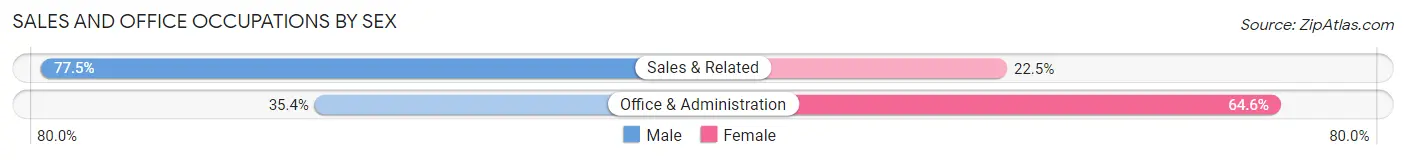
Sales and Office Occupations
The most common Sales and Office occupations in New Baltimore are Office & Administration (82 | 9.7%), and Sales & Related (71 | 8.4%).
Sales and Office Occupations by Sex
| Occupation | Male | Female |
| Sales & Related | 55 (77.5%) | 16 (22.5%) |
| Office & Administration | 29 (35.4%) | 53 (64.6%) |
| Total (Category) | 84 (54.9%) | 69 (45.1%) |
| Total (Overall) | 375 (44.5%) | 467 (55.5%) |
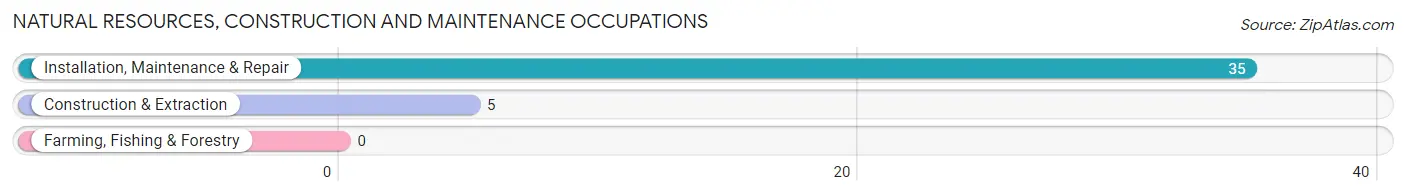
Natural Resources, Construction and Maintenance Occupations
The most common Natural Resources, Construction and Maintenance occupations in New Baltimore are Installation, Maintenance & Repair (35 | 4.2%), and Construction & Extraction (5 | 0.6%).
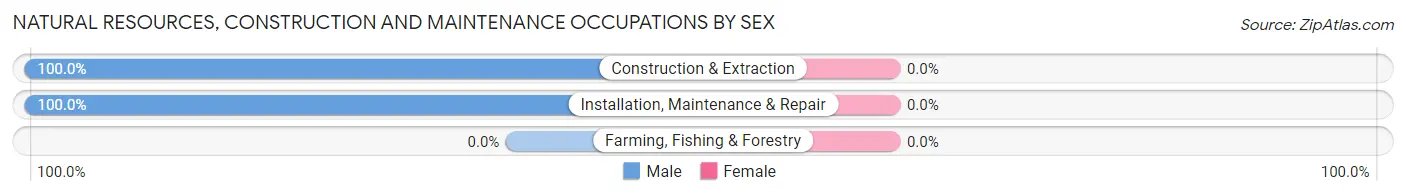
Natural Resources, Construction and Maintenance Occupations by Sex
| Occupation | Male | Female |
| Farming, Fishing & Forestry | 0 (0.0%) | 0 (0.0%) |
| Construction & Extraction | 5 (100.0%) | 0 (0.0%) |
| Installation, Maintenance & Repair | 35 (100.0%) | 0 (0.0%) |
| Total (Category) | 40 (100.0%) | 0 (0.0%) |
| Total (Overall) | 375 (44.5%) | 467 (55.5%) |
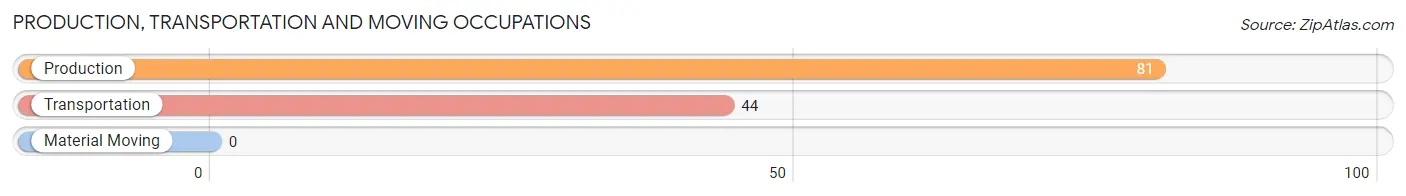
Production, Transportation and Moving Occupations
The most common Production, Transportation and Moving occupations in New Baltimore are Production (81 | 9.6%), and Transportation (44 | 5.2%).
Production, Transportation and Moving Occupations by Sex
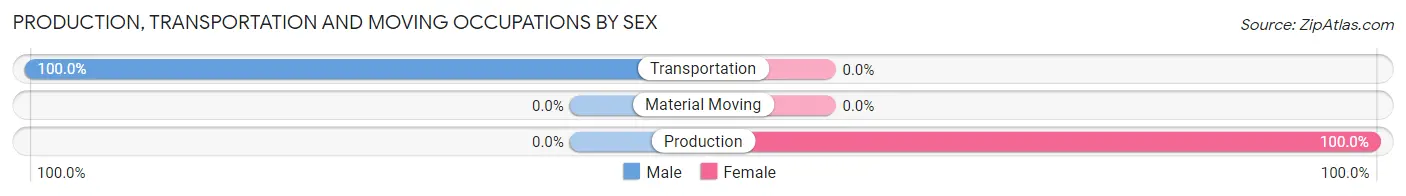
| Occupation | Male | Female |
| Production | 0 (0.0%) | 81 (100.0%) |
| Transportation | 44 (100.0%) | 0 (0.0%) |
| Material Moving | 0 (0.0%) | 0 (0.0%) |
| Total (Category) | 44 (35.2%) | 81 (64.8%) |
| Total (Overall) | 375 (44.5%) | 467 (55.5%) |
Employment Industries by Sex in New Baltimore
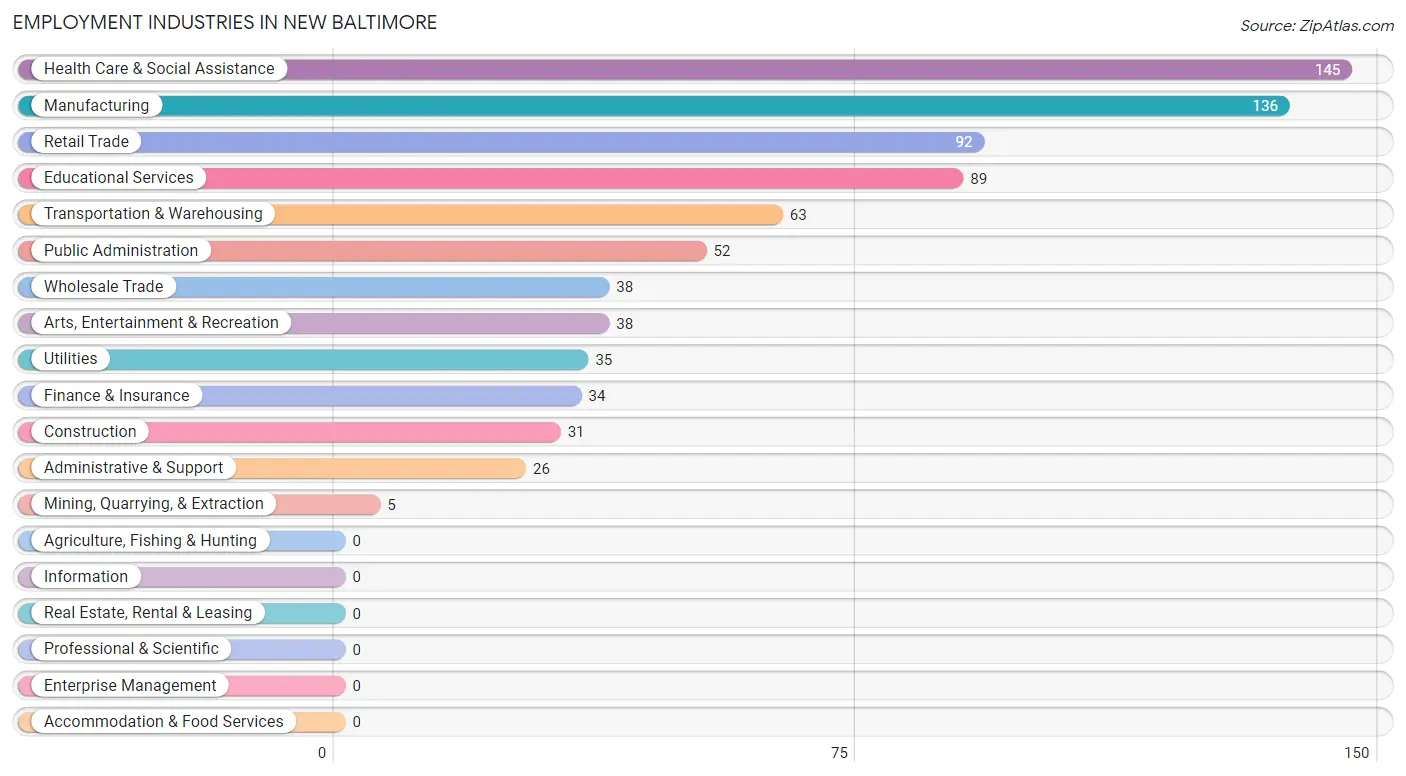
Employment Industries in New Baltimore
The major employment industries in New Baltimore include Health Care & Social Assistance (145 | 17.2%), Manufacturing (136 | 16.2%), Retail Trade (92 | 10.9%), Educational Services (89 | 10.6%), and Transportation & Warehousing (63 | 7.5%).
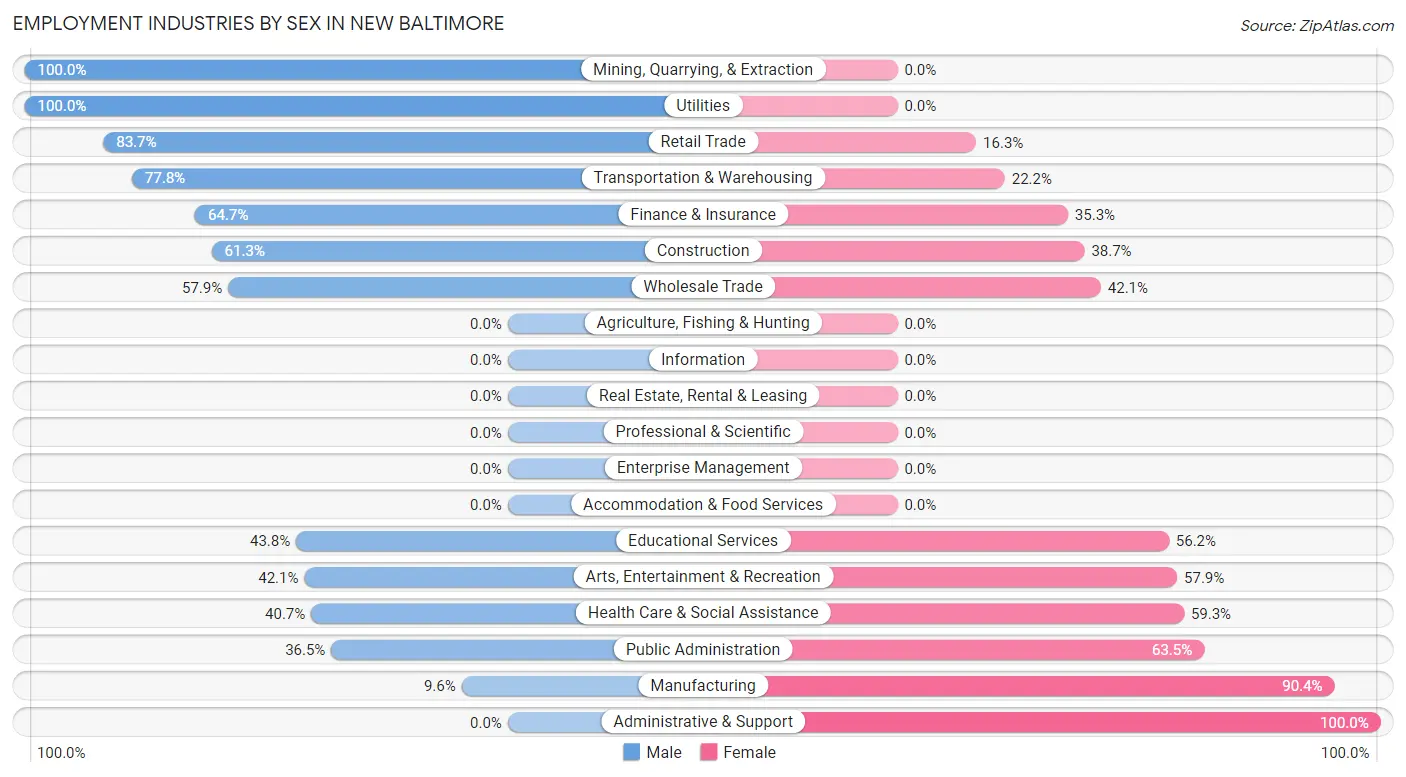
Employment Industries by Sex in New Baltimore
The New Baltimore industries that see more men than women are Mining, Quarrying, & Extraction (100.0%), Utilities (100.0%), and Retail Trade (83.7%), whereas the industries that tend to have a higher number of women are Administrative & Support (100.0%), Manufacturing (90.4%), and Public Administration (63.5%).
| Industry | Male | Female |
| Agriculture, Fishing & Hunting | 0 (0.0%) | 0 (0.0%) |
| Mining, Quarrying, & Extraction | 5 (100.0%) | 0 (0.0%) |
| Construction | 19 (61.3%) | 12 (38.7%) |
| Manufacturing | 13 (9.6%) | 123 (90.4%) |
| Wholesale Trade | 22 (57.9%) | 16 (42.1%) |
| Retail Trade | 77 (83.7%) | 15 (16.3%) |
| Transportation & Warehousing | 49 (77.8%) | 14 (22.2%) |
| Utilities | 35 (100.0%) | 0 (0.0%) |
| Information | 0 (0.0%) | 0 (0.0%) |
| Finance & Insurance | 22 (64.7%) | 12 (35.3%) |
| Real Estate, Rental & Leasing | 0 (0.0%) | 0 (0.0%) |
| Professional & Scientific | 0 (0.0%) | 0 (0.0%) |
| Enterprise Management | 0 (0.0%) | 0 (0.0%) |
| Administrative & Support | 0 (0.0%) | 26 (100.0%) |
| Educational Services | 39 (43.8%) | 50 (56.2%) |
| Health Care & Social Assistance | 59 (40.7%) | 86 (59.3%) |
| Arts, Entertainment & Recreation | 16 (42.1%) | 22 (57.9%) |
| Accommodation & Food Services | 0 (0.0%) | 0 (0.0%) |
| Public Administration | 19 (36.5%) | 33 (63.5%) |
| Total | 375 (44.5%) | 467 (55.5%) |
Education in New Baltimore
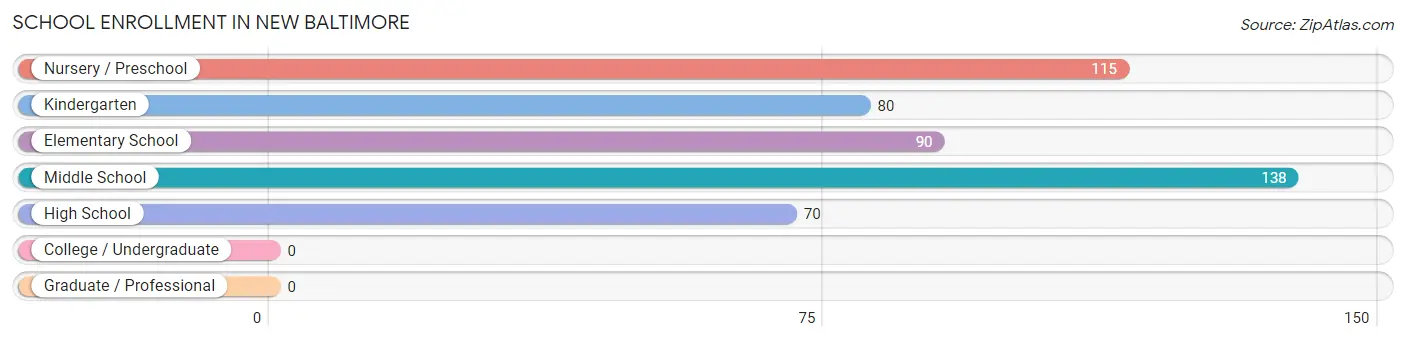
School Enrollment in New Baltimore
The most common levels of schooling among the 493 students in New Baltimore are middle school (138 | 28.0%), nursery / preschool (115 | 23.3%), and elementary school (90 | 18.3%).
| School Level | # Students | % Students |
| Nursery / Preschool | 115 | 23.3% |
| Kindergarten | 80 | 16.2% |
| Elementary School | 90 | 18.3% |
| Middle School | 138 | 28.0% |
| High School | 70 | 14.2% |
| College / Undergraduate | 0 | 0.0% |
| Graduate / Professional | 0 | 0.0% |
| Total | 493 | 100.0% |
School Enrollment by Age by Funding Source in New Baltimore
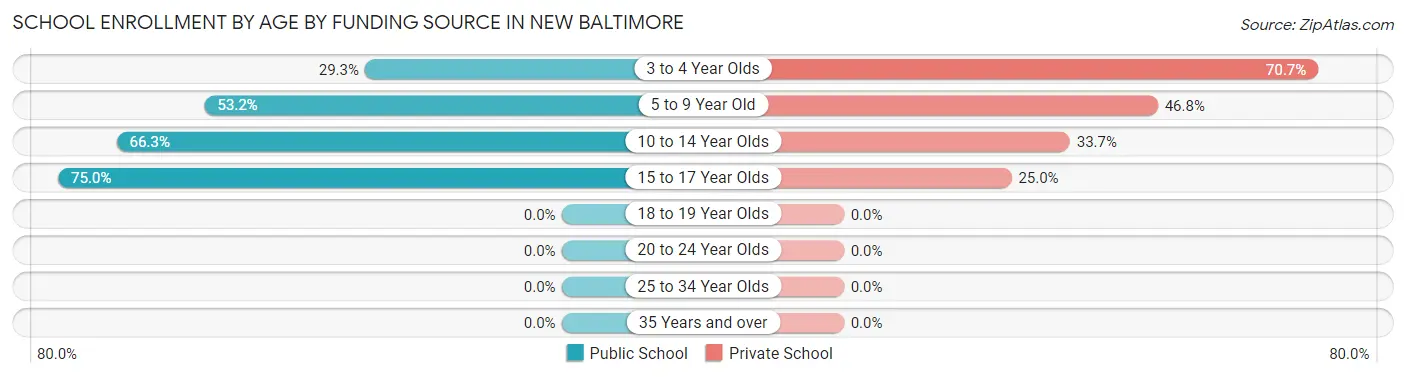
Out of a total of 493 students who are enrolled in schools in New Baltimore, 210 (42.6%) attend a private institution, while the remaining 283 (57.4%) are enrolled in public schools. The age group of 3 to 4 year olds has the highest likelihood of being enrolled in private schools, with 41 (70.7% in the age bracket) enrolled. Conversely, the age group of 15 to 17 year olds has the lowest likelihood of being enrolled in a private school, with 36 (75.0% in the age bracket) attending a public institution.
| Age Bracket | Public School | Private School |
| 3 to 4 Year Olds | 17 (29.3%) | 41 (70.7%) |
| 5 to 9 Year Old | 108 (53.2%) | 95 (46.8%) |
| 10 to 14 Year Olds | 122 (66.3%) | 62 (33.7%) |
| 15 to 17 Year Olds | 36 (75.0%) | 12 (25.0%) |
| 18 to 19 Year Olds | 0 (0.0%) | 0 (0.0%) |
| 20 to 24 Year Olds | 0 (0.0%) | 0 (0.0%) |
| 25 to 34 Year Olds | 0 (0.0%) | 0 (0.0%) |
| 35 Years and over | 0 (0.0%) | 0 (0.0%) |
| Total | 283 (57.4%) | 210 (42.6%) |
Educational Attainment by Field of Study in New Baltimore
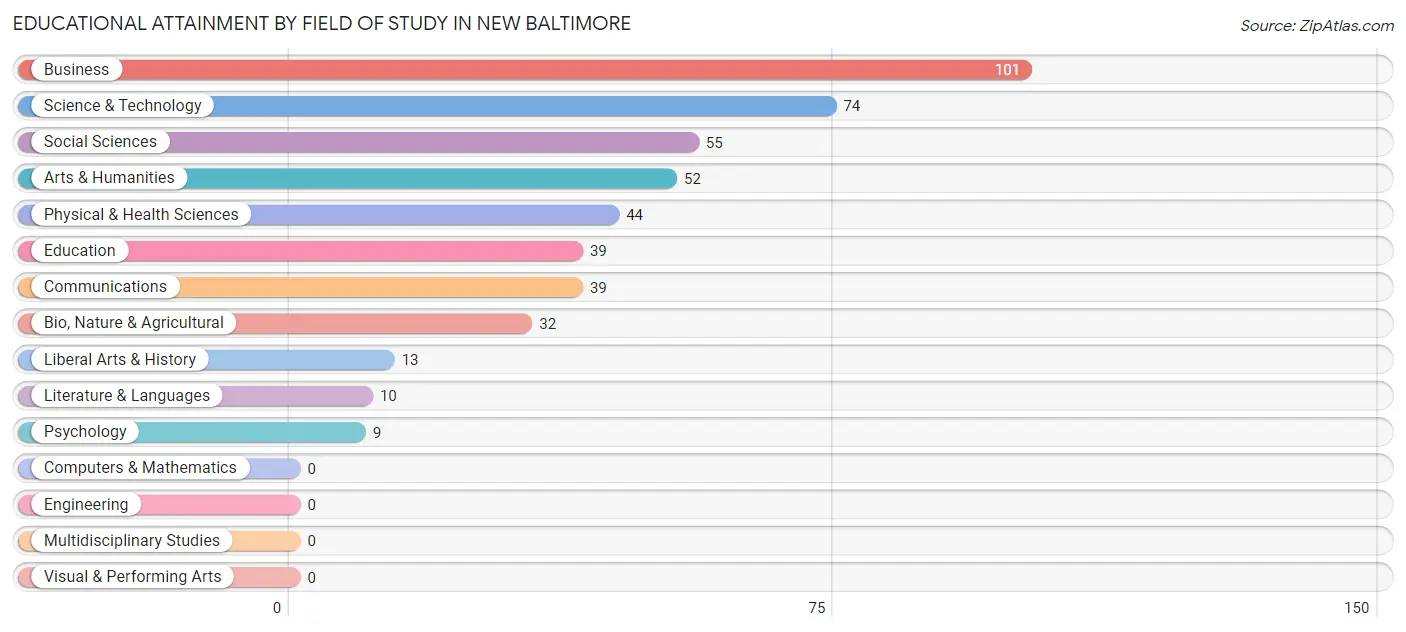
Business (101 | 21.6%), science & technology (74 | 15.8%), social sciences (55 | 11.7%), arts & humanities (52 | 11.1%), and physical & health sciences (44 | 9.4%) are the most common fields of study among 468 individuals in New Baltimore who have obtained a bachelor's degree or higher.
| Field of Study | # Graduates | % Graduates |
| Computers & Mathematics | 0 | 0.0% |
| Bio, Nature & Agricultural | 32 | 6.8% |
| Physical & Health Sciences | 44 | 9.4% |
| Psychology | 9 | 1.9% |
| Social Sciences | 55 | 11.7% |
| Engineering | 0 | 0.0% |
| Multidisciplinary Studies | 0 | 0.0% |
| Science & Technology | 74 | 15.8% |
| Business | 101 | 21.6% |
| Education | 39 | 8.3% |
| Literature & Languages | 10 | 2.1% |
| Liberal Arts & History | 13 | 2.8% |
| Visual & Performing Arts | 0 | 0.0% |
| Communications | 39 | 8.3% |
| Arts & Humanities | 52 | 11.1% |
| Total | 468 | 100.0% |
Transportation & Commute in New Baltimore
Vehicle Availability by Sex in New Baltimore
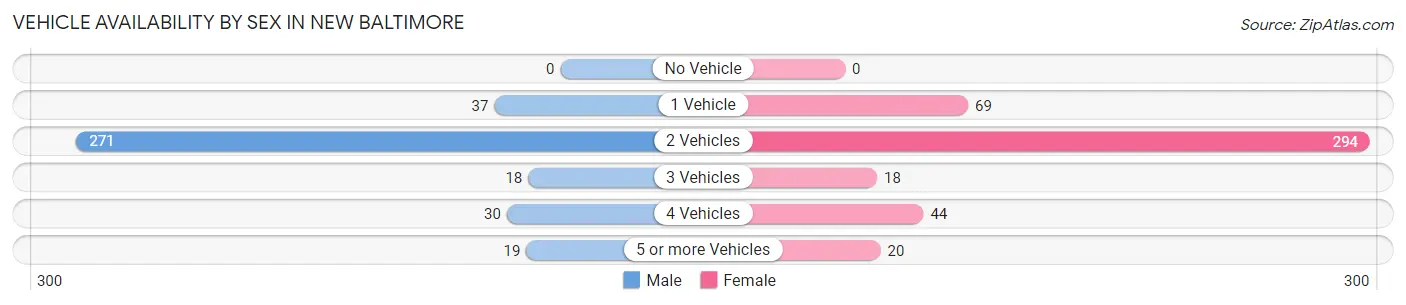
The most prevalent vehicle ownership categories in New Baltimore are males with 2 vehicles (271, accounting for 72.3%) and females with 2 vehicles (294, making up 60.9%).
| Vehicles Available | Male | Female |
| No Vehicle | 0 (0.0%) | 0 (0.0%) |
| 1 Vehicle | 37 (9.9%) | 69 (15.5%) |
| 2 Vehicles | 271 (72.3%) | 294 (66.1%) |
| 3 Vehicles | 18 (4.8%) | 18 (4.0%) |
| 4 Vehicles | 30 (8.0%) | 44 (9.9%) |
| 5 or more Vehicles | 19 (5.1%) | 20 (4.5%) |
| Total | 375 (100.0%) | 445 (100.0%) |
Commute Time in New Baltimore
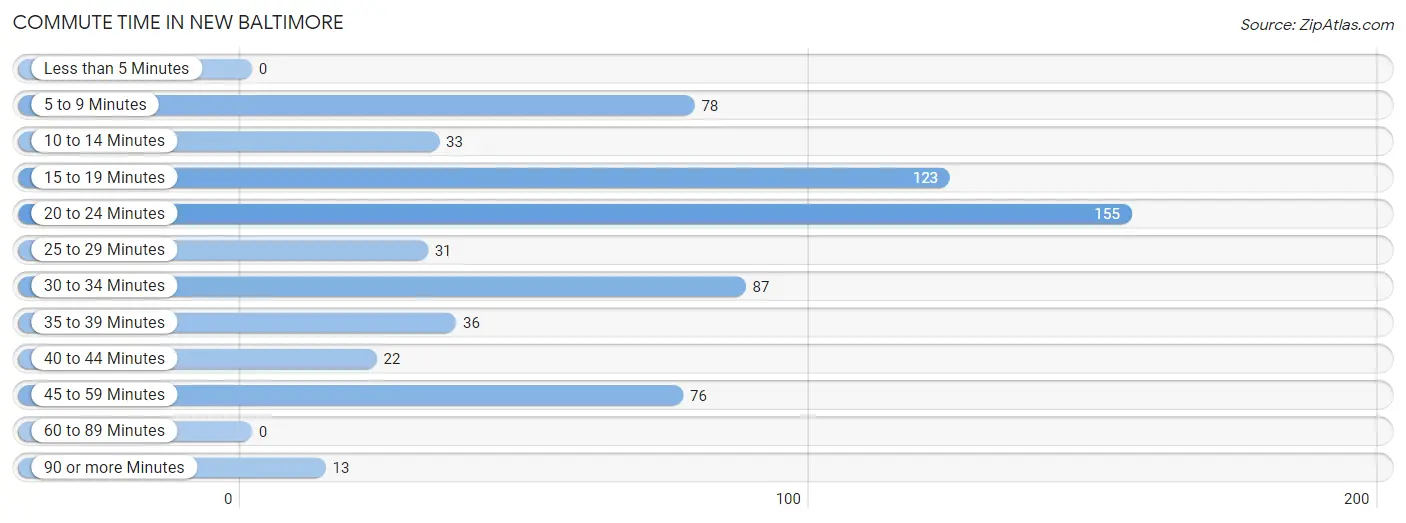
The most frequently occuring commute durations in New Baltimore are 20 to 24 minutes (155 commuters, 23.7%), 15 to 19 minutes (123 commuters, 18.8%), and 30 to 34 minutes (87 commuters, 13.3%).
| Commute Time | # Commuters | % Commuters |
| Less than 5 Minutes | 0 | 0.0% |
| 5 to 9 Minutes | 78 | 11.9% |
| 10 to 14 Minutes | 33 | 5.1% |
| 15 to 19 Minutes | 123 | 18.8% |
| 20 to 24 Minutes | 155 | 23.7% |
| 25 to 29 Minutes | 31 | 4.7% |
| 30 to 34 Minutes | 87 | 13.3% |
| 35 to 39 Minutes | 36 | 5.5% |
| 40 to 44 Minutes | 22 | 3.4% |
| 45 to 59 Minutes | 76 | 11.6% |
| 60 to 89 Minutes | 0 | 0.0% |
| 90 or more Minutes | 13 | 2.0% |
Commute Time by Sex in New Baltimore
The most common commute times in New Baltimore are 15 to 19 minutes (66 commuters, 20.7%) for males and 20 to 24 minutes (136 commuters, 40.5%) for females.
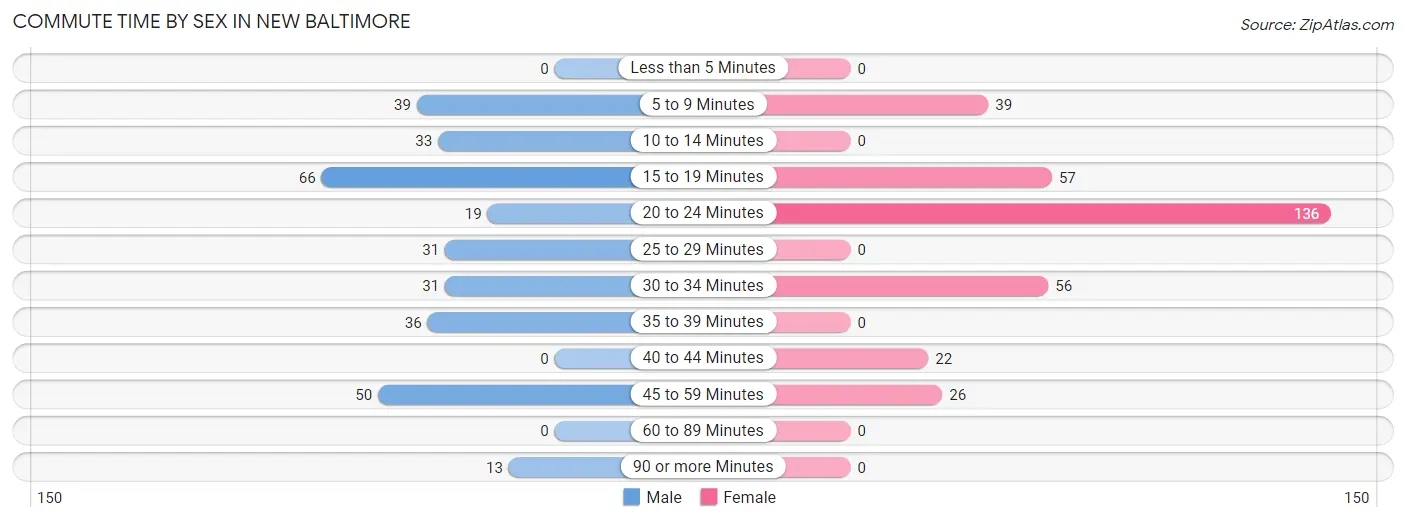
| Commute Time | Male | Female |
| Less than 5 Minutes | 0 (0.0%) | 0 (0.0%) |
| 5 to 9 Minutes | 39 (12.3%) | 39 (11.6%) |
| 10 to 14 Minutes | 33 (10.4%) | 0 (0.0%) |
| 15 to 19 Minutes | 66 (20.7%) | 57 (17.0%) |
| 20 to 24 Minutes | 19 (6.0%) | 136 (40.5%) |
| 25 to 29 Minutes | 31 (9.8%) | 0 (0.0%) |
| 30 to 34 Minutes | 31 (9.8%) | 56 (16.7%) |
| 35 to 39 Minutes | 36 (11.3%) | 0 (0.0%) |
| 40 to 44 Minutes | 0 (0.0%) | 22 (6.6%) |
| 45 to 59 Minutes | 50 (15.7%) | 26 (7.7%) |
| 60 to 89 Minutes | 0 (0.0%) | 0 (0.0%) |
| 90 or more Minutes | 13 (4.1%) | 0 (0.0%) |
Time of Departure to Work by Sex in New Baltimore
The most frequent times of departure to work in New Baltimore are 7:00 AM to 7:29 AM (86, 27.0%) for males and 7:00 AM to 7:29 AM (82, 24.4%) for females.
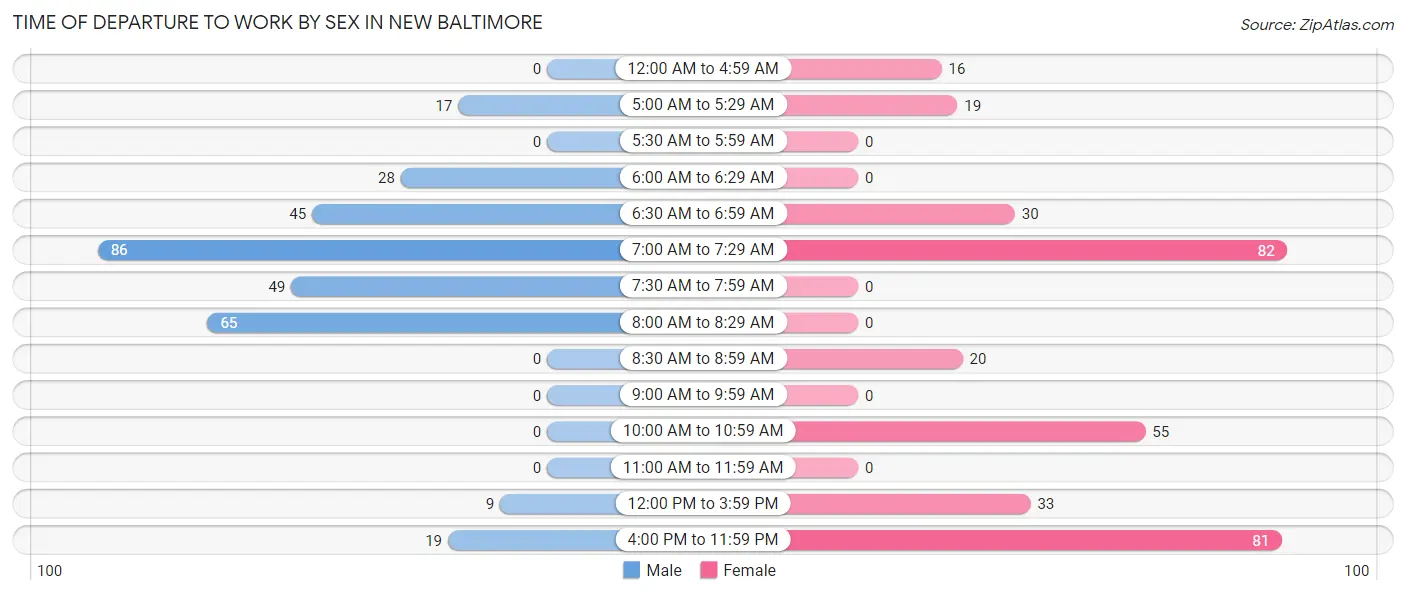
| Time of Departure | Male | Female |
| 12:00 AM to 4:59 AM | 0 (0.0%) | 16 (4.8%) |
| 5:00 AM to 5:29 AM | 17 (5.3%) | 19 (5.7%) |
| 5:30 AM to 5:59 AM | 0 (0.0%) | 0 (0.0%) |
| 6:00 AM to 6:29 AM | 28 (8.8%) | 0 (0.0%) |
| 6:30 AM to 6:59 AM | 45 (14.1%) | 30 (8.9%) |
| 7:00 AM to 7:29 AM | 86 (27.0%) | 82 (24.4%) |
| 7:30 AM to 7:59 AM | 49 (15.4%) | 0 (0.0%) |
| 8:00 AM to 8:29 AM | 65 (20.4%) | 0 (0.0%) |
| 8:30 AM to 8:59 AM | 0 (0.0%) | 20 (5.9%) |
| 9:00 AM to 9:59 AM | 0 (0.0%) | 0 (0.0%) |
| 10:00 AM to 10:59 AM | 0 (0.0%) | 55 (16.4%) |
| 11:00 AM to 11:59 AM | 0 (0.0%) | 0 (0.0%) |
| 12:00 PM to 3:59 PM | 9 (2.8%) | 33 (9.8%) |
| 4:00 PM to 11:59 PM | 19 (6.0%) | 81 (24.1%) |
| Total | 318 (100.0%) | 336 (100.0%) |
Housing Occupancy in New Baltimore
Occupancy by Ownership in New Baltimore
Of the total 484 dwellings in New Baltimore, owner-occupied units account for 435 (89.9%), while renter-occupied units make up 49 (10.1%).
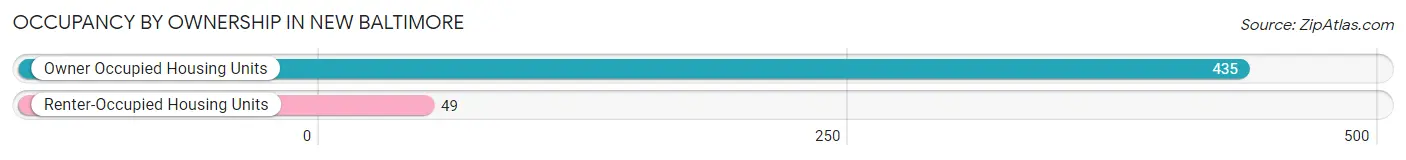
| Occupancy | # Housing Units | % Housing Units |
| Owner Occupied Housing Units | 435 | 89.9% |
| Renter-Occupied Housing Units | 49 | 10.1% |
| Total Occupied Housing Units | 484 | 100.0% |
Occupancy by Household Size in New Baltimore
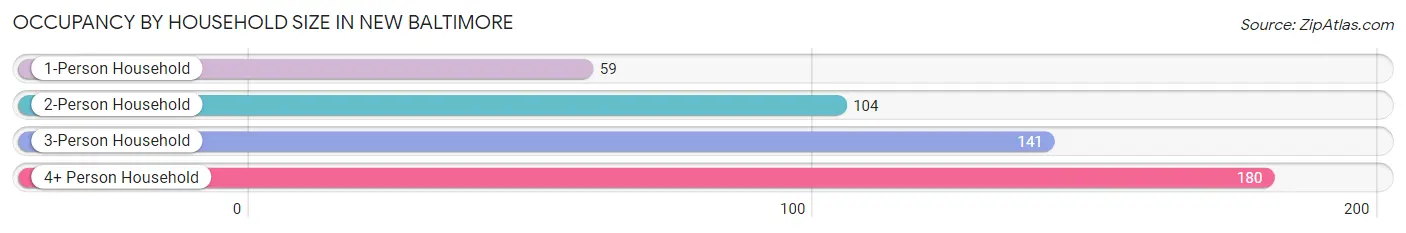
| Household Size | # Housing Units | % Housing Units |
| 1-Person Household | 59 | 12.2% |
| 2-Person Household | 104 | 21.5% |
| 3-Person Household | 141 | 29.1% |
| 4+ Person Household | 180 | 37.2% |
| Total Housing Units | 484 | 100.0% |
Occupancy by Ownership by Household Size in New Baltimore
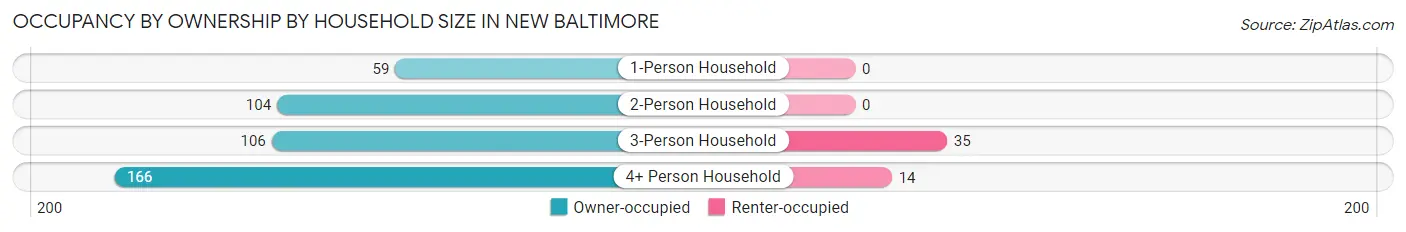
| Household Size | Owner-occupied | Renter-occupied |
| 1-Person Household | 59 (100.0%) | 0 (0.0%) |
| 2-Person Household | 104 (100.0%) | 0 (0.0%) |
| 3-Person Household | 106 (75.2%) | 35 (24.8%) |
| 4+ Person Household | 166 (92.2%) | 14 (7.8%) |
| Total Housing Units | 435 (89.9%) | 49 (10.1%) |
Occupancy by Educational Attainment in New Baltimore
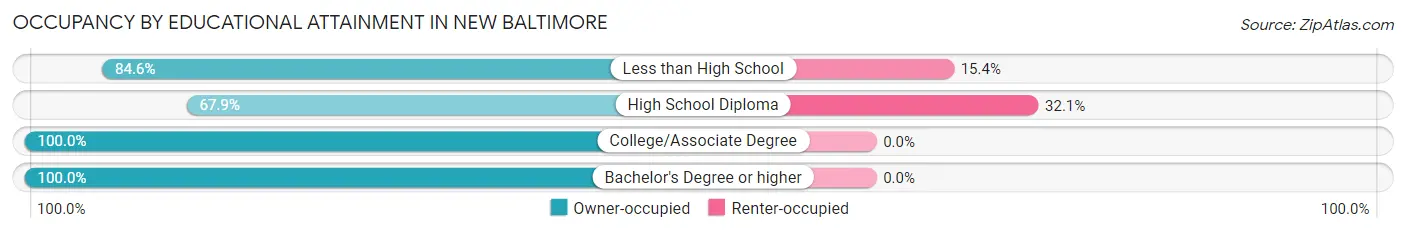
| Household Size | Owner-occupied | Renter-occupied |
| Less than High School | 77 (84.6%) | 14 (15.4%) |
| High School Diploma | 74 (67.9%) | 35 (32.1%) |
| College/Associate Degree | 74 (100.0%) | 0 (0.0%) |
| Bachelor's Degree or higher | 210 (100.0%) | 0 (0.0%) |
Occupancy by Age of Householder in New Baltimore
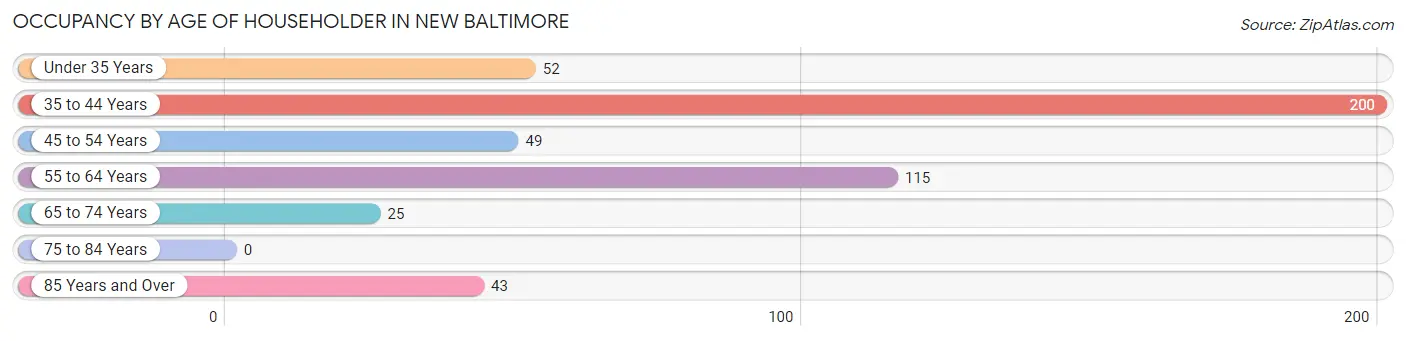
| Age Bracket | # Households | % Households |
| Under 35 Years | 52 | 10.7% |
| 35 to 44 Years | 200 | 41.3% |
| 45 to 54 Years | 49 | 10.1% |
| 55 to 64 Years | 115 | 23.8% |
| 65 to 74 Years | 25 | 5.2% |
| 75 to 84 Years | 0 | 0.0% |
| 85 Years and Over | 43 | 8.9% |
| Total | 484 | 100.0% |
Housing Finances in New Baltimore
Median Income by Occupancy in New Baltimore
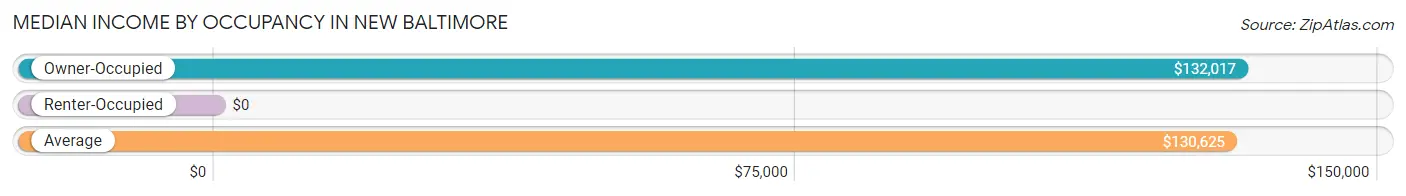
| Occupancy Type | # Households | Median Income |
| Owner-Occupied | 435 (89.9%) | $132,017 |
| Renter-Occupied | 49 (10.1%) | $0 |
| Average | 484 (100.0%) | $130,625 |
Occupancy by Householder Income Bracket in New Baltimore
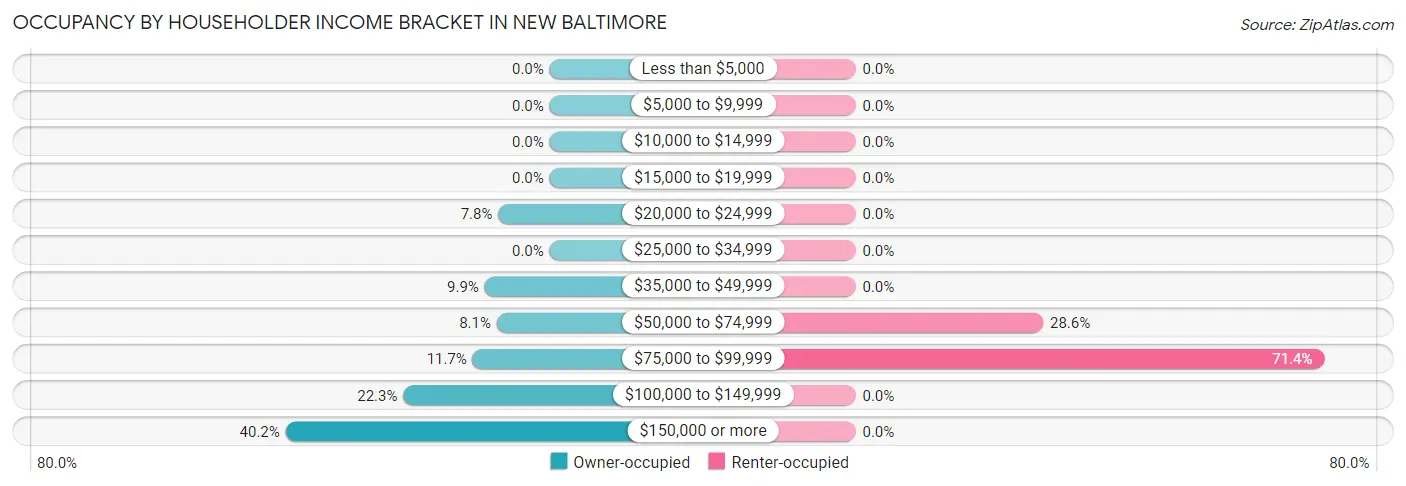
| Income Bracket | Owner-occupied | Renter-occupied |
| Less than $5,000 | 0 (0.0%) | 0 (0.0%) |
| $5,000 to $9,999 | 0 (0.0%) | 0 (0.0%) |
| $10,000 to $14,999 | 0 (0.0%) | 0 (0.0%) |
| $15,000 to $19,999 | 0 (0.0%) | 0 (0.0%) |
| $20,000 to $24,999 | 34 (7.8%) | 0 (0.0%) |
| $25,000 to $34,999 | 0 (0.0%) | 0 (0.0%) |
| $35,000 to $49,999 | 43 (9.9%) | 0 (0.0%) |
| $50,000 to $74,999 | 35 (8.1%) | 14 (28.6%) |
| $75,000 to $99,999 | 51 (11.7%) | 35 (71.4%) |
| $100,000 to $149,999 | 97 (22.3%) | 0 (0.0%) |
| $150,000 or more | 175 (40.2%) | 0 (0.0%) |
| Total | 435 (100.0%) | 49 (100.0%) |
Monthly Housing Cost Tiers in New Baltimore
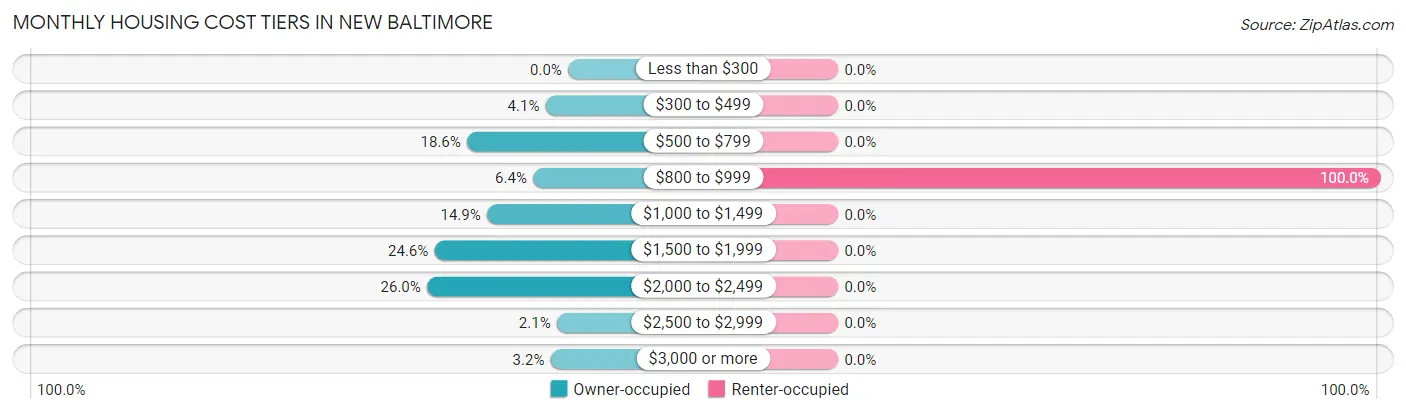
| Monthly Cost | Owner-occupied | Renter-occupied |
| Less than $300 | 0 (0.0%) | 0 (0.0%) |
| $300 to $499 | 18 (4.1%) | 0 (0.0%) |
| $500 to $799 | 81 (18.6%) | 0 (0.0%) |
| $800 to $999 | 28 (6.4%) | 49 (100.0%) |
| $1,000 to $1,499 | 65 (14.9%) | 0 (0.0%) |
| $1,500 to $1,999 | 107 (24.6%) | 0 (0.0%) |
| $2,000 to $2,499 | 113 (26.0%) | 0 (0.0%) |
| $2,500 to $2,999 | 9 (2.1%) | 0 (0.0%) |
| $3,000 or more | 14 (3.2%) | 0 (0.0%) |
| Total | 435 (100.0%) | 49 (100.0%) |
Physical Housing Characteristics in New Baltimore
Housing Structures in New Baltimore
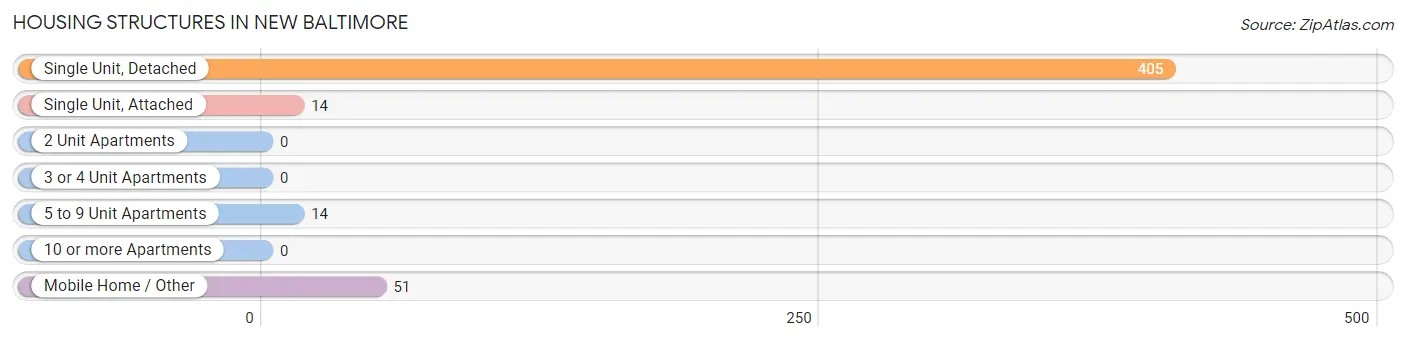
| Structure Type | # Housing Units | % Housing Units |
| Single Unit, Detached | 405 | 83.7% |
| Single Unit, Attached | 14 | 2.9% |
| 2 Unit Apartments | 0 | 0.0% |
| 3 or 4 Unit Apartments | 0 | 0.0% |
| 5 to 9 Unit Apartments | 14 | 2.9% |
| 10 or more Apartments | 0 | 0.0% |
| Mobile Home / Other | 51 | 10.5% |
| Total | 484 | 100.0% |
Housing Structures by Occupancy in New Baltimore
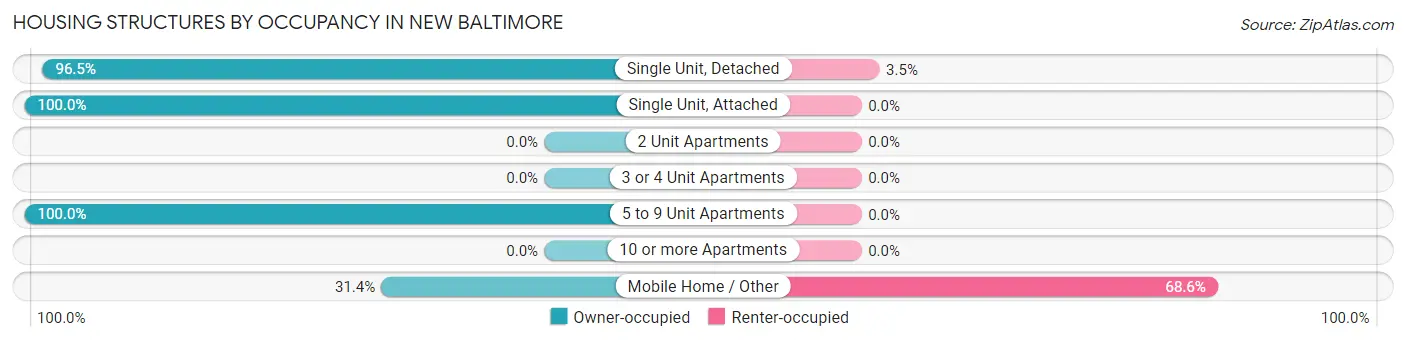
| Structure Type | Owner-occupied | Renter-occupied |
| Single Unit, Detached | 391 (96.5%) | 14 (3.5%) |
| Single Unit, Attached | 14 (100.0%) | 0 (0.0%) |
| 2 Unit Apartments | 0 (0.0%) | 0 (0.0%) |
| 3 or 4 Unit Apartments | 0 (0.0%) | 0 (0.0%) |
| 5 to 9 Unit Apartments | 14 (100.0%) | 0 (0.0%) |
| 10 or more Apartments | 0 (0.0%) | 0 (0.0%) |
| Mobile Home / Other | 16 (31.4%) | 35 (68.6%) |
| Total | 435 (89.9%) | 49 (10.1%) |
Housing Structures by Number of Rooms in New Baltimore
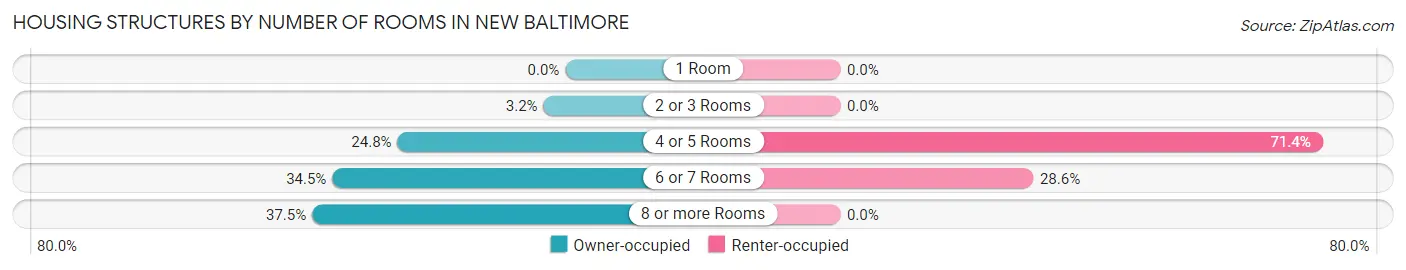
| Number of Rooms | Owner-occupied | Renter-occupied |
| 1 Room | 0 (0.0%) | 0 (0.0%) |
| 2 or 3 Rooms | 14 (3.2%) | 0 (0.0%) |
| 4 or 5 Rooms | 108 (24.8%) | 35 (71.4%) |
| 6 or 7 Rooms | 150 (34.5%) | 14 (28.6%) |
| 8 or more Rooms | 163 (37.5%) | 0 (0.0%) |
| Total | 435 (100.0%) | 49 (100.0%) |
Housing Structure by Heating Type in New Baltimore
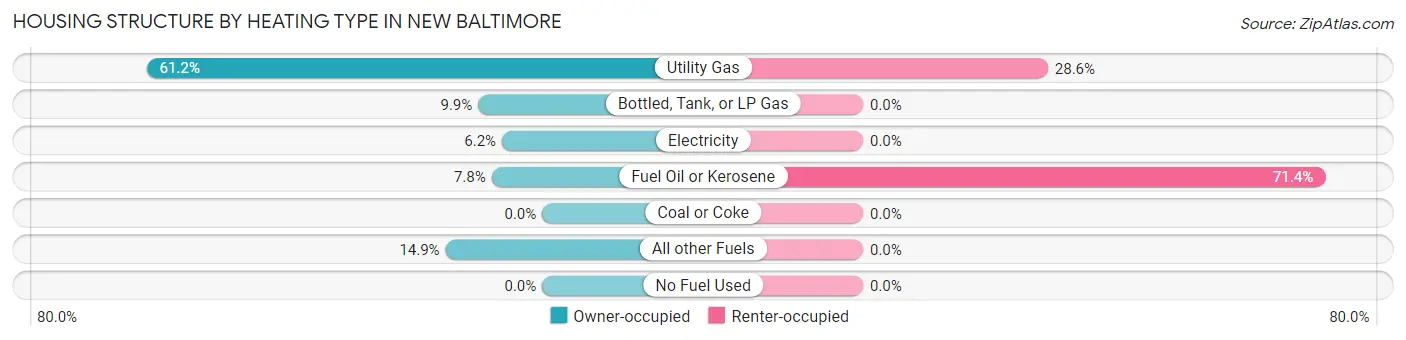
| Heating Type | Owner-occupied | Renter-occupied |
| Utility Gas | 266 (61.2%) | 14 (28.6%) |
| Bottled, Tank, or LP Gas | 43 (9.9%) | 0 (0.0%) |
| Electricity | 27 (6.2%) | 0 (0.0%) |
| Fuel Oil or Kerosene | 34 (7.8%) | 35 (71.4%) |
| Coal or Coke | 0 (0.0%) | 0 (0.0%) |
| All other Fuels | 65 (14.9%) | 0 (0.0%) |
| No Fuel Used | 0 (0.0%) | 0 (0.0%) |
| Total | 435 (100.0%) | 49 (100.0%) |
Household Vehicle Usage in New Baltimore
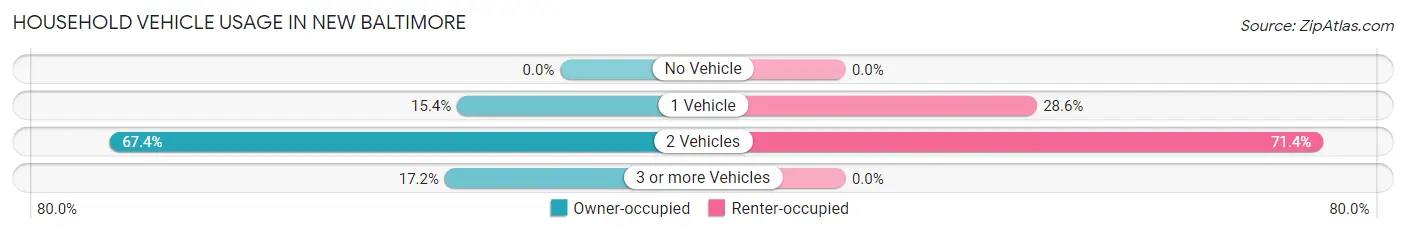
| Vehicles per Household | Owner-occupied | Renter-occupied |
| No Vehicle | 0 (0.0%) | 0 (0.0%) |
| 1 Vehicle | 67 (15.4%) | 14 (28.6%) |
| 2 Vehicles | 293 (67.4%) | 35 (71.4%) |
| 3 or more Vehicles | 75 (17.2%) | 0 (0.0%) |
| Total | 435 (100.0%) | 49 (100.0%) |
Real Estate & Mortgages in New Baltimore
Real Estate and Mortgage Overview in New Baltimore
| Characteristic | Without Mortgage | With Mortgage |
| Housing Units | 99 | 336 |
| Median Property Value | $323,800 | $323,100 |
| Median Household Income | $35,901 | $153 |
| Monthly Housing Costs | $573 | $14 |
| Real Estate Taxes | $1,275 | $0 |
Property Value by Mortgage Status in New Baltimore
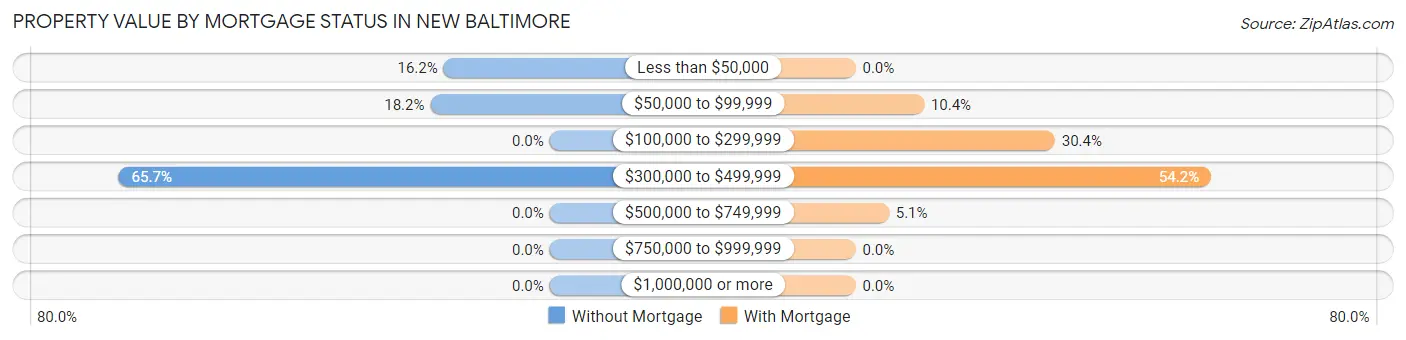
| Property Value | Without Mortgage | With Mortgage |
| Less than $50,000 | 16 (16.2%) | 0 (0.0%) |
| $50,000 to $99,999 | 18 (18.2%) | 35 (10.4%) |
| $100,000 to $299,999 | 0 (0.0%) | 102 (30.4%) |
| $300,000 to $499,999 | 65 (65.7%) | 182 (54.2%) |
| $500,000 to $749,999 | 0 (0.0%) | 17 (5.1%) |
| $750,000 to $999,999 | 0 (0.0%) | 0 (0.0%) |
| $1,000,000 or more | 0 (0.0%) | 0 (0.0%) |
| Total | 99 (100.0%) | 336 (100.0%) |
Household Income by Mortgage Status in New Baltimore
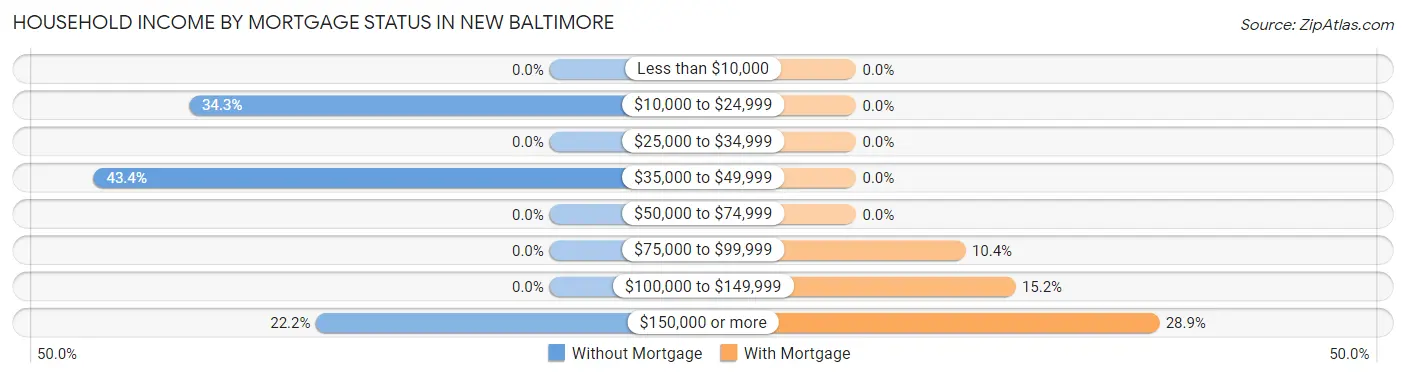
| Household Income | Without Mortgage | With Mortgage |
| Less than $10,000 | 0 (0.0%) | 0 (0.0%) |
| $10,000 to $24,999 | 34 (34.3%) | 0 (0.0%) |
| $25,000 to $34,999 | 0 (0.0%) | 0 (0.0%) |
| $35,000 to $49,999 | 43 (43.4%) | 0 (0.0%) |
| $50,000 to $74,999 | 0 (0.0%) | 0 (0.0%) |
| $75,000 to $99,999 | 0 (0.0%) | 35 (10.4%) |
| $100,000 to $149,999 | 0 (0.0%) | 51 (15.2%) |
| $150,000 or more | 22 (22.2%) | 97 (28.9%) |
| Total | 99 (100.0%) | 336 (100.0%) |
Property Value to Household Income Ratio in New Baltimore
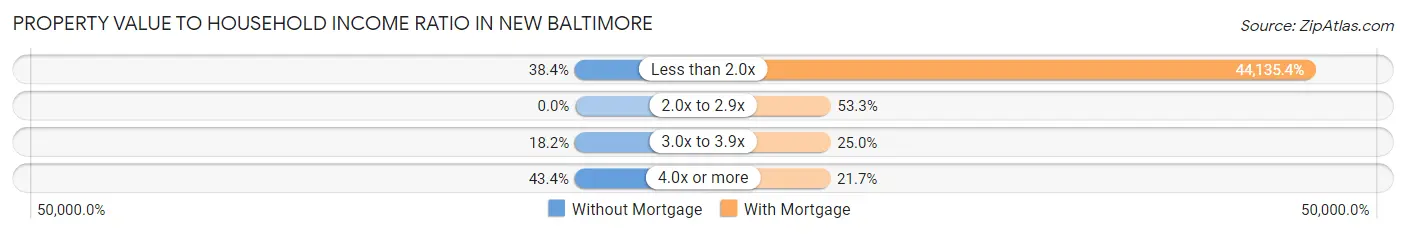
| Value-to-Income Ratio | Without Mortgage | With Mortgage |
| Less than 2.0x | 38 (38.4%) | 148,295 (44,135.4%) |
| 2.0x to 2.9x | 0 (0.0%) | 179 (53.3%) |
| 3.0x to 3.9x | 18 (18.2%) | 84 (25.0%) |
| 4.0x or more | 43 (43.4%) | 73 (21.7%) |
| Total | 99 (100.0%) | 336 (100.0%) |
Real Estate Taxes by Mortgage Status in New Baltimore
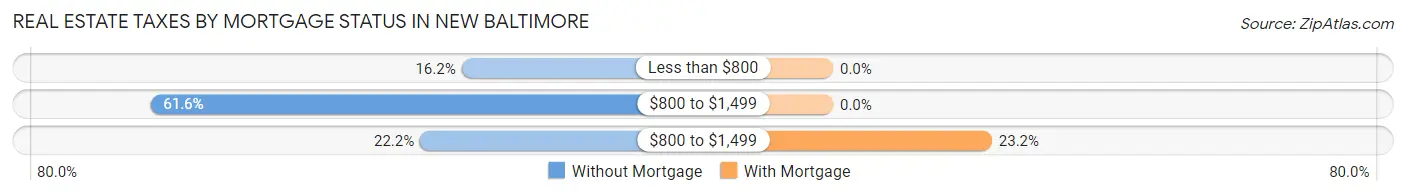
| Property Taxes | Without Mortgage | With Mortgage |
| Less than $800 | 16 (16.2%) | 0 (0.0%) |
| $800 to $1,499 | 61 (61.6%) | 0 (0.0%) |
| $800 to $1,499 | 22 (22.2%) | 78 (23.2%) |
| Total | 99 (100.0%) | 336 (100.0%) |
Health & Disability in New Baltimore
Health Insurance Coverage by Age in New Baltimore
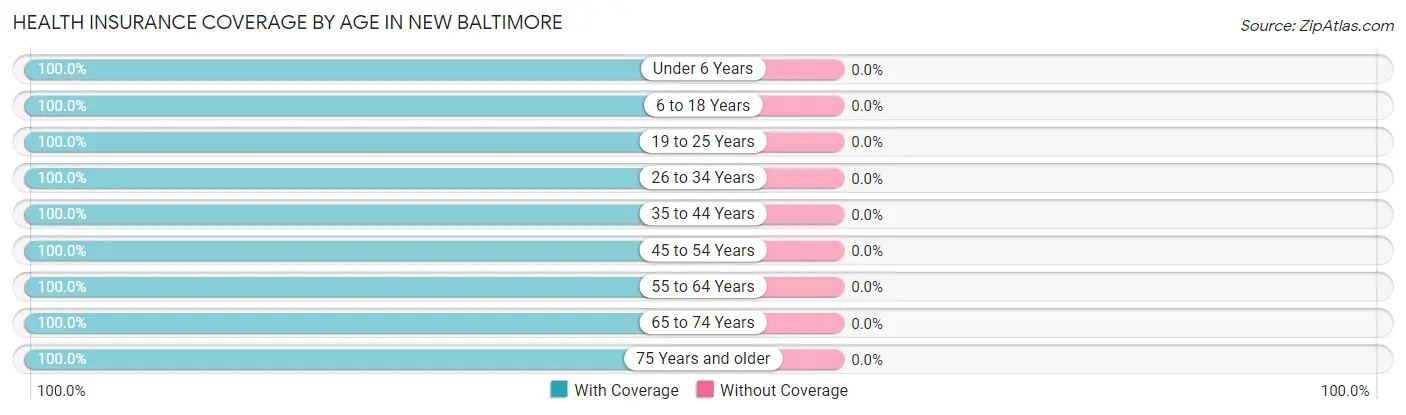
| Age Bracket | With Coverage | Without Coverage |
| Under 6 Years | 138 (100.0%) | 0 (0.0%) |
| 6 to 18 Years | 371 (100.0%) | 0 (0.0%) |
| 19 to 25 Years | 33 (100.0%) | 0 (0.0%) |
| 26 to 34 Years | 133 (100.0%) | 0 (0.0%) |
| 35 to 44 Years | 365 (100.0%) | 0 (0.0%) |
| 45 to 54 Years | 183 (100.0%) | 0 (0.0%) |
| 55 to 64 Years | 151 (100.0%) | 0 (0.0%) |
| 65 to 74 Years | 40 (100.0%) | 0 (0.0%) |
| 75 Years and older | 43 (100.0%) | 0 (0.0%) |
| Total | 1,457 (100.0%) | 0 (0.0%) |
Health Insurance Coverage by Citizenship Status in New Baltimore
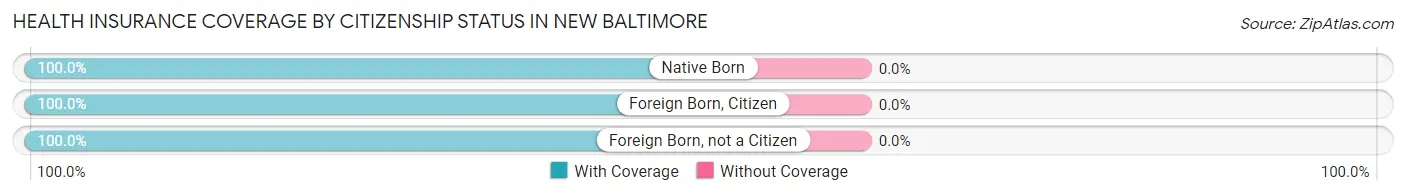
| Citizenship Status | With Coverage | Without Coverage |
| Native Born | 138 (100.0%) | 0 (0.0%) |
| Foreign Born, Citizen | 371 (100.0%) | 0 (0.0%) |
| Foreign Born, not a Citizen | 33 (100.0%) | 0 (0.0%) |
Health Insurance Coverage by Household Income in New Baltimore
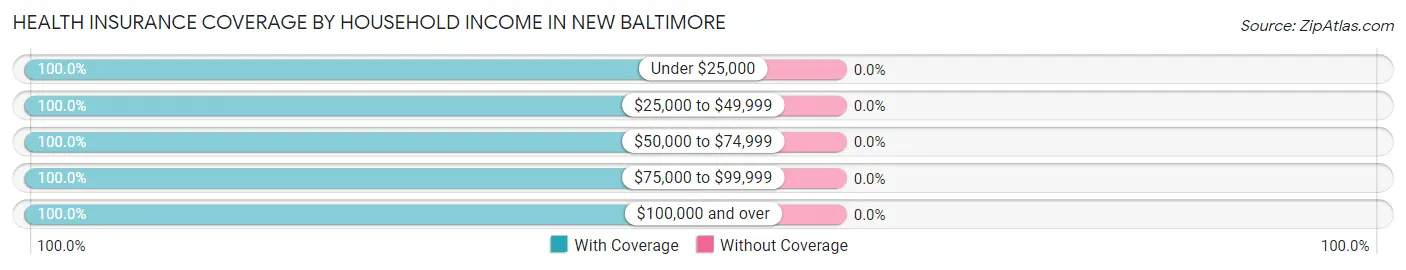
| Household Income | With Coverage | Without Coverage |
| Under $25,000 | 50 (100.0%) | 0 (0.0%) |
| $25,000 to $49,999 | 43 (100.0%) | 0 (0.0%) |
| $50,000 to $74,999 | 170 (100.0%) | 0 (0.0%) |
| $75,000 to $99,999 | 258 (100.0%) | 0 (0.0%) |
| $100,000 and over | 936 (100.0%) | 0 (0.0%) |
Public vs Private Health Insurance Coverage by Age in New Baltimore
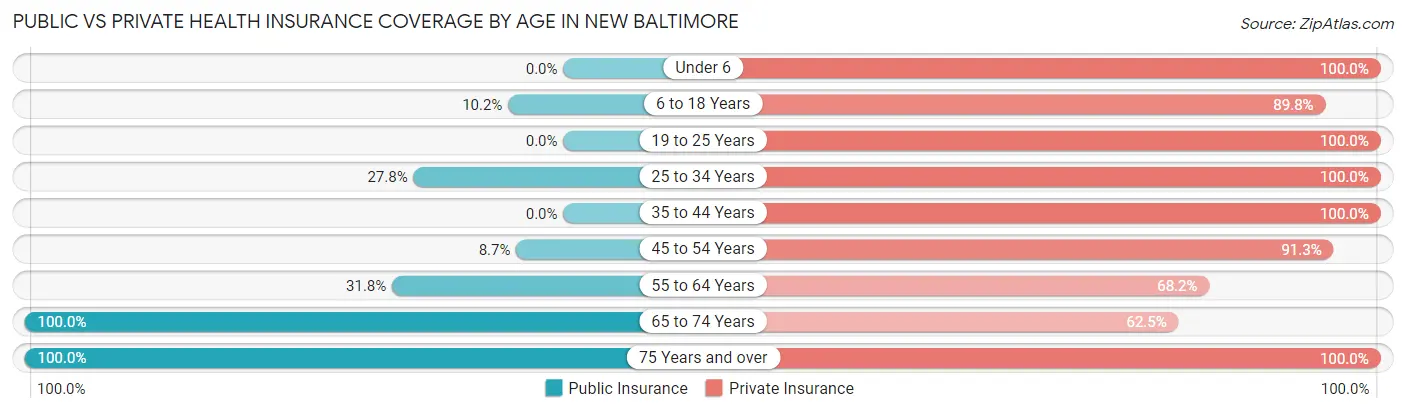
| Age Bracket | Public Insurance | Private Insurance |
| Under 6 | 0 (0.0%) | 138 (100.0%) |
| 6 to 18 Years | 38 (10.2%) | 333 (89.8%) |
| 19 to 25 Years | 0 (0.0%) | 33 (100.0%) |
| 25 to 34 Years | 37 (27.8%) | 133 (100.0%) |
| 35 to 44 Years | 0 (0.0%) | 365 (100.0%) |
| 45 to 54 Years | 16 (8.7%) | 167 (91.3%) |
| 55 to 64 Years | 48 (31.8%) | 103 (68.2%) |
| 65 to 74 Years | 40 (100.0%) | 25 (62.5%) |
| 75 Years and over | 43 (100.0%) | 43 (100.0%) |
| Total | 222 (15.2%) | 1,340 (92.0%) |
Disability Status by Sex by Age in New Baltimore
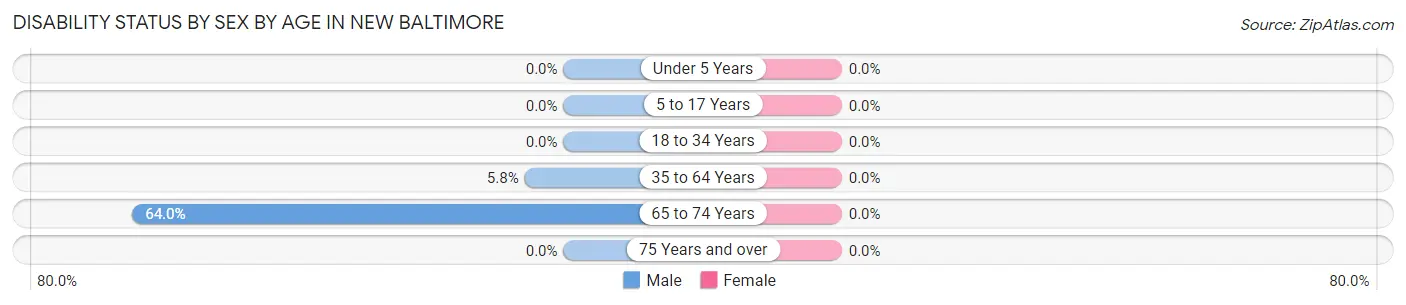
| Age Bracket | Male | Female |
| Under 5 Years | 0 (0.0%) | 0 (0.0%) |
| 5 to 17 Years | 0 (0.0%) | 0 (0.0%) |
| 18 to 34 Years | 0 (0.0%) | 0 (0.0%) |
| 35 to 64 Years | 18 (5.8%) | 0 (0.0%) |
| 65 to 74 Years | 16 (64.0%) | 0 (0.0%) |
| 75 Years and over | 0 (0.0%) | 0 (0.0%) |
Disability Class by Sex by Age in New Baltimore
Disability Class: Hearing Difficulty
| Age Bracket | Male | Female |
| Under 5 Years | 0 (0.0%) | 0 (0.0%) |
| 5 to 17 Years | 0 (0.0%) | 0 (0.0%) |
| 18 to 34 Years | 0 (0.0%) | 0 (0.0%) |
| 35 to 64 Years | 0 (0.0%) | 0 (0.0%) |
| 65 to 74 Years | 0 (0.0%) | 0 (0.0%) |
| 75 Years and over | 0 (0.0%) | 0 (0.0%) |
Disability Class: Vision Difficulty
| Age Bracket | Male | Female |
| Under 5 Years | 0 (0.0%) | 0 (0.0%) |
| 5 to 17 Years | 0 (0.0%) | 0 (0.0%) |
| 18 to 34 Years | 0 (0.0%) | 0 (0.0%) |
| 35 to 64 Years | 0 (0.0%) | 0 (0.0%) |
| 65 to 74 Years | 0 (0.0%) | 0 (0.0%) |
| 75 Years and over | 0 (0.0%) | 0 (0.0%) |
Disability Class: Cognitive Difficulty
| Age Bracket | Male | Female |
| 5 to 17 Years | 0 (0.0%) | 0 (0.0%) |
| 18 to 34 Years | 0 (0.0%) | 0 (0.0%) |
| 35 to 64 Years | 0 (0.0%) | 0 (0.0%) |
| 65 to 74 Years | 16 (64.0%) | 0 (0.0%) |
| 75 Years and over | 0 (0.0%) | 0 (0.0%) |
Disability Class: Ambulatory Difficulty
| Age Bracket | Male | Female |
| 5 to 17 Years | 0 (0.0%) | 0 (0.0%) |
| 18 to 34 Years | 0 (0.0%) | 0 (0.0%) |
| 35 to 64 Years | 0 (0.0%) | 0 (0.0%) |
| 65 to 74 Years | 16 (64.0%) | 0 (0.0%) |
| 75 Years and over | 0 (0.0%) | 0 (0.0%) |
Disability Class: Self-Care Difficulty
| Age Bracket | Male | Female |
| 5 to 17 Years | 0 (0.0%) | 0 (0.0%) |
| 18 to 34 Years | 0 (0.0%) | 0 (0.0%) |
| 35 to 64 Years | 0 (0.0%) | 0 (0.0%) |
| 65 to 74 Years | 0 (0.0%) | 0 (0.0%) |
| 75 Years and over | 0 (0.0%) | 0 (0.0%) |
Technology Access in New Baltimore
Computing Device Access in New Baltimore
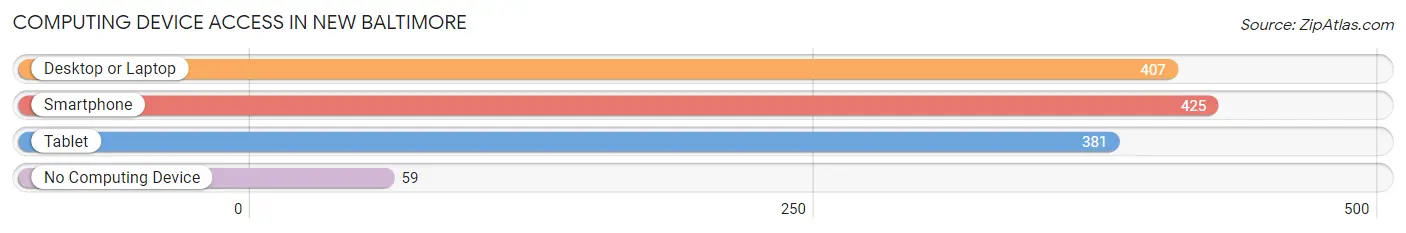
| Device Type | # Households | % Households |
| Desktop or Laptop | 407 | 84.1% |
| Smartphone | 425 | 87.8% |
| Tablet | 381 | 78.7% |
| No Computing Device | 59 | 12.2% |
| Total | 484 | 100.0% |
Internet Access in New Baltimore
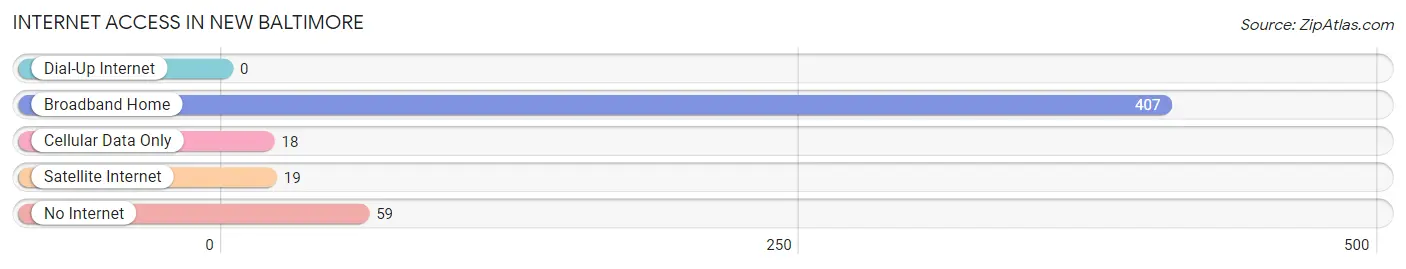
| Internet Type | # Households | % Households |
| Dial-Up Internet | 0 | 0.0% |
| Broadband Home | 407 | 84.1% |
| Cellular Data Only | 18 | 3.7% |
| Satellite Internet | 19 | 3.9% |
| No Internet | 59 | 12.2% |
| Total | 484 | 100.0% |
New Baltimore Summary
New Baltimore is a small village located in Harrison County, Ohio. It is situated on the banks of the Ohio River, approximately 25 miles south of Steubenville. The village has a population of approximately 1,000 people and is part of the Steubenville-Weirton Metropolitan Statistical Area.
History
New Baltimore was founded in 1817 by a group of settlers from Baltimore, Maryland. The village was originally known as Baltimore, but the name was changed to New Baltimore in 1820 to avoid confusion with the city of Baltimore. The village was incorporated in 1837 and has remained relatively unchanged since then.
The village was an important stop on the Underground Railroad, with many slaves escaping to freedom in Canada. The village was also home to a number of prominent abolitionists, including William Lloyd Garrison and Harriet Beecher Stowe.
Geography
New Baltimore is located in the eastern part of Harrison County, Ohio. It is situated on the banks of the Ohio River, approximately 25 miles south of Steubenville. The village is surrounded by rolling hills and farmland. The climate is humid continental, with hot summers and cold winters.
Economy
The economy of New Baltimore is largely based on agriculture and tourism. The village is home to a number of small businesses, including a grocery store, a hardware store, and a few restaurants. The village also has a number of antique shops and art galleries.
Tourism is an important part of the local economy. The village is home to a number of historic sites, including the Underground Railroad Museum and the New Baltimore Historical Society. The village also hosts a number of festivals and events throughout the year, including the annual Apple Festival and the New Baltimore Arts Festival.
Demographics
As of the 2010 census, the population of New Baltimore was 1,000. The racial makeup of the village was 97.2% White, 0.7% African American, 0.3% Native American, 0.2% Asian, and 1.6% from other races. The median household income was $37,500, and the median family income was $45,000.
The village is served by the Harrison County School District. The village has one elementary school, one middle school, and one high school. The village also has a public library and a number of churches.
Conclusion
New Baltimore is a small village located in Harrison County, Ohio. It is situated on the banks of the Ohio River, approximately 25 miles south of Steubenville. The village has a population of approximately 1,000 people and is part of the Steubenville-Weirton Metropolitan Statistical Area. The village was founded in 1817 and has remained relatively unchanged since then. The economy of New Baltimore is largely based on agriculture and tourism. The village is home to a number of small businesses, including a grocery store, a hardware store, and a few restaurants. The village also has a number of historic sites, including the Underground Railroad Museum and the New Baltimore Historical Society. As of the 2010 census, the population of New Baltimore was 1,000. The racial makeup of the village was 97.2% White, 0.7% African American, 0.3% Native American, 0.2% Asian, and 1.6% from other races. The median household income was $37,500, and the median family income was $45,000.
Common Questions
What is the Total Population of New Baltimore?
Total Population of New Baltimore is 1,457.
What is the Total Male Population of New Baltimore?
Total Male Population of New Baltimore is 662.
What is the Total Female Population of New Baltimore?
Total Female Population of New Baltimore is 795.
What is the Ratio of Males per 100 Females in New Baltimore?
There are 83.27 Males per 100 Females in New Baltimore.
What is the Ratio of Females per 100 Males in New Baltimore?
There are 120.09 Females per 100 Males in New Baltimore.
What is the Median Population Age in New Baltimore?
Median Population Age in New Baltimore is 37.1 Years.
What is the Average Family Size in New Baltimore
Average Family Size in New Baltimore is 3.4 People.
What is the Average Household Size in New Baltimore
Average Household Size in New Baltimore is 3.0 People.
What is Per Capita Income in New Baltimore?
Per Capita income in New Baltimore is $41,823.
What is the Median Family Income in New Baltimore?
Median Family Income in New Baltimore is $148,466.
What is the Median Household income in New Baltimore?
Median Household Income in New Baltimore is $130,625.
What is Income or Wage Gap in New Baltimore?
Income or Wage Gap in New Baltimore is 36.7%.
Women in New Baltimore earn 63.3 cents for every dollar earned by a man.
What is Inequality or Gini Index in New Baltimore?
Inequality or Gini Index in New Baltimore is 0.31.
How Large is the Labor Force in New Baltimore?
There are 842 People in the Labor Forcein in New Baltimore.
What is the Percentage of People in the Labor Force in New Baltimore?
84.5% of People are in the Labor Force in New Baltimore.