Little Hocking, OH
Little Hocking Map
Little Hocking Overview
629
TOTAL POPULATION
248
MALE POPULATION
381
FEMALE POPULATION
65.09
MALES / 100 FEMALES
153.63
FEMALES / 100 MALES
43.2
MEDIAN AGE
4.0
AVG FAMILY SIZE
4.1
AVG HOUSEHOLD SIZE
$26,130
PER CAPITA INCOME
$145,283
AVG FAMILY INCOME
6.7%
WAGE / INCOME GAP [ % ]
93.3¢/ $1
WAGE / INCOME GAP [ $ ]
0.29
INEQUALITY / GINI INDEX
323
LABOR FORCE [ PEOPLE ]
73.9%
PERCENT IN LABOR FORCE
5.0%
UNEMPLOYMENT RATE
Little Hocking Zip Codes
Little Hocking Area Codes
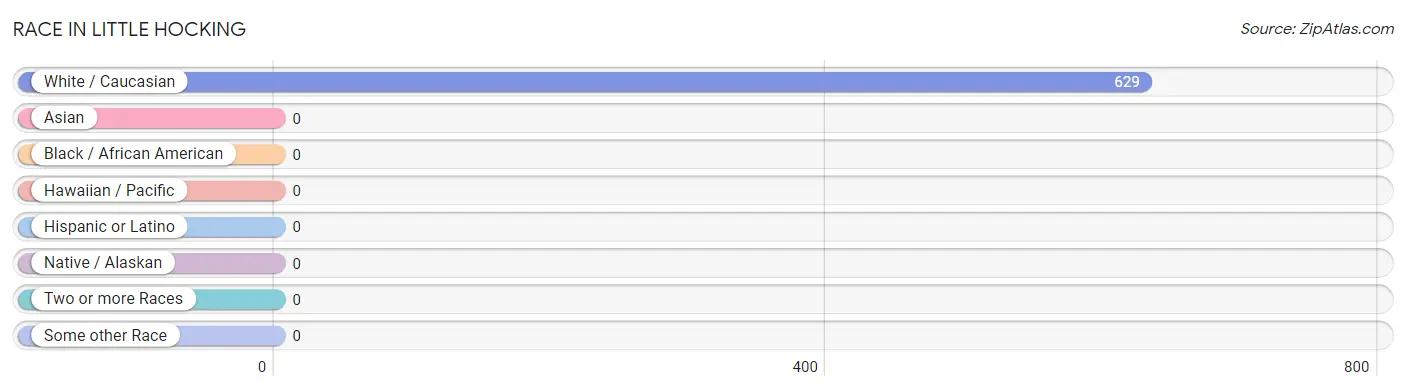
Race in Little Hocking
The most populous races in Little Hocking are , and White / Caucasian (629 | 100.0%).
| Race | # Population | % Population |
| Asian | 0 | 0.0% |
| Black / African American | 0 | 0.0% |
| Hawaiian / Pacific | 0 | 0.0% |
| Hispanic or Latino | 0 | 0.0% |
| Native / Alaskan | 0 | 0.0% |
| White / Caucasian | 629 | 100.0% |
| Two or more Races | 0 | 0.0% |
| Some other Race | 0 | 0.0% |
| Total | 629 | 100.0% |
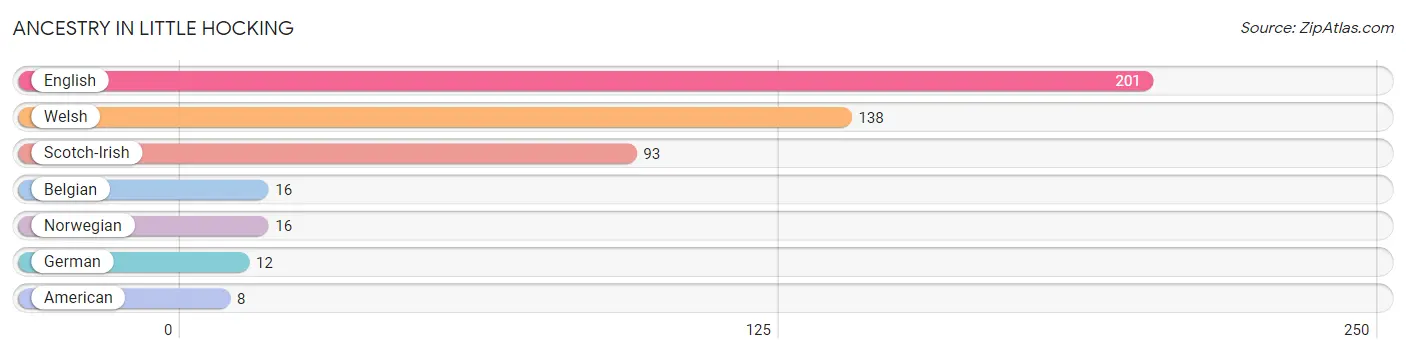
Ancestry in Little Hocking
The most populous ancestries reported in Little Hocking are English (201 | 32.0%), Welsh (138 | 21.9%), Scotch-Irish (93 | 14.8%), Belgian (16 | 2.5%), and Norwegian (16 | 2.5%), together accounting for 73.8% of all Little Hocking residents.
| Ancestry | # Population | % Population |
| American | 8 | 1.3% |
| Belgian | 16 | 2.5% |
| English | 201 | 32.0% |
| German | 12 | 1.9% |
| Norwegian | 16 | 2.5% |
| Scotch-Irish | 93 | 14.8% |
| Welsh | 138 | 21.9% | View All 7 Rows |
Immigrants in Little Hocking

| Immigration Origin | # Population | % Population | View All 0 Rows |
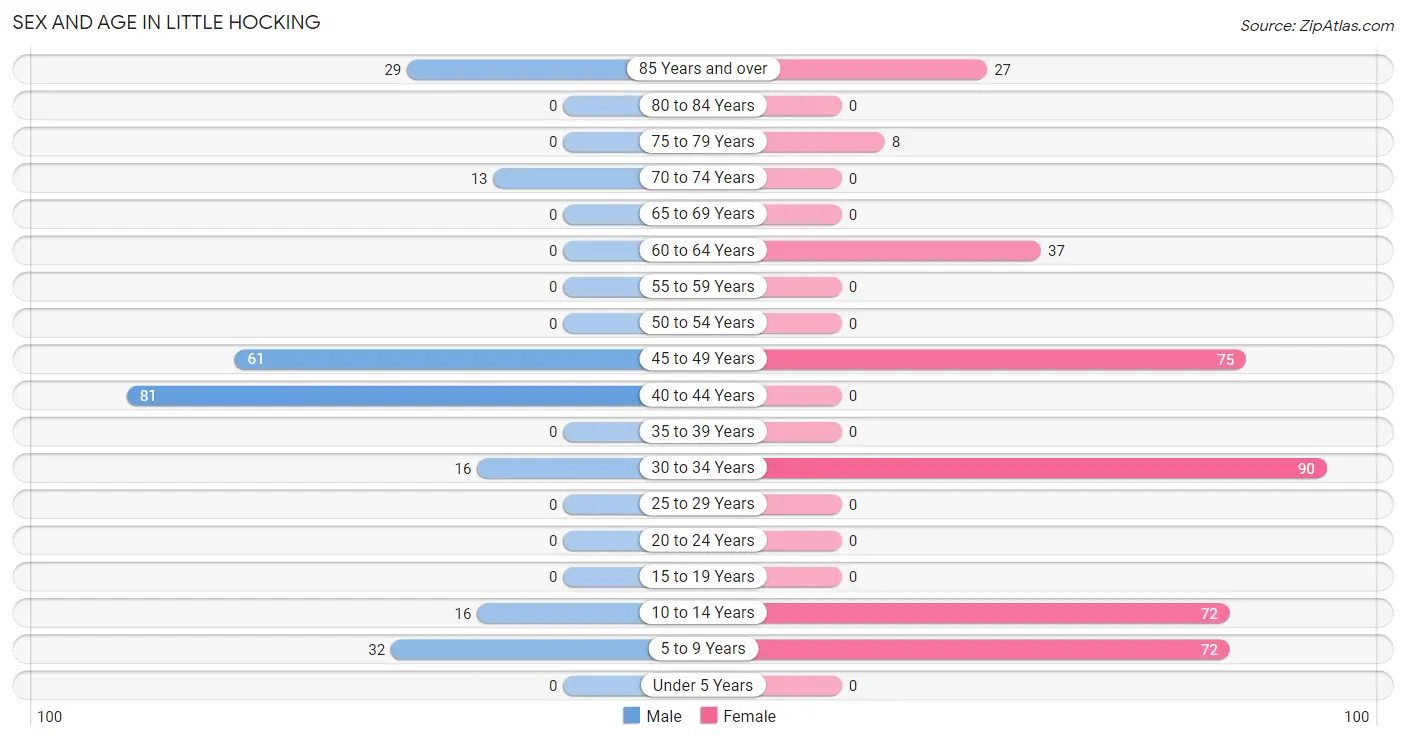
Sex and Age in Little Hocking
Sex and Age in Little Hocking
The most populous age groups in Little Hocking are 40 to 44 Years (81 | 32.7%) for men and 30 to 34 Years (90 | 23.6%) for women.
| Age Bracket | Male | Female |
| Under 5 Years | 0 (0.0%) | 0 (0.0%) |
| 5 to 9 Years | 32 (12.9%) | 72 (18.9%) |
| 10 to 14 Years | 16 (6.5%) | 72 (18.9%) |
| 15 to 19 Years | 0 (0.0%) | 0 (0.0%) |
| 20 to 24 Years | 0 (0.0%) | 0 (0.0%) |
| 25 to 29 Years | 0 (0.0%) | 0 (0.0%) |
| 30 to 34 Years | 16 (6.5%) | 90 (23.6%) |
| 35 to 39 Years | 0 (0.0%) | 0 (0.0%) |
| 40 to 44 Years | 81 (32.7%) | 0 (0.0%) |
| 45 to 49 Years | 61 (24.6%) | 75 (19.7%) |
| 50 to 54 Years | 0 (0.0%) | 0 (0.0%) |
| 55 to 59 Years | 0 (0.0%) | 0 (0.0%) |
| 60 to 64 Years | 0 (0.0%) | 37 (9.7%) |
| 65 to 69 Years | 0 (0.0%) | 0 (0.0%) |
| 70 to 74 Years | 13 (5.2%) | 0 (0.0%) |
| 75 to 79 Years | 0 (0.0%) | 8 (2.1%) |
| 80 to 84 Years | 0 (0.0%) | 0 (0.0%) |
| 85 Years and over | 29 (11.7%) | 27 (7.1%) |
| Total | 248 (100.0%) | 381 (100.0%) |
Families and Households in Little Hocking
Median Family Size in Little Hocking
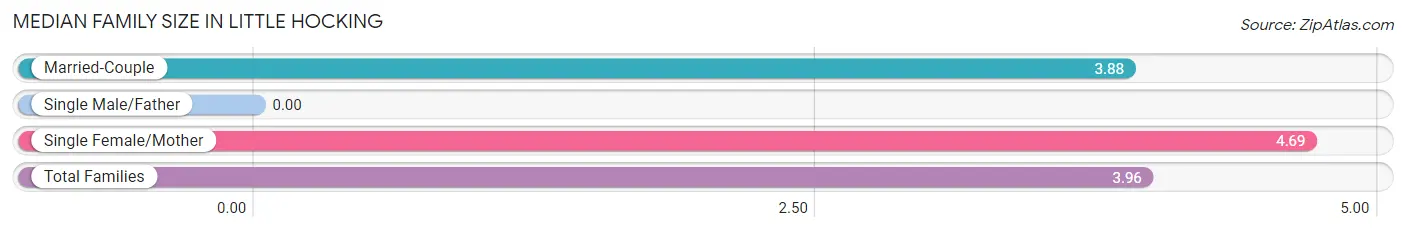
| Family Type | # Families | Family Size |
| Married-Couple | 120 (90.2%) | 3.88 |
| Single Male/Father | 0 (0.0%) | - |
| Single Female/Mother | 13 (9.8%) | 4.69 |
| Total Families | 133 (100.0%) | 3.96 |
Median Household Size in Little Hocking
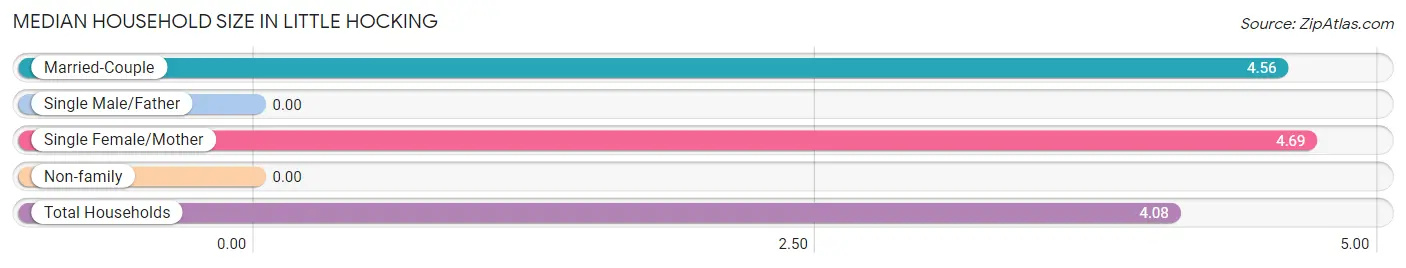
| Household Type | # Households | Household Size |
| Married-Couple | 120 (77.9%) | 4.56 |
| Single Male/Father | 0 (0.0%) | - |
| Single Female/Mother | 13 (8.4%) | 4.69 |
| Non-family | 21 (13.6%) | - |
| Total Households | 154 (100.0%) | 4.08 |
Household Size by Marriage Status in Little Hocking
Out of a total of 154 households in Little Hocking, 133 (86.4%) are family households, while 21 (13.6%) are nonfamily households. The most numerous type of family households are 6-person households, comprising 75, and the most common type of nonfamily households are 1-person households, comprising 21.
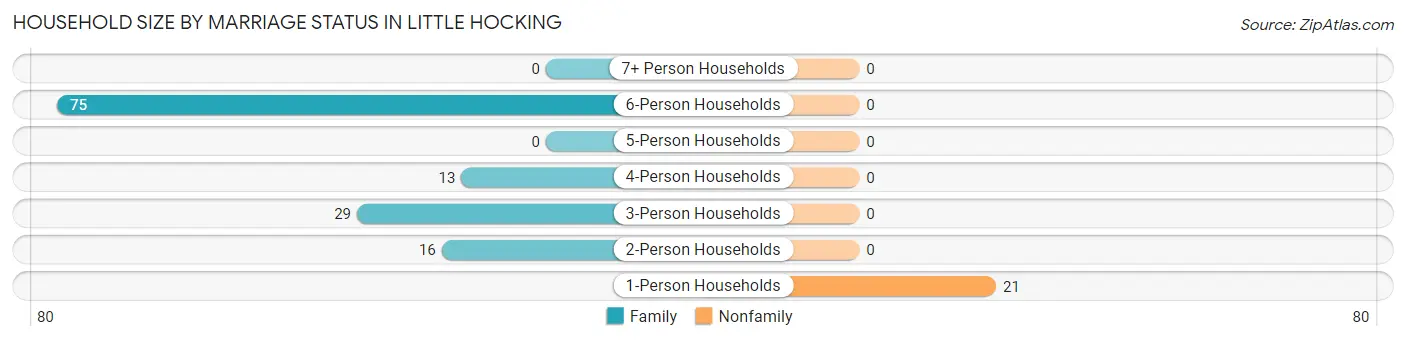
| Household Size | Family Households | Nonfamily Households |
| 1-Person Households | - | 21 (13.6%) |
| 2-Person Households | 16 (10.4%) | 0 (0.0%) |
| 3-Person Households | 29 (18.8%) | 0 (0.0%) |
| 4-Person Households | 13 (8.4%) | 0 (0.0%) |
| 5-Person Households | 0 (0.0%) | 0 (0.0%) |
| 6-Person Households | 75 (48.7%) | 0 (0.0%) |
| 7+ Person Households | 0 (0.0%) | 0 (0.0%) |
| Total | 133 (86.4%) | 21 (13.6%) |
Female Fertility in Little Hocking
Fertility by Age in Little Hocking
| Age Bracket | Women with Births | Births / 1,000 Women |
| 15 to 19 years | 0 (0.0%) | 0.0 |
| 20 to 34 years | 0 (0.0%) | 0.0 |
| 35 to 50 years | 0 (0.0%) | 0.0 |
| Total | 0 (0.0%) | 0.0 |
Fertility by Age by Marriage Status in Little Hocking
| Age Bracket | Married | Unmarried |
| 15 to 19 years | 0 (0.0%) | 0 (0.0%) |
| 20 to 34 years | 0 (0.0%) | 0 (0.0%) |
| 35 to 50 years | 0 (0.0%) | 0 (0.0%) |
| Total | 0 (0.0%) | 0 (0.0%) |
Fertility by Education in Little Hocking
| Educational Attainment | Women with Births | Births / 1,000 Women |
| Less than High School | 0 (0.0%) | 0.0 |
| High School Diploma | 0 (0.0%) | 0.0 |
| College or Associate's Degree | 0 (0.0%) | 0.0 |
| Bachelor's Degree | 0 (0.0%) | 0.0 |
| Graduate Degree | 0 (0.0%) | 0.0 |
| Total | 0 (0.0%) | 0.0 |
Fertility by Education by Marriage Status in Little Hocking
| Educational Attainment | Married | Unmarried |
| Less than High School | 0 (0.0%) | 0 (0.0%) |
| High School Diploma | 0 (0.0%) | 0 (0.0%) |
| College or Associate's Degree | 0 (0.0%) | 0 (0.0%) |
| Bachelor's Degree | 0 (0.0%) | 0 (0.0%) |
| Graduate Degree | 0 (0.0%) | 0 (0.0%) |
| Total | 0 (0.0%) | 0 (0.0%) |
Income in Little Hocking
Income Overview in Little Hocking
| Characteristic | Number | Measure |
| Per Capita Income | 629 | $26,130 |
| Median Family Income | 133 | $145,283 |
| Mean Family Income | 133 | $111,759 |
| Median Household Income | 154 | $0 |
| Mean Household Income | 154 | $114,714 |
| Income Deficit | 133 | $0 |
| Wage / Income Gap (%) | 629 | 6.66% |
| Wage / Income Gap ($) | 629 | 93.34¢ per $1 |
| Gini / Inequality Index | 629 | 0.29 |
Earnings by Sex in Little Hocking
Average Earnings in Little Hocking are $26,082, $26,944 for men and $25,150 for women, a difference of 6.7%.
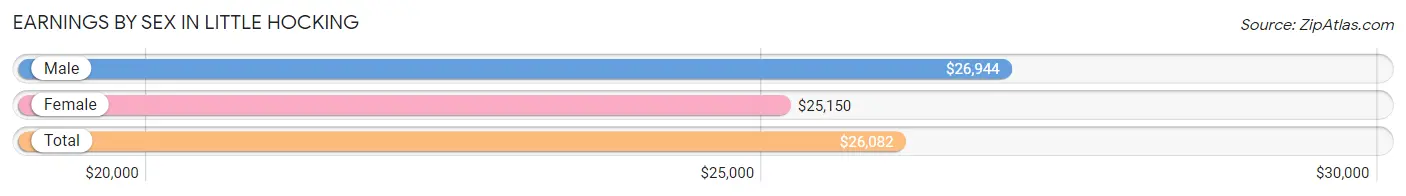
| Sex | Number | Average Earnings |
| Male | 158 (48.9%) | $26,944 |
| Female | 165 (51.1%) | $25,150 |
| Total | 323 (100.0%) | $26,082 |
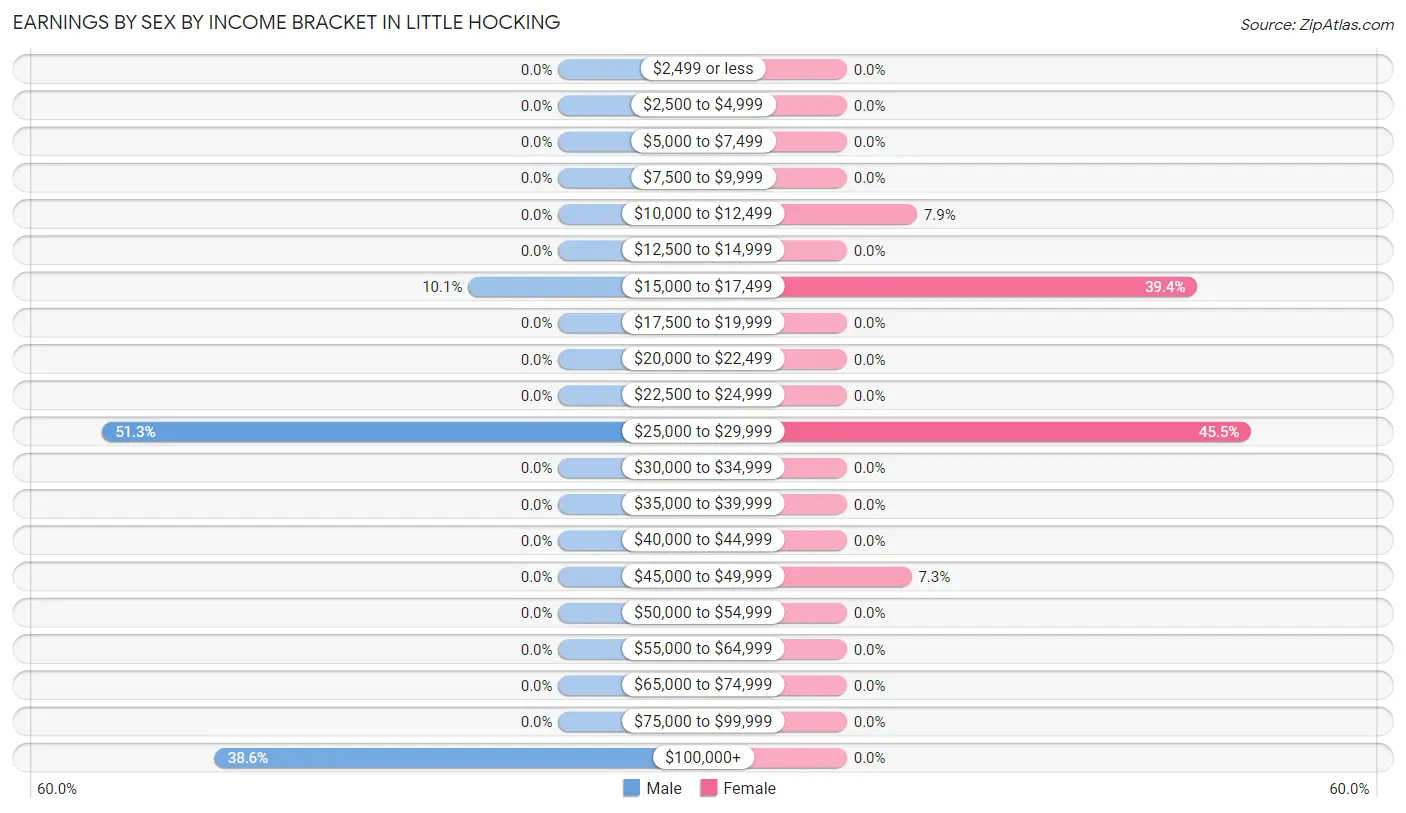
Earnings by Sex by Income Bracket in Little Hocking
The most common earnings brackets in Little Hocking are $25,000 to $29,999 for men (81 | 51.3%) and $25,000 to $29,999 for women (75 | 45.5%).
| Income | Male | Female |
| $2,499 or less | 0 (0.0%) | 0 (0.0%) |
| $2,500 to $4,999 | 0 (0.0%) | 0 (0.0%) |
| $5,000 to $7,499 | 0 (0.0%) | 0 (0.0%) |
| $7,500 to $9,999 | 0 (0.0%) | 0 (0.0%) |
| $10,000 to $12,499 | 0 (0.0%) | 13 (7.9%) |
| $12,500 to $14,999 | 0 (0.0%) | 0 (0.0%) |
| $15,000 to $17,499 | 16 (10.1%) | 65 (39.4%) |
| $17,500 to $19,999 | 0 (0.0%) | 0 (0.0%) |
| $20,000 to $22,499 | 0 (0.0%) | 0 (0.0%) |
| $22,500 to $24,999 | 0 (0.0%) | 0 (0.0%) |
| $25,000 to $29,999 | 81 (51.3%) | 75 (45.5%) |
| $30,000 to $34,999 | 0 (0.0%) | 0 (0.0%) |
| $35,000 to $39,999 | 0 (0.0%) | 0 (0.0%) |
| $40,000 to $44,999 | 0 (0.0%) | 0 (0.0%) |
| $45,000 to $49,999 | 0 (0.0%) | 12 (7.3%) |
| $50,000 to $54,999 | 0 (0.0%) | 0 (0.0%) |
| $55,000 to $64,999 | 0 (0.0%) | 0 (0.0%) |
| $65,000 to $74,999 | 0 (0.0%) | 0 (0.0%) |
| $75,000 to $99,999 | 0 (0.0%) | 0 (0.0%) |
| $100,000+ | 61 (38.6%) | 0 (0.0%) |
| Total | 158 (100.0%) | 165 (100.0%) |
Earnings by Sex by Educational Attainment in Little Hocking
| Educational Attainment | Male Income | Female Income |
| Less than High School | - | - |
| High School Diploma | - | - |
| College or Associate's Degree | - | - |
| Bachelor's Degree | - | - |
| Graduate Degree | - | - |
| Total | $26,944 | $25,150 |
Family Income in Little Hocking
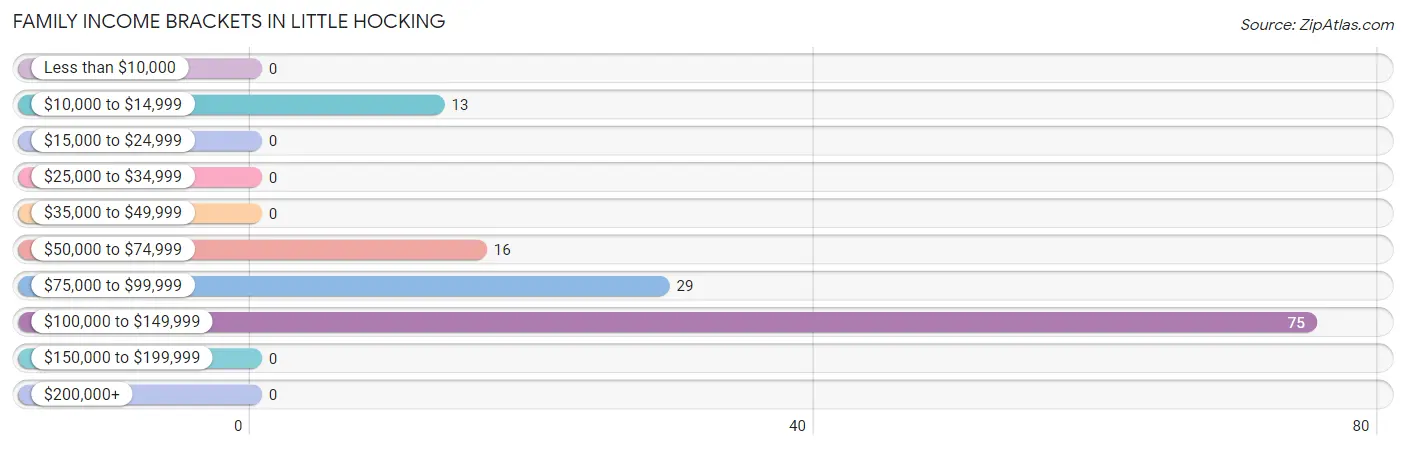
Family Income Brackets in Little Hocking
According to the Little Hocking family income data, there are 75 families falling into the $100,000 to $149,999 income range, which is the most common income bracket and makes up 56.4% of all families.
| Income Bracket | # Families | % Families |
| Less than $10,000 | 0 | 0.0% |
| $10,000 to $14,999 | 13 | 9.8% |
| $15,000 to $24,999 | 0 | 0.0% |
| $25,000 to $34,999 | 0 | 0.0% |
| $35,000 to $49,999 | 0 | 0.0% |
| $50,000 to $74,999 | 16 | 12.0% |
| $75,000 to $99,999 | 29 | 21.8% |
| $100,000 to $149,999 | 75 | 56.4% |
| $150,000 to $199,999 | 0 | 0.0% |
| $200,000+ | 0 | 0.0% |
Family Income by Famaliy Size in Little Hocking
| Income Bracket | # Families | Median Income |
| 2-Person Families | 16 (12.0%) | $0 |
| 3-Person Families | 29 (21.8%) | $0 |
| 4-Person Families | 13 (9.8%) | $0 |
| 5-Person Families | 75 (56.4%) | $0 |
| 6-Person Families | 0 (0.0%) | $0 |
| 7+ Person Families | 0 (0.0%) | $0 |
| Total | 133 (100.0%) | $145,283 |
Family Income by Number of Earners in Little Hocking
| Number of Earners | # Families | Median Income |
| No Earners | 29 (21.8%) | $0 |
| 1 Earner | 13 (9.8%) | $0 |
| 2 Earners | 16 (12.0%) | $0 |
| 3+ Earners | 75 (56.4%) | $0 |
| Total | 133 (100.0%) | $145,283 |
Household Income in Little Hocking
Household Income Brackets in Little Hocking
With 75 households falling in the category, the $150,000 to $199,999 income range is the most frequent in Little Hocking, accounting for 48.7% of all households.
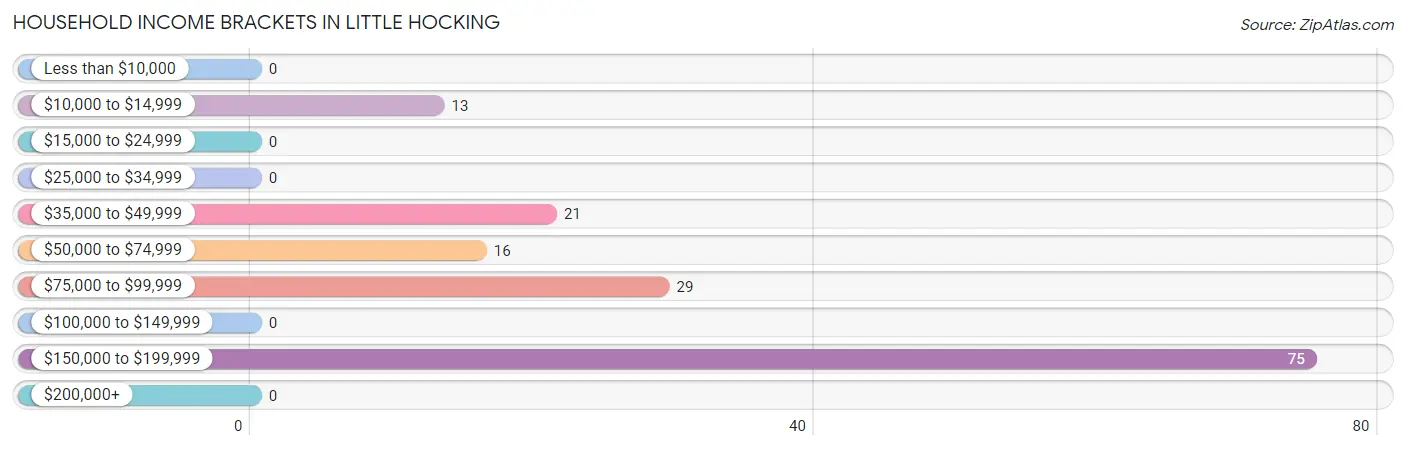
| Income Bracket | # Households | % Households |
| Less than $10,000 | 0 | 0.0% |
| $10,000 to $14,999 | 13 | 8.4% |
| $15,000 to $24,999 | 0 | 0.0% |
| $25,000 to $34,999 | 0 | 0.0% |
| $35,000 to $49,999 | 21 | 13.6% |
| $50,000 to $74,999 | 16 | 10.4% |
| $75,000 to $99,999 | 29 | 18.8% |
| $100,000 to $149,999 | 0 | 0.0% |
| $150,000 to $199,999 | 75 | 48.7% |
| $200,000+ | 0 | 0.0% |
Household Income by Householder Age in Little Hocking
| Income Bracket | # Households | Median Income |
| 15 to 24 Years | 0 (0.0%) | $0 |
| 25 to 44 Years | 29 (18.8%) | $0 |
| 45 to 64 Years | 75 (48.7%) | $0 |
| 65+ Years | 50 (32.5%) | $0 |
| Total | 154 (100.0%) | $0 |
Poverty in Little Hocking
Income Below Poverty by Sex and Age in Little Hocking
With 19.4% poverty level for males and 3.4% for females among the residents of Little Hocking, 5 year old males and 25 to 34 year old females are the most vulnerable to poverty, with 16 males (100.0%) and 13 females (14.4%) in their respective age groups living below the poverty level.
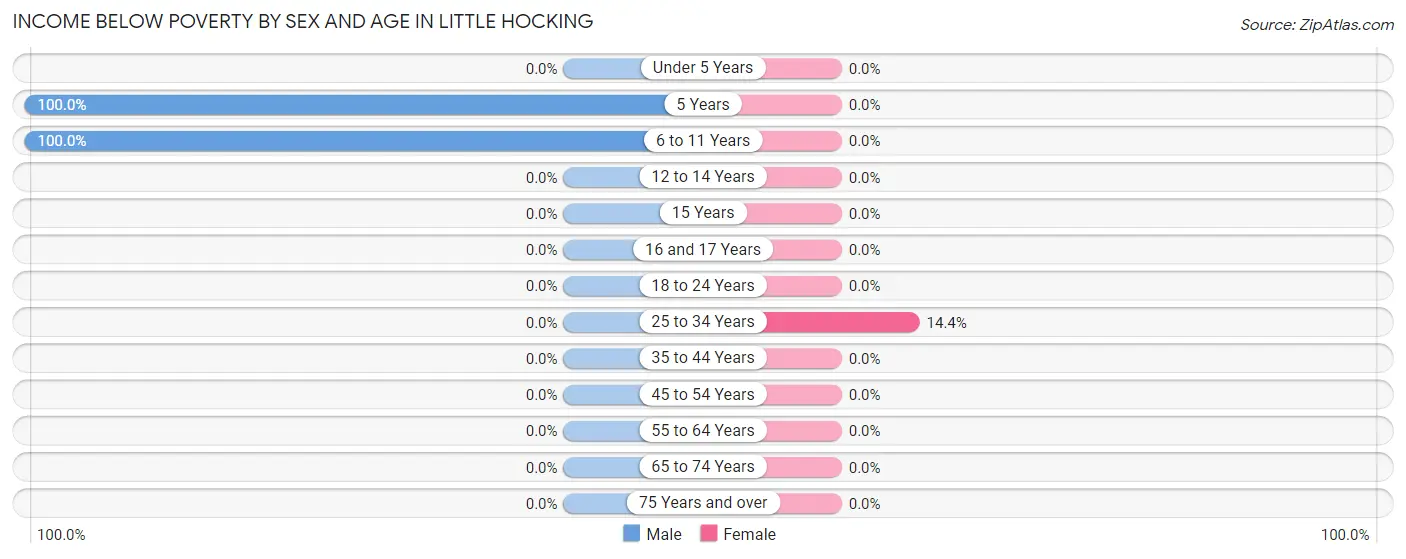
| Age Bracket | Male | Female |
| Under 5 Years | 0 (0.0%) | 0 (0.0%) |
| 5 Years | 16 (100.0%) | 0 (0.0%) |
| 6 to 11 Years | 32 (100.0%) | 0 (0.0%) |
| 12 to 14 Years | 0 (0.0%) | 0 (0.0%) |
| 15 Years | 0 (0.0%) | 0 (0.0%) |
| 16 and 17 Years | 0 (0.0%) | 0 (0.0%) |
| 18 to 24 Years | 0 (0.0%) | 0 (0.0%) |
| 25 to 34 Years | 0 (0.0%) | 13 (14.4%) |
| 35 to 44 Years | 0 (0.0%) | 0 (0.0%) |
| 45 to 54 Years | 0 (0.0%) | 0 (0.0%) |
| 55 to 64 Years | 0 (0.0%) | 0 (0.0%) |
| 65 to 74 Years | 0 (0.0%) | 0 (0.0%) |
| 75 Years and over | 0 (0.0%) | 0 (0.0%) |
| Total | 48 (19.4%) | 13 (3.4%) |
Income Above Poverty by Sex and Age in Little Hocking
According to the poverty statistics in Little Hocking, males aged 25 to 34 years and females aged 6 to 11 years are the age groups that are most secure financially, with 100.0% of males and 100.0% of females in these age groups living above the poverty line.
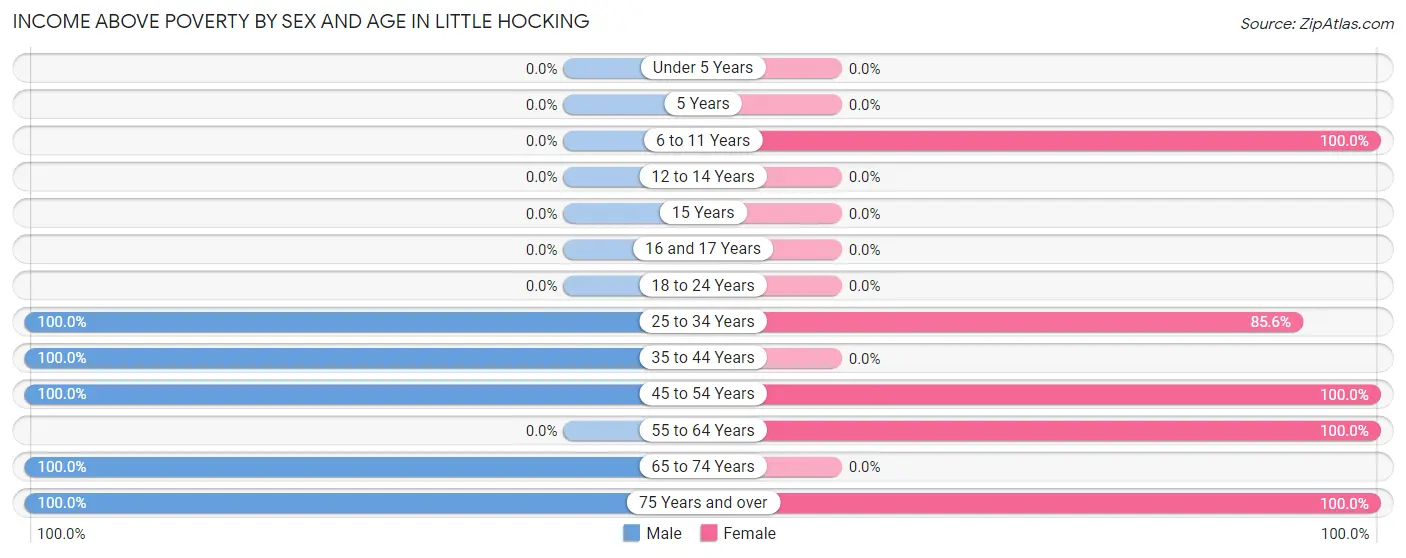
| Age Bracket | Male | Female |
| Under 5 Years | 0 (0.0%) | 0 (0.0%) |
| 5 Years | 0 (0.0%) | 0 (0.0%) |
| 6 to 11 Years | 0 (0.0%) | 144 (100.0%) |
| 12 to 14 Years | 0 (0.0%) | 0 (0.0%) |
| 15 Years | 0 (0.0%) | 0 (0.0%) |
| 16 and 17 Years | 0 (0.0%) | 0 (0.0%) |
| 18 to 24 Years | 0 (0.0%) | 0 (0.0%) |
| 25 to 34 Years | 16 (100.0%) | 77 (85.6%) |
| 35 to 44 Years | 81 (100.0%) | 0 (0.0%) |
| 45 to 54 Years | 61 (100.0%) | 75 (100.0%) |
| 55 to 64 Years | 0 (0.0%) | 37 (100.0%) |
| 65 to 74 Years | 13 (100.0%) | 0 (0.0%) |
| 75 Years and over | 29 (100.0%) | 35 (100.0%) |
| Total | 200 (80.6%) | 368 (96.6%) |
Income Below Poverty Among Married-Couple Families in Little Hocking
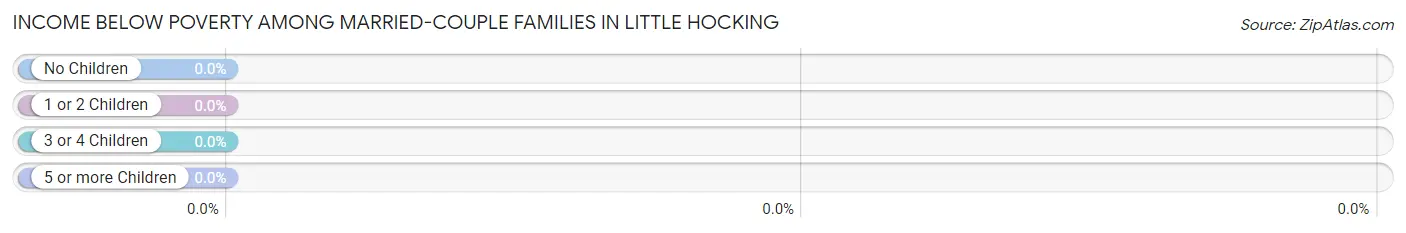
| Children | Above Poverty | Below Poverty |
| No Children | 45 (100.0%) | 0 (0.0%) |
| 1 or 2 Children | 75 (100.0%) | 0 (0.0%) |
| 3 or 4 Children | 0 (0.0%) | 0 (0.0%) |
| 5 or more Children | 0 (0.0%) | 0 (0.0%) |
| Total | 120 (100.0%) | 0 (0.0%) |
Income Below Poverty Among Single-Parent Households in Little Hocking
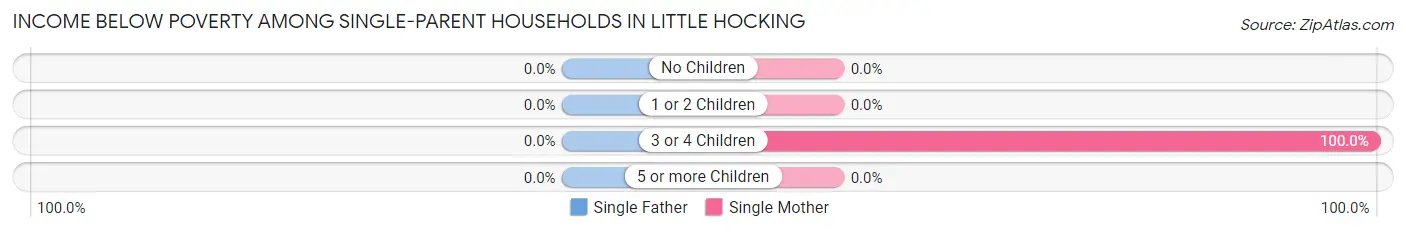
| Children | Single Father | Single Mother |
| No Children | 0 (0.0%) | 0 (0.0%) |
| 1 or 2 Children | 0 (0.0%) | 0 (0.0%) |
| 3 or 4 Children | 0 (0.0%) | 13 (100.0%) |
| 5 or more Children | 0 (0.0%) | 0 (0.0%) |
| Total | 0 (0.0%) | 13 (100.0%) |
Income Below Poverty Among Married-Couple vs Single-Parent Households in Little Hocking
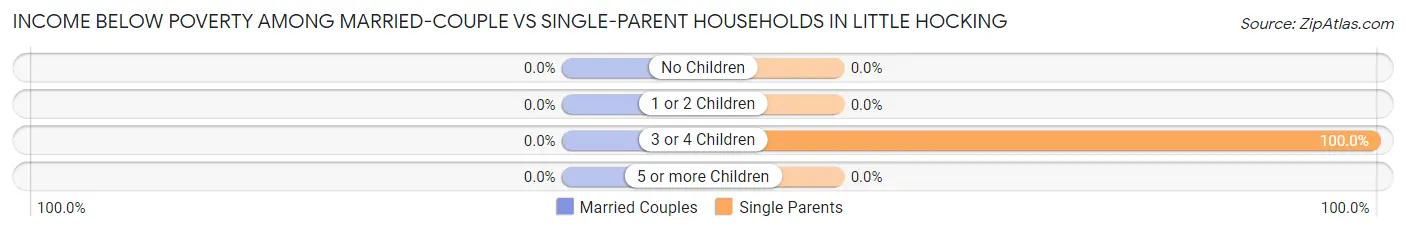
| Children | Married-Couple Families | Single-Parent Households |
| No Children | 0 (0.0%) | 0 (0.0%) |
| 1 or 2 Children | 0 (0.0%) | 0 (0.0%) |
| 3 or 4 Children | 0 (0.0%) | 13 (100.0%) |
| 5 or more Children | 0 (0.0%) | 0 (0.0%) |
| Total | 0 (0.0%) | 13 (100.0%) |
Employment Characteristics in Little Hocking
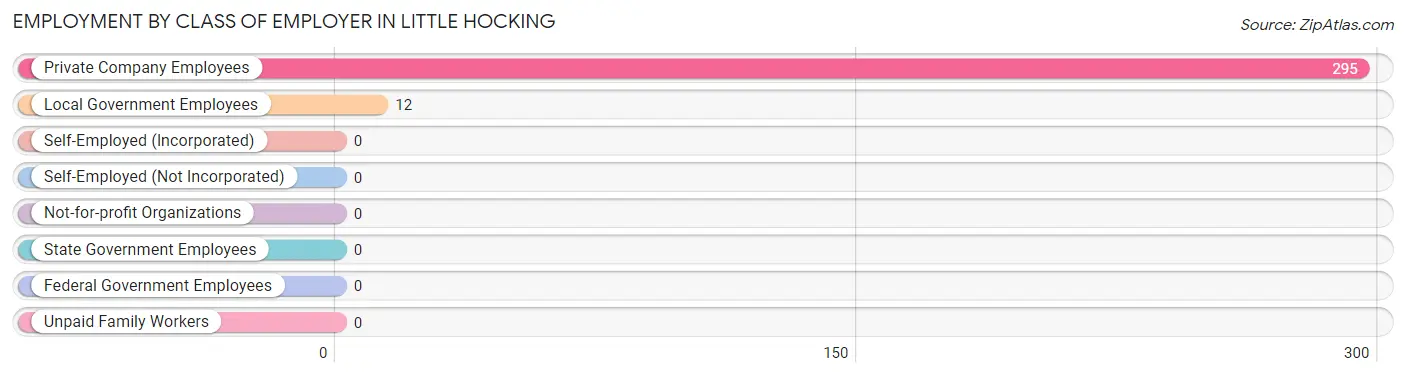
Employment by Class of Employer in Little Hocking
Among the 307 employed individuals in Little Hocking, private company employees (295 | 96.1%), and local government employees (12 | 3.9%) make up the most common classes of employment.
| Employer Class | # Employees | % Employees |
| Private Company Employees | 295 | 96.1% |
| Self-Employed (Incorporated) | 0 | 0.0% |
| Self-Employed (Not Incorporated) | 0 | 0.0% |
| Not-for-profit Organizations | 0 | 0.0% |
| Local Government Employees | 12 | 3.9% |
| State Government Employees | 0 | 0.0% |
| Federal Government Employees | 0 | 0.0% |
| Unpaid Family Workers | 0 | 0.0% |
| Total | 307 | 100.0% |
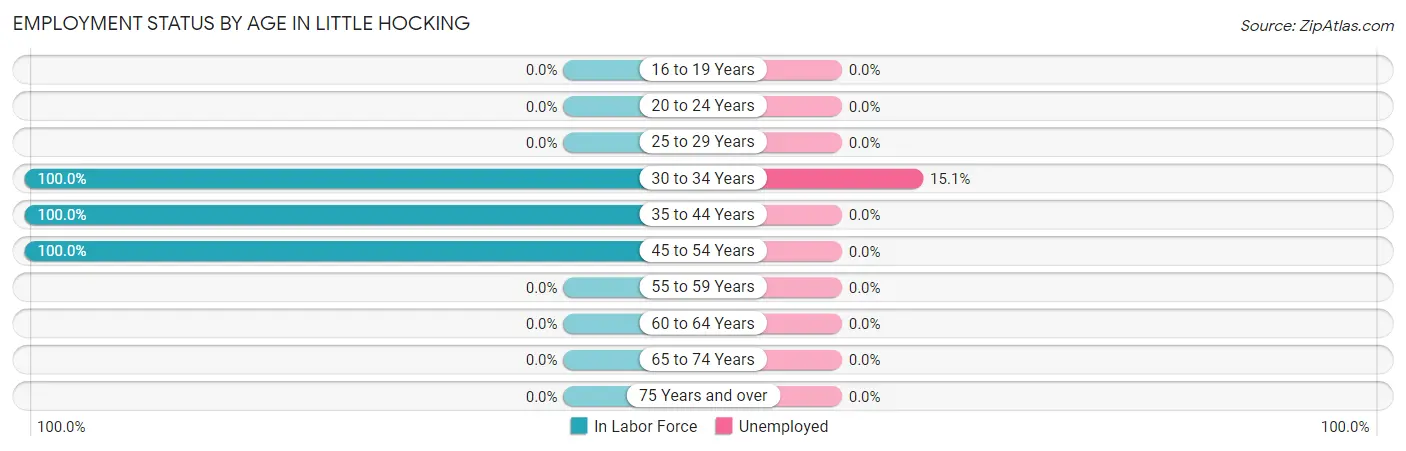
Employment Status by Age in Little Hocking
According to the labor force statistics for Little Hocking, out of the total population over 16 years of age (437), 73.9% or 323 individuals are in the labor force, with 5.0% or 16 of them unemployed. The age group with the highest labor force participation rate is 30 to 34 years, with 100.0% or 106 individuals in the labor force. Within the labor force, the 30 to 34 years age range has the highest percentage of unemployed individuals, with 15.1% or 16 of them being unemployed.
| Age Bracket | In Labor Force | Unemployed |
| 16 to 19 Years | 0 (0.0%) | 0 (0.0%) |
| 20 to 24 Years | 0 (0.0%) | 0 (0.0%) |
| 25 to 29 Years | 0 (0.0%) | 0 (0.0%) |
| 30 to 34 Years | 106 (100.0%) | 16 (15.1%) |
| 35 to 44 Years | 81 (100.0%) | 0 (0.0%) |
| 45 to 54 Years | 136 (100.0%) | 0 (0.0%) |
| 55 to 59 Years | 0 (0.0%) | 0 (0.0%) |
| 60 to 64 Years | 0 (0.0%) | 0 (0.0%) |
| 65 to 74 Years | 0 (0.0%) | 0 (0.0%) |
| 75 Years and over | 0 (0.0%) | 0 (0.0%) |
| Total | 323 (73.9%) | 16 (5.0%) |
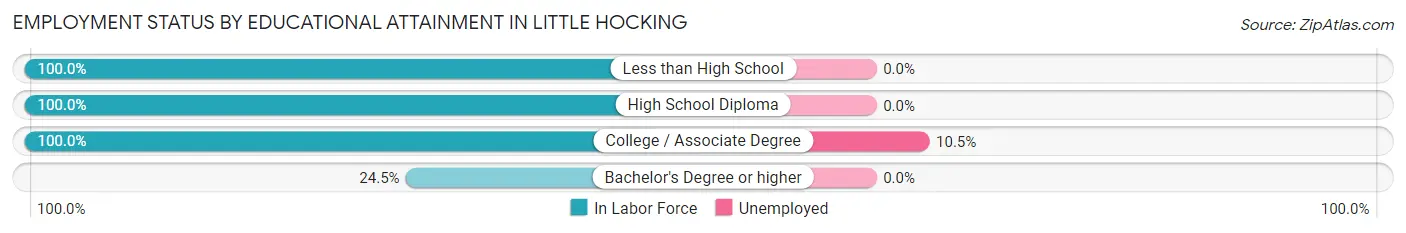
Employment Status by Educational Attainment in Little Hocking
According to labor force statistics for Little Hocking, 89.7% of individuals (323) out of the total population between 25 and 64 years of age (360) are in the labor force, with 5.0% or 16 of them being unemployed. The group with the highest labor force participation rate are those with the educational attainment of less than high school, with 100.0% or 146 individuals in the labor force. Within the labor force, individuals with college / associate degree education have the highest percentage of unemployment, with 10.5% or 16 of them being unemployed.
| Educational Attainment | In Labor Force | Unemployed |
| Less than High School | 146 (100.0%) | 0 (0.0%) |
| High School Diploma | 13 (100.0%) | 0 (0.0%) |
| College / Associate Degree | 152 (100.0%) | 16 (10.5%) |
| Bachelor's Degree or higher | 12 (24.5%) | 0 (0.0%) |
| Total | 323 (89.7%) | 18 (5.0%) |
Employment Occupations by Sex in Little Hocking
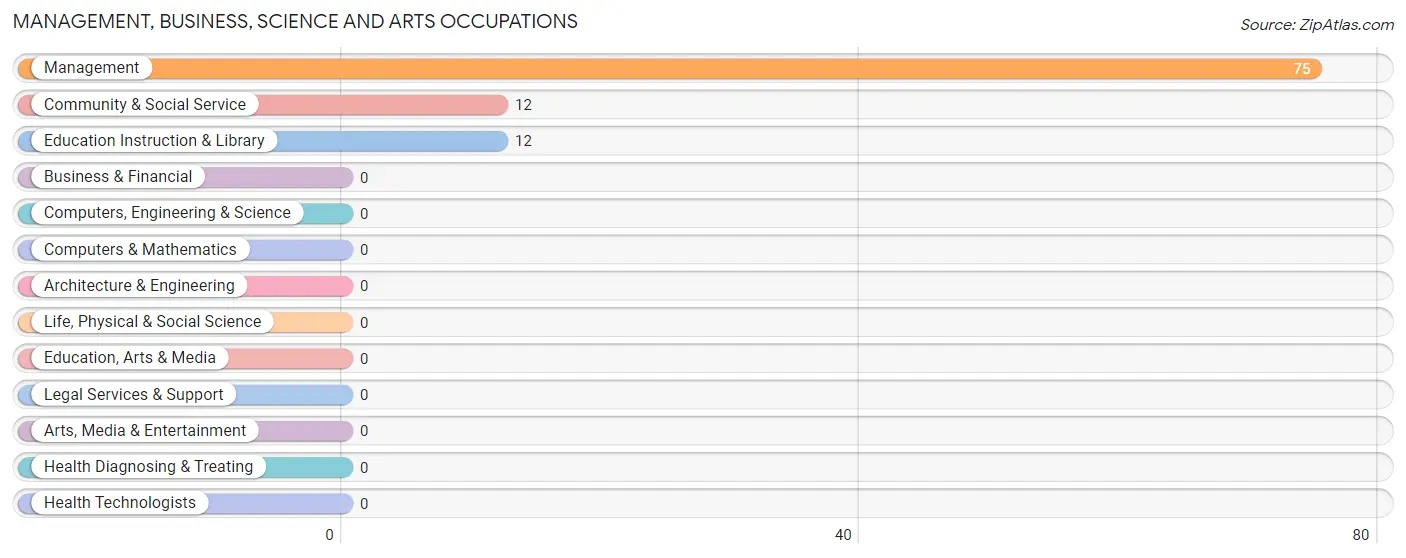
Management, Business, Science and Arts Occupations
The most common Management, Business, Science and Arts occupations in Little Hocking are Management (75 | 24.4%), Community & Social Service (12 | 3.9%), and Education Instruction & Library (12 | 3.9%).
Management, Business, Science and Arts Occupations by Sex
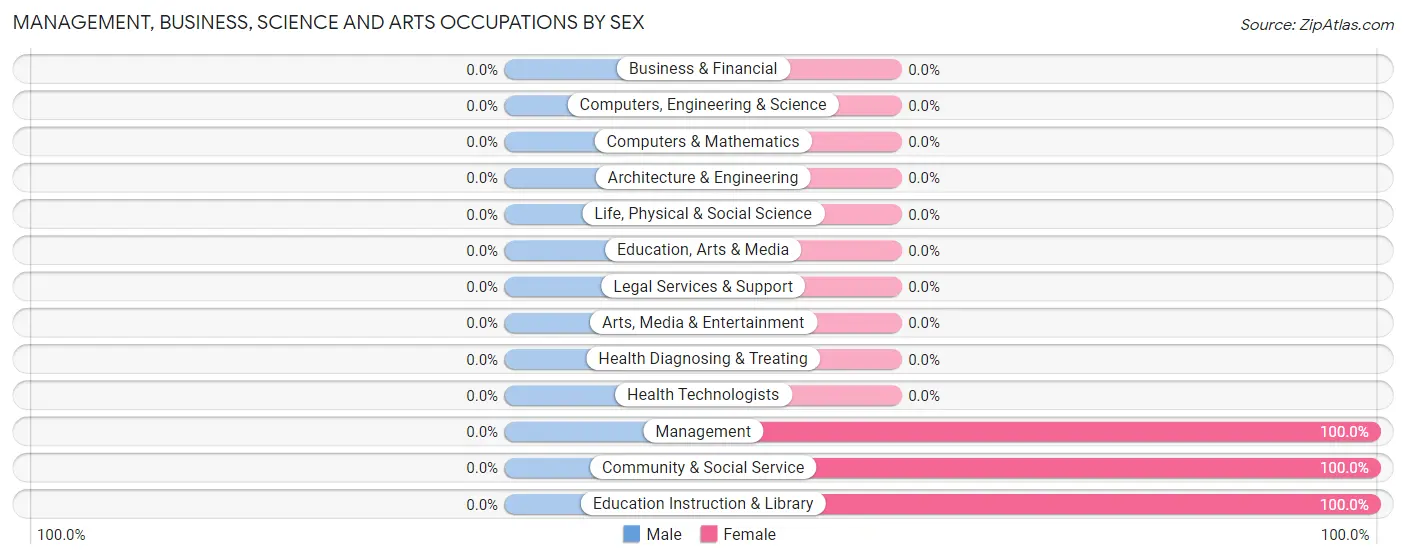
| Occupation | Male | Female |
| Management | 0 (0.0%) | 75 (100.0%) |
| Business & Financial | 0 (0.0%) | 0 (0.0%) |
| Computers, Engineering & Science | 0 (0.0%) | 0 (0.0%) |
| Computers & Mathematics | 0 (0.0%) | 0 (0.0%) |
| Architecture & Engineering | 0 (0.0%) | 0 (0.0%) |
| Life, Physical & Social Science | 0 (0.0%) | 0 (0.0%) |
| Community & Social Service | 0 (0.0%) | 12 (100.0%) |
| Education, Arts & Media | 0 (0.0%) | 0 (0.0%) |
| Legal Services & Support | 0 (0.0%) | 0 (0.0%) |
| Education Instruction & Library | 0 (0.0%) | 12 (100.0%) |
| Arts, Media & Entertainment | 0 (0.0%) | 0 (0.0%) |
| Health Diagnosing & Treating | 0 (0.0%) | 0 (0.0%) |
| Health Technologists | 0 (0.0%) | 0 (0.0%) |
| Total (Category) | 0 (0.0%) | 87 (100.0%) |
| Total (Overall) | 142 (46.3%) | 165 (53.7%) |
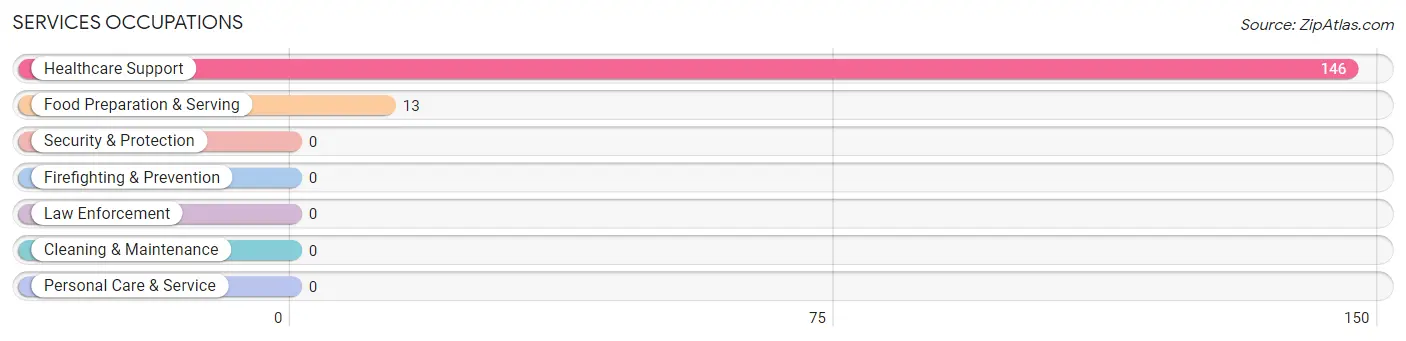
Services Occupations
The most common Services occupations in Little Hocking are Healthcare Support (146 | 47.6%), and Food Preparation & Serving (13 | 4.2%).
Services Occupations by Sex
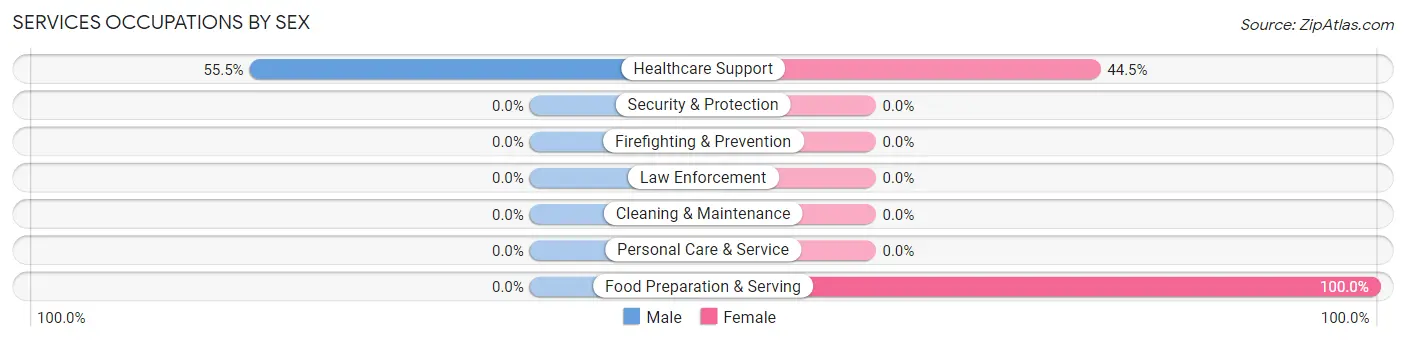
| Occupation | Male | Female |
| Healthcare Support | 81 (55.5%) | 65 (44.5%) |
| Security & Protection | 0 (0.0%) | 0 (0.0%) |
| Firefighting & Prevention | 0 (0.0%) | 0 (0.0%) |
| Law Enforcement | 0 (0.0%) | 0 (0.0%) |
| Food Preparation & Serving | 0 (0.0%) | 13 (100.0%) |
| Cleaning & Maintenance | 0 (0.0%) | 0 (0.0%) |
| Personal Care & Service | 0 (0.0%) | 0 (0.0%) |
| Total (Category) | 81 (50.9%) | 78 (49.1%) |
| Total (Overall) | 142 (46.3%) | 165 (53.7%) |
Sales and Office Occupations
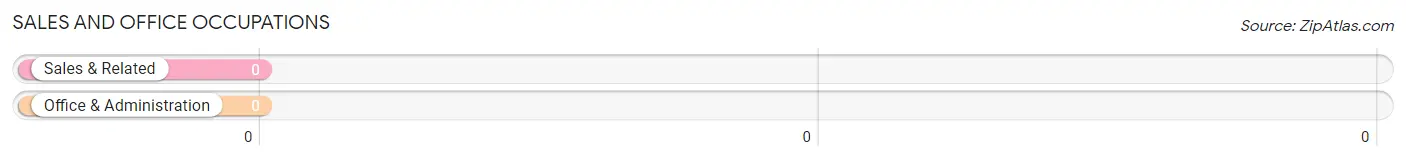
Sales and Office Occupations by Sex
| Occupation | Male | Female |
| Sales & Related | 0 (0.0%) | 0 (0.0%) |
| Office & Administration | 0 (0.0%) | 0 (0.0%) |
| Total (Category) | 0 (0.0%) | 0 (0.0%) |
| Total (Overall) | 142 (46.3%) | 165 (53.7%) |
Natural Resources, Construction and Maintenance Occupations
Natural Resources, Construction and Maintenance Occupations by Sex
| Occupation | Male | Female |
| Farming, Fishing & Forestry | 0 (0.0%) | 0 (0.0%) |
| Construction & Extraction | 0 (0.0%) | 0 (0.0%) |
| Installation, Maintenance & Repair | 0 (0.0%) | 0 (0.0%) |
| Total (Category) | 0 (0.0%) | 0 (0.0%) |
| Total (Overall) | 142 (46.3%) | 165 (53.7%) |
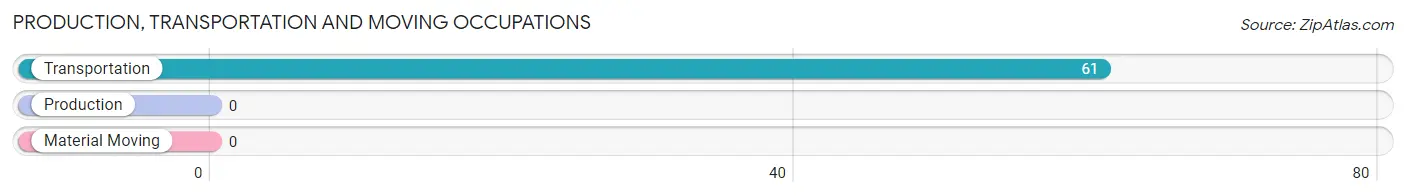
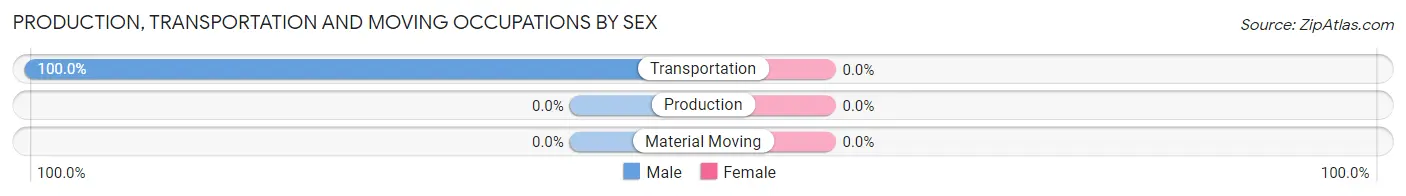
Production, Transportation and Moving Occupations
The most common Production, Transportation and Moving occupations in Little Hocking are , and Transportation (61 | 19.9%).
Production, Transportation and Moving Occupations by Sex
| Occupation | Male | Female |
| Production | 0 (0.0%) | 0 (0.0%) |
| Transportation | 61 (100.0%) | 0 (0.0%) |
| Material Moving | 0 (0.0%) | 0 (0.0%) |
| Total (Category) | 61 (100.0%) | 0 (0.0%) |
| Total (Overall) | 142 (46.3%) | 165 (53.7%) |
Employment Industries by Sex in Little Hocking
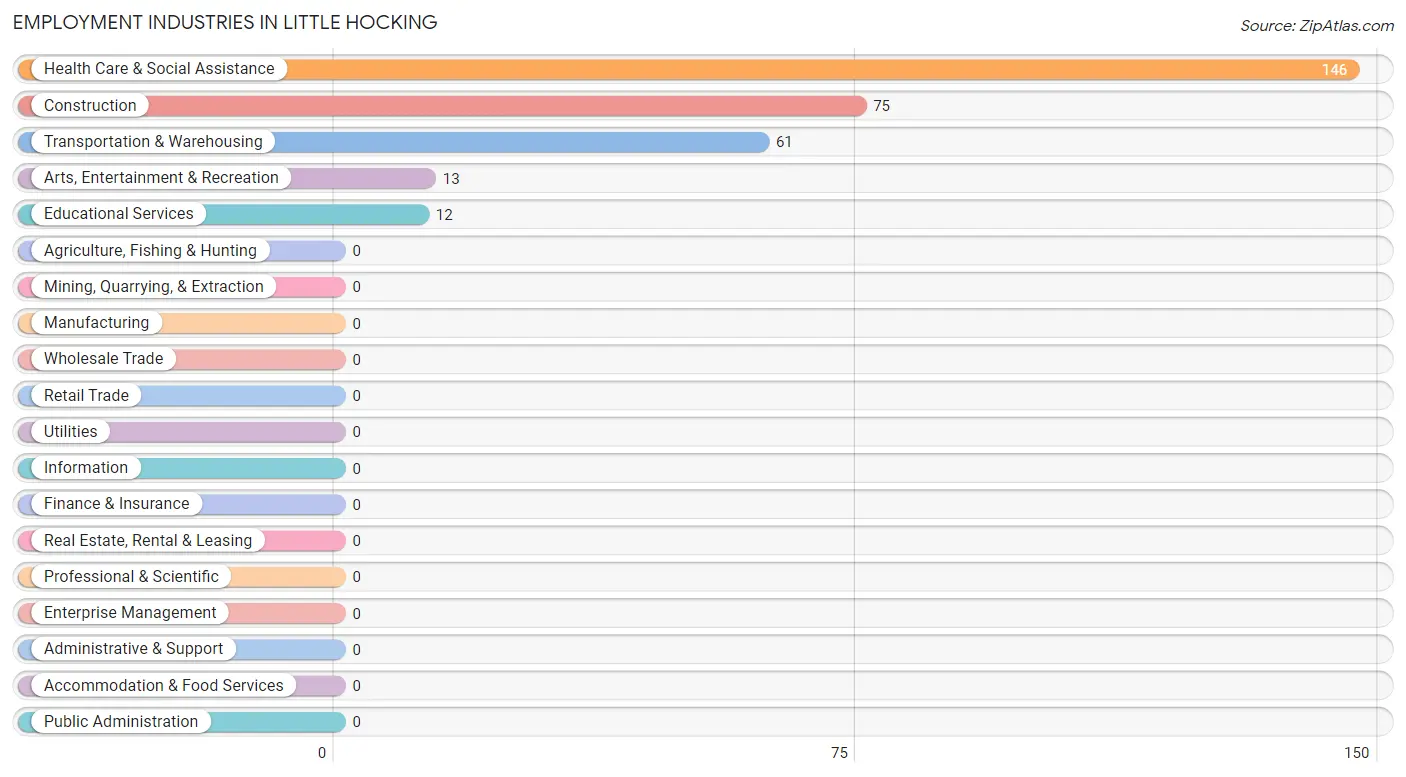
Employment Industries in Little Hocking
The major employment industries in Little Hocking include Health Care & Social Assistance (146 | 47.6%), Construction (75 | 24.4%), Transportation & Warehousing (61 | 19.9%), Arts, Entertainment & Recreation (13 | 4.2%), and Educational Services (12 | 3.9%).
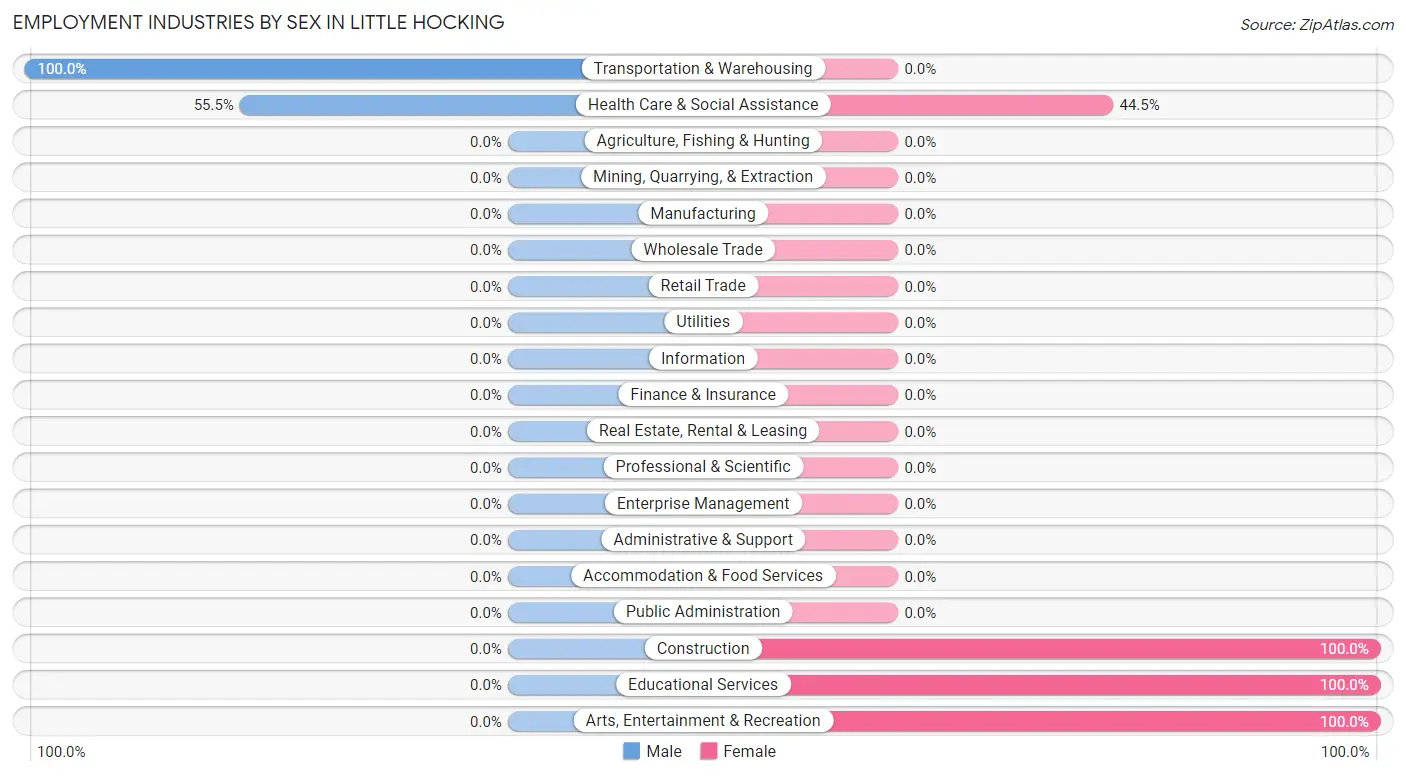
Employment Industries by Sex in Little Hocking
The Little Hocking industries that see more men than women are Transportation & Warehousing (100.0%), and Health Care & Social Assistance (55.5%), whereas the industries that tend to have a higher number of women are Construction (100.0%), Educational Services (100.0%), and Arts, Entertainment & Recreation (100.0%).
| Industry | Male | Female |
| Agriculture, Fishing & Hunting | 0 (0.0%) | 0 (0.0%) |
| Mining, Quarrying, & Extraction | 0 (0.0%) | 0 (0.0%) |
| Construction | 0 (0.0%) | 75 (100.0%) |
| Manufacturing | 0 (0.0%) | 0 (0.0%) |
| Wholesale Trade | 0 (0.0%) | 0 (0.0%) |
| Retail Trade | 0 (0.0%) | 0 (0.0%) |
| Transportation & Warehousing | 61 (100.0%) | 0 (0.0%) |
| Utilities | 0 (0.0%) | 0 (0.0%) |
| Information | 0 (0.0%) | 0 (0.0%) |
| Finance & Insurance | 0 (0.0%) | 0 (0.0%) |
| Real Estate, Rental & Leasing | 0 (0.0%) | 0 (0.0%) |
| Professional & Scientific | 0 (0.0%) | 0 (0.0%) |
| Enterprise Management | 0 (0.0%) | 0 (0.0%) |
| Administrative & Support | 0 (0.0%) | 0 (0.0%) |
| Educational Services | 0 (0.0%) | 12 (100.0%) |
| Health Care & Social Assistance | 81 (55.5%) | 65 (44.5%) |
| Arts, Entertainment & Recreation | 0 (0.0%) | 13 (100.0%) |
| Accommodation & Food Services | 0 (0.0%) | 0 (0.0%) |
| Public Administration | 0 (0.0%) | 0 (0.0%) |
| Total | 142 (46.3%) | 165 (53.7%) |
Education in Little Hocking
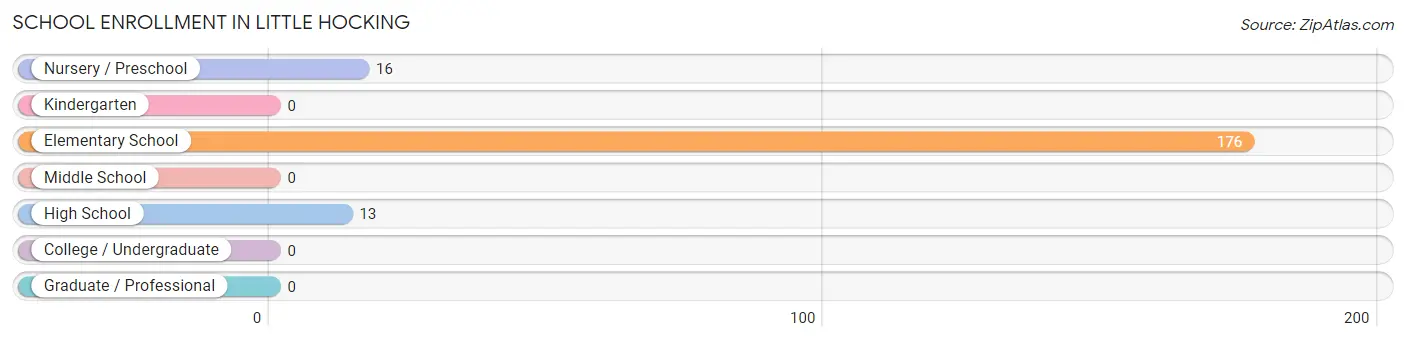
School Enrollment in Little Hocking
The most common levels of schooling among the 205 students in Little Hocking are elementary school (176 | 85.9%), nursery / preschool (16 | 7.8%), and high school (13 | 6.3%).
| School Level | # Students | % Students |
| Nursery / Preschool | 16 | 7.8% |
| Kindergarten | 0 | 0.0% |
| Elementary School | 176 | 85.9% |
| Middle School | 0 | 0.0% |
| High School | 13 | 6.3% |
| College / Undergraduate | 0 | 0.0% |
| Graduate / Professional | 0 | 0.0% |
| Total | 205 | 100.0% |
School Enrollment by Age by Funding Source in Little Hocking
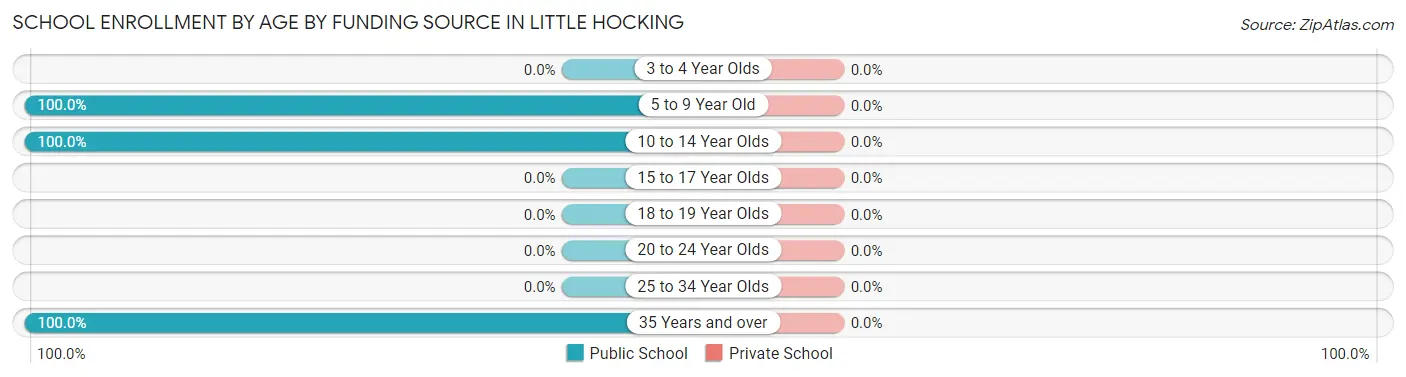
| Age Bracket | Public School | Private School |
| 3 to 4 Year Olds | 0 (0.0%) | 0 (0.0%) |
| 5 to 9 Year Old | 104 (100.0%) | 0 (0.0%) |
| 10 to 14 Year Olds | 88 (100.0%) | 0 (0.0%) |
| 15 to 17 Year Olds | 0 (0.0%) | 0 (0.0%) |
| 18 to 19 Year Olds | 0 (0.0%) | 0 (0.0%) |
| 20 to 24 Year Olds | 0 (0.0%) | 0 (0.0%) |
| 25 to 34 Year Olds | 0 (0.0%) | 0 (0.0%) |
| 35 Years and over | 13 (100.0%) | 0 (0.0%) |
| Total | 205 (100.0%) | 0 (0.0%) |
Educational Attainment by Field of Study in Little Hocking
Science & technology (45 | 78.9%), and education (12 | 21.0%) are the most common fields of study among 57 individuals in Little Hocking who have obtained a bachelor's degree or higher.
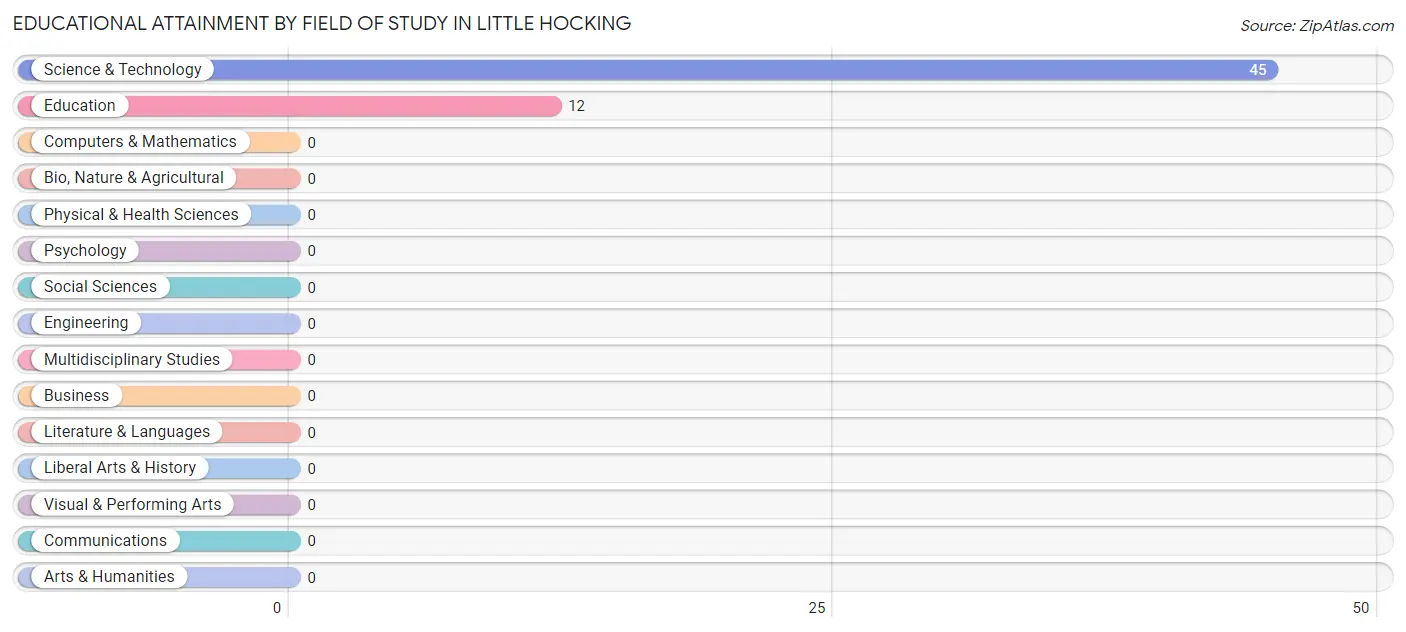
| Field of Study | # Graduates | % Graduates |
| Computers & Mathematics | 0 | 0.0% |
| Bio, Nature & Agricultural | 0 | 0.0% |
| Physical & Health Sciences | 0 | 0.0% |
| Psychology | 0 | 0.0% |
| Social Sciences | 0 | 0.0% |
| Engineering | 0 | 0.0% |
| Multidisciplinary Studies | 0 | 0.0% |
| Science & Technology | 45 | 78.9% |
| Business | 0 | 0.0% |
| Education | 12 | 21.0% |
| Literature & Languages | 0 | 0.0% |
| Liberal Arts & History | 0 | 0.0% |
| Visual & Performing Arts | 0 | 0.0% |
| Communications | 0 | 0.0% |
| Arts & Humanities | 0 | 0.0% |
| Total | 57 | 100.0% |
Transportation & Commute in Little Hocking
Vehicle Availability by Sex in Little Hocking
The most prevalent vehicle ownership categories in Little Hocking are males with 3 vehicles (142, accounting for 100.0%) and females with 3 vehicles (140, making up 86.1%).
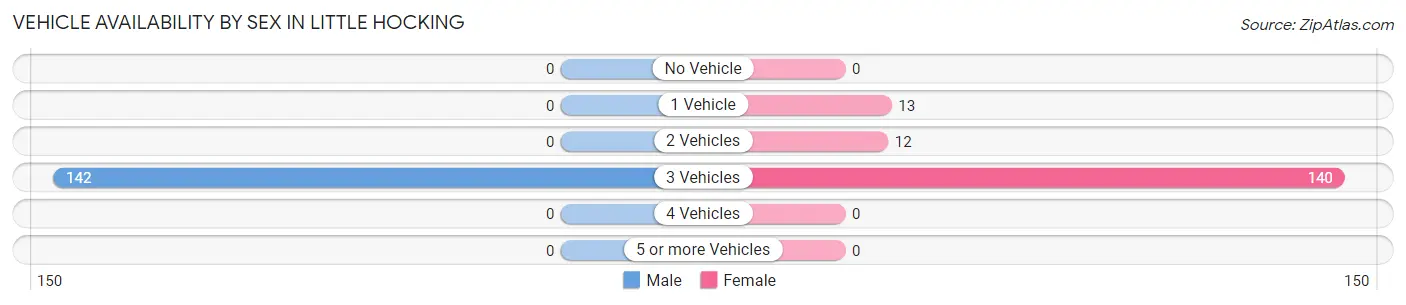
| Vehicles Available | Male | Female |
| No Vehicle | 0 (0.0%) | 0 (0.0%) |
| 1 Vehicle | 0 (0.0%) | 13 (7.9%) |
| 2 Vehicles | 0 (0.0%) | 12 (7.3%) |
| 3 Vehicles | 142 (100.0%) | 140 (84.9%) |
| 4 Vehicles | 0 (0.0%) | 0 (0.0%) |
| 5 or more Vehicles | 0 (0.0%) | 0 (0.0%) |
| Total | 142 (100.0%) | 165 (100.0%) |
Commute Time in Little Hocking
The most frequently occuring commute durations in Little Hocking are 25 to 29 minutes (146 commuters, 49.7%), 30 to 34 minutes (75 commuters, 25.5%), and 90 or more minutes (61 commuters, 20.7%).
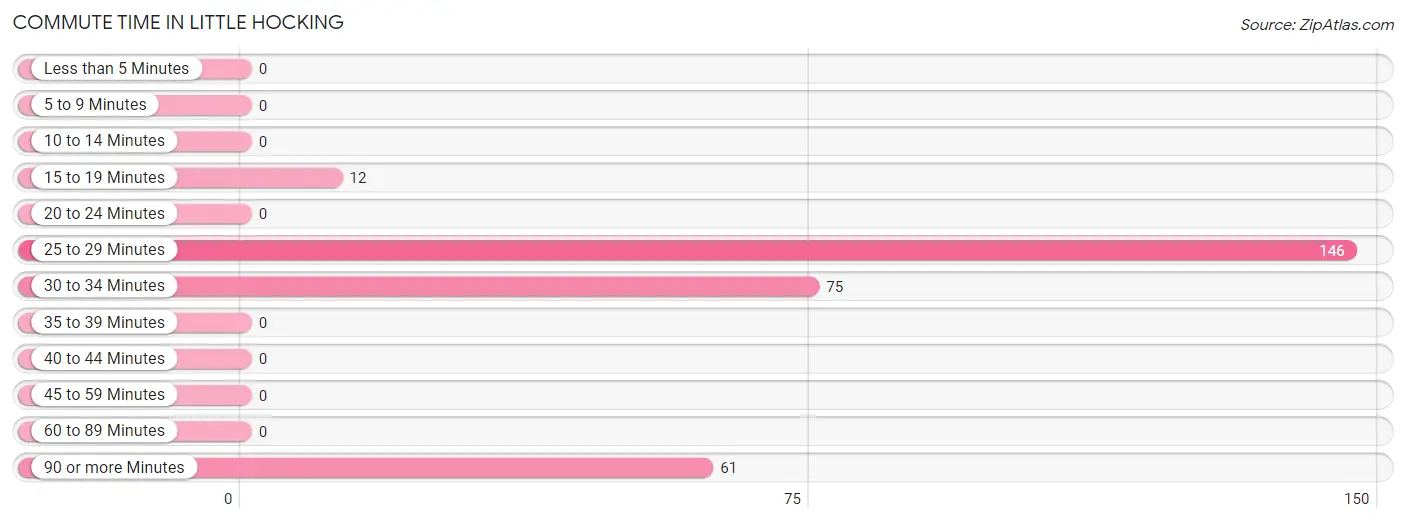
| Commute Time | # Commuters | % Commuters |
| Less than 5 Minutes | 0 | 0.0% |
| 5 to 9 Minutes | 0 | 0.0% |
| 10 to 14 Minutes | 0 | 0.0% |
| 15 to 19 Minutes | 12 | 4.1% |
| 20 to 24 Minutes | 0 | 0.0% |
| 25 to 29 Minutes | 146 | 49.7% |
| 30 to 34 Minutes | 75 | 25.5% |
| 35 to 39 Minutes | 0 | 0.0% |
| 40 to 44 Minutes | 0 | 0.0% |
| 45 to 59 Minutes | 0 | 0.0% |
| 60 to 89 Minutes | 0 | 0.0% |
| 90 or more Minutes | 61 | 20.7% |
Commute Time by Sex in Little Hocking
The most common commute times in Little Hocking are 25 to 29 minutes (81 commuters, 57.0%) for males and 30 to 34 minutes (75 commuters, 49.3%) for females.
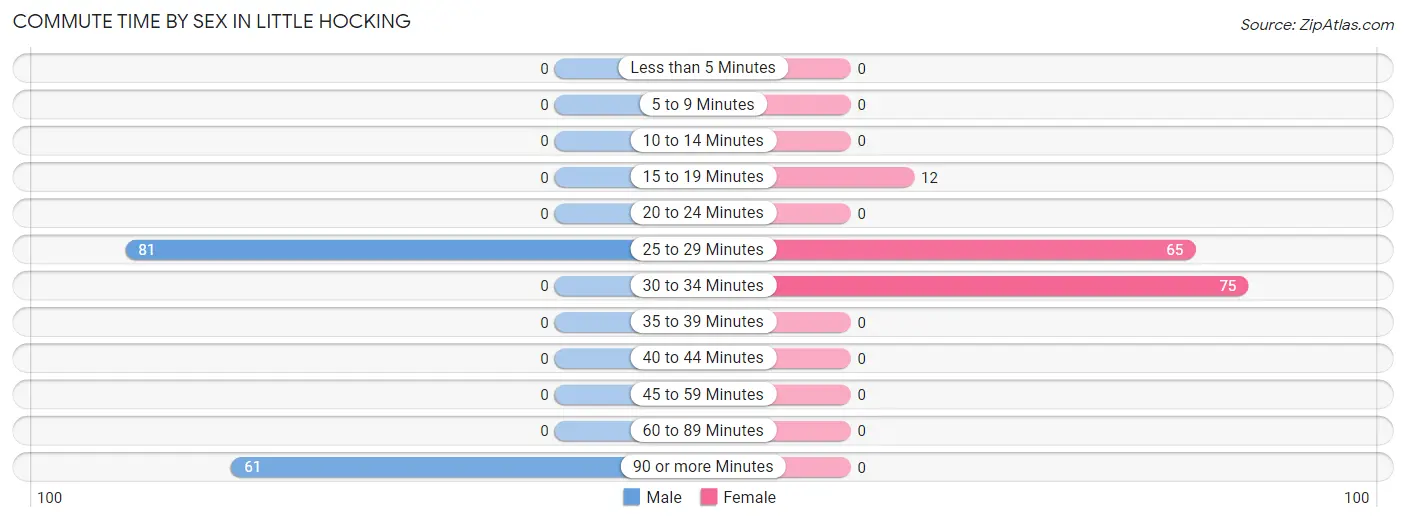
| Commute Time | Male | Female |
| Less than 5 Minutes | 0 (0.0%) | 0 (0.0%) |
| 5 to 9 Minutes | 0 (0.0%) | 0 (0.0%) |
| 10 to 14 Minutes | 0 (0.0%) | 0 (0.0%) |
| 15 to 19 Minutes | 0 (0.0%) | 12 (7.9%) |
| 20 to 24 Minutes | 0 (0.0%) | 0 (0.0%) |
| 25 to 29 Minutes | 81 (57.0%) | 65 (42.8%) |
| 30 to 34 Minutes | 0 (0.0%) | 75 (49.3%) |
| 35 to 39 Minutes | 0 (0.0%) | 0 (0.0%) |
| 40 to 44 Minutes | 0 (0.0%) | 0 (0.0%) |
| 45 to 59 Minutes | 0 (0.0%) | 0 (0.0%) |
| 60 to 89 Minutes | 0 (0.0%) | 0 (0.0%) |
| 90 or more Minutes | 61 (43.0%) | 0 (0.0%) |
Time of Departure to Work by Sex in Little Hocking
The most frequent times of departure to work in Little Hocking are 9:00 AM to 9:59 AM (81, 57.0%) for males and 7:30 AM to 7:59 AM (75, 49.3%) for females.
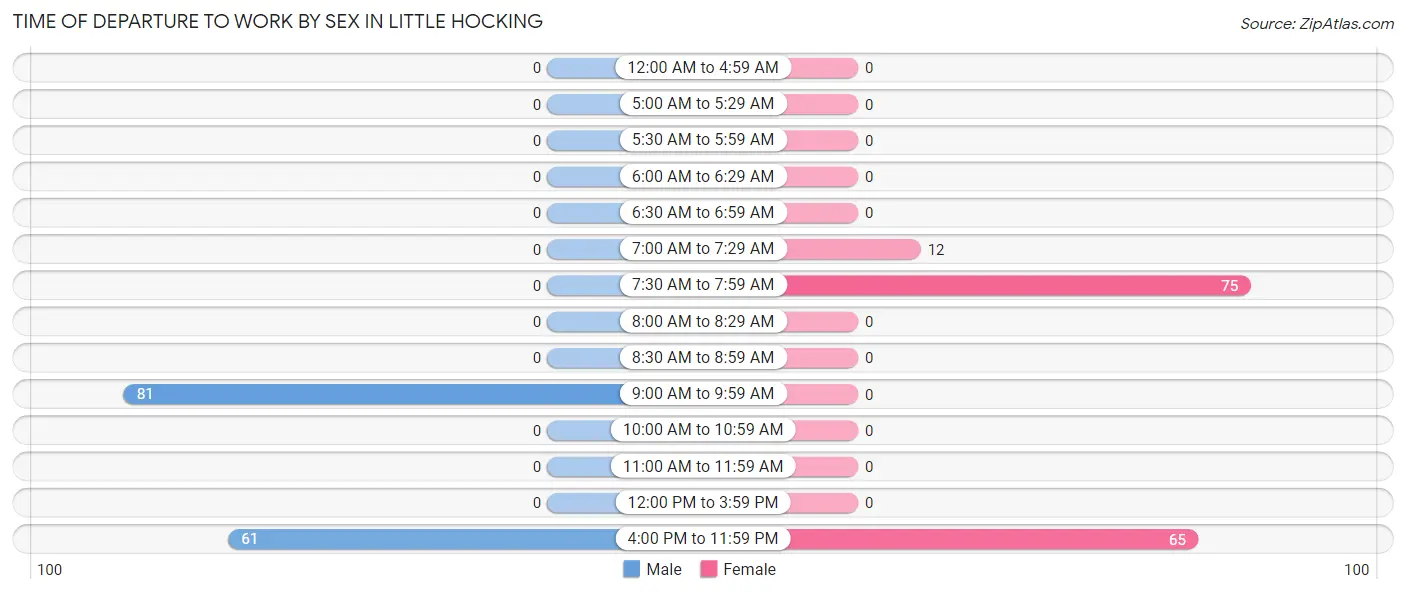
| Time of Departure | Male | Female |
| 12:00 AM to 4:59 AM | 0 (0.0%) | 0 (0.0%) |
| 5:00 AM to 5:29 AM | 0 (0.0%) | 0 (0.0%) |
| 5:30 AM to 5:59 AM | 0 (0.0%) | 0 (0.0%) |
| 6:00 AM to 6:29 AM | 0 (0.0%) | 0 (0.0%) |
| 6:30 AM to 6:59 AM | 0 (0.0%) | 0 (0.0%) |
| 7:00 AM to 7:29 AM | 0 (0.0%) | 12 (7.9%) |
| 7:30 AM to 7:59 AM | 0 (0.0%) | 75 (49.3%) |
| 8:00 AM to 8:29 AM | 0 (0.0%) | 0 (0.0%) |
| 8:30 AM to 8:59 AM | 0 (0.0%) | 0 (0.0%) |
| 9:00 AM to 9:59 AM | 81 (57.0%) | 0 (0.0%) |
| 10:00 AM to 10:59 AM | 0 (0.0%) | 0 (0.0%) |
| 11:00 AM to 11:59 AM | 0 (0.0%) | 0 (0.0%) |
| 12:00 PM to 3:59 PM | 0 (0.0%) | 0 (0.0%) |
| 4:00 PM to 11:59 PM | 61 (43.0%) | 65 (42.8%) |
| Total | 142 (100.0%) | 152 (100.0%) |
Housing Occupancy in Little Hocking
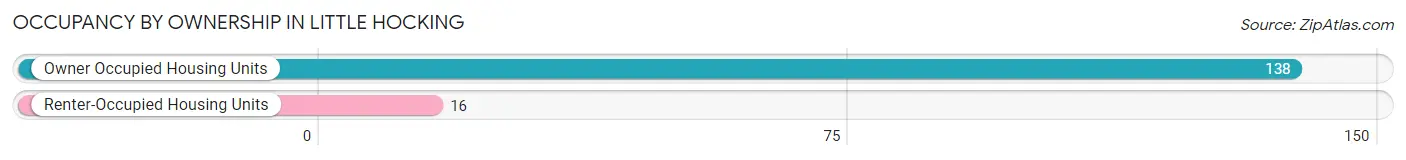
Occupancy by Ownership in Little Hocking
Of the total 154 dwellings in Little Hocking, owner-occupied units account for 138 (89.6%), while renter-occupied units make up 16 (10.4%).
| Occupancy | # Housing Units | % Housing Units |
| Owner Occupied Housing Units | 138 | 89.6% |
| Renter-Occupied Housing Units | 16 | 10.4% |
| Total Occupied Housing Units | 154 | 100.0% |
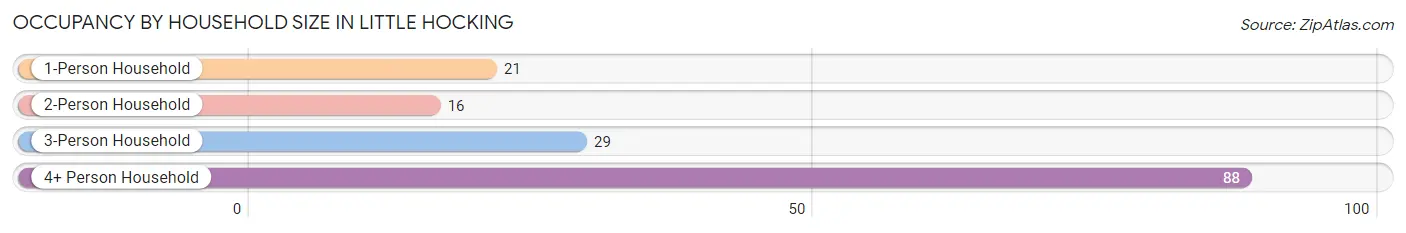
Occupancy by Household Size in Little Hocking
| Household Size | # Housing Units | % Housing Units |
| 1-Person Household | 21 | 13.6% |
| 2-Person Household | 16 | 10.4% |
| 3-Person Household | 29 | 18.8% |
| 4+ Person Household | 88 | 57.1% |
| Total Housing Units | 154 | 100.0% |
Occupancy by Ownership by Household Size in Little Hocking
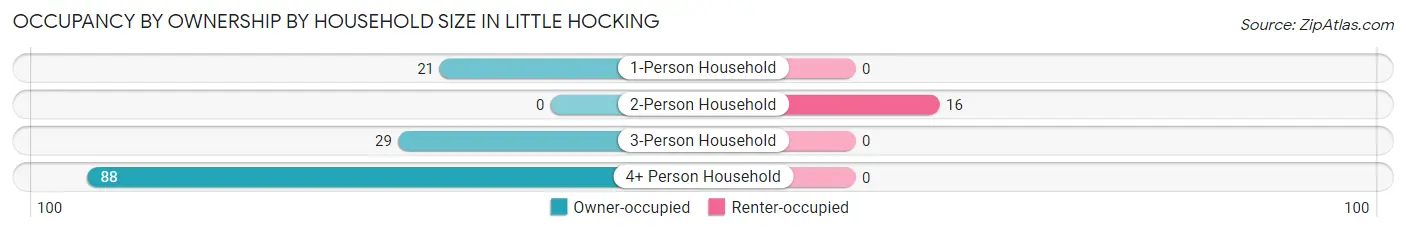
| Household Size | Owner-occupied | Renter-occupied |
| 1-Person Household | 21 (100.0%) | 0 (0.0%) |
| 2-Person Household | 0 (0.0%) | 16 (100.0%) |
| 3-Person Household | 29 (100.0%) | 0 (0.0%) |
| 4+ Person Household | 88 (100.0%) | 0 (0.0%) |
| Total Housing Units | 138 (89.6%) | 16 (10.4%) |
Occupancy by Educational Attainment in Little Hocking
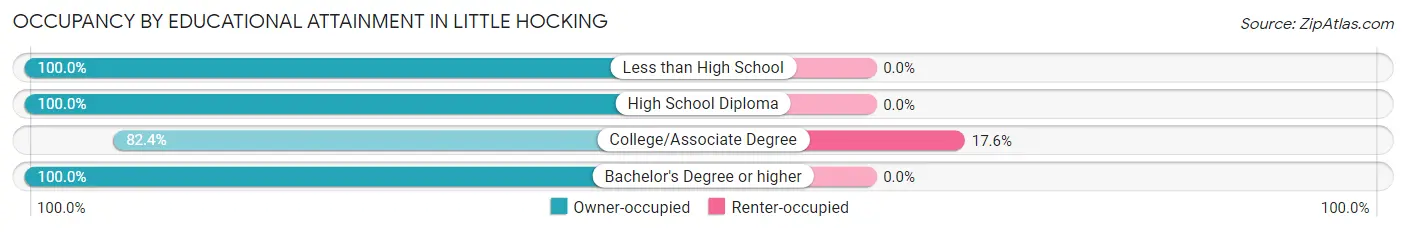
| Household Size | Owner-occupied | Renter-occupied |
| Less than High School | 13 (100.0%) | 0 (0.0%) |
| High School Diploma | 42 (100.0%) | 0 (0.0%) |
| College/Associate Degree | 75 (82.4%) | 16 (17.6%) |
| Bachelor's Degree or higher | 8 (100.0%) | 0 (0.0%) |
Occupancy by Age of Householder in Little Hocking
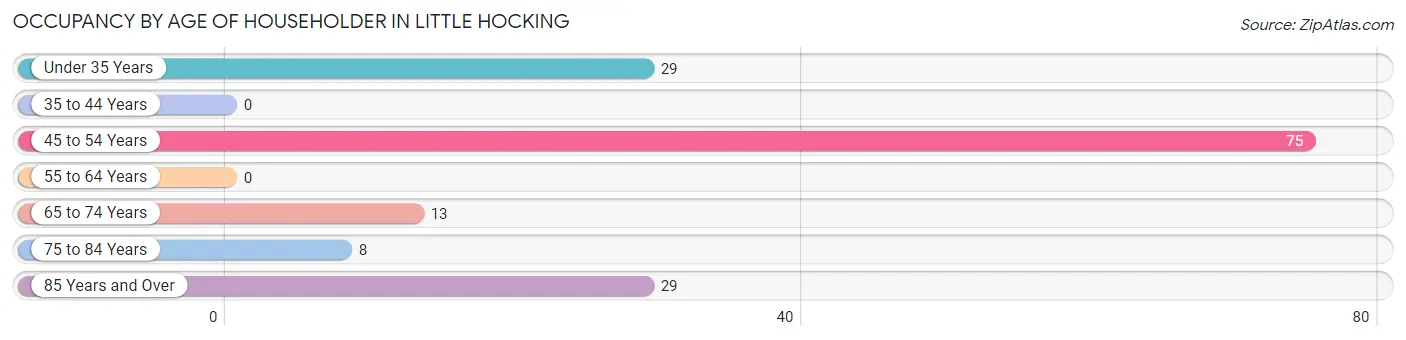
| Age Bracket | # Households | % Households |
| Under 35 Years | 29 | 18.8% |
| 35 to 44 Years | 0 | 0.0% |
| 45 to 54 Years | 75 | 48.7% |
| 55 to 64 Years | 0 | 0.0% |
| 65 to 74 Years | 13 | 8.4% |
| 75 to 84 Years | 8 | 5.2% |
| 85 Years and Over | 29 | 18.8% |
| Total | 154 | 100.0% |
Housing Finances in Little Hocking
Median Income by Occupancy in Little Hocking
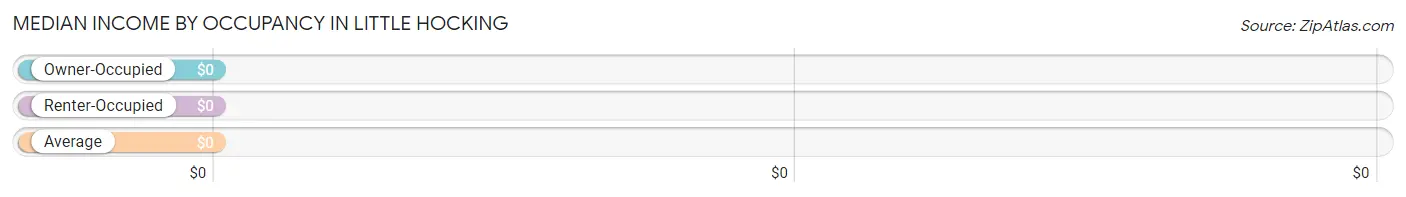
| Occupancy Type | # Households | Median Income |
| Owner-Occupied | 138 (89.6%) | $0 |
| Renter-Occupied | 16 (10.4%) | $0 |
| Average | 154 (100.0%) | $0 |
Occupancy by Householder Income Bracket in Little Hocking
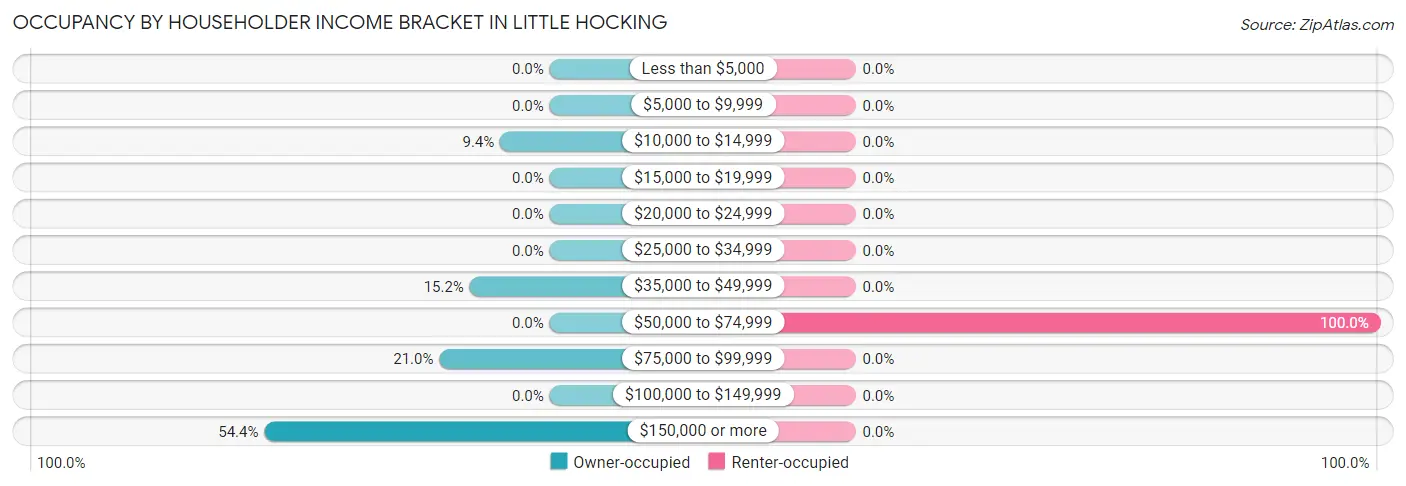
| Income Bracket | Owner-occupied | Renter-occupied |
| Less than $5,000 | 0 (0.0%) | 0 (0.0%) |
| $5,000 to $9,999 | 0 (0.0%) | 0 (0.0%) |
| $10,000 to $14,999 | 13 (9.4%) | 0 (0.0%) |
| $15,000 to $19,999 | 0 (0.0%) | 0 (0.0%) |
| $20,000 to $24,999 | 0 (0.0%) | 0 (0.0%) |
| $25,000 to $34,999 | 0 (0.0%) | 0 (0.0%) |
| $35,000 to $49,999 | 21 (15.2%) | 0 (0.0%) |
| $50,000 to $74,999 | 0 (0.0%) | 16 (100.0%) |
| $75,000 to $99,999 | 29 (21.0%) | 0 (0.0%) |
| $100,000 to $149,999 | 0 (0.0%) | 0 (0.0%) |
| $150,000 or more | 75 (54.3%) | 0 (0.0%) |
| Total | 138 (100.0%) | 16 (100.0%) |
Monthly Housing Cost Tiers in Little Hocking
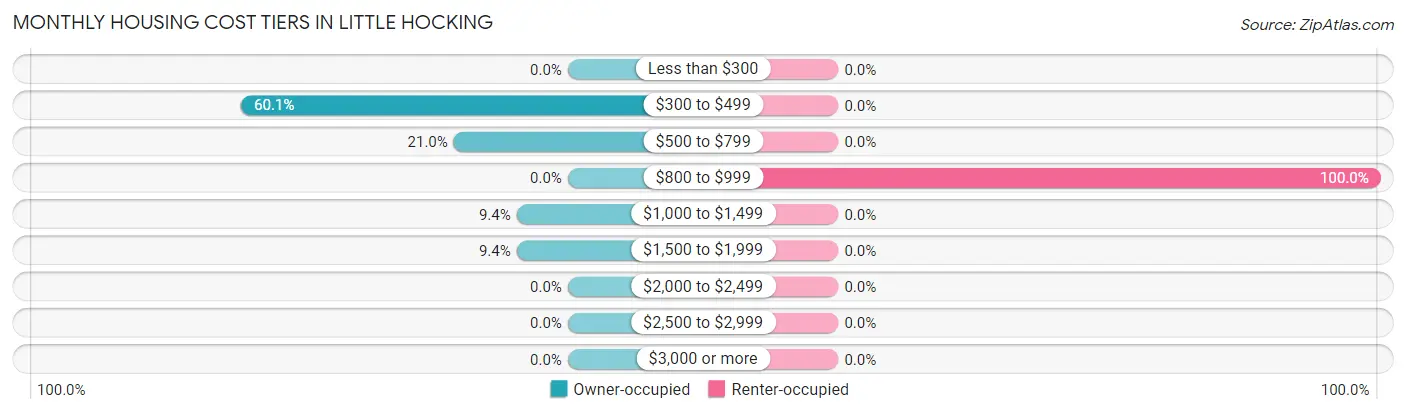
| Monthly Cost | Owner-occupied | Renter-occupied |
| Less than $300 | 0 (0.0%) | 0 (0.0%) |
| $300 to $499 | 83 (60.1%) | 0 (0.0%) |
| $500 to $799 | 29 (21.0%) | 0 (0.0%) |
| $800 to $999 | 0 (0.0%) | 16 (100.0%) |
| $1,000 to $1,499 | 13 (9.4%) | 0 (0.0%) |
| $1,500 to $1,999 | 13 (9.4%) | 0 (0.0%) |
| $2,000 to $2,499 | 0 (0.0%) | 0 (0.0%) |
| $2,500 to $2,999 | 0 (0.0%) | 0 (0.0%) |
| $3,000 or more | 0 (0.0%) | 0 (0.0%) |
| Total | 138 (100.0%) | 16 (100.0%) |
Physical Housing Characteristics in Little Hocking
Housing Structures in Little Hocking
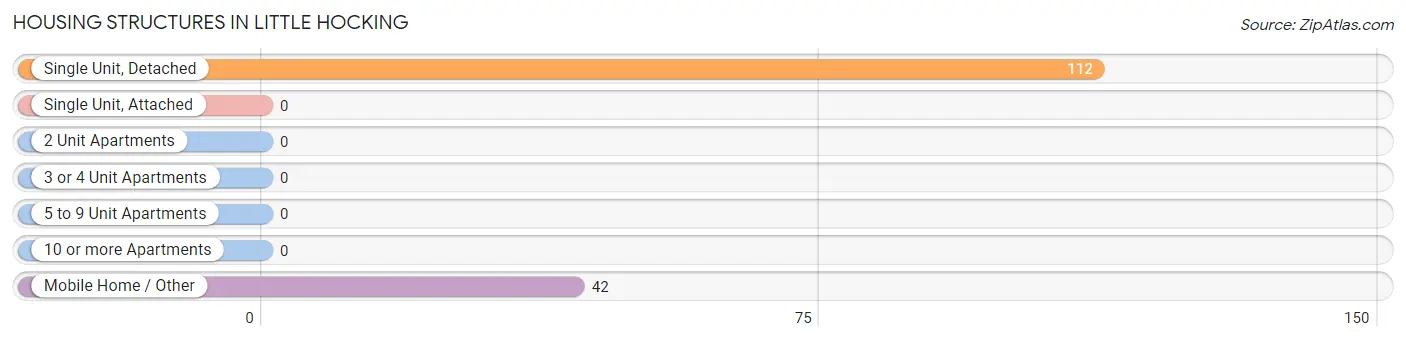
| Structure Type | # Housing Units | % Housing Units |
| Single Unit, Detached | 112 | 72.7% |
| Single Unit, Attached | 0 | 0.0% |
| 2 Unit Apartments | 0 | 0.0% |
| 3 or 4 Unit Apartments | 0 | 0.0% |
| 5 to 9 Unit Apartments | 0 | 0.0% |
| 10 or more Apartments | 0 | 0.0% |
| Mobile Home / Other | 42 | 27.3% |
| Total | 154 | 100.0% |
Housing Structures by Occupancy in Little Hocking
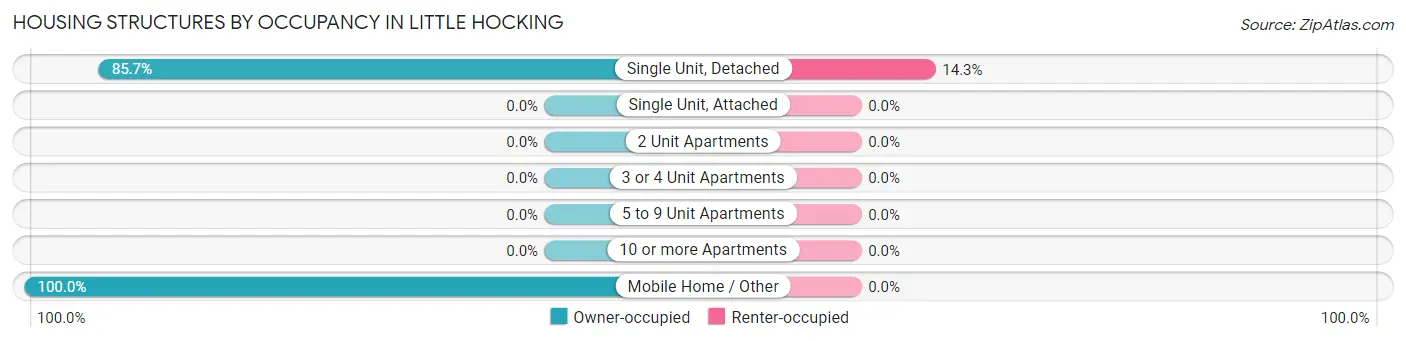
| Structure Type | Owner-occupied | Renter-occupied |
| Single Unit, Detached | 96 (85.7%) | 16 (14.3%) |
| Single Unit, Attached | 0 (0.0%) | 0 (0.0%) |
| 2 Unit Apartments | 0 (0.0%) | 0 (0.0%) |
| 3 or 4 Unit Apartments | 0 (0.0%) | 0 (0.0%) |
| 5 to 9 Unit Apartments | 0 (0.0%) | 0 (0.0%) |
| 10 or more Apartments | 0 (0.0%) | 0 (0.0%) |
| Mobile Home / Other | 42 (100.0%) | 0 (0.0%) |
| Total | 138 (89.6%) | 16 (10.4%) |
Housing Structures by Number of Rooms in Little Hocking
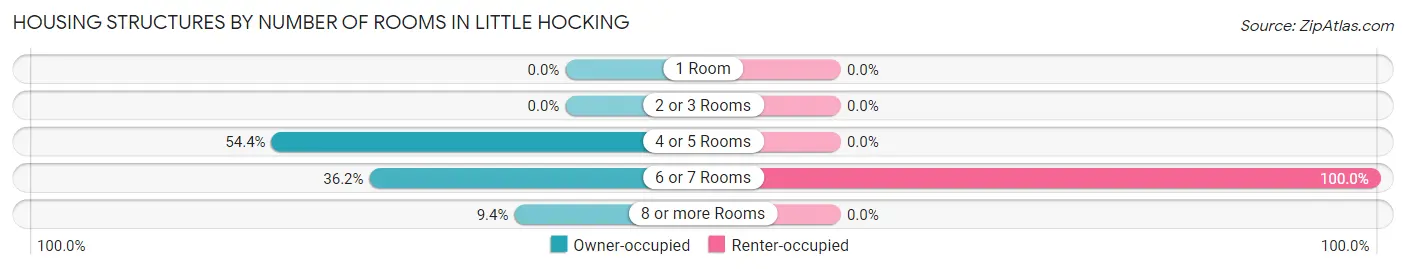
| Number of Rooms | Owner-occupied | Renter-occupied |
| 1 Room | 0 (0.0%) | 0 (0.0%) |
| 2 or 3 Rooms | 0 (0.0%) | 0 (0.0%) |
| 4 or 5 Rooms | 75 (54.3%) | 0 (0.0%) |
| 6 or 7 Rooms | 50 (36.2%) | 16 (100.0%) |
| 8 or more Rooms | 13 (9.4%) | 0 (0.0%) |
| Total | 138 (100.0%) | 16 (100.0%) |
Housing Structure by Heating Type in Little Hocking
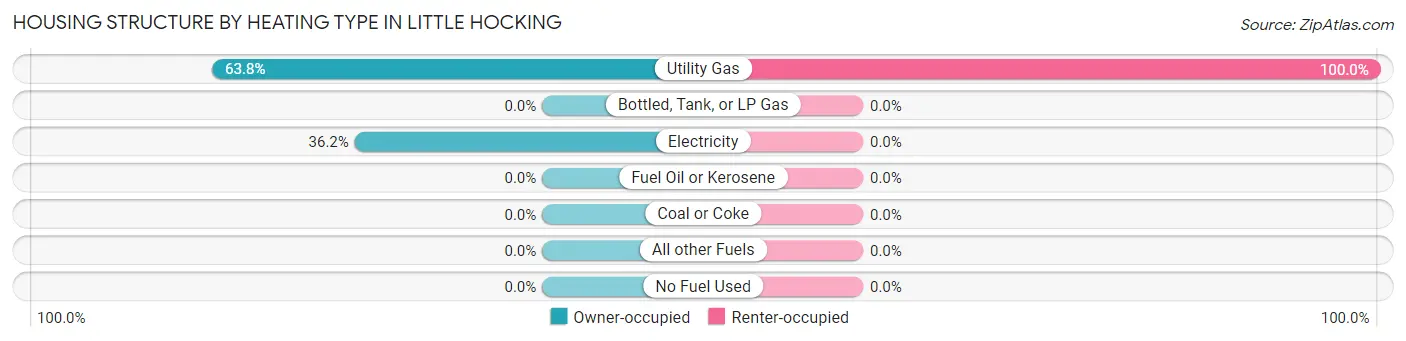
| Heating Type | Owner-occupied | Renter-occupied |
| Utility Gas | 88 (63.8%) | 16 (100.0%) |
| Bottled, Tank, or LP Gas | 0 (0.0%) | 0 (0.0%) |
| Electricity | 50 (36.2%) | 0 (0.0%) |
| Fuel Oil or Kerosene | 0 (0.0%) | 0 (0.0%) |
| Coal or Coke | 0 (0.0%) | 0 (0.0%) |
| All other Fuels | 0 (0.0%) | 0 (0.0%) |
| No Fuel Used | 0 (0.0%) | 0 (0.0%) |
| Total | 138 (100.0%) | 16 (100.0%) |
Household Vehicle Usage in Little Hocking
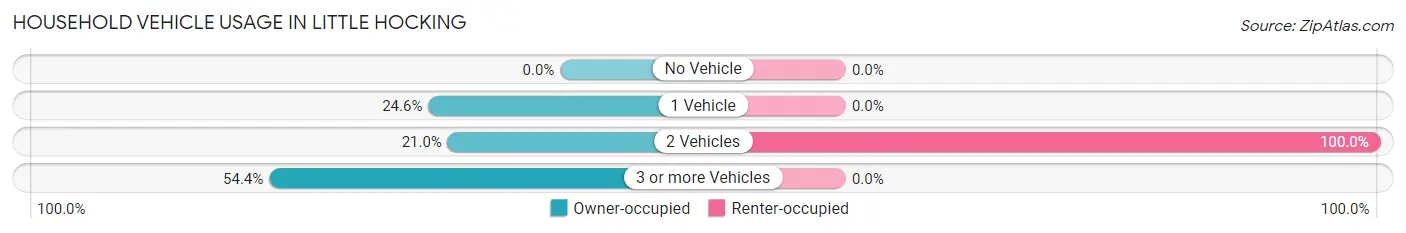
| Vehicles per Household | Owner-occupied | Renter-occupied |
| No Vehicle | 0 (0.0%) | 0 (0.0%) |
| 1 Vehicle | 34 (24.6%) | 0 (0.0%) |
| 2 Vehicles | 29 (21.0%) | 16 (100.0%) |
| 3 or more Vehicles | 75 (54.3%) | 0 (0.0%) |
| Total | 138 (100.0%) | 16 (100.0%) |
Real Estate & Mortgages in Little Hocking
Real Estate and Mortgage Overview in Little Hocking
| Characteristic | Without Mortgage | With Mortgage |
| Housing Units | 112 | 26 |
| Median Property Value | $83,600 | $0 |
| Median Household Income | $173,133 | $0 |
| Monthly Housing Costs | $387 | $0 |
| Real Estate Taxes | $872 | $0 |
Property Value by Mortgage Status in Little Hocking
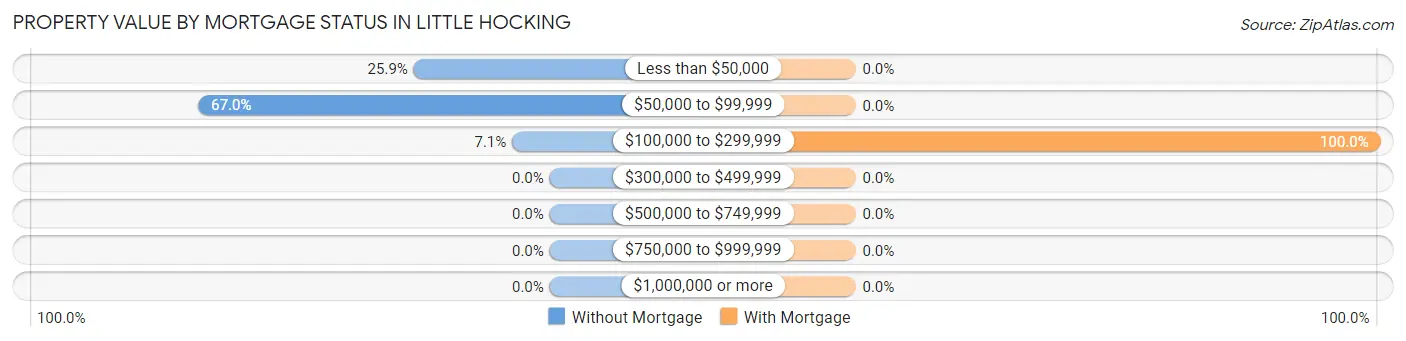
| Property Value | Without Mortgage | With Mortgage |
| Less than $50,000 | 29 (25.9%) | 0 (0.0%) |
| $50,000 to $99,999 | 75 (67.0%) | 0 (0.0%) |
| $100,000 to $299,999 | 8 (7.1%) | 26 (100.0%) |
| $300,000 to $499,999 | 0 (0.0%) | 0 (0.0%) |
| $500,000 to $749,999 | 0 (0.0%) | 0 (0.0%) |
| $750,000 to $999,999 | 0 (0.0%) | 0 (0.0%) |
| $1,000,000 or more | 0 (0.0%) | 0 (0.0%) |
| Total | 112 (100.0%) | 26 (100.0%) |
Household Income by Mortgage Status in Little Hocking
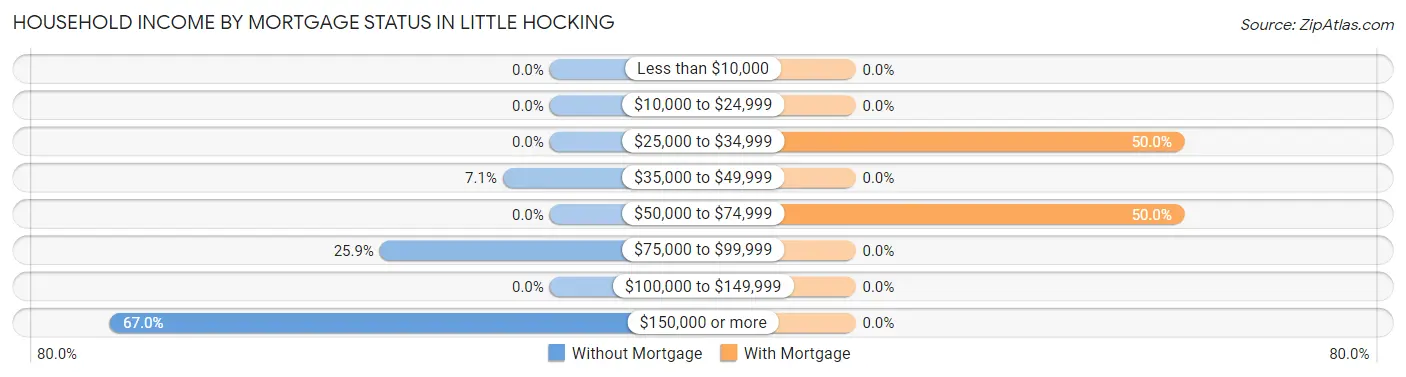
| Household Income | Without Mortgage | With Mortgage |
| Less than $10,000 | 0 (0.0%) | 0 (0.0%) |
| $10,000 to $24,999 | 0 (0.0%) | 0 (0.0%) |
| $25,000 to $34,999 | 0 (0.0%) | 13 (50.0%) |
| $35,000 to $49,999 | 8 (7.1%) | 0 (0.0%) |
| $50,000 to $74,999 | 0 (0.0%) | 13 (50.0%) |
| $75,000 to $99,999 | 29 (25.9%) | 0 (0.0%) |
| $100,000 to $149,999 | 0 (0.0%) | 0 (0.0%) |
| $150,000 or more | 75 (67.0%) | 0 (0.0%) |
| Total | 112 (100.0%) | 26 (100.0%) |
Property Value to Household Income Ratio in Little Hocking
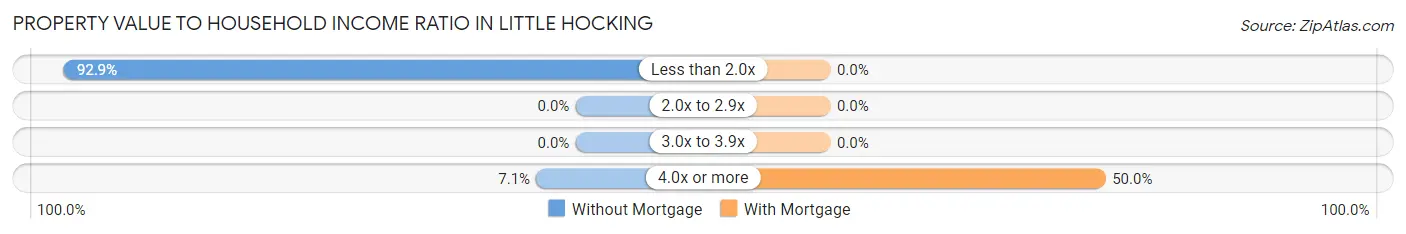
| Value-to-Income Ratio | Without Mortgage | With Mortgage |
| Less than 2.0x | 104 (92.9%) | 0 (0.0%) |
| 2.0x to 2.9x | 0 (0.0%) | 0 (0.0%) |
| 3.0x to 3.9x | 0 (0.0%) | 0 (0.0%) |
| 4.0x or more | 8 (7.1%) | 13 (50.0%) |
| Total | 112 (100.0%) | 26 (100.0%) |
Real Estate Taxes by Mortgage Status in Little Hocking
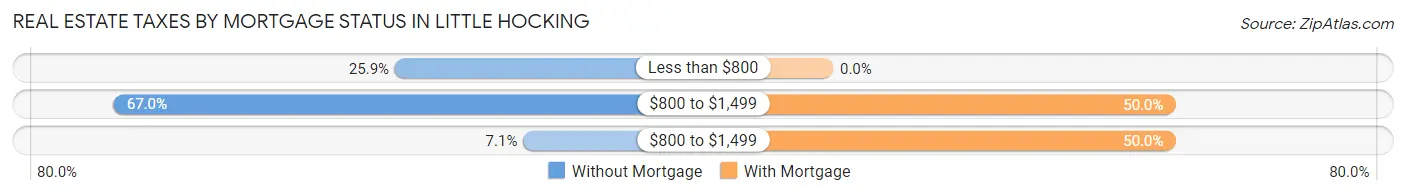
| Property Taxes | Without Mortgage | With Mortgage |
| Less than $800 | 29 (25.9%) | 0 (0.0%) |
| $800 to $1,499 | 75 (67.0%) | 13 (50.0%) |
| $800 to $1,499 | 8 (7.1%) | 13 (50.0%) |
| Total | 112 (100.0%) | 26 (100.0%) |
Health & Disability in Little Hocking
Health Insurance Coverage by Age in Little Hocking
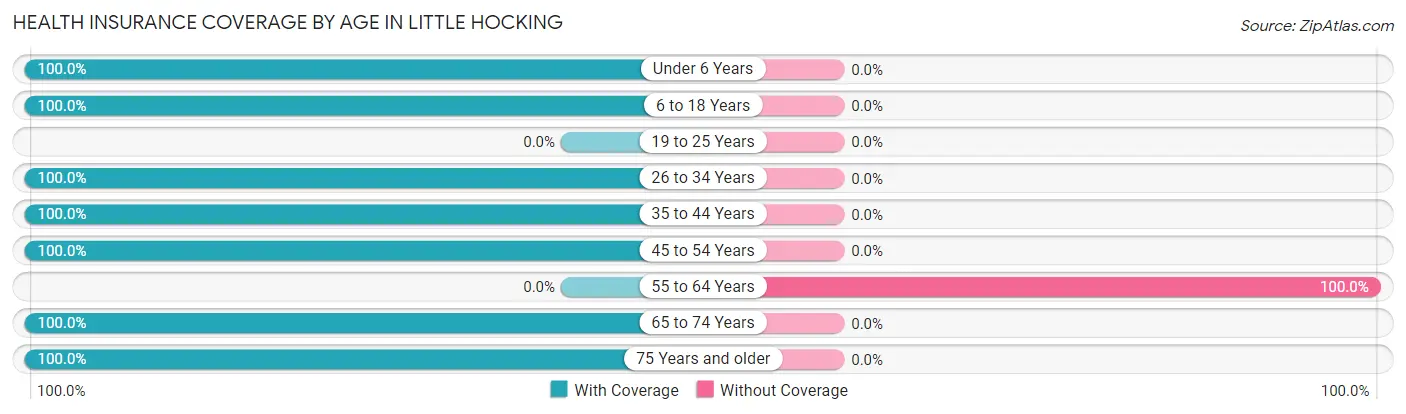
| Age Bracket | With Coverage | Without Coverage |
| Under 6 Years | 16 (100.0%) | 0 (0.0%) |
| 6 to 18 Years | 176 (100.0%) | 0 (0.0%) |
| 19 to 25 Years | 0 (0.0%) | 0 (0.0%) |
| 26 to 34 Years | 106 (100.0%) | 0 (0.0%) |
| 35 to 44 Years | 81 (100.0%) | 0 (0.0%) |
| 45 to 54 Years | 136 (100.0%) | 0 (0.0%) |
| 55 to 64 Years | 0 (0.0%) | 37 (100.0%) |
| 65 to 74 Years | 13 (100.0%) | 0 (0.0%) |
| 75 Years and older | 64 (100.0%) | 0 (0.0%) |
| Total | 592 (94.1%) | 37 (5.9%) |
Health Insurance Coverage by Citizenship Status in Little Hocking
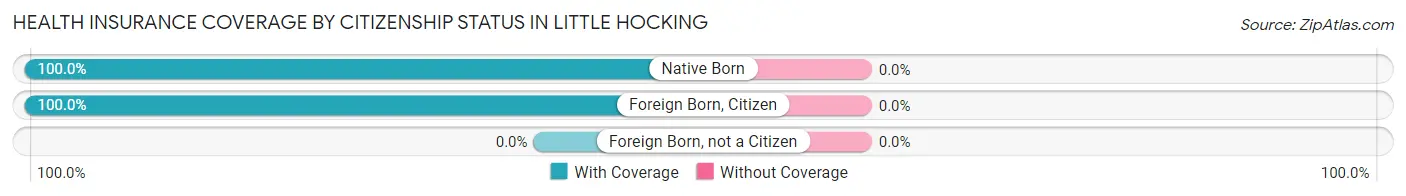
| Citizenship Status | With Coverage | Without Coverage |
| Native Born | 16 (100.0%) | 0 (0.0%) |
| Foreign Born, Citizen | 176 (100.0%) | 0 (0.0%) |
| Foreign Born, not a Citizen | 0 (0.0%) | 0 (0.0%) |
Health Insurance Coverage by Household Income in Little Hocking
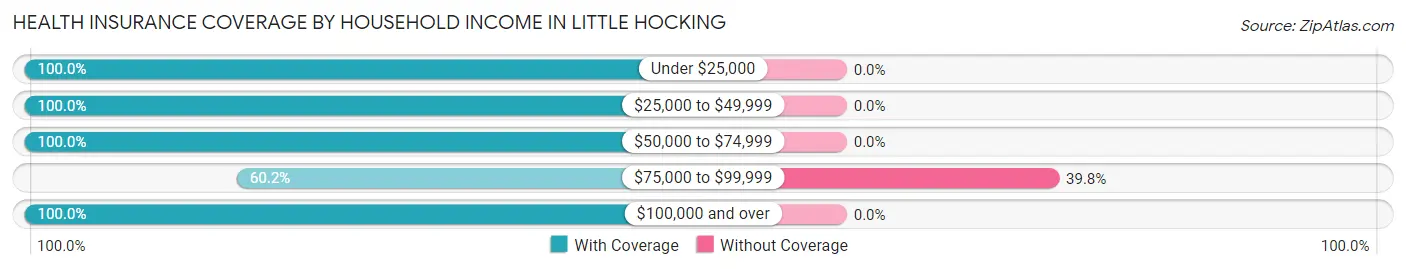
| Household Income | With Coverage | Without Coverage |
| Under $25,000 | 61 (100.0%) | 0 (0.0%) |
| $25,000 to $49,999 | 21 (100.0%) | 0 (0.0%) |
| $50,000 to $74,999 | 28 (100.0%) | 0 (0.0%) |
| $75,000 to $99,999 | 56 (60.2%) | 37 (39.8%) |
| $100,000 and over | 426 (100.0%) | 0 (0.0%) |
Public vs Private Health Insurance Coverage by Age in Little Hocking
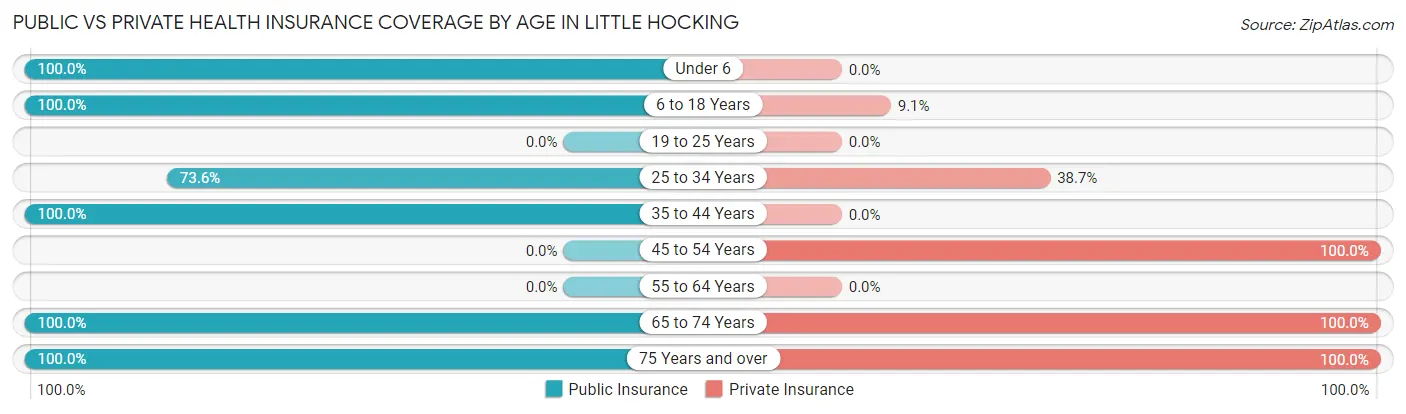
| Age Bracket | Public Insurance | Private Insurance |
| Under 6 | 16 (100.0%) | 0 (0.0%) |
| 6 to 18 Years | 176 (100.0%) | 16 (9.1%) |
| 19 to 25 Years | 0 (0.0%) | 0 (0.0%) |
| 25 to 34 Years | 78 (73.6%) | 41 (38.7%) |
| 35 to 44 Years | 81 (100.0%) | 0 (0.0%) |
| 45 to 54 Years | 0 (0.0%) | 136 (100.0%) |
| 55 to 64 Years | 0 (0.0%) | 0 (0.0%) |
| 65 to 74 Years | 13 (100.0%) | 13 (100.0%) |
| 75 Years and over | 64 (100.0%) | 64 (100.0%) |
| Total | 428 (68.0%) | 270 (42.9%) |
Disability Status by Sex by Age in Little Hocking
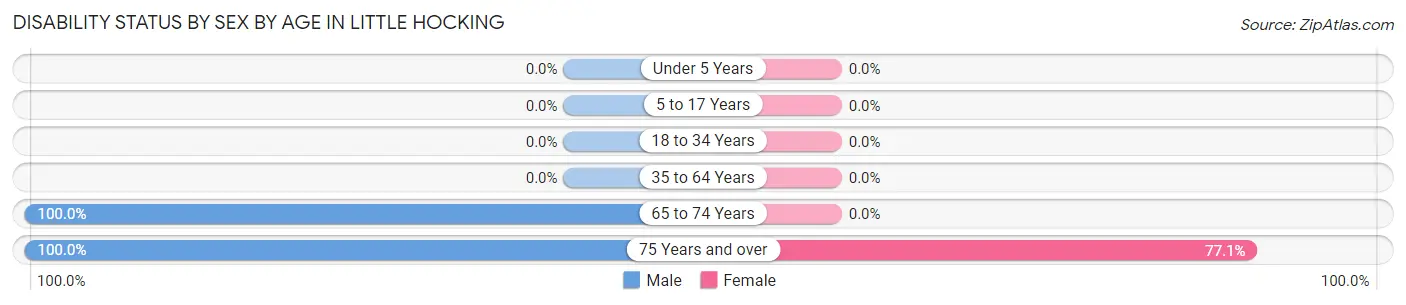
| Age Bracket | Male | Female |
| Under 5 Years | 0 (0.0%) | 0 (0.0%) |
| 5 to 17 Years | 0 (0.0%) | 0 (0.0%) |
| 18 to 34 Years | 0 (0.0%) | 0 (0.0%) |
| 35 to 64 Years | 0 (0.0%) | 0 (0.0%) |
| 65 to 74 Years | 13 (100.0%) | 0 (0.0%) |
| 75 Years and over | 29 (100.0%) | 27 (77.1%) |
Disability Class by Sex by Age in Little Hocking
Disability Class: Hearing Difficulty
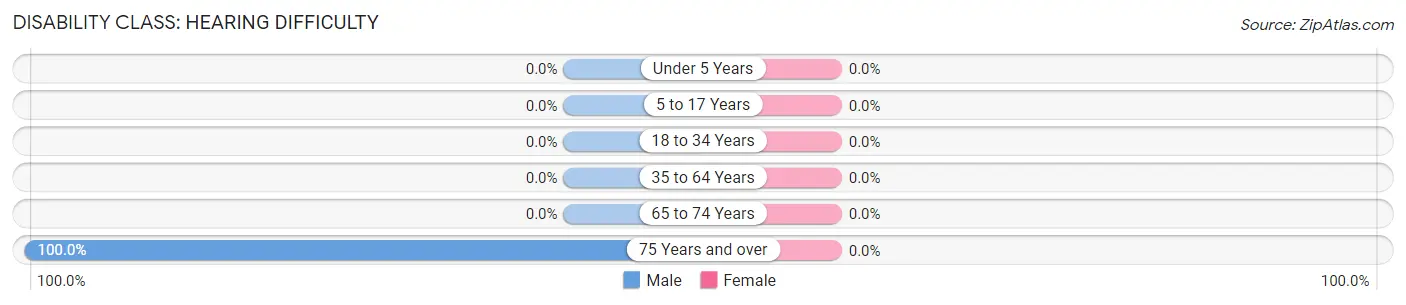
| Age Bracket | Male | Female |
| Under 5 Years | 0 (0.0%) | 0 (0.0%) |
| 5 to 17 Years | 0 (0.0%) | 0 (0.0%) |
| 18 to 34 Years | 0 (0.0%) | 0 (0.0%) |
| 35 to 64 Years | 0 (0.0%) | 0 (0.0%) |
| 65 to 74 Years | 0 (0.0%) | 0 (0.0%) |
| 75 Years and over | 29 (100.0%) | 0 (0.0%) |
Disability Class: Vision Difficulty
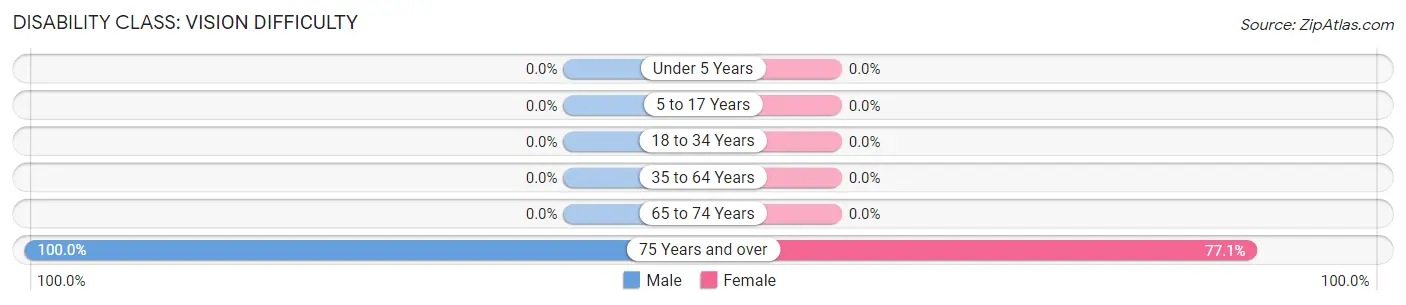
| Age Bracket | Male | Female |
| Under 5 Years | 0 (0.0%) | 0 (0.0%) |
| 5 to 17 Years | 0 (0.0%) | 0 (0.0%) |
| 18 to 34 Years | 0 (0.0%) | 0 (0.0%) |
| 35 to 64 Years | 0 (0.0%) | 0 (0.0%) |
| 65 to 74 Years | 0 (0.0%) | 0 (0.0%) |
| 75 Years and over | 29 (100.0%) | 27 (77.1%) |
Disability Class: Cognitive Difficulty
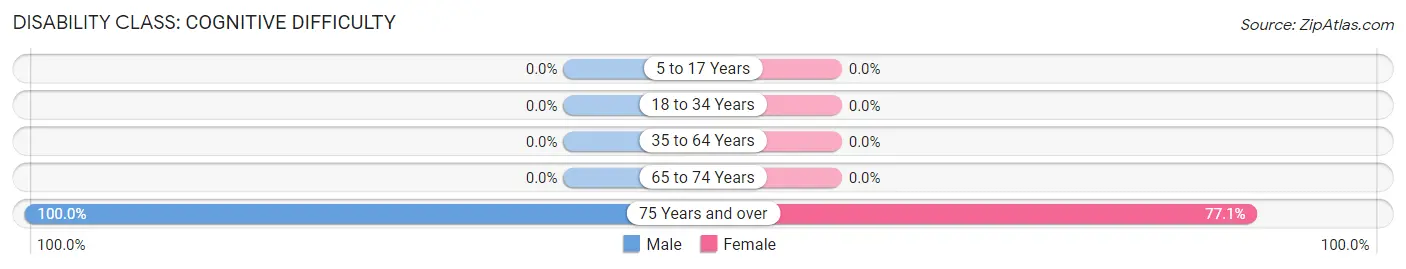
| Age Bracket | Male | Female |
| 5 to 17 Years | 0 (0.0%) | 0 (0.0%) |
| 18 to 34 Years | 0 (0.0%) | 0 (0.0%) |
| 35 to 64 Years | 0 (0.0%) | 0 (0.0%) |
| 65 to 74 Years | 0 (0.0%) | 0 (0.0%) |
| 75 Years and over | 29 (100.0%) | 27 (77.1%) |
Disability Class: Ambulatory Difficulty
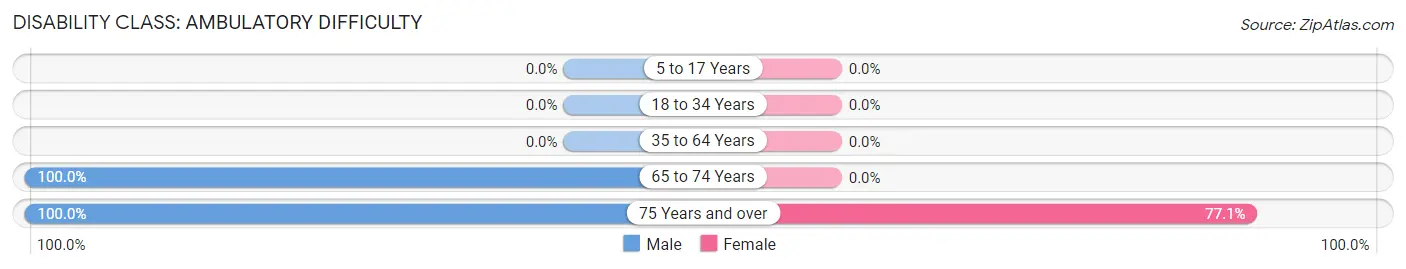
| Age Bracket | Male | Female |
| 5 to 17 Years | 0 (0.0%) | 0 (0.0%) |
| 18 to 34 Years | 0 (0.0%) | 0 (0.0%) |
| 35 to 64 Years | 0 (0.0%) | 0 (0.0%) |
| 65 to 74 Years | 13 (100.0%) | 0 (0.0%) |
| 75 Years and over | 29 (100.0%) | 27 (77.1%) |
Disability Class: Self-Care Difficulty
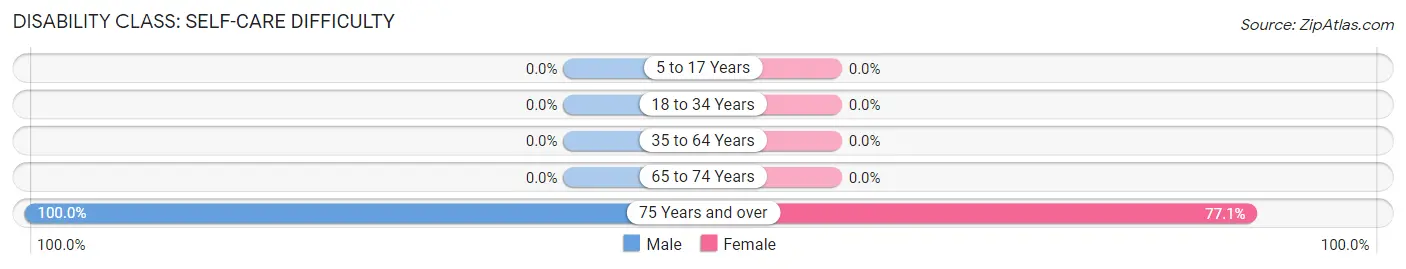
| Age Bracket | Male | Female |
| 5 to 17 Years | 0 (0.0%) | 0 (0.0%) |
| 18 to 34 Years | 0 (0.0%) | 0 (0.0%) |
| 35 to 64 Years | 0 (0.0%) | 0 (0.0%) |
| 65 to 74 Years | 0 (0.0%) | 0 (0.0%) |
| 75 Years and over | 29 (100.0%) | 27 (77.1%) |
Technology Access in Little Hocking
Computing Device Access in Little Hocking
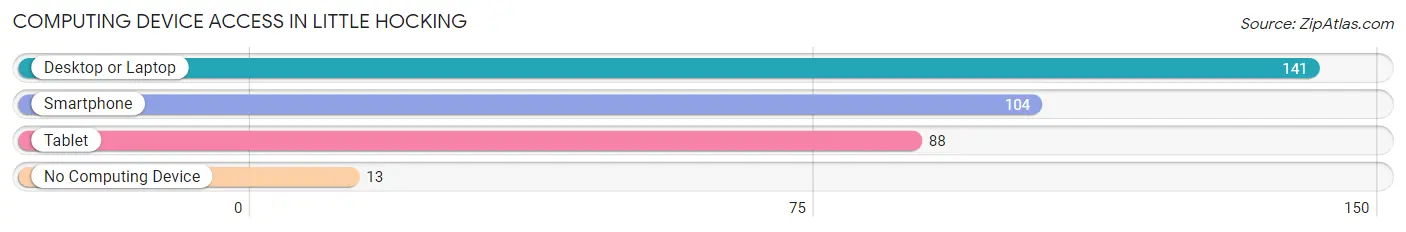
| Device Type | # Households | % Households |
| Desktop or Laptop | 141 | 91.6% |
| Smartphone | 104 | 67.5% |
| Tablet | 88 | 57.1% |
| No Computing Device | 13 | 8.4% |
| Total | 154 | 100.0% |
Internet Access in Little Hocking
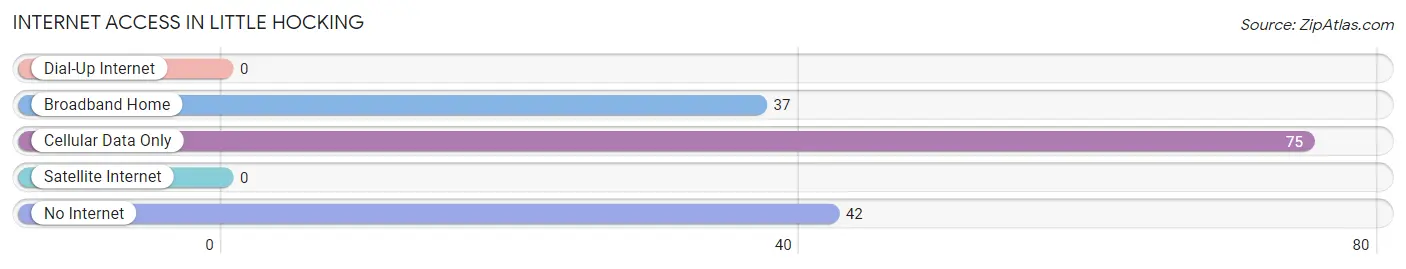
| Internet Type | # Households | % Households |
| Dial-Up Internet | 0 | 0.0% |
| Broadband Home | 37 | 24.0% |
| Cellular Data Only | 75 | 48.7% |
| Satellite Internet | 0 | 0.0% |
| No Internet | 42 | 27.3% |
| Total | 154 | 100.0% |
Little Hocking Summary
Little Hocking is a small unincorporated community located in Washington County, Ohio, United States. It is situated along the Ohio River, approximately 10 miles south of Marietta. The population of Little Hocking was estimated to be 1,845 in 2019.
History
Little Hocking was first settled in 1790 by a group of settlers from Pennsylvania. The town was originally known as "Hocking's Bottom" due to its location at the bottom of a hill. The name was later changed to "Little Hocking" to distinguish it from the nearby town of Hockingport.
The town was officially incorporated in 1819 and was home to a variety of businesses, including a grist mill, a saw mill, a tannery, and a blacksmith shop. The town also had a post office, a school, and a church.
In the late 19th century, the town was home to a number of coal mines, which provided employment for many of the town's residents. The coal mines were eventually closed in the early 20th century, and the town's economy shifted to agriculture and tourism.
Geography
Little Hocking is located in southeastern Ohio, approximately 10 miles south of Marietta. The town is situated along the Ohio River, and is bordered by the towns of Hockingport to the north, and Belpre to the south.
The town has a total area of 1.3 square miles, all of which is land. The terrain is mostly flat, with some rolling hills. The climate is humid continental, with hot summers and cold winters.
Economy
The economy of Little Hocking is largely based on agriculture and tourism. The town is home to a number of farms, which produce a variety of crops, including corn, soybeans, and hay. The town is also home to a number of tourist attractions, including the Little Hocking Riverboat, which offers scenic cruises along the Ohio River.
The town is also home to a number of small businesses, including restaurants, convenience stores, and gas stations. The town is also home to a number of manufacturing companies, which produce a variety of products, including furniture, clothing, and automotive parts.
Demographics
As of the 2010 census, the population of Little Hocking was 1,845. The racial makeup of the town was 97.3% White, 0.7% African American, 0.2% Native American, 0.2% Asian, 0.1% from other races, and 1.5% from two or more races. Hispanic or Latino of any race were 0.7% of the population.
The median household income in Little Hocking was $37,917, and the median family income was $45,625. The per capita income was $19,945. About 11.3% of families and 14.2% of the population were below the poverty line, including 19.2% of those under age 18 and 8.3% of those age 65 or over.
Common Questions
What is the Total Population of Little Hocking?
Total Population of Little Hocking is 629.
What is the Total Male Population of Little Hocking?
Total Male Population of Little Hocking is 248.
What is the Total Female Population of Little Hocking?
Total Female Population of Little Hocking is 381.
What is the Ratio of Males per 100 Females in Little Hocking?
There are 65.09 Males per 100 Females in Little Hocking.
What is the Ratio of Females per 100 Males in Little Hocking?
There are 153.63 Females per 100 Males in Little Hocking.
What is the Median Population Age in Little Hocking?
Median Population Age in Little Hocking is 43.2 Years.
What is the Average Family Size in Little Hocking
Average Family Size in Little Hocking is 4.0 People.
What is the Average Household Size in Little Hocking
Average Household Size in Little Hocking is 4.1 People.
What is Per Capita Income in Little Hocking?
Per Capita income in Little Hocking is $26,130.
What is the Median Family Income in Little Hocking?
Median Family Income in Little Hocking is $145,283.
What is Income or Wage Gap in Little Hocking?
Income or Wage Gap in Little Hocking is 6.7%.
Women in Little Hocking earn 93.3 cents for every dollar earned by a man.
What is Inequality or Gini Index in Little Hocking?
Inequality or Gini Index in Little Hocking is 0.29.
How Large is the Labor Force in Little Hocking?
There are 323 People in the Labor Forcein in Little Hocking.
What is the Percentage of People in the Labor Force in Little Hocking?
73.9% of People are in the Labor Force in Little Hocking.
What is the Unemployment Rate in Little Hocking?
Unemployment Rate in Little Hocking is 5.0%.