Kanauga, OH
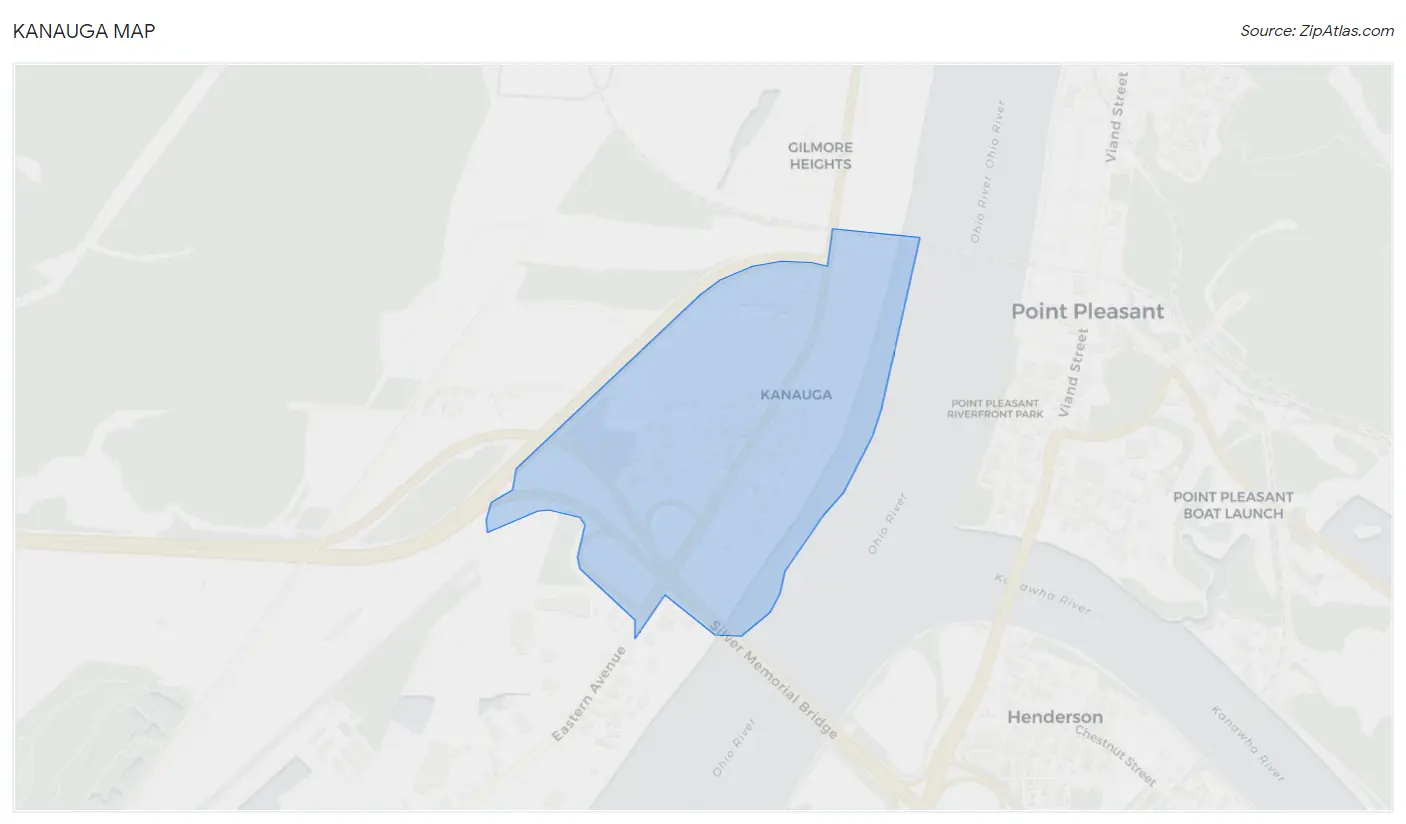
Kanauga Map
Kanauga Overview
277
TOTAL POPULATION
166
MALE POPULATION
111
FEMALE POPULATION
149.55
MALES / 100 FEMALES
66.87
FEMALES / 100 MALES
36.7
MEDIAN AGE
4.3
AVG FAMILY SIZE
3.4
AVG HOUSEHOLD SIZE
$19,389
PER CAPITA INCOME
$65,417
AVG FAMILY INCOME
$62,250
AVG HOUSEHOLD INCOME
0.19
INEQUALITY / GINI INDEX
142
LABOR FORCE [ PEOPLE ]
59.9%
PERCENT IN LABOR FORCE
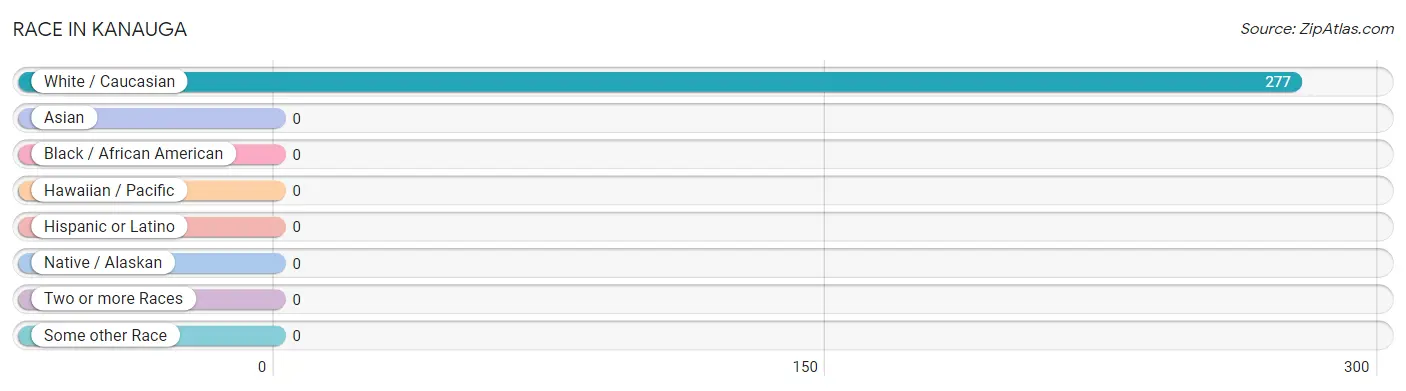
Race in Kanauga
The most populous races in Kanauga are , and White / Caucasian (277 | 100.0%).
| Race | # Population | % Population |
| Asian | 0 | 0.0% |
| Black / African American | 0 | 0.0% |
| Hawaiian / Pacific | 0 | 0.0% |
| Hispanic or Latino | 0 | 0.0% |
| Native / Alaskan | 0 | 0.0% |
| White / Caucasian | 277 | 100.0% |
| Two or more Races | 0 | 0.0% |
| Some other Race | 0 | 0.0% |
| Total | 277 | 100.0% |
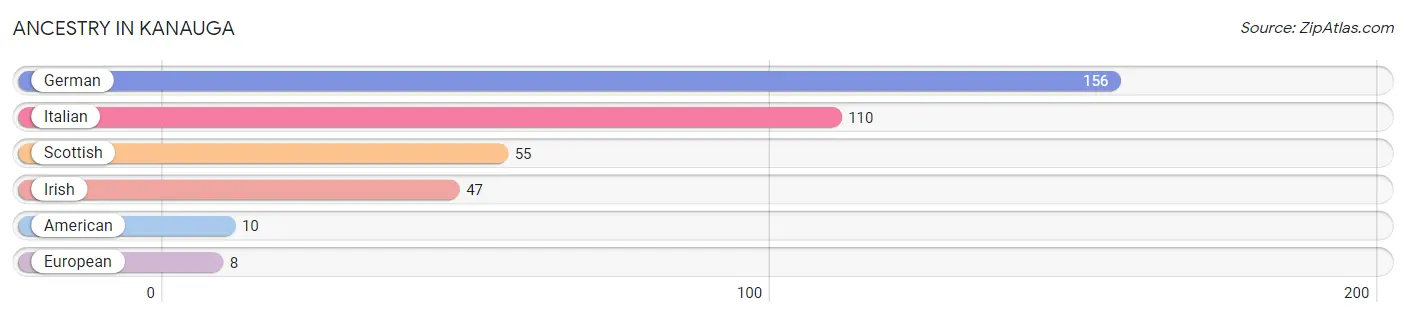
Ancestry in Kanauga
The most populous ancestries reported in Kanauga are German (156 | 56.3%), Italian (110 | 39.7%), Scottish (55 | 19.9%), Irish (47 | 17.0%), and American (10 | 3.6%), together accounting for 136.5% of all Kanauga residents.
| Ancestry | # Population | % Population |
| American | 10 | 3.6% |
| European | 8 | 2.9% |
| German | 156 | 56.3% |
| Irish | 47 | 17.0% |
| Italian | 110 | 39.7% |
| Scottish | 55 | 19.9% | View All 6 Rows |
Immigrants in Kanauga

| Immigration Origin | # Population | % Population | View All 0 Rows |
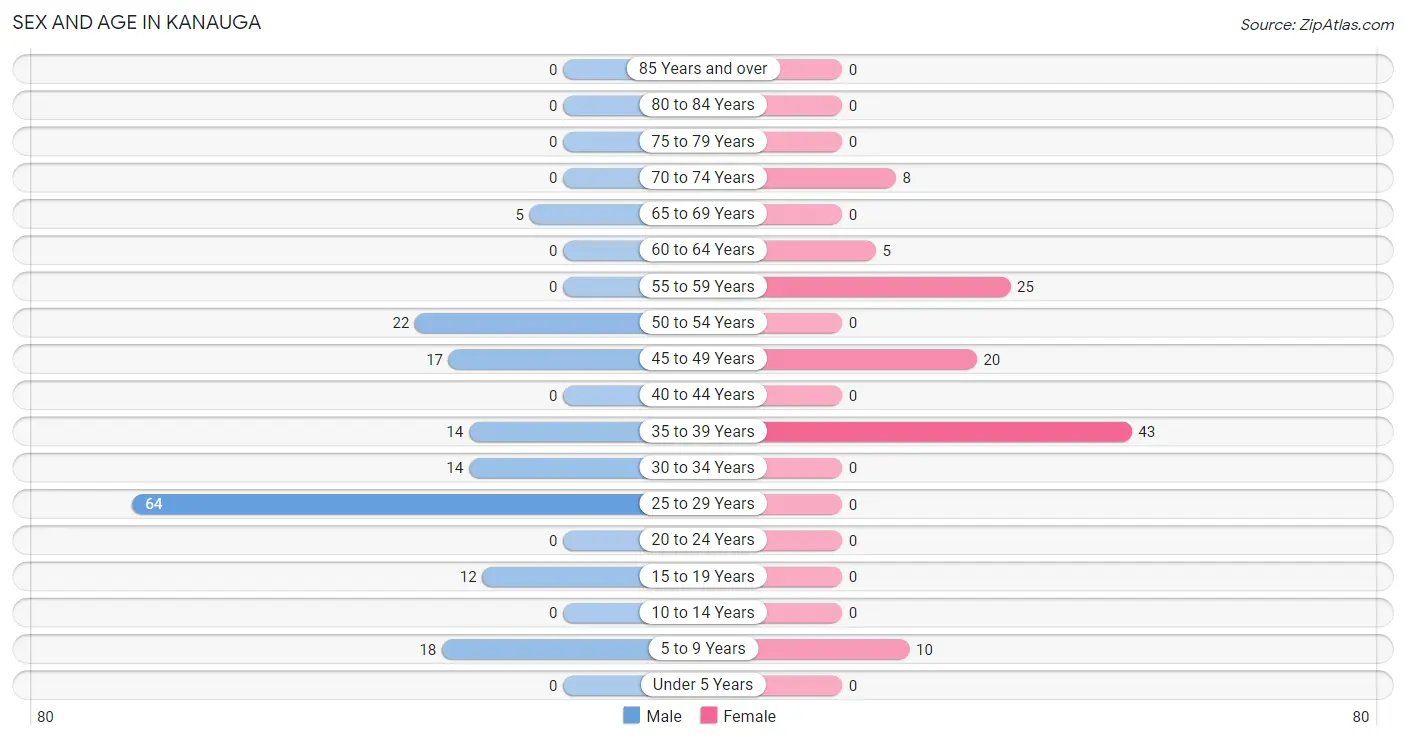
Sex and Age in Kanauga
Sex and Age in Kanauga
The most populous age groups in Kanauga are 25 to 29 Years (64 | 38.6%) for men and 35 to 39 Years (43 | 38.7%) for women.
| Age Bracket | Male | Female |
| Under 5 Years | 0 (0.0%) | 0 (0.0%) |
| 5 to 9 Years | 18 (10.8%) | 10 (9.0%) |
| 10 to 14 Years | 0 (0.0%) | 0 (0.0%) |
| 15 to 19 Years | 12 (7.2%) | 0 (0.0%) |
| 20 to 24 Years | 0 (0.0%) | 0 (0.0%) |
| 25 to 29 Years | 64 (38.6%) | 0 (0.0%) |
| 30 to 34 Years | 14 (8.4%) | 0 (0.0%) |
| 35 to 39 Years | 14 (8.4%) | 43 (38.7%) |
| 40 to 44 Years | 0 (0.0%) | 0 (0.0%) |
| 45 to 49 Years | 17 (10.2%) | 20 (18.0%) |
| 50 to 54 Years | 22 (13.3%) | 0 (0.0%) |
| 55 to 59 Years | 0 (0.0%) | 25 (22.5%) |
| 60 to 64 Years | 0 (0.0%) | 5 (4.5%) |
| 65 to 69 Years | 5 (3.0%) | 0 (0.0%) |
| 70 to 74 Years | 0 (0.0%) | 8 (7.2%) |
| 75 to 79 Years | 0 (0.0%) | 0 (0.0%) |
| 80 to 84 Years | 0 (0.0%) | 0 (0.0%) |
| 85 Years and over | 0 (0.0%) | 0 (0.0%) |
| Total | 166 (100.0%) | 111 (100.0%) |
Families and Households in Kanauga
Median Family Size in Kanauga
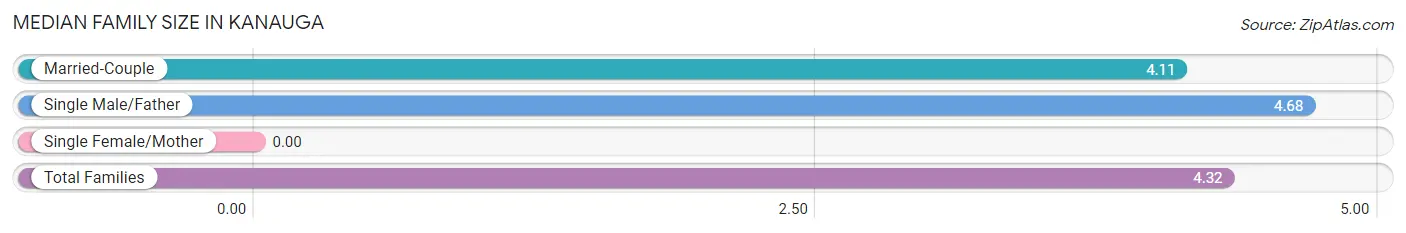
| Family Type | # Families | Family Size |
| Married-Couple | 37 (62.7%) | 4.11 |
| Single Male/Father | 22 (37.3%) | 4.68 |
| Single Female/Mother | 0 (0.0%) | - |
| Total Families | 59 (100.0%) | 4.32 |
Median Household Size in Kanauga
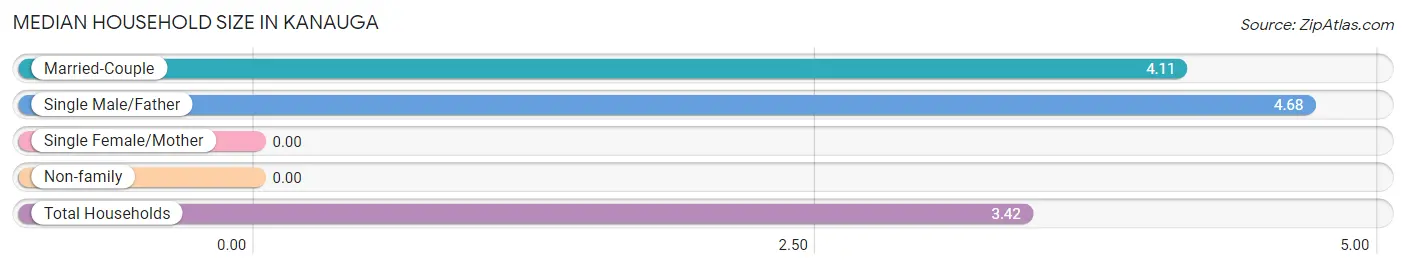
| Household Type | # Households | Household Size |
| Married-Couple | 37 (45.7%) | 4.11 |
| Single Male/Father | 22 (27.2%) | 4.68 |
| Single Female/Mother | 0 (0.0%) | - |
| Non-family | 22 (27.2%) | - |
| Total Households | 81 (100.0%) | 3.42 |
Household Size by Marriage Status in Kanauga
Out of a total of 81 households in Kanauga, 59 (72.8%) are family households, while 22 (27.2%) are nonfamily households. The most numerous type of family households are 4-person households, comprising 22, and the most common type of nonfamily households are 1-person households, comprising 22.
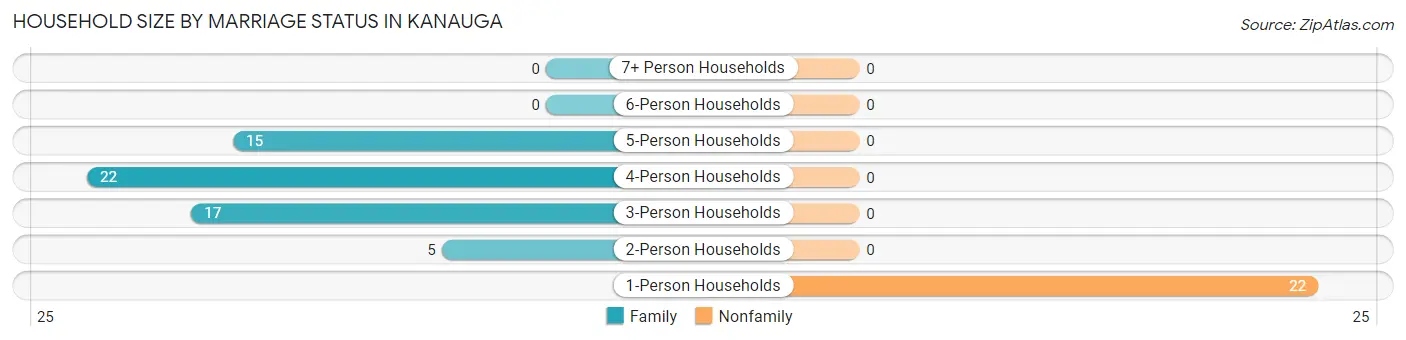
| Household Size | Family Households | Nonfamily Households |
| 1-Person Households | - | 22 (27.2%) |
| 2-Person Households | 5 (6.2%) | 0 (0.0%) |
| 3-Person Households | 17 (21.0%) | 0 (0.0%) |
| 4-Person Households | 22 (27.2%) | 0 (0.0%) |
| 5-Person Households | 15 (18.5%) | 0 (0.0%) |
| 6-Person Households | 0 (0.0%) | 0 (0.0%) |
| 7+ Person Households | 0 (0.0%) | 0 (0.0%) |
| Total | 59 (72.8%) | 22 (27.2%) |
Female Fertility in Kanauga
Fertility by Age in Kanauga
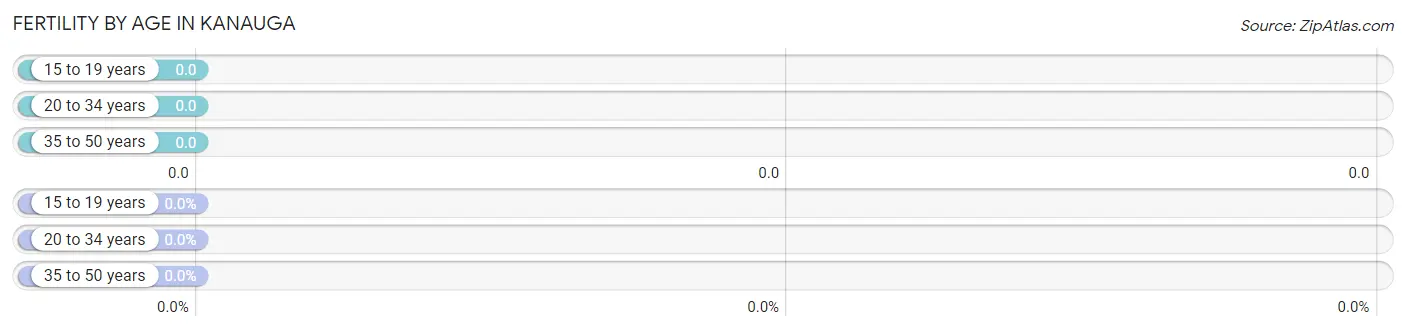
| Age Bracket | Women with Births | Births / 1,000 Women |
| 15 to 19 years | 0 (0.0%) | 0.0 |
| 20 to 34 years | 0 (0.0%) | 0.0 |
| 35 to 50 years | 0 (0.0%) | 0.0 |
| Total | 0 (0.0%) | 0.0 |
Fertility by Age by Marriage Status in Kanauga
| Age Bracket | Married | Unmarried |
| 15 to 19 years | 0 (0.0%) | 0 (0.0%) |
| 20 to 34 years | 0 (0.0%) | 0 (0.0%) |
| 35 to 50 years | 0 (0.0%) | 0 (0.0%) |
| Total | 0 (0.0%) | 0 (0.0%) |
Fertility by Education in Kanauga
| Educational Attainment | Women with Births | Births / 1,000 Women |
| Less than High School | 0 (0.0%) | 0.0 |
| High School Diploma | 0 (0.0%) | 0.0 |
| College or Associate's Degree | 0 (0.0%) | 0.0 |
| Bachelor's Degree | 0 (0.0%) | 0.0 |
| Graduate Degree | 0 (0.0%) | 0.0 |
| Total | 0 (0.0%) | 0.0 |
Fertility by Education by Marriage Status in Kanauga
| Educational Attainment | Married | Unmarried |
| Less than High School | 0 (0.0%) | 0 (0.0%) |
| High School Diploma | 0 (0.0%) | 0 (0.0%) |
| College or Associate's Degree | 0 (0.0%) | 0 (0.0%) |
| Bachelor's Degree | 0 (0.0%) | 0 (0.0%) |
| Graduate Degree | 0 (0.0%) | 0 (0.0%) |
| Total | 0 (0.0%) | 0 (0.0%) |
Income in Kanauga
Income Overview in Kanauga
Per Capita Income in Kanauga is $19,389, while median incomes of families and households are $65,417 and $62,250 respectively.
| Characteristic | Number | Measure |
| Per Capita Income | 277 | $19,389 |
| Median Family Income | 59 | $65,417 |
| Mean Family Income | 59 | $69,258 |
| Median Household Income | 81 | $62,250 |
| Mean Household Income | 81 | $61,111 |
| Income Deficit | 59 | $0 |
| Wage / Income Gap (%) | 277 | 0.00% |
| Wage / Income Gap ($) | 277 | 100.00¢ per $1 |
| Gini / Inequality Index | 277 | 0.19 |
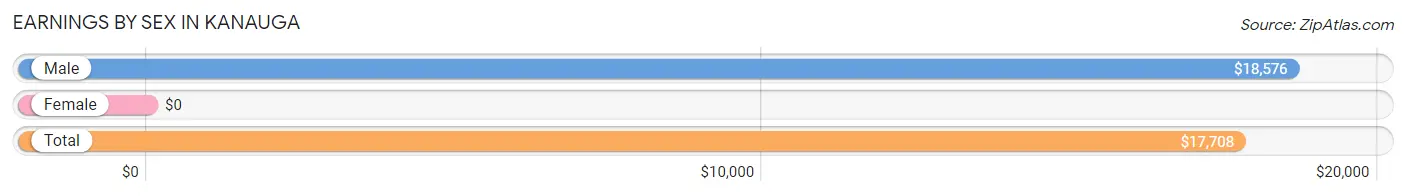
Earnings by Sex in Kanauga
| Sex | Number | Average Earnings |
| Male | 131 (84.0%) | $18,576 |
| Female | 25 (16.0%) | $0 |
| Total | 156 (100.0%) | $17,708 |
Earnings by Sex by Income Bracket in Kanauga
The most common earnings brackets in Kanauga are $17,500 to $19,999 for men (36 | 27.5%) and $10,000 to $12,499 for women (25 | 100.0%).
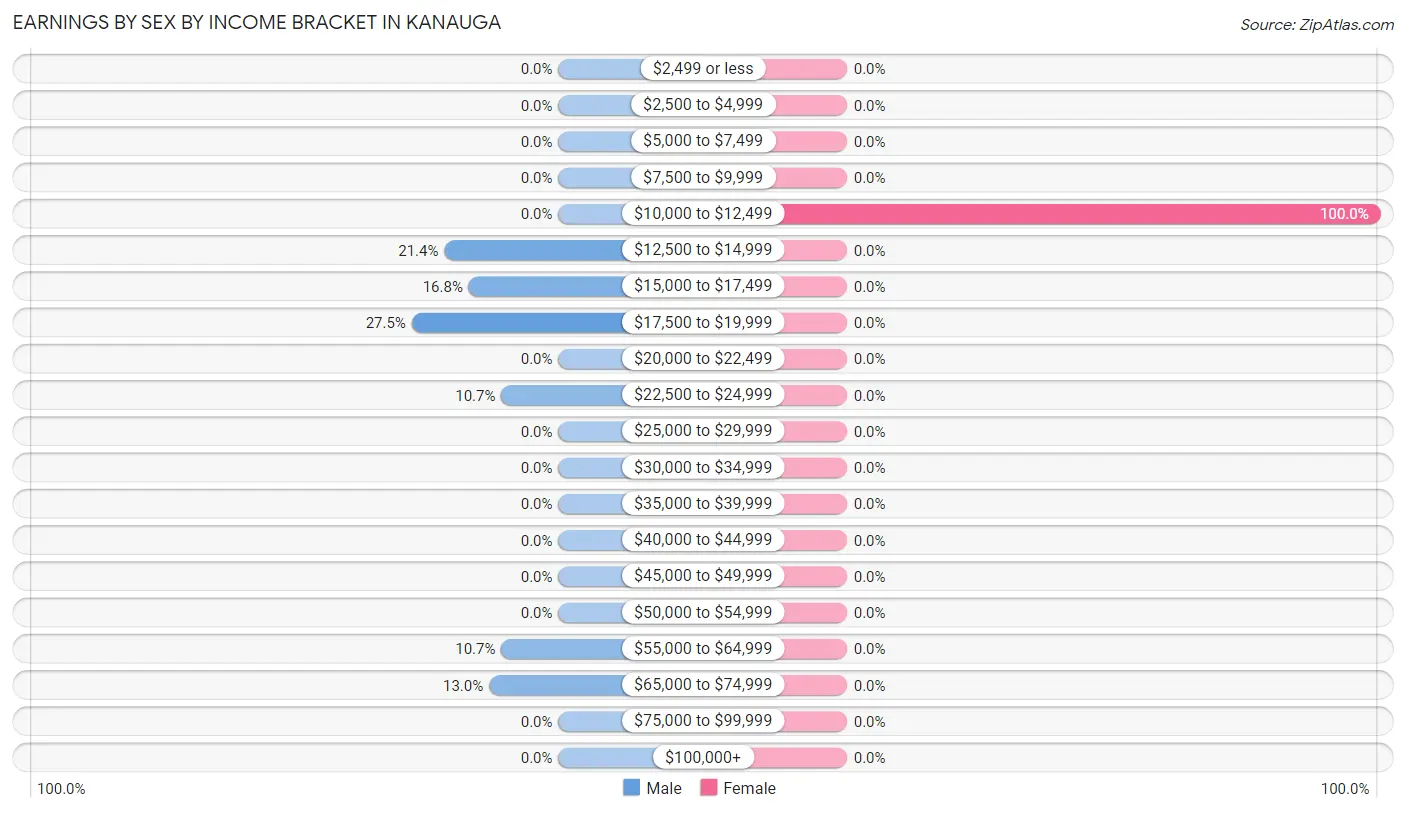
| Income | Male | Female |
| $2,499 or less | 0 (0.0%) | 0 (0.0%) |
| $2,500 to $4,999 | 0 (0.0%) | 0 (0.0%) |
| $5,000 to $7,499 | 0 (0.0%) | 0 (0.0%) |
| $7,500 to $9,999 | 0 (0.0%) | 0 (0.0%) |
| $10,000 to $12,499 | 0 (0.0%) | 25 (100.0%) |
| $12,500 to $14,999 | 28 (21.4%) | 0 (0.0%) |
| $15,000 to $17,499 | 22 (16.8%) | 0 (0.0%) |
| $17,500 to $19,999 | 36 (27.5%) | 0 (0.0%) |
| $20,000 to $22,499 | 0 (0.0%) | 0 (0.0%) |
| $22,500 to $24,999 | 14 (10.7%) | 0 (0.0%) |
| $25,000 to $29,999 | 0 (0.0%) | 0 (0.0%) |
| $30,000 to $34,999 | 0 (0.0%) | 0 (0.0%) |
| $35,000 to $39,999 | 0 (0.0%) | 0 (0.0%) |
| $40,000 to $44,999 | 0 (0.0%) | 0 (0.0%) |
| $45,000 to $49,999 | 0 (0.0%) | 0 (0.0%) |
| $50,000 to $54,999 | 0 (0.0%) | 0 (0.0%) |
| $55,000 to $64,999 | 14 (10.7%) | 0 (0.0%) |
| $65,000 to $74,999 | 17 (13.0%) | 0 (0.0%) |
| $75,000 to $99,999 | 0 (0.0%) | 0 (0.0%) |
| $100,000+ | 0 (0.0%) | 0 (0.0%) |
| Total | 131 (100.0%) | 25 (100.0%) |
Earnings by Sex by Educational Attainment in Kanauga
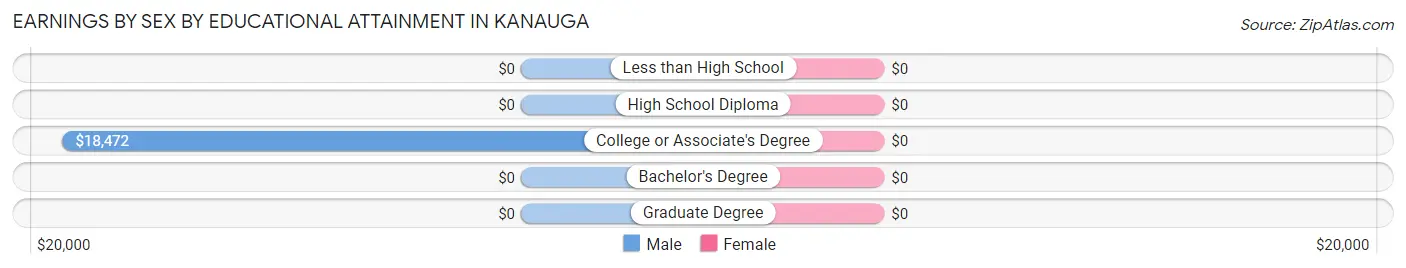
| Educational Attainment | Male Income | Female Income |
| Less than High School | - | - |
| High School Diploma | - | - |
| College or Associate's Degree | $18,472 | $0 |
| Bachelor's Degree | - | - |
| Graduate Degree | - | - |
| Total | $18,576 | $0 |
Family Income in Kanauga
Family Income Brackets in Kanauga
According to the Kanauga family income data, there are 42 families falling into the $50,000 to $74,999 income range, which is the most common income bracket and makes up 71.2% of all families.
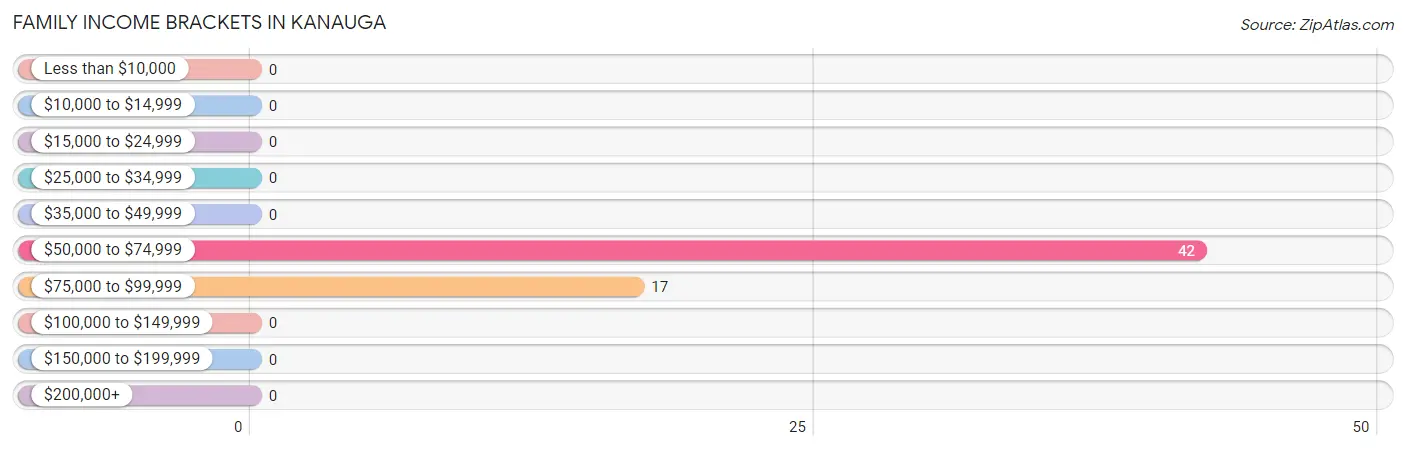
| Income Bracket | # Families | % Families |
| Less than $10,000 | 0 | 0.0% |
| $10,000 to $14,999 | 0 | 0.0% |
| $15,000 to $24,999 | 0 | 0.0% |
| $25,000 to $34,999 | 0 | 0.0% |
| $35,000 to $49,999 | 0 | 0.0% |
| $50,000 to $74,999 | 42 | 71.2% |
| $75,000 to $99,999 | 17 | 28.8% |
| $100,000 to $149,999 | 0 | 0.0% |
| $150,000 to $199,999 | 0 | 0.0% |
| $200,000+ | 0 | 0.0% |
Family Income by Famaliy Size in Kanauga
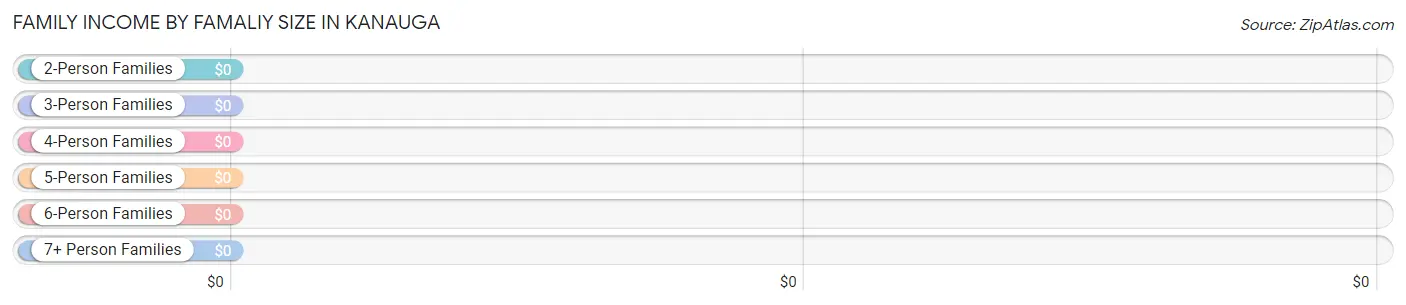
| Income Bracket | # Families | Median Income |
| 2-Person Families | 5 (8.5%) | $0 |
| 3-Person Families | 17 (28.8%) | $0 |
| 4-Person Families | 22 (37.3%) | $0 |
| 5-Person Families | 15 (25.4%) | $0 |
| 6-Person Families | 0 (0.0%) | $0 |
| 7+ Person Families | 0 (0.0%) | $0 |
| Total | 59 (100.0%) | $65,417 |
Family Income by Number of Earners in Kanauga
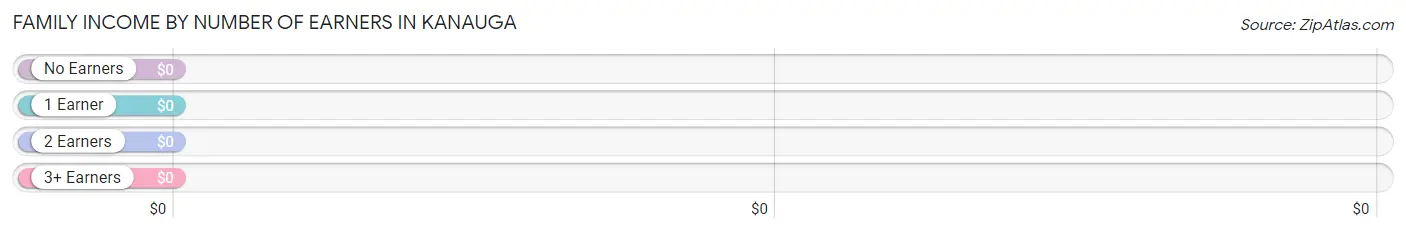
| Number of Earners | # Families | Median Income |
| No Earners | 5 (8.5%) | $0 |
| 1 Earner | 15 (25.4%) | $0 |
| 2 Earners | 17 (28.8%) | $0 |
| 3+ Earners | 22 (37.3%) | $0 |
| Total | 59 (100.0%) | $65,417 |
Household Income in Kanauga
Household Income Brackets in Kanauga
With 50 households falling in the category, the $50,000 to $74,999 income range is the most frequent in Kanauga, accounting for 61.7% of all households.
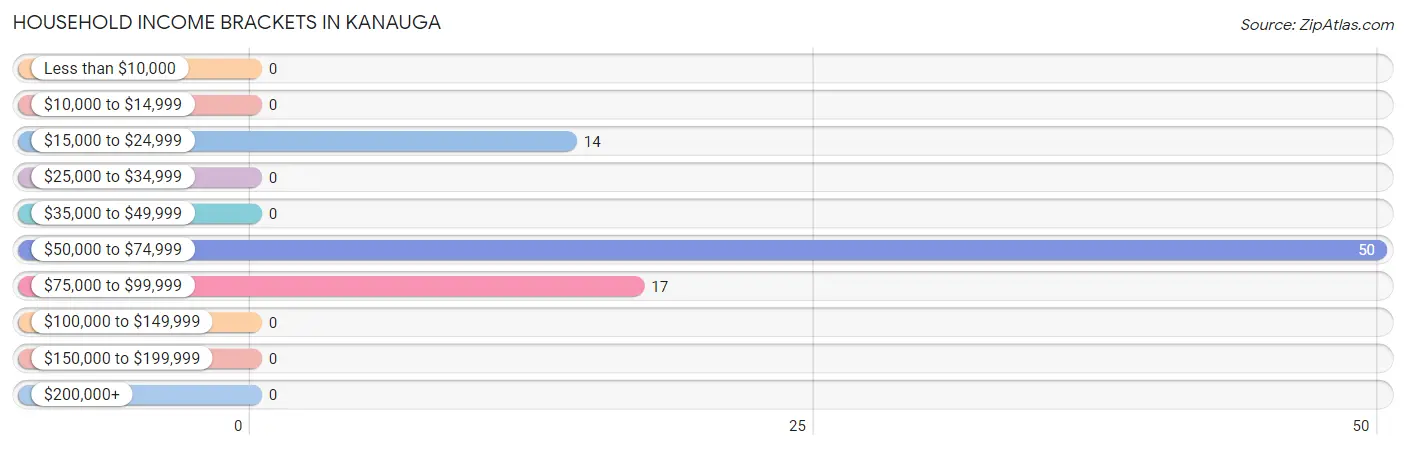
| Income Bracket | # Households | % Households |
| Less than $10,000 | 0 | 0.0% |
| $10,000 to $14,999 | 0 | 0.0% |
| $15,000 to $24,999 | 14 | 17.3% |
| $25,000 to $34,999 | 0 | 0.0% |
| $35,000 to $49,999 | 0 | 0.0% |
| $50,000 to $74,999 | 50 | 61.7% |
| $75,000 to $99,999 | 17 | 21.0% |
| $100,000 to $149,999 | 0 | 0.0% |
| $150,000 to $199,999 | 0 | 0.0% |
| $200,000+ | 0 | 0.0% |
Household Income by Householder Age in Kanauga
| Income Bracket | # Households | Median Income |
| 15 to 24 Years | 0 (0.0%) | $0 |
| 25 to 44 Years | 29 (35.8%) | $0 |
| 45 to 64 Years | 44 (54.3%) | $0 |
| 65+ Years | 8 (9.9%) | $0 |
| Total | 81 (100.0%) | $62,250 |
Poverty in Kanauga
Income Below Poverty by Sex and Age in Kanauga
| Age Bracket | Male | Female |
| Under 5 Years | 0 (0.0%) | 0 (0.0%) |
| 5 Years | 0 (0.0%) | 0 (0.0%) |
| 6 to 11 Years | 0 (0.0%) | 0 (0.0%) |
| 12 to 14 Years | 0 (0.0%) | 0 (0.0%) |
| 15 Years | 0 (0.0%) | 0 (0.0%) |
| 16 and 17 Years | 0 (0.0%) | 0 (0.0%) |
| 18 to 24 Years | 0 (0.0%) | 0 (0.0%) |
| 25 to 34 Years | 0 (0.0%) | 0 (0.0%) |
| 35 to 44 Years | 0 (0.0%) | 0 (0.0%) |
| 45 to 54 Years | 0 (0.0%) | 0 (0.0%) |
| 55 to 64 Years | 0 (0.0%) | 0 (0.0%) |
| 65 to 74 Years | 0 (0.0%) | 0 (0.0%) |
| 75 Years and over | 0 (0.0%) | 0 (0.0%) |
| Total | 0 (0.0%) | 0 (0.0%) |
Income Above Poverty by Sex and Age in Kanauga
According to the poverty statistics in Kanauga, males aged 6 to 11 years and females aged 5 years are the age groups that are most secure financially, with 100.0% of males and 100.0% of females in these age groups living above the poverty line.
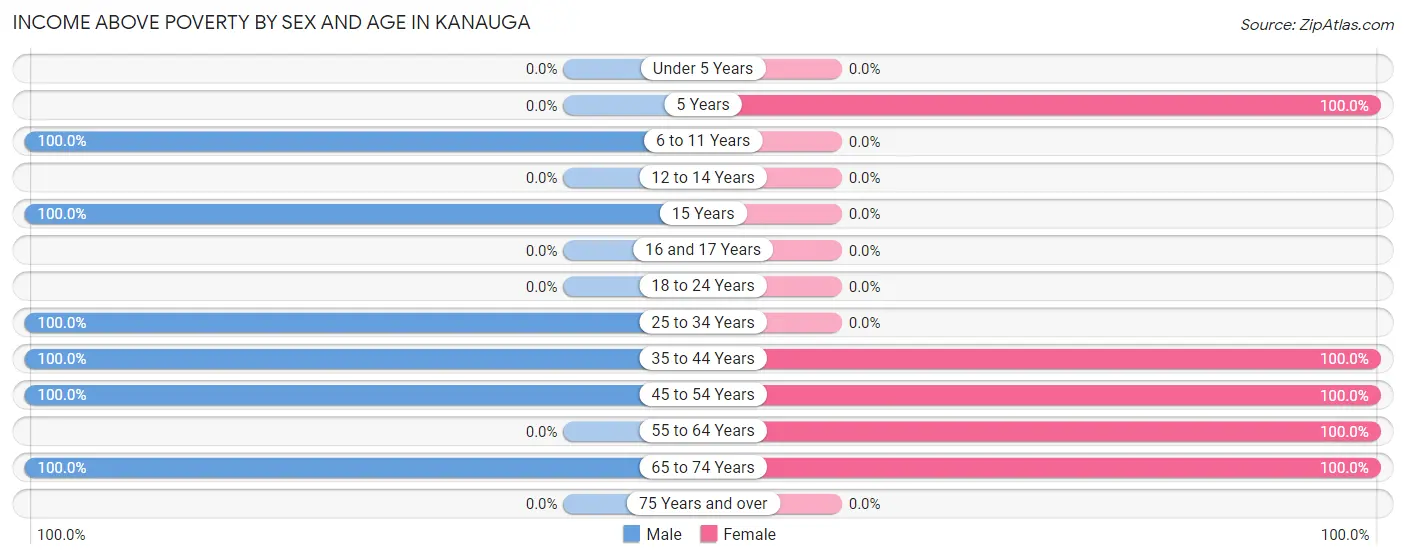
| Age Bracket | Male | Female |
| Under 5 Years | 0 (0.0%) | 0 (0.0%) |
| 5 Years | 0 (0.0%) | 10 (100.0%) |
| 6 to 11 Years | 18 (100.0%) | 0 (0.0%) |
| 12 to 14 Years | 0 (0.0%) | 0 (0.0%) |
| 15 Years | 12 (100.0%) | 0 (0.0%) |
| 16 and 17 Years | 0 (0.0%) | 0 (0.0%) |
| 18 to 24 Years | 0 (0.0%) | 0 (0.0%) |
| 25 to 34 Years | 78 (100.0%) | 0 (0.0%) |
| 35 to 44 Years | 14 (100.0%) | 43 (100.0%) |
| 45 to 54 Years | 39 (100.0%) | 20 (100.0%) |
| 55 to 64 Years | 0 (0.0%) | 30 (100.0%) |
| 65 to 74 Years | 5 (100.0%) | 8 (100.0%) |
| 75 Years and over | 0 (0.0%) | 0 (0.0%) |
| Total | 166 (100.0%) | 111 (100.0%) |
Income Below Poverty Among Married-Couple Families in Kanauga
| Children | Above Poverty | Below Poverty |
| No Children | 22 (100.0%) | 0 (0.0%) |
| 1 or 2 Children | 0 (0.0%) | 0 (0.0%) |
| 3 or 4 Children | 15 (100.0%) | 0 (0.0%) |
| 5 or more Children | 0 (0.0%) | 0 (0.0%) |
| Total | 37 (100.0%) | 0 (0.0%) |
Income Below Poverty Among Single-Parent Households in Kanauga
| Children | Single Father | Single Mother |
| No Children | 0 (0.0%) | 0 (0.0%) |
| 1 or 2 Children | 0 (0.0%) | 0 (0.0%) |
| 3 or 4 Children | 0 (0.0%) | 0 (0.0%) |
| 5 or more Children | 0 (0.0%) | 0 (0.0%) |
| Total | 0 (0.0%) | 0 (0.0%) |
Income Below Poverty Among Married-Couple vs Single-Parent Households in Kanauga
| Children | Married-Couple Families | Single-Parent Households |
| No Children | 0 (0.0%) | 0 (0.0%) |
| 1 or 2 Children | 0 (0.0%) | 0 (0.0%) |
| 3 or 4 Children | 0 (0.0%) | 0 (0.0%) |
| 5 or more Children | 0 (0.0%) | 0 (0.0%) |
| Total | 0 (0.0%) | 0 (0.0%) |
Employment Characteristics in Kanauga
Employment by Class of Employer in Kanauga
Among the 142 employed individuals in Kanauga, , and private company employees (142 | 100.0%) make up the most common classes of employment.
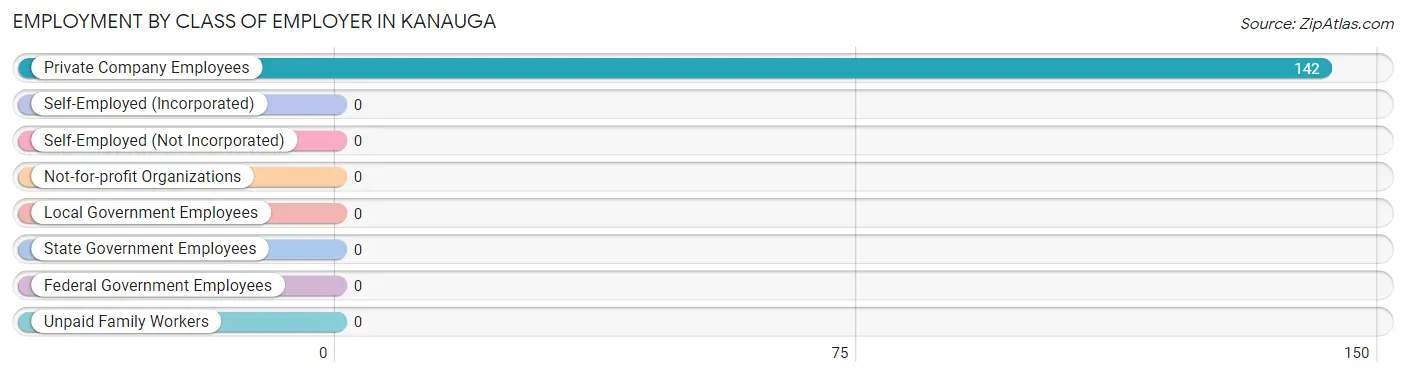
| Employer Class | # Employees | % Employees |
| Private Company Employees | 142 | 100.0% |
| Self-Employed (Incorporated) | 0 | 0.0% |
| Self-Employed (Not Incorporated) | 0 | 0.0% |
| Not-for-profit Organizations | 0 | 0.0% |
| Local Government Employees | 0 | 0.0% |
| State Government Employees | 0 | 0.0% |
| Federal Government Employees | 0 | 0.0% |
| Unpaid Family Workers | 0 | 0.0% |
| Total | 142 | 100.0% |
Employment Status by Age in Kanauga
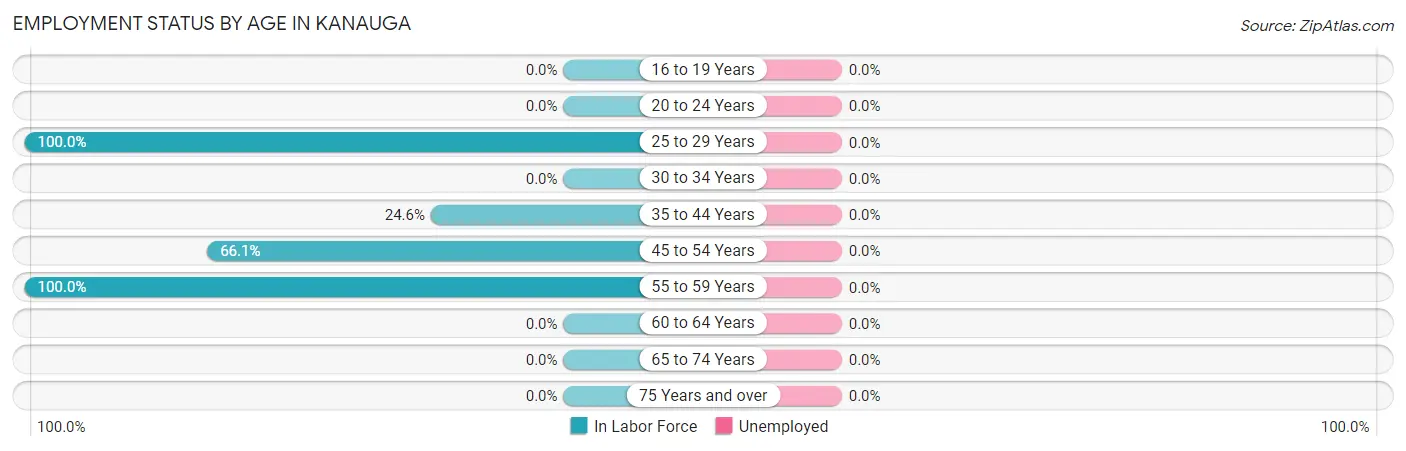
| Age Bracket | In Labor Force | Unemployed |
| 16 to 19 Years | 0 (0.0%) | 0 (0.0%) |
| 20 to 24 Years | 0 (0.0%) | 0 (0.0%) |
| 25 to 29 Years | 64 (100.0%) | 0 (0.0%) |
| 30 to 34 Years | 0 (0.0%) | 0 (0.0%) |
| 35 to 44 Years | 14 (24.6%) | 0 (0.0%) |
| 45 to 54 Years | 39 (66.1%) | 0 (0.0%) |
| 55 to 59 Years | 25 (100.0%) | 0 (0.0%) |
| 60 to 64 Years | 0 (0.0%) | 0 (0.0%) |
| 65 to 74 Years | 0 (0.0%) | 0 (0.0%) |
| 75 Years and over | 0 (0.0%) | 0 (0.0%) |
| Total | 142 (59.9%) | 0 (0.0%) |
Employment Status by Educational Attainment in Kanauga
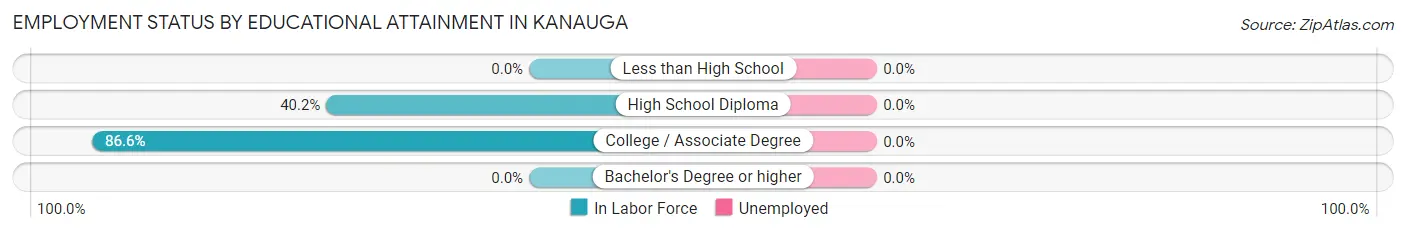
| Educational Attainment | In Labor Force | Unemployed |
| Less than High School | 0 (0.0%) | 0 (0.0%) |
| High School Diploma | 45 (40.2%) | 0 (0.0%) |
| College / Associate Degree | 97 (86.6%) | 0 (0.0%) |
| Bachelor's Degree or higher | 0 (0.0%) | 0 (0.0%) |
| Total | 142 (63.4%) | 0 (0.0%) |
Employment Occupations by Sex in Kanauga
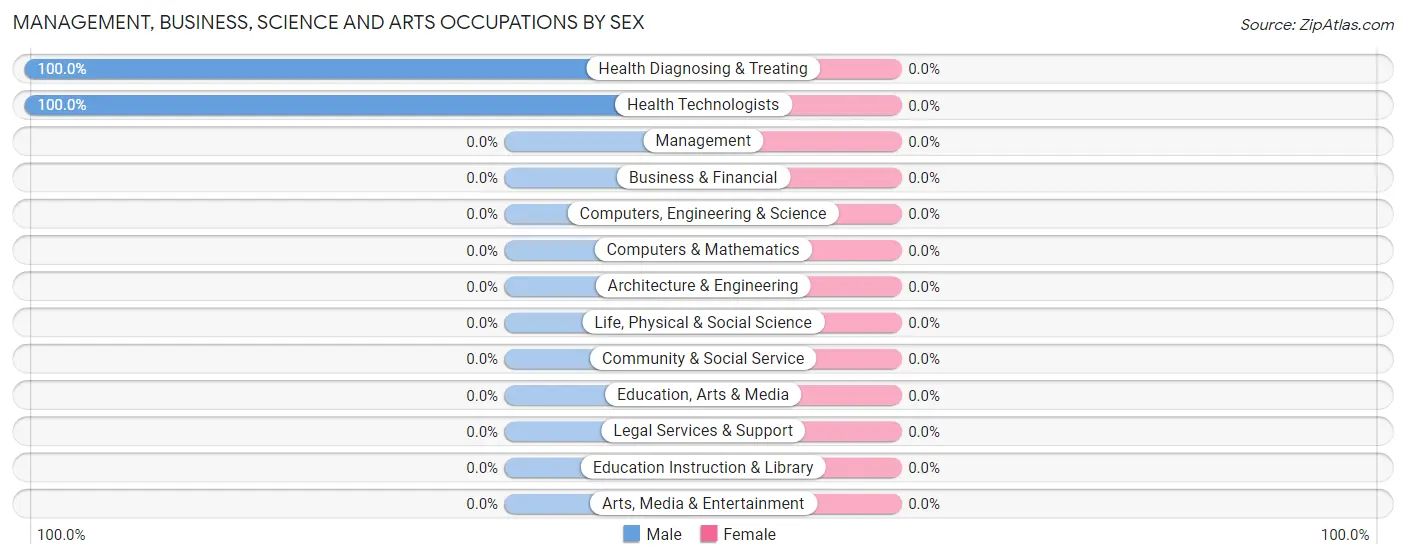
Management, Business, Science and Arts Occupations
The most common Management, Business, Science and Arts occupations in Kanauga are Health Diagnosing & Treating (14 | 9.9%), and Health Technologists (14 | 9.9%).
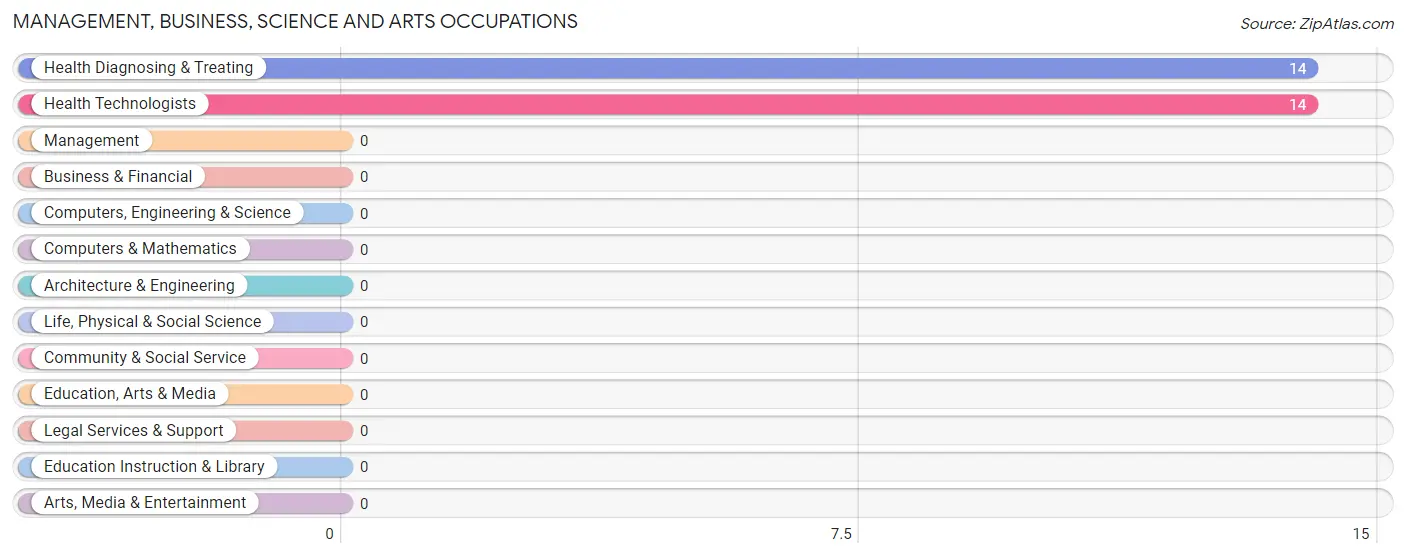
Management, Business, Science and Arts Occupations by Sex
| Occupation | Male | Female |
| Management | 0 (0.0%) | 0 (0.0%) |
| Business & Financial | 0 (0.0%) | 0 (0.0%) |
| Computers, Engineering & Science | 0 (0.0%) | 0 (0.0%) |
| Computers & Mathematics | 0 (0.0%) | 0 (0.0%) |
| Architecture & Engineering | 0 (0.0%) | 0 (0.0%) |
| Life, Physical & Social Science | 0 (0.0%) | 0 (0.0%) |
| Community & Social Service | 0 (0.0%) | 0 (0.0%) |
| Education, Arts & Media | 0 (0.0%) | 0 (0.0%) |
| Legal Services & Support | 0 (0.0%) | 0 (0.0%) |
| Education Instruction & Library | 0 (0.0%) | 0 (0.0%) |
| Arts, Media & Entertainment | 0 (0.0%) | 0 (0.0%) |
| Health Diagnosing & Treating | 14 (100.0%) | 0 (0.0%) |
| Health Technologists | 14 (100.0%) | 0 (0.0%) |
| Total (Category) | 14 (100.0%) | 0 (0.0%) |
| Total (Overall) | 117 (82.4%) | 25 (17.6%) |
Services Occupations
The most common Services occupations in Kanauga are , and Food Preparation & Serving (28 | 19.7%).
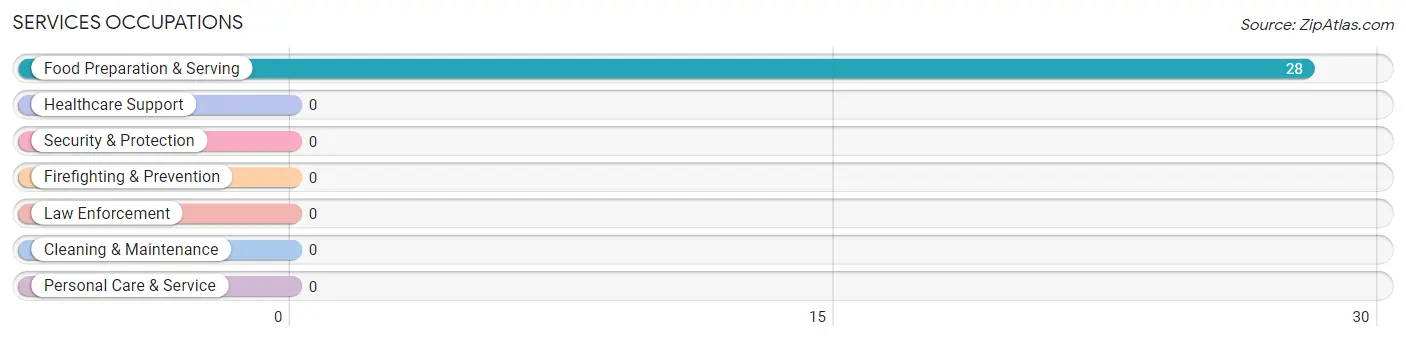
Services Occupations by Sex
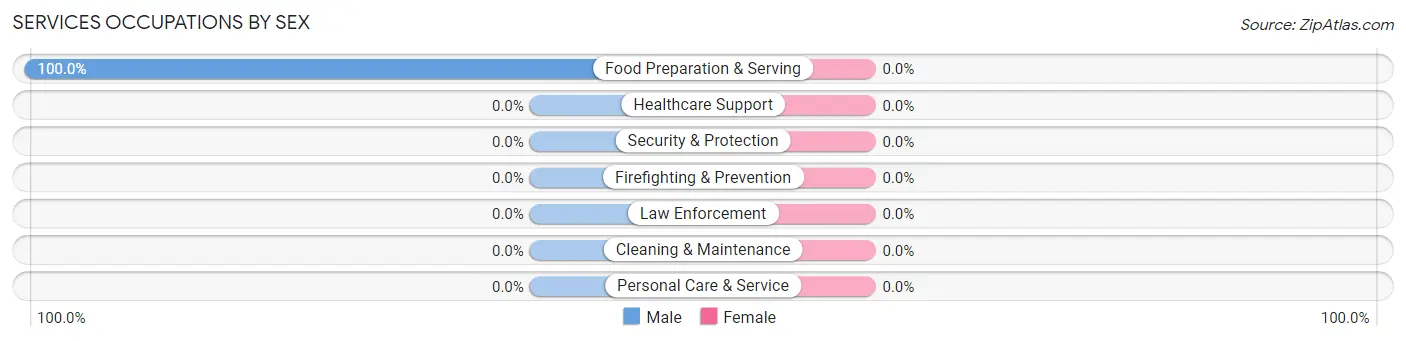
| Occupation | Male | Female |
| Healthcare Support | 0 (0.0%) | 0 (0.0%) |
| Security & Protection | 0 (0.0%) | 0 (0.0%) |
| Firefighting & Prevention | 0 (0.0%) | 0 (0.0%) |
| Law Enforcement | 0 (0.0%) | 0 (0.0%) |
| Food Preparation & Serving | 28 (100.0%) | 0 (0.0%) |
| Cleaning & Maintenance | 0 (0.0%) | 0 (0.0%) |
| Personal Care & Service | 0 (0.0%) | 0 (0.0%) |
| Total (Category) | 28 (100.0%) | 0 (0.0%) |
| Total (Overall) | 117 (82.4%) | 25 (17.6%) |
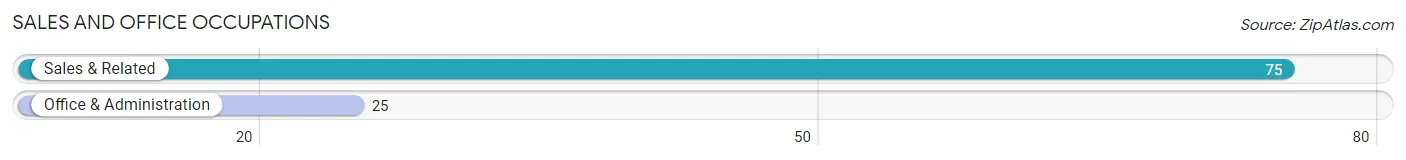
Sales and Office Occupations
The most common Sales and Office occupations in Kanauga are Sales & Related (75 | 52.8%), and Office & Administration (25 | 17.6%).
Sales and Office Occupations by Sex
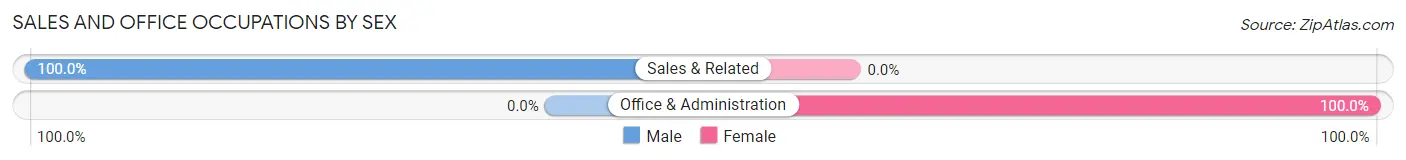
| Occupation | Male | Female |
| Sales & Related | 75 (100.0%) | 0 (0.0%) |
| Office & Administration | 0 (0.0%) | 25 (100.0%) |
| Total (Category) | 75 (75.0%) | 25 (25.0%) |
| Total (Overall) | 117 (82.4%) | 25 (17.6%) |
Natural Resources, Construction and Maintenance Occupations
Natural Resources, Construction and Maintenance Occupations by Sex
| Occupation | Male | Female |
| Farming, Fishing & Forestry | 0 (0.0%) | 0 (0.0%) |
| Construction & Extraction | 0 (0.0%) | 0 (0.0%) |
| Installation, Maintenance & Repair | 0 (0.0%) | 0 (0.0%) |
| Total (Category) | 0 (0.0%) | 0 (0.0%) |
| Total (Overall) | 117 (82.4%) | 25 (17.6%) |
Production, Transportation and Moving Occupations
Production, Transportation and Moving Occupations by Sex
| Occupation | Male | Female |
| Production | 0 (0.0%) | 0 (0.0%) |
| Transportation | 0 (0.0%) | 0 (0.0%) |
| Material Moving | 0 (0.0%) | 0 (0.0%) |
| Total (Category) | 0 (0.0%) | 0 (0.0%) |
| Total (Overall) | 117 (82.4%) | 25 (17.6%) |
Employment Industries by Sex in Kanauga
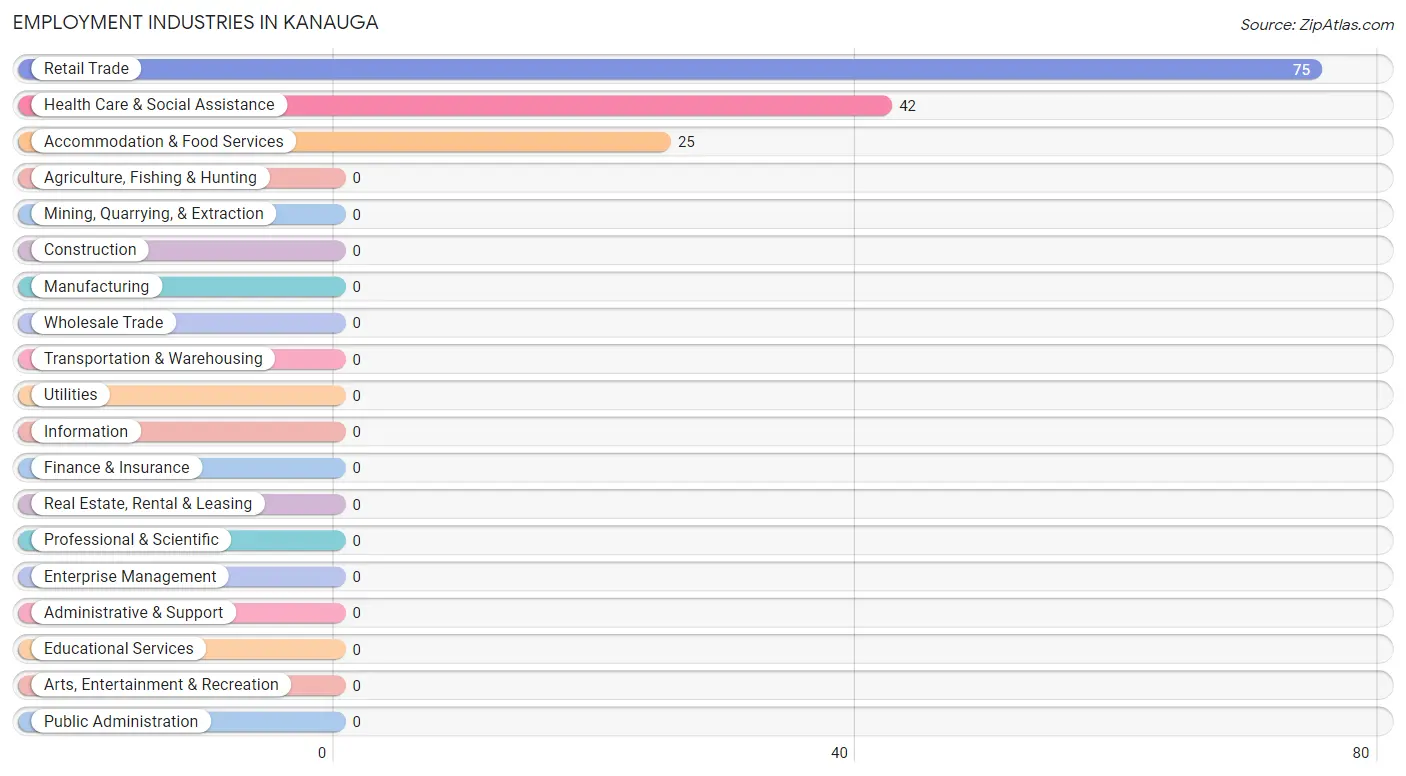
Employment Industries in Kanauga
The major employment industries in Kanauga include Retail Trade (75 | 52.8%), Health Care & Social Assistance (42 | 29.6%), and Accommodation & Food Services (25 | 17.6%).
Employment Industries by Sex in Kanauga
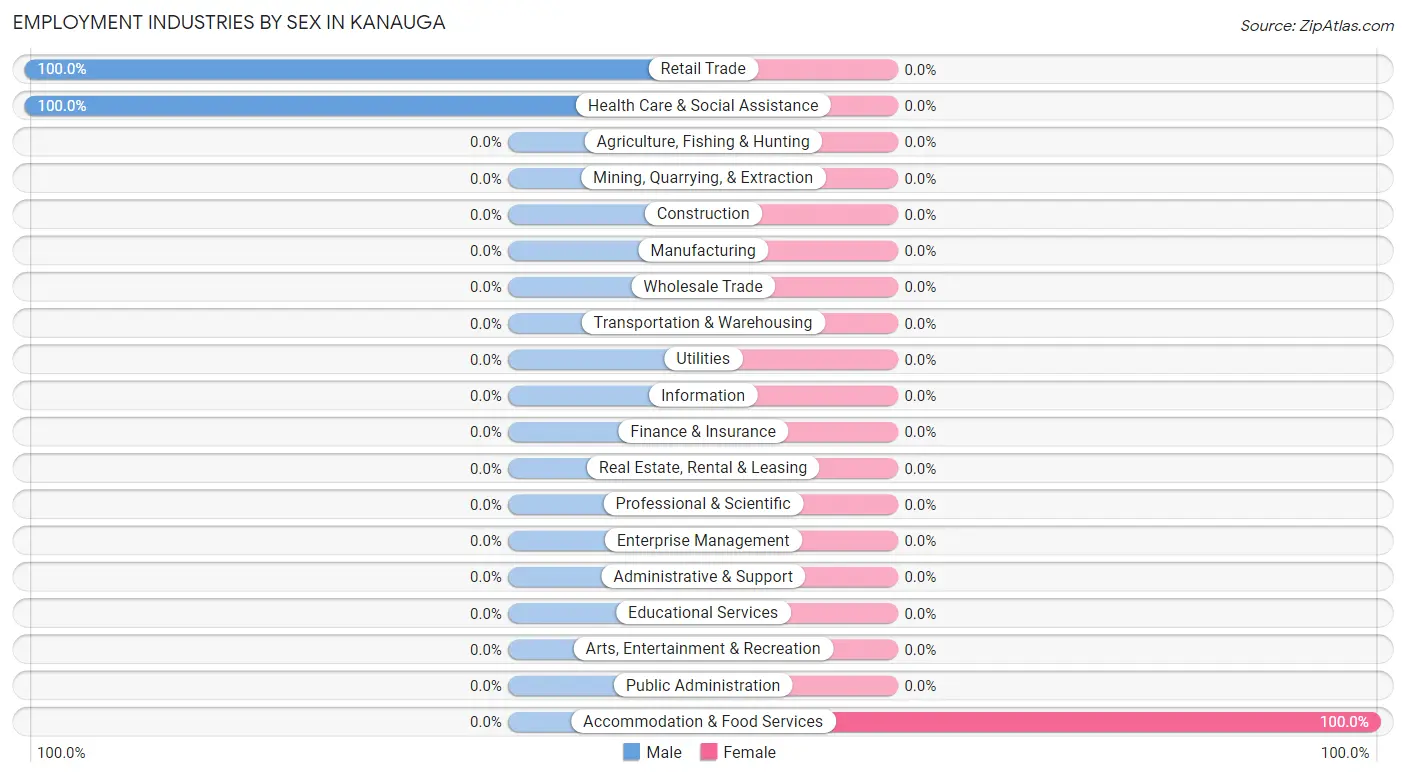
| Industry | Male | Female |
| Agriculture, Fishing & Hunting | 0 (0.0%) | 0 (0.0%) |
| Mining, Quarrying, & Extraction | 0 (0.0%) | 0 (0.0%) |
| Construction | 0 (0.0%) | 0 (0.0%) |
| Manufacturing | 0 (0.0%) | 0 (0.0%) |
| Wholesale Trade | 0 (0.0%) | 0 (0.0%) |
| Retail Trade | 75 (100.0%) | 0 (0.0%) |
| Transportation & Warehousing | 0 (0.0%) | 0 (0.0%) |
| Utilities | 0 (0.0%) | 0 (0.0%) |
| Information | 0 (0.0%) | 0 (0.0%) |
| Finance & Insurance | 0 (0.0%) | 0 (0.0%) |
| Real Estate, Rental & Leasing | 0 (0.0%) | 0 (0.0%) |
| Professional & Scientific | 0 (0.0%) | 0 (0.0%) |
| Enterprise Management | 0 (0.0%) | 0 (0.0%) |
| Administrative & Support | 0 (0.0%) | 0 (0.0%) |
| Educational Services | 0 (0.0%) | 0 (0.0%) |
| Health Care & Social Assistance | 42 (100.0%) | 0 (0.0%) |
| Arts, Entertainment & Recreation | 0 (0.0%) | 0 (0.0%) |
| Accommodation & Food Services | 0 (0.0%) | 25 (100.0%) |
| Public Administration | 0 (0.0%) | 0 (0.0%) |
| Total | 117 (82.4%) | 25 (17.6%) |
Education in Kanauga
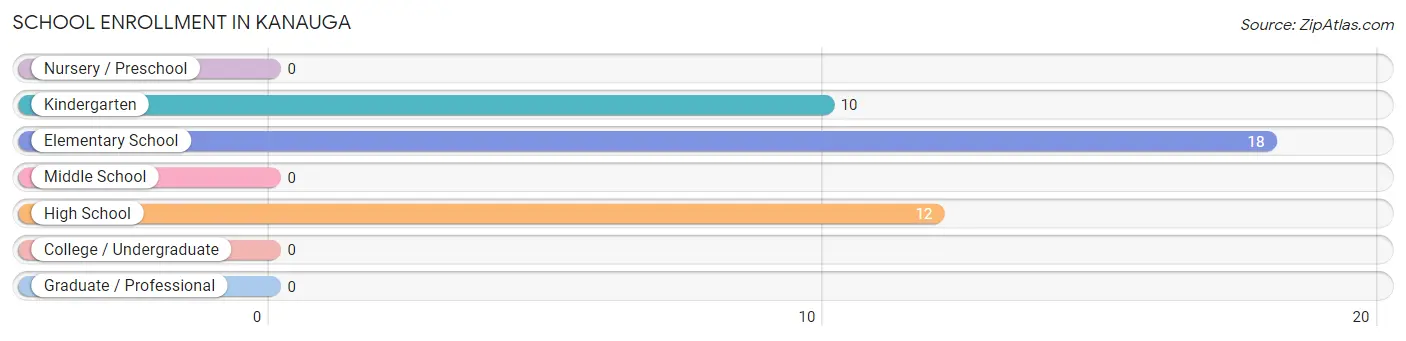
School Enrollment in Kanauga
The most common levels of schooling among the 40 students in Kanauga are elementary school (18 | 45.0%), high school (12 | 30.0%), and kindergarten (10 | 25.0%).
| School Level | # Students | % Students |
| Nursery / Preschool | 0 | 0.0% |
| Kindergarten | 10 | 25.0% |
| Elementary School | 18 | 45.0% |
| Middle School | 0 | 0.0% |
| High School | 12 | 30.0% |
| College / Undergraduate | 0 | 0.0% |
| Graduate / Professional | 0 | 0.0% |
| Total | 40 | 100.0% |
School Enrollment by Age by Funding Source in Kanauga
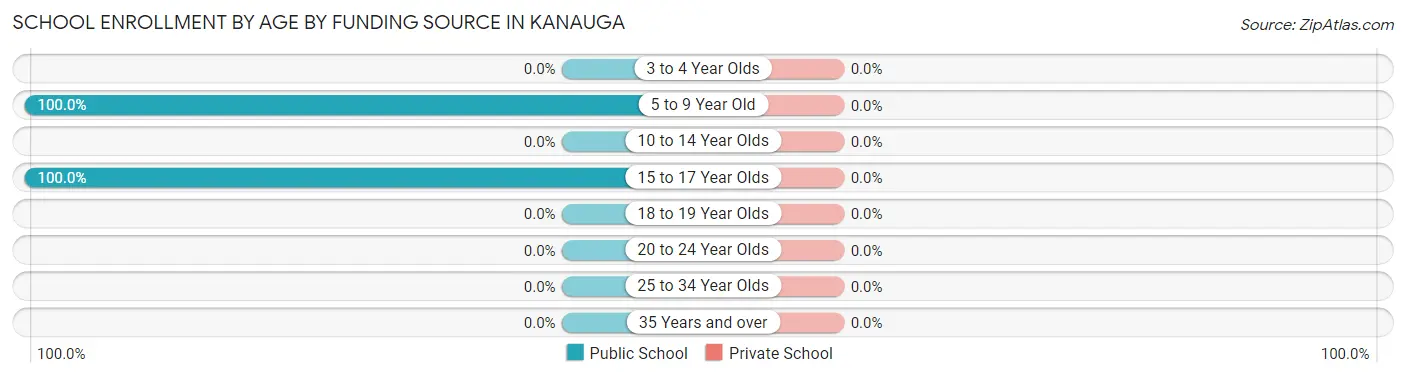
| Age Bracket | Public School | Private School |
| 3 to 4 Year Olds | 0 (0.0%) | 0 (0.0%) |
| 5 to 9 Year Old | 28 (100.0%) | 0 (0.0%) |
| 10 to 14 Year Olds | 0 (0.0%) | 0 (0.0%) |
| 15 to 17 Year Olds | 12 (100.0%) | 0 (0.0%) |
| 18 to 19 Year Olds | 0 (0.0%) | 0 (0.0%) |
| 20 to 24 Year Olds | 0 (0.0%) | 0 (0.0%) |
| 25 to 34 Year Olds | 0 (0.0%) | 0 (0.0%) |
| 35 Years and over | 0 (0.0%) | 0 (0.0%) |
| Total | 40 (100.0%) | 0 (0.0%) |
Educational Attainment by Field of Study in Kanauga
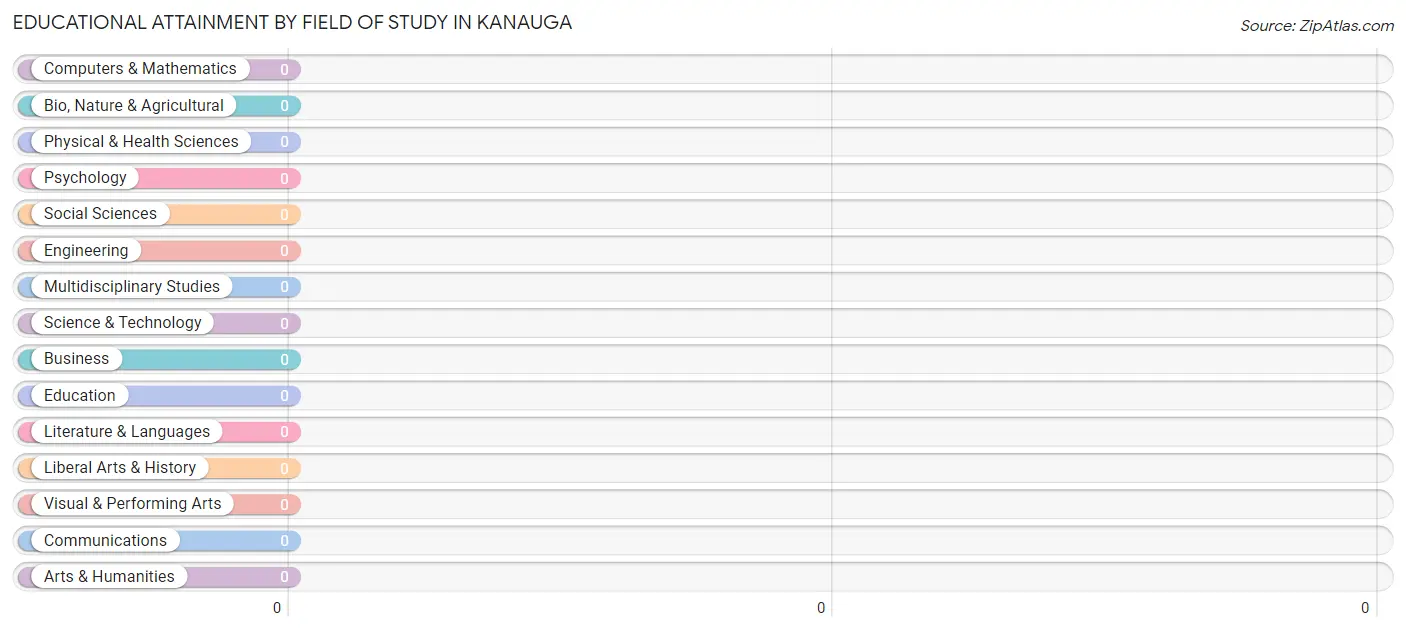
| Field of Study | # Graduates | % Graduates |
| Computers & Mathematics | 0 | 0.0% |
| Bio, Nature & Agricultural | 0 | 0.0% |
| Physical & Health Sciences | 0 | 0.0% |
| Psychology | 0 | 0.0% |
| Social Sciences | 0 | 0.0% |
| Engineering | 0 | 0.0% |
| Multidisciplinary Studies | 0 | 0.0% |
| Science & Technology | 0 | 0.0% |
| Business | 0 | 0.0% |
| Education | 0 | 0.0% |
| Literature & Languages | 0 | 0.0% |
| Liberal Arts & History | 0 | 0.0% |
| Visual & Performing Arts | 0 | 0.0% |
| Communications | 0 | 0.0% |
| Arts & Humanities | 0 | 0.0% |
| Total | 0 | 0.0% |
Transportation & Commute in Kanauga
Vehicle Availability by Sex in Kanauga
The most prevalent vehicle ownership categories in Kanauga are males with 3 vehicles (103, accounting for 88.0%) and females with 3 vehicles (25, making up 412.0%).
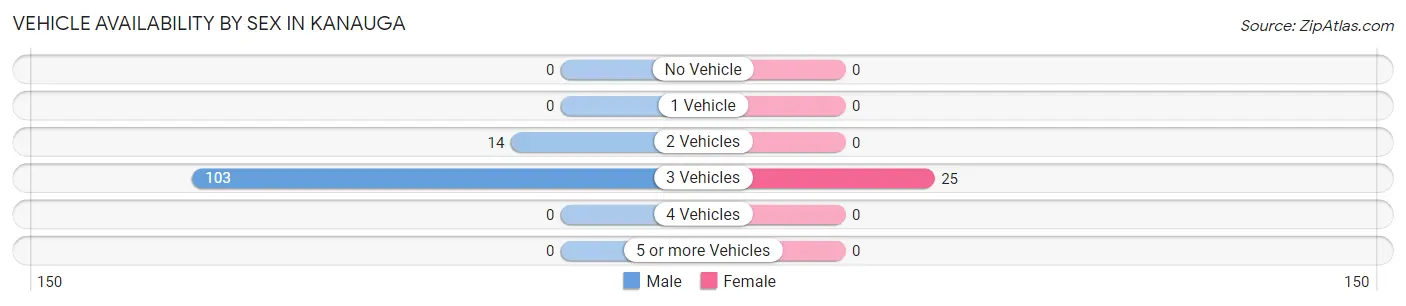
| Vehicles Available | Male | Female |
| No Vehicle | 0 (0.0%) | 0 (0.0%) |
| 1 Vehicle | 0 (0.0%) | 0 (0.0%) |
| 2 Vehicles | 14 (12.0%) | 0 (0.0%) |
| 3 Vehicles | 103 (88.0%) | 25 (100.0%) |
| 4 Vehicles | 0 (0.0%) | 0 (0.0%) |
| 5 or more Vehicles | 0 (0.0%) | 0 (0.0%) |
| Total | 117 (100.0%) | 25 (100.0%) |
Commute Time in Kanauga
The most frequently occuring commute durations in Kanauga are 10 to 14 minutes (81 commuters, 57.0%), 20 to 24 minutes (36 commuters, 25.4%), and 15 to 19 minutes (25 commuters, 17.6%).
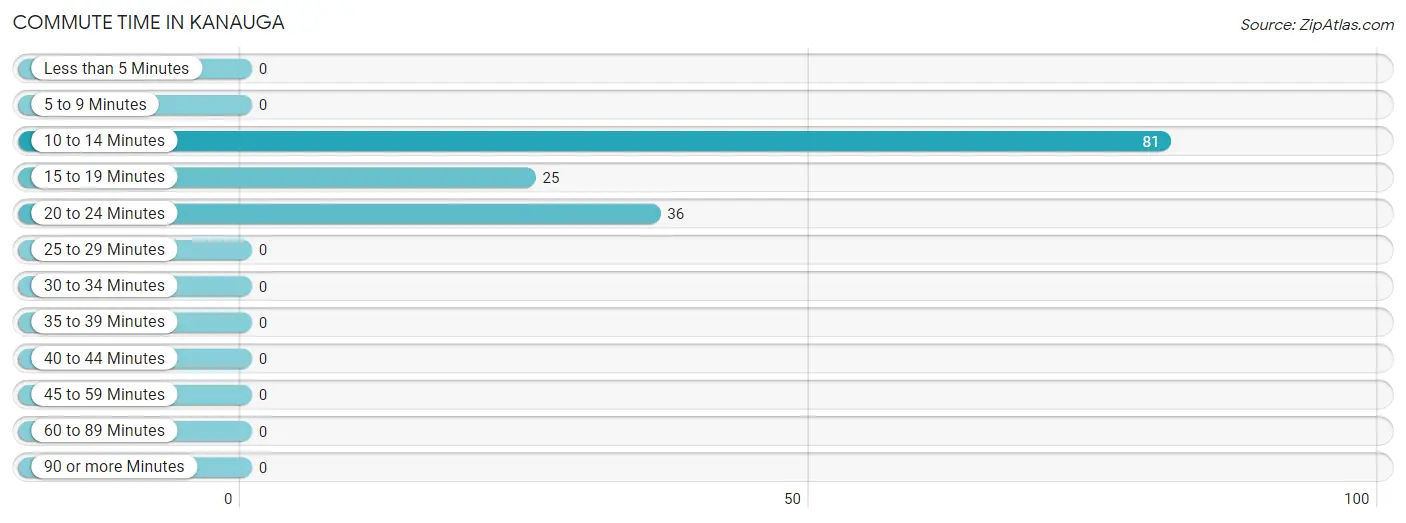
| Commute Time | # Commuters | % Commuters |
| Less than 5 Minutes | 0 | 0.0% |
| 5 to 9 Minutes | 0 | 0.0% |
| 10 to 14 Minutes | 81 | 57.0% |
| 15 to 19 Minutes | 25 | 17.6% |
| 20 to 24 Minutes | 36 | 25.4% |
| 25 to 29 Minutes | 0 | 0.0% |
| 30 to 34 Minutes | 0 | 0.0% |
| 35 to 39 Minutes | 0 | 0.0% |
| 40 to 44 Minutes | 0 | 0.0% |
| 45 to 59 Minutes | 0 | 0.0% |
| 60 to 89 Minutes | 0 | 0.0% |
| 90 or more Minutes | 0 | 0.0% |
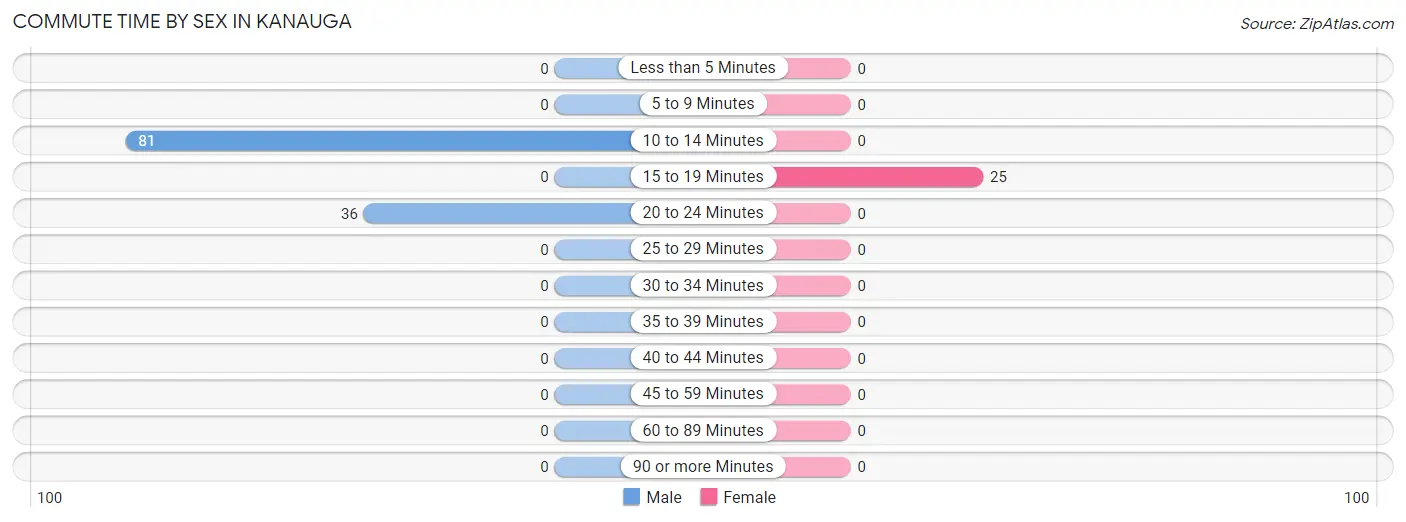
Commute Time by Sex in Kanauga
The most common commute times in Kanauga are 10 to 14 minutes (81 commuters, 69.2%) for males and 15 to 19 minutes (25 commuters, 100.0%) for females.
| Commute Time | Male | Female |
| Less than 5 Minutes | 0 (0.0%) | 0 (0.0%) |
| 5 to 9 Minutes | 0 (0.0%) | 0 (0.0%) |
| 10 to 14 Minutes | 81 (69.2%) | 0 (0.0%) |
| 15 to 19 Minutes | 0 (0.0%) | 25 (100.0%) |
| 20 to 24 Minutes | 36 (30.8%) | 0 (0.0%) |
| 25 to 29 Minutes | 0 (0.0%) | 0 (0.0%) |
| 30 to 34 Minutes | 0 (0.0%) | 0 (0.0%) |
| 35 to 39 Minutes | 0 (0.0%) | 0 (0.0%) |
| 40 to 44 Minutes | 0 (0.0%) | 0 (0.0%) |
| 45 to 59 Minutes | 0 (0.0%) | 0 (0.0%) |
| 60 to 89 Minutes | 0 (0.0%) | 0 (0.0%) |
| 90 or more Minutes | 0 (0.0%) | 0 (0.0%) |
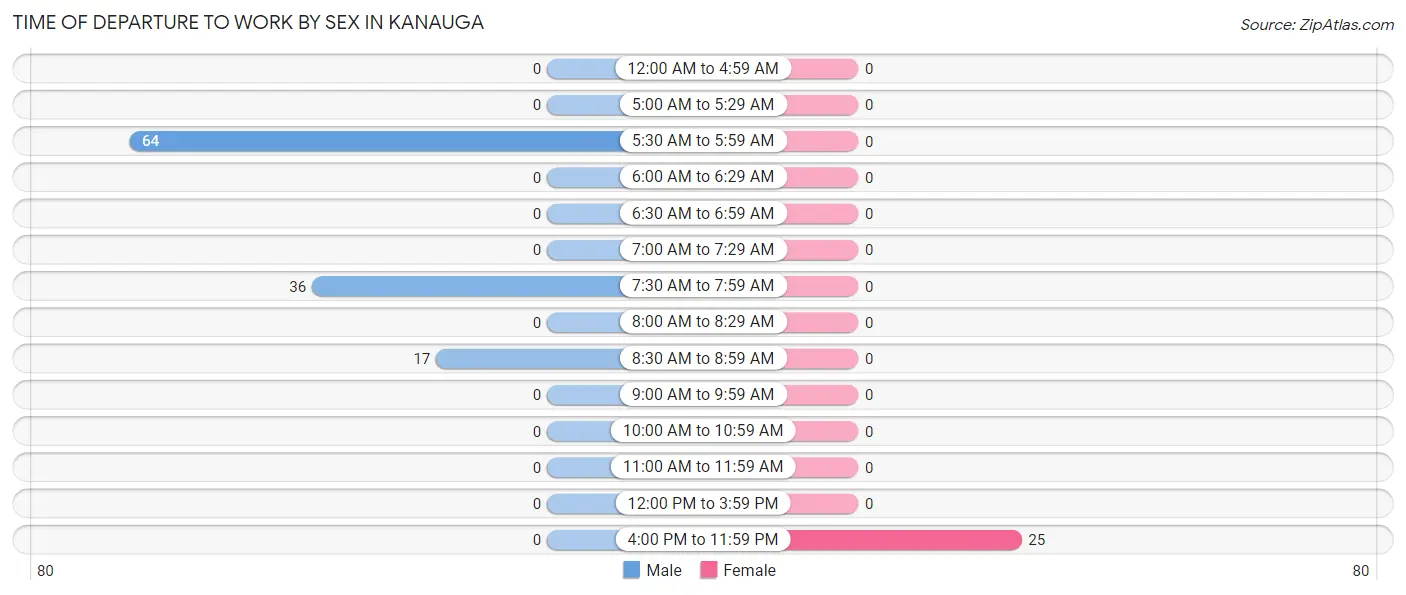
Time of Departure to Work by Sex in Kanauga
The most frequent times of departure to work in Kanauga are 5:30 AM to 5:59 AM (64, 54.7%) for males and 4:00 PM to 11:59 PM (25, 100.0%) for females.
| Time of Departure | Male | Female |
| 12:00 AM to 4:59 AM | 0 (0.0%) | 0 (0.0%) |
| 5:00 AM to 5:29 AM | 0 (0.0%) | 0 (0.0%) |
| 5:30 AM to 5:59 AM | 64 (54.7%) | 0 (0.0%) |
| 6:00 AM to 6:29 AM | 0 (0.0%) | 0 (0.0%) |
| 6:30 AM to 6:59 AM | 0 (0.0%) | 0 (0.0%) |
| 7:00 AM to 7:29 AM | 0 (0.0%) | 0 (0.0%) |
| 7:30 AM to 7:59 AM | 36 (30.8%) | 0 (0.0%) |
| 8:00 AM to 8:29 AM | 0 (0.0%) | 0 (0.0%) |
| 8:30 AM to 8:59 AM | 17 (14.5%) | 0 (0.0%) |
| 9:00 AM to 9:59 AM | 0 (0.0%) | 0 (0.0%) |
| 10:00 AM to 10:59 AM | 0 (0.0%) | 0 (0.0%) |
| 11:00 AM to 11:59 AM | 0 (0.0%) | 0 (0.0%) |
| 12:00 PM to 3:59 PM | 0 (0.0%) | 0 (0.0%) |
| 4:00 PM to 11:59 PM | 0 (0.0%) | 25 (100.0%) |
| Total | 117 (100.0%) | 25 (100.0%) |
Housing Occupancy in Kanauga
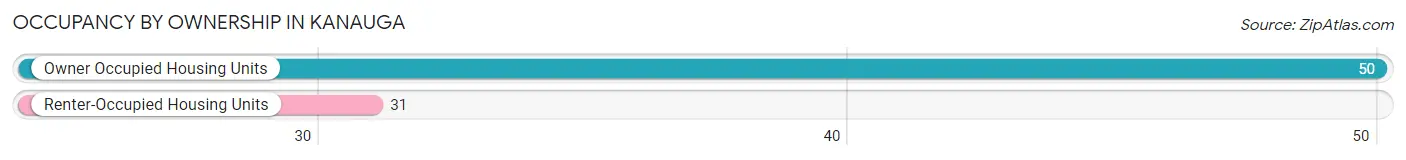
Occupancy by Ownership in Kanauga
Of the total 81 dwellings in Kanauga, owner-occupied units account for 50 (61.7%), while renter-occupied units make up 31 (38.3%).
| Occupancy | # Housing Units | % Housing Units |
| Owner Occupied Housing Units | 50 | 61.7% |
| Renter-Occupied Housing Units | 31 | 38.3% |
| Total Occupied Housing Units | 81 | 100.0% |
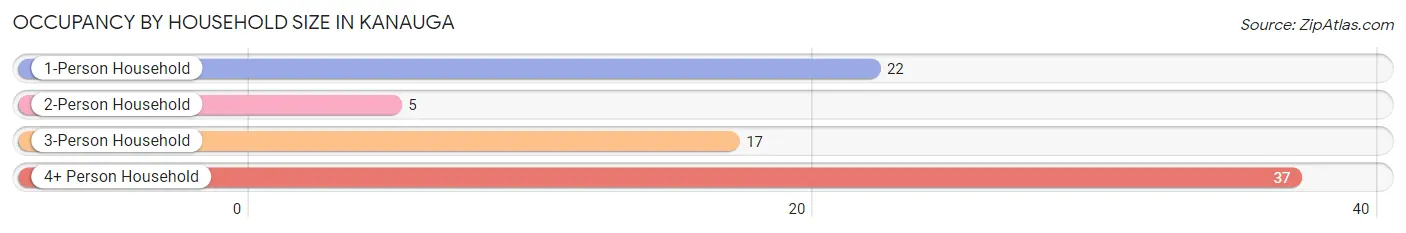
Occupancy by Household Size in Kanauga
| Household Size | # Housing Units | % Housing Units |
| 1-Person Household | 22 | 27.2% |
| 2-Person Household | 5 | 6.2% |
| 3-Person Household | 17 | 21.0% |
| 4+ Person Household | 37 | 45.7% |
| Total Housing Units | 81 | 100.0% |
Occupancy by Ownership by Household Size in Kanauga
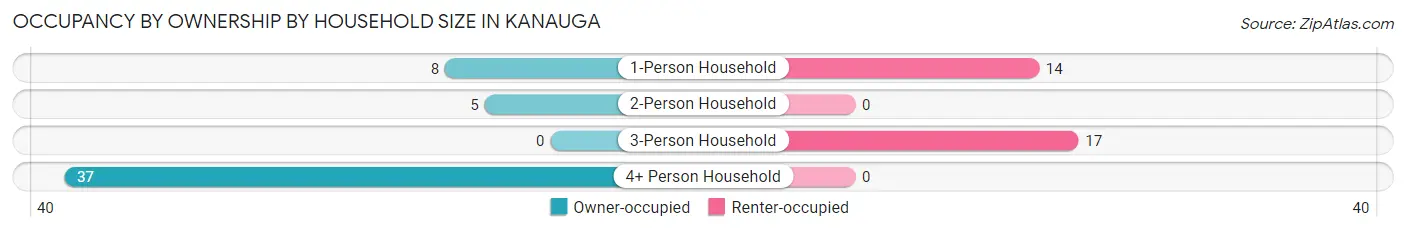
| Household Size | Owner-occupied | Renter-occupied |
| 1-Person Household | 8 (36.4%) | 14 (63.6%) |
| 2-Person Household | 5 (100.0%) | 0 (0.0%) |
| 3-Person Household | 0 (0.0%) | 17 (100.0%) |
| 4+ Person Household | 37 (100.0%) | 0 (0.0%) |
| Total Housing Units | 50 (61.7%) | 31 (38.3%) |
Occupancy by Educational Attainment in Kanauga
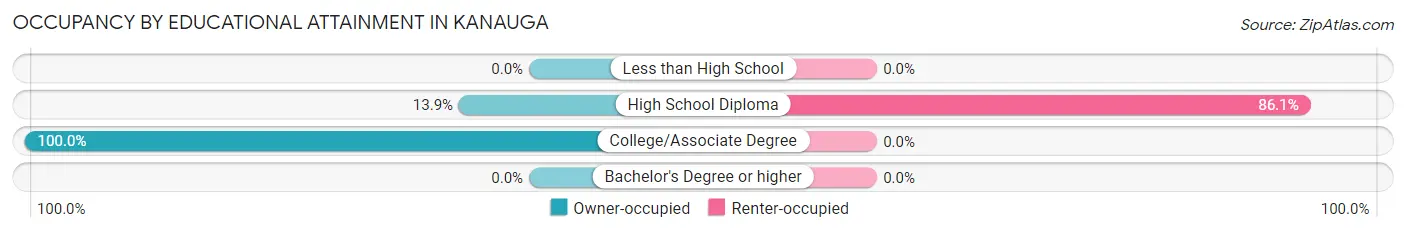
| Household Size | Owner-occupied | Renter-occupied |
| Less than High School | 0 (0.0%) | 0 (0.0%) |
| High School Diploma | 5 (13.9%) | 31 (86.1%) |
| College/Associate Degree | 45 (100.0%) | 0 (0.0%) |
| Bachelor's Degree or higher | 0 (0.0%) | 0 (0.0%) |
Occupancy by Age of Householder in Kanauga
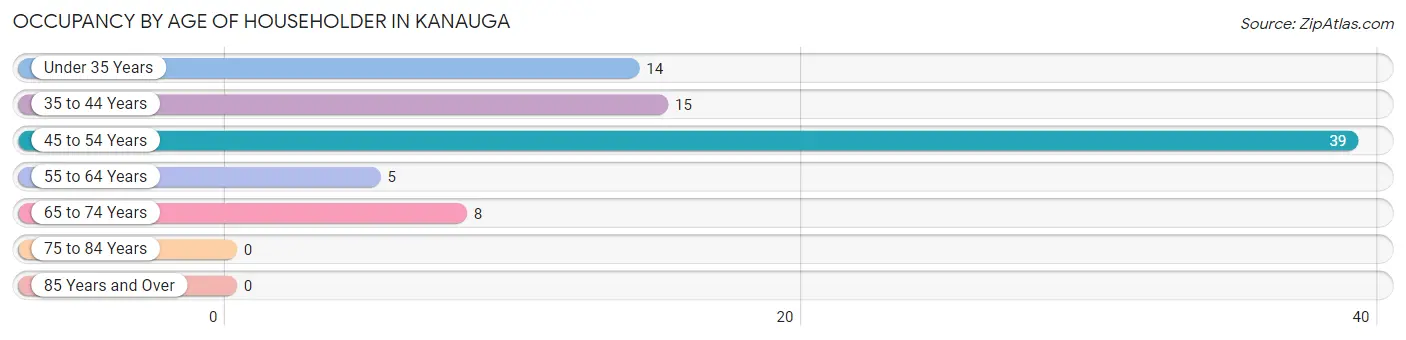
| Age Bracket | # Households | % Households |
| Under 35 Years | 14 | 17.3% |
| 35 to 44 Years | 15 | 18.5% |
| 45 to 54 Years | 39 | 48.1% |
| 55 to 64 Years | 5 | 6.2% |
| 65 to 74 Years | 8 | 9.9% |
| 75 to 84 Years | 0 | 0.0% |
| 85 Years and Over | 0 | 0.0% |
| Total | 81 | 100.0% |
Housing Finances in Kanauga
Median Income by Occupancy in Kanauga
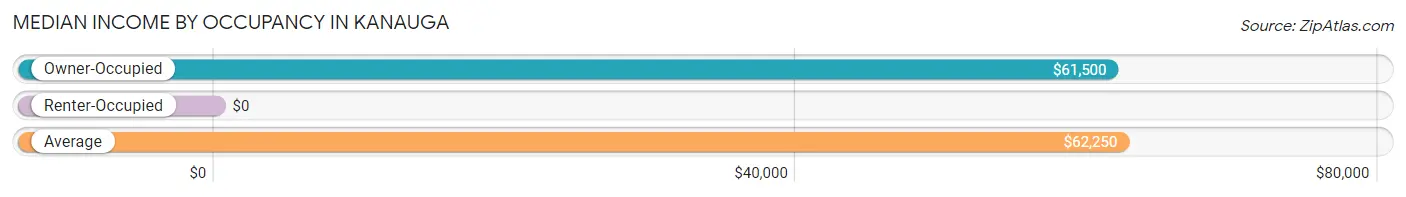
| Occupancy Type | # Households | Median Income |
| Owner-Occupied | 50 (61.7%) | $61,500 |
| Renter-Occupied | 31 (38.3%) | $0 |
| Average | 81 (100.0%) | $62,250 |
Occupancy by Householder Income Bracket in Kanauga
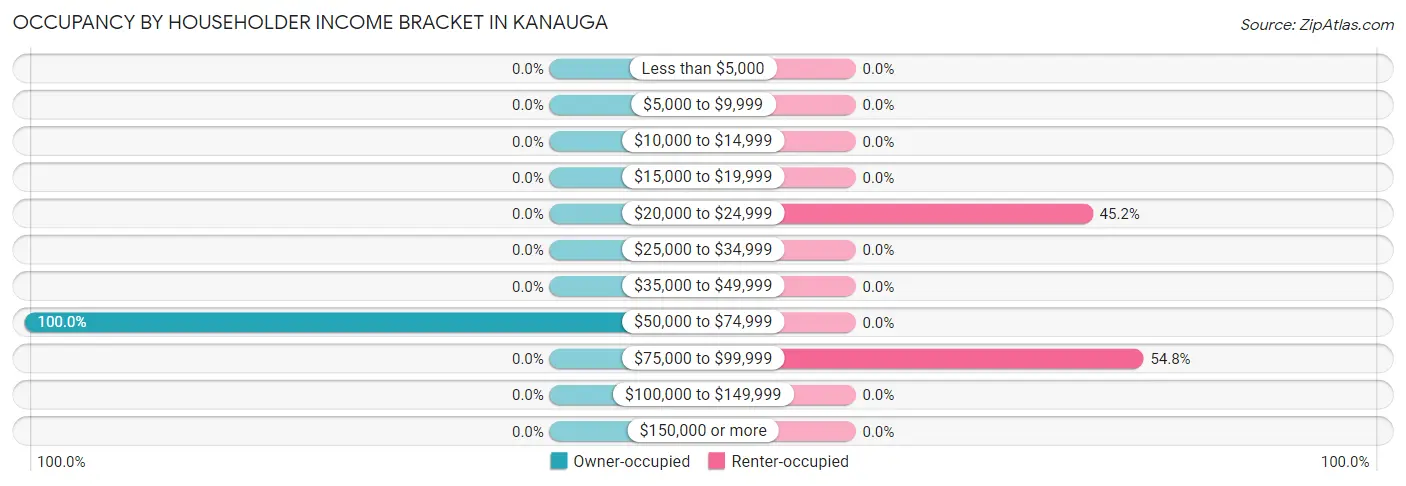
| Income Bracket | Owner-occupied | Renter-occupied |
| Less than $5,000 | 0 (0.0%) | 0 (0.0%) |
| $5,000 to $9,999 | 0 (0.0%) | 0 (0.0%) |
| $10,000 to $14,999 | 0 (0.0%) | 0 (0.0%) |
| $15,000 to $19,999 | 0 (0.0%) | 0 (0.0%) |
| $20,000 to $24,999 | 0 (0.0%) | 14 (45.2%) |
| $25,000 to $34,999 | 0 (0.0%) | 0 (0.0%) |
| $35,000 to $49,999 | 0 (0.0%) | 0 (0.0%) |
| $50,000 to $74,999 | 50 (100.0%) | 0 (0.0%) |
| $75,000 to $99,999 | 0 (0.0%) | 17 (54.8%) |
| $100,000 to $149,999 | 0 (0.0%) | 0 (0.0%) |
| $150,000 or more | 0 (0.0%) | 0 (0.0%) |
| Total | 50 (100.0%) | 31 (100.0%) |
Monthly Housing Cost Tiers in Kanauga
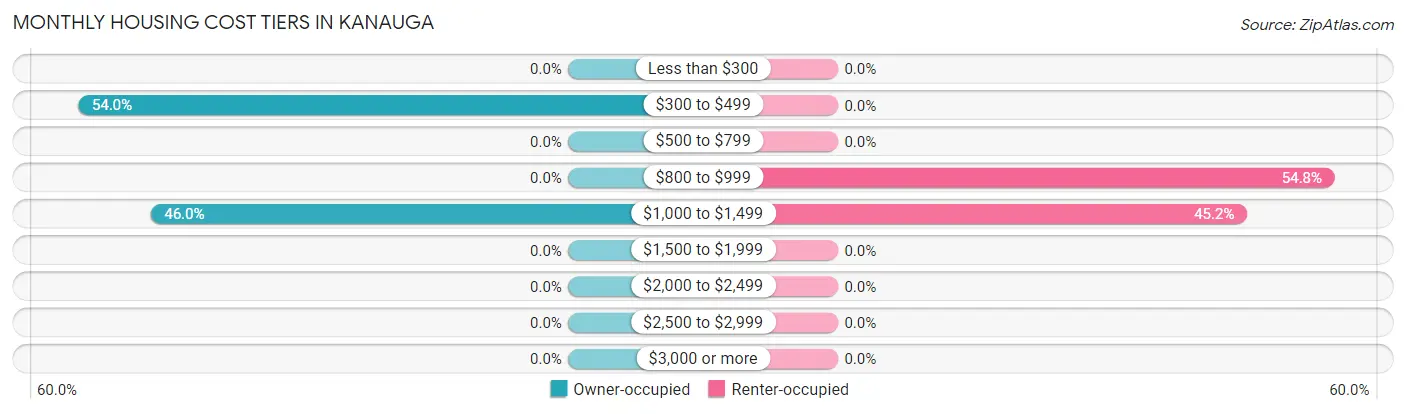
| Monthly Cost | Owner-occupied | Renter-occupied |
| Less than $300 | 0 (0.0%) | 0 (0.0%) |
| $300 to $499 | 27 (54.0%) | 0 (0.0%) |
| $500 to $799 | 0 (0.0%) | 0 (0.0%) |
| $800 to $999 | 0 (0.0%) | 17 (54.8%) |
| $1,000 to $1,499 | 23 (46.0%) | 14 (45.2%) |
| $1,500 to $1,999 | 0 (0.0%) | 0 (0.0%) |
| $2,000 to $2,499 | 0 (0.0%) | 0 (0.0%) |
| $2,500 to $2,999 | 0 (0.0%) | 0 (0.0%) |
| $3,000 or more | 0 (0.0%) | 0 (0.0%) |
| Total | 50 (100.0%) | 31 (100.0%) |
Physical Housing Characteristics in Kanauga
Housing Structures in Kanauga
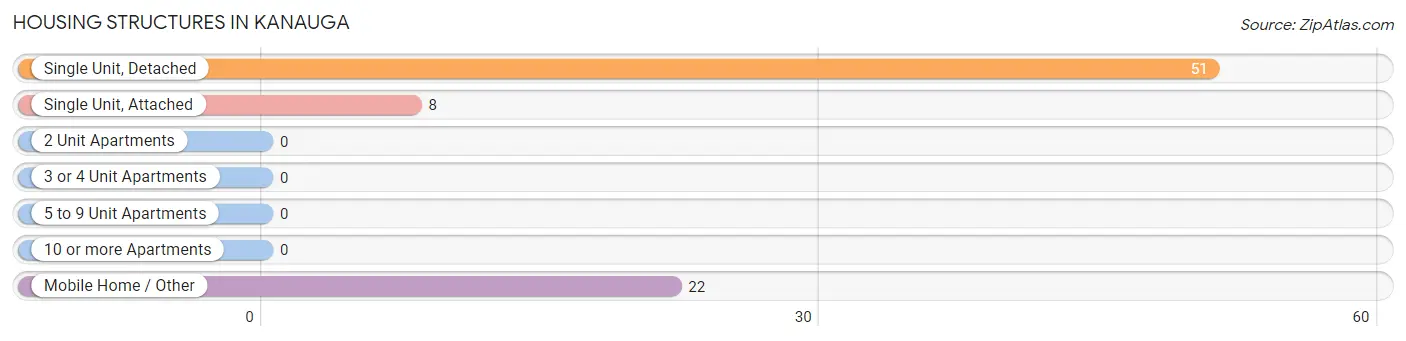
| Structure Type | # Housing Units | % Housing Units |
| Single Unit, Detached | 51 | 63.0% |
| Single Unit, Attached | 8 | 9.9% |
| 2 Unit Apartments | 0 | 0.0% |
| 3 or 4 Unit Apartments | 0 | 0.0% |
| 5 to 9 Unit Apartments | 0 | 0.0% |
| 10 or more Apartments | 0 | 0.0% |
| Mobile Home / Other | 22 | 27.2% |
| Total | 81 | 100.0% |
Housing Structures by Occupancy in Kanauga
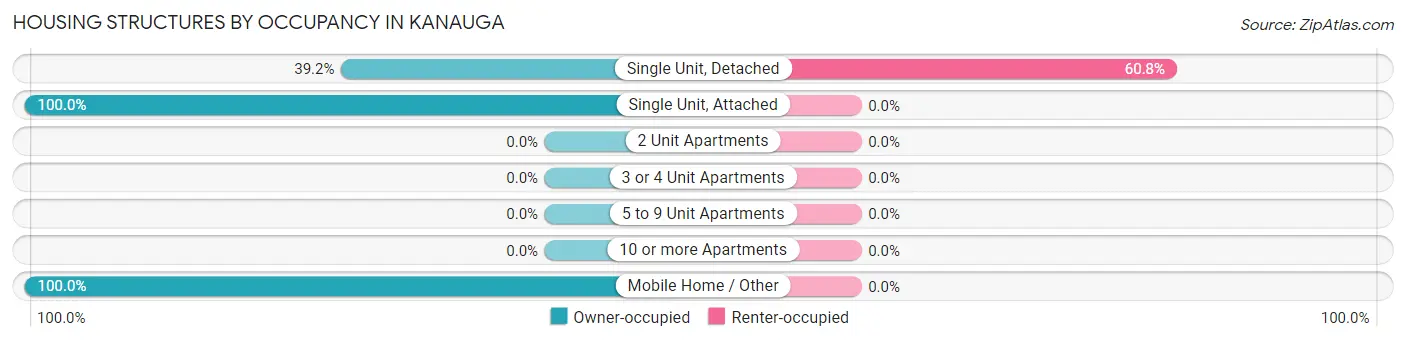
| Structure Type | Owner-occupied | Renter-occupied |
| Single Unit, Detached | 20 (39.2%) | 31 (60.8%) |
| Single Unit, Attached | 8 (100.0%) | 0 (0.0%) |
| 2 Unit Apartments | 0 (0.0%) | 0 (0.0%) |
| 3 or 4 Unit Apartments | 0 (0.0%) | 0 (0.0%) |
| 5 to 9 Unit Apartments | 0 (0.0%) | 0 (0.0%) |
| 10 or more Apartments | 0 (0.0%) | 0 (0.0%) |
| Mobile Home / Other | 22 (100.0%) | 0 (0.0%) |
| Total | 50 (61.7%) | 31 (38.3%) |
Housing Structures by Number of Rooms in Kanauga
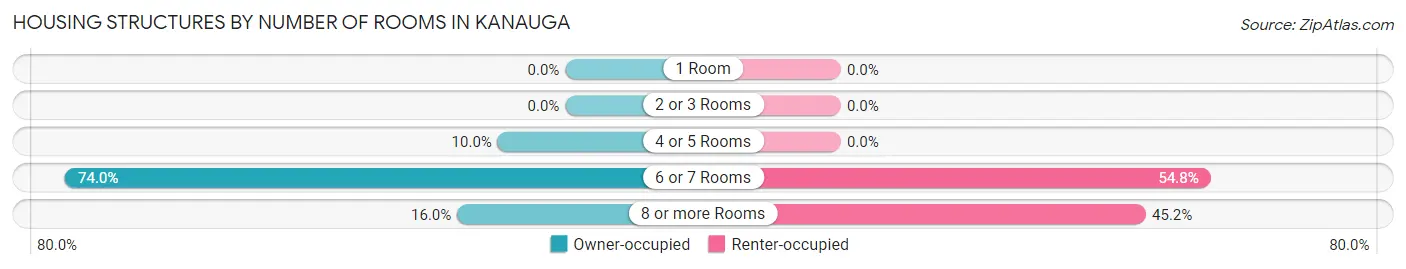
| Number of Rooms | Owner-occupied | Renter-occupied |
| 1 Room | 0 (0.0%) | 0 (0.0%) |
| 2 or 3 Rooms | 0 (0.0%) | 0 (0.0%) |
| 4 or 5 Rooms | 5 (10.0%) | 0 (0.0%) |
| 6 or 7 Rooms | 37 (74.0%) | 17 (54.8%) |
| 8 or more Rooms | 8 (16.0%) | 14 (45.2%) |
| Total | 50 (100.0%) | 31 (100.0%) |
Housing Structure by Heating Type in Kanauga
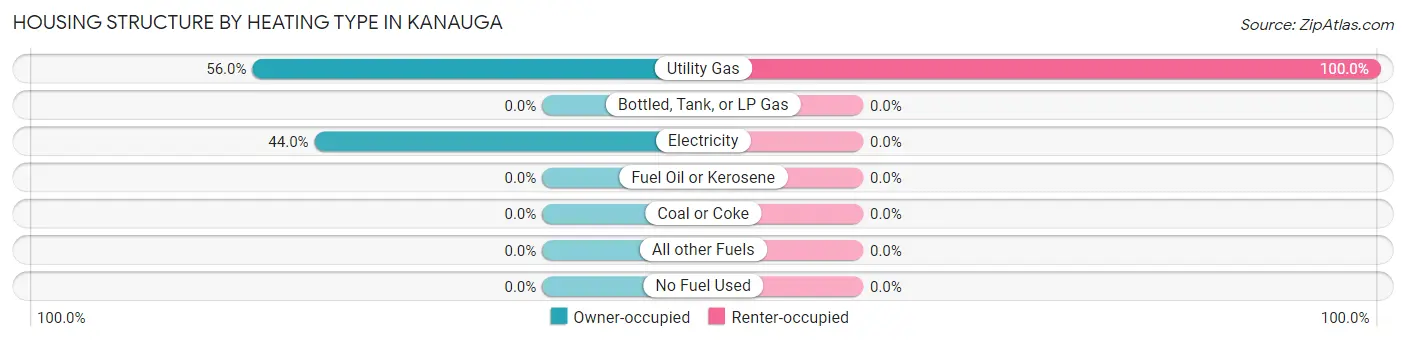
| Heating Type | Owner-occupied | Renter-occupied |
| Utility Gas | 28 (56.0%) | 31 (100.0%) |
| Bottled, Tank, or LP Gas | 0 (0.0%) | 0 (0.0%) |
| Electricity | 22 (44.0%) | 0 (0.0%) |
| Fuel Oil or Kerosene | 0 (0.0%) | 0 (0.0%) |
| Coal or Coke | 0 (0.0%) | 0 (0.0%) |
| All other Fuels | 0 (0.0%) | 0 (0.0%) |
| No Fuel Used | 0 (0.0%) | 0 (0.0%) |
| Total | 50 (100.0%) | 31 (100.0%) |
Household Vehicle Usage in Kanauga
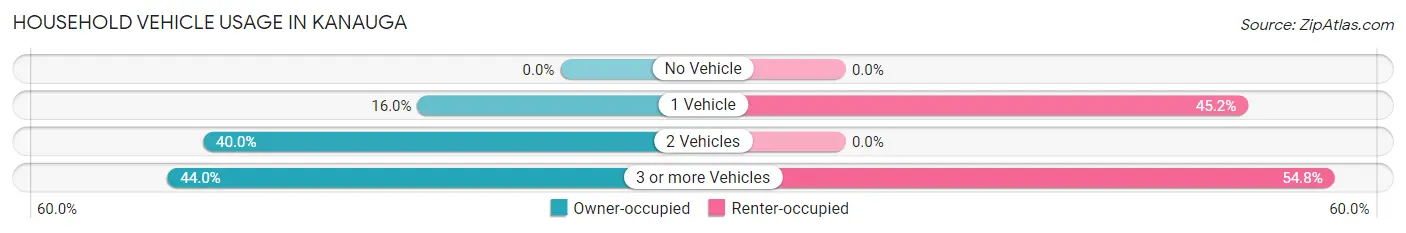
| Vehicles per Household | Owner-occupied | Renter-occupied |
| No Vehicle | 0 (0.0%) | 0 (0.0%) |
| 1 Vehicle | 8 (16.0%) | 14 (45.2%) |
| 2 Vehicles | 20 (40.0%) | 0 (0.0%) |
| 3 or more Vehicles | 22 (44.0%) | 17 (54.8%) |
| Total | 50 (100.0%) | 31 (100.0%) |
Real Estate & Mortgages in Kanauga
Real Estate and Mortgage Overview in Kanauga
| Characteristic | Without Mortgage | With Mortgage |
| Housing Units | 35 | 15 |
| Median Property Value | $9,999 | $0 |
| Median Household Income | $54,489 | $0 |
| Monthly Housing Costs | $457 | $0 |
| Real Estate Taxes | - | - |
Property Value by Mortgage Status in Kanauga
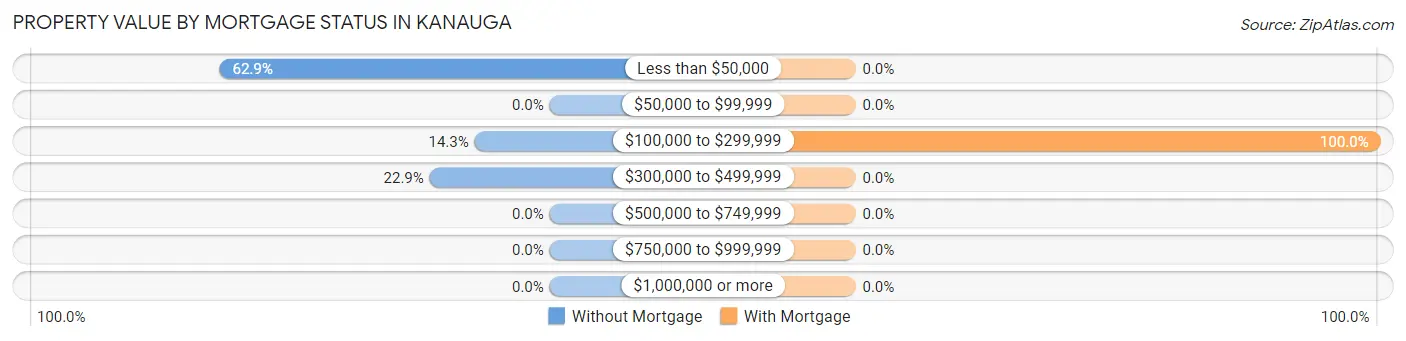
| Property Value | Without Mortgage | With Mortgage |
| Less than $50,000 | 22 (62.9%) | 0 (0.0%) |
| $50,000 to $99,999 | 0 (0.0%) | 0 (0.0%) |
| $100,000 to $299,999 | 5 (14.3%) | 15 (100.0%) |
| $300,000 to $499,999 | 8 (22.9%) | 0 (0.0%) |
| $500,000 to $749,999 | 0 (0.0%) | 0 (0.0%) |
| $750,000 to $999,999 | 0 (0.0%) | 0 (0.0%) |
| $1,000,000 or more | 0 (0.0%) | 0 (0.0%) |
| Total | 35 (100.0%) | 15 (100.0%) |
Household Income by Mortgage Status in Kanauga
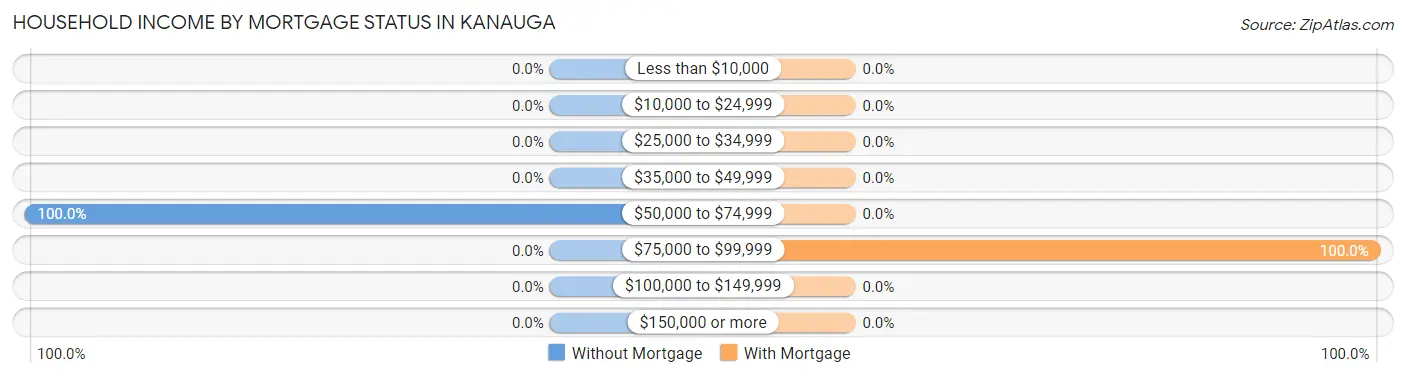
| Household Income | Without Mortgage | With Mortgage |
| Less than $10,000 | 0 (0.0%) | 0 (0.0%) |
| $10,000 to $24,999 | 0 (0.0%) | 0 (0.0%) |
| $25,000 to $34,999 | 0 (0.0%) | 0 (0.0%) |
| $35,000 to $49,999 | 0 (0.0%) | 0 (0.0%) |
| $50,000 to $74,999 | 35 (100.0%) | 0 (0.0%) |
| $75,000 to $99,999 | 0 (0.0%) | 15 (100.0%) |
| $100,000 to $149,999 | 0 (0.0%) | 0 (0.0%) |
| $150,000 or more | 0 (0.0%) | 0 (0.0%) |
| Total | 35 (100.0%) | 15 (100.0%) |
Property Value to Household Income Ratio in Kanauga
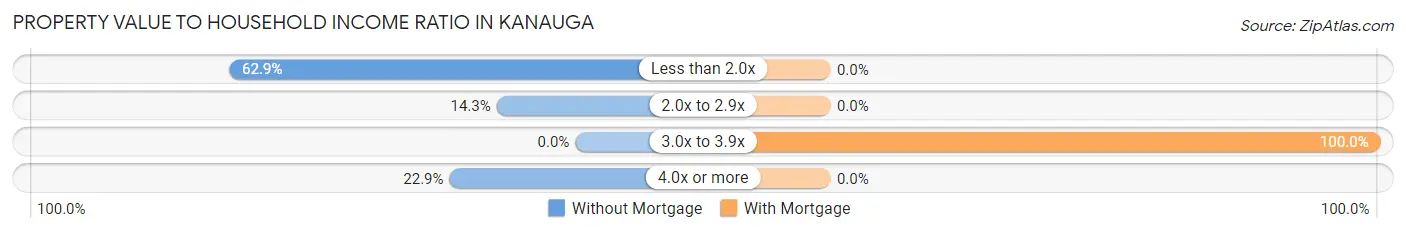
| Value-to-Income Ratio | Without Mortgage | With Mortgage |
| Less than 2.0x | 22 (62.9%) | 0 (0.0%) |
| 2.0x to 2.9x | 5 (14.3%) | 0 (0.0%) |
| 3.0x to 3.9x | 0 (0.0%) | 15 (100.0%) |
| 4.0x or more | 8 (22.9%) | 0 (0.0%) |
| Total | 35 (100.0%) | 15 (100.0%) |
Real Estate Taxes by Mortgage Status in Kanauga
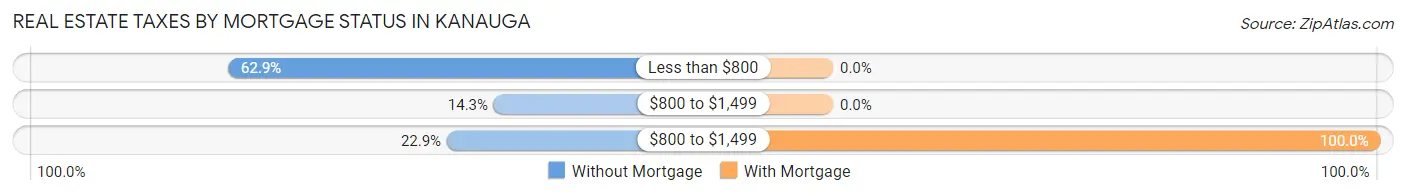
| Property Taxes | Without Mortgage | With Mortgage |
| Less than $800 | 22 (62.9%) | 0 (0.0%) |
| $800 to $1,499 | 5 (14.3%) | 0 (0.0%) |
| $800 to $1,499 | 8 (22.9%) | 15 (100.0%) |
| Total | 35 (100.0%) | 15 (100.0%) |
Health & Disability in Kanauga
Health Insurance Coverage by Age in Kanauga
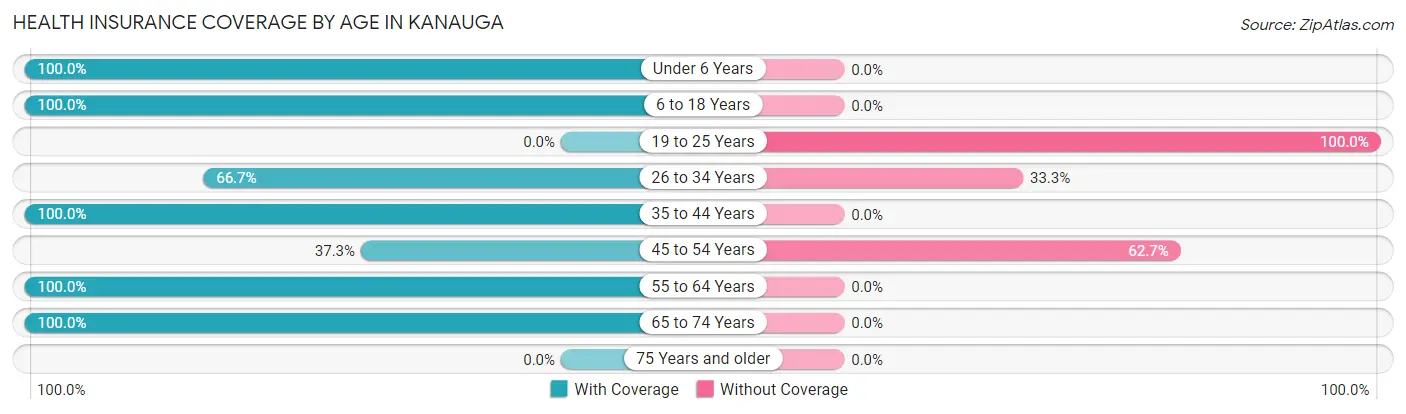
| Age Bracket | With Coverage | Without Coverage |
| Under 6 Years | 10 (100.0%) | 0 (0.0%) |
| 6 to 18 Years | 30 (100.0%) | 0 (0.0%) |
| 19 to 25 Years | 0 (0.0%) | 36 (100.0%) |
| 26 to 34 Years | 28 (66.7%) | 14 (33.3%) |
| 35 to 44 Years | 57 (100.0%) | 0 (0.0%) |
| 45 to 54 Years | 22 (37.3%) | 37 (62.7%) |
| 55 to 64 Years | 30 (100.0%) | 0 (0.0%) |
| 65 to 74 Years | 13 (100.0%) | 0 (0.0%) |
| 75 Years and older | 0 (0.0%) | 0 (0.0%) |
| Total | 190 (68.6%) | 87 (31.4%) |
Health Insurance Coverage by Citizenship Status in Kanauga
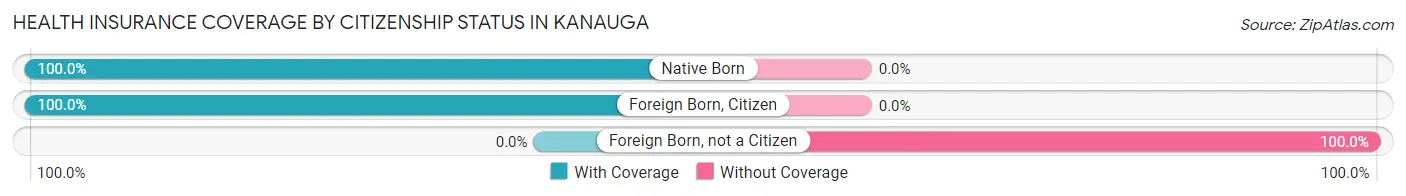
| Citizenship Status | With Coverage | Without Coverage |
| Native Born | 10 (100.0%) | 0 (0.0%) |
| Foreign Born, Citizen | 30 (100.0%) | 0 (0.0%) |
| Foreign Born, not a Citizen | 0 (0.0%) | 36 (100.0%) |
Health Insurance Coverage by Household Income in Kanauga
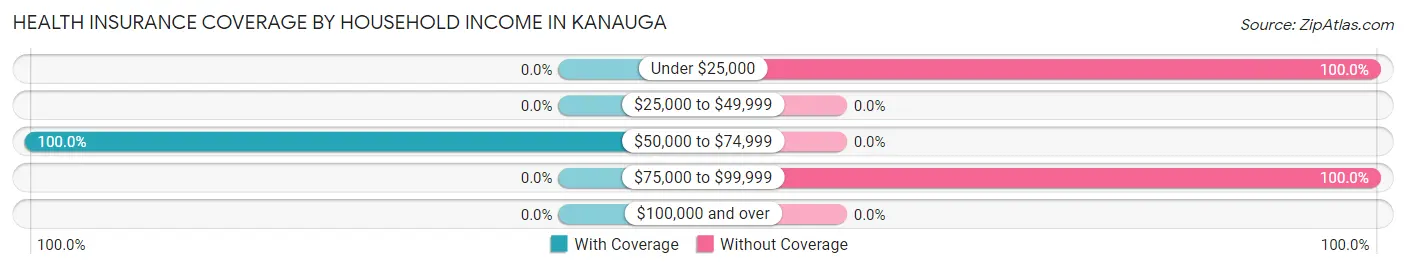
| Household Income | With Coverage | Without Coverage |
| Under $25,000 | 0 (0.0%) | 14 (100.0%) |
| $25,000 to $49,999 | 0 (0.0%) | 0 (0.0%) |
| $50,000 to $74,999 | 190 (100.0%) | 0 (0.0%) |
| $75,000 to $99,999 | 0 (0.0%) | 73 (100.0%) |
| $100,000 and over | 0 (0.0%) | 0 (0.0%) |
Public vs Private Health Insurance Coverage by Age in Kanauga
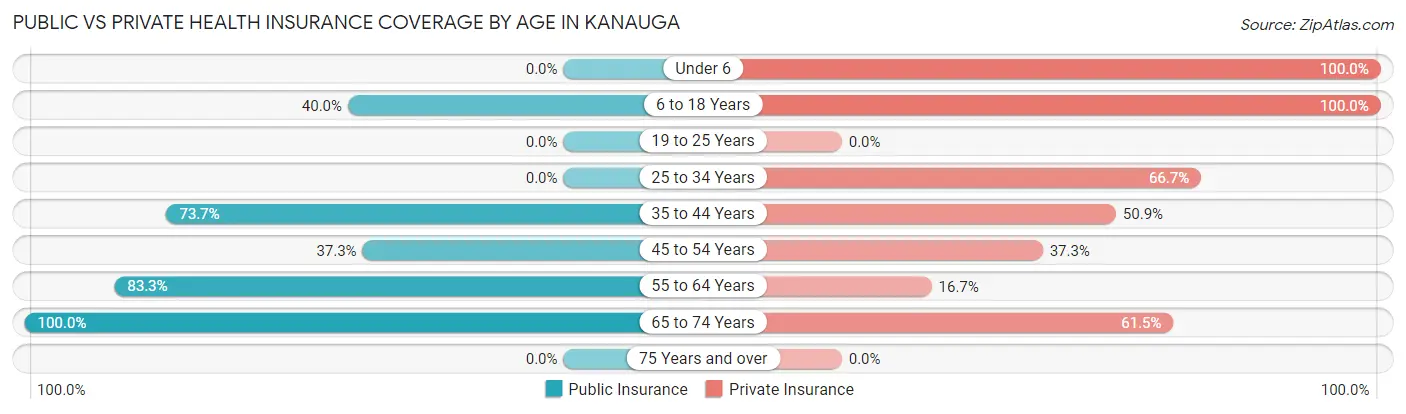
| Age Bracket | Public Insurance | Private Insurance |
| Under 6 | 0 (0.0%) | 10 (100.0%) |
| 6 to 18 Years | 12 (40.0%) | 30 (100.0%) |
| 19 to 25 Years | 0 (0.0%) | 0 (0.0%) |
| 25 to 34 Years | 0 (0.0%) | 28 (66.7%) |
| 35 to 44 Years | 42 (73.7%) | 29 (50.9%) |
| 45 to 54 Years | 22 (37.3%) | 22 (37.3%) |
| 55 to 64 Years | 25 (83.3%) | 5 (16.7%) |
| 65 to 74 Years | 13 (100.0%) | 8 (61.5%) |
| 75 Years and over | 0 (0.0%) | 0 (0.0%) |
| Total | 114 (41.2%) | 132 (47.6%) |
Disability Status by Sex by Age in Kanauga
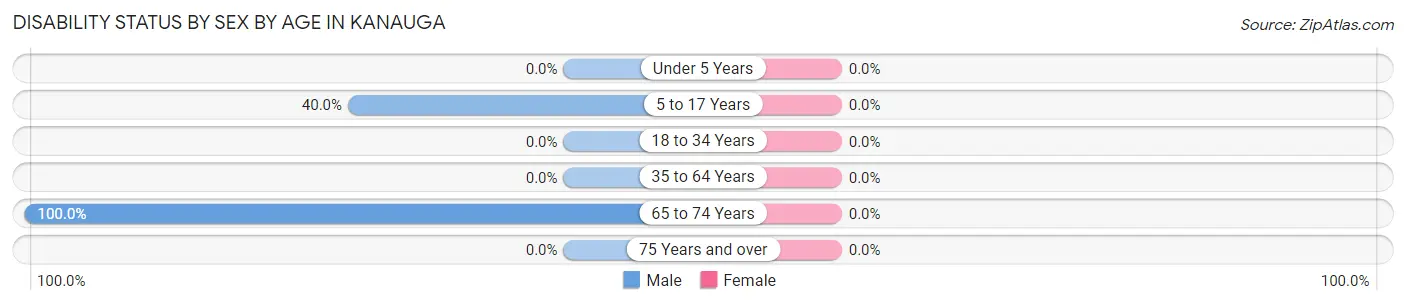
| Age Bracket | Male | Female |
| Under 5 Years | 0 (0.0%) | 0 (0.0%) |
| 5 to 17 Years | 12 (40.0%) | 0 (0.0%) |
| 18 to 34 Years | 0 (0.0%) | 0 (0.0%) |
| 35 to 64 Years | 0 (0.0%) | 0 (0.0%) |
| 65 to 74 Years | 5 (100.0%) | 0 (0.0%) |
| 75 Years and over | 0 (0.0%) | 0 (0.0%) |
Disability Class by Sex by Age in Kanauga
Disability Class: Hearing Difficulty
| Age Bracket | Male | Female |
| Under 5 Years | 0 (0.0%) | 0 (0.0%) |
| 5 to 17 Years | 0 (0.0%) | 0 (0.0%) |
| 18 to 34 Years | 0 (0.0%) | 0 (0.0%) |
| 35 to 64 Years | 0 (0.0%) | 0 (0.0%) |
| 65 to 74 Years | 0 (0.0%) | 0 (0.0%) |
| 75 Years and over | 0 (0.0%) | 0 (0.0%) |
Disability Class: Vision Difficulty
| Age Bracket | Male | Female |
| Under 5 Years | 0 (0.0%) | 0 (0.0%) |
| 5 to 17 Years | 0 (0.0%) | 0 (0.0%) |
| 18 to 34 Years | 0 (0.0%) | 0 (0.0%) |
| 35 to 64 Years | 0 (0.0%) | 0 (0.0%) |
| 65 to 74 Years | 0 (0.0%) | 0 (0.0%) |
| 75 Years and over | 0 (0.0%) | 0 (0.0%) |
Disability Class: Cognitive Difficulty
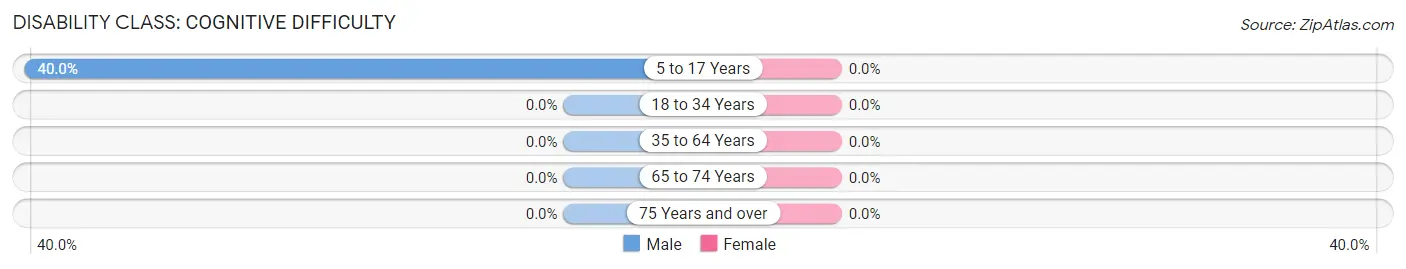
| Age Bracket | Male | Female |
| 5 to 17 Years | 12 (40.0%) | 0 (0.0%) |
| 18 to 34 Years | 0 (0.0%) | 0 (0.0%) |
| 35 to 64 Years | 0 (0.0%) | 0 (0.0%) |
| 65 to 74 Years | 0 (0.0%) | 0 (0.0%) |
| 75 Years and over | 0 (0.0%) | 0 (0.0%) |
Disability Class: Ambulatory Difficulty

| Age Bracket | Male | Female |
| 5 to 17 Years | 12 (40.0%) | 0 (0.0%) |
| 18 to 34 Years | 0 (0.0%) | 0 (0.0%) |
| 35 to 64 Years | 0 (0.0%) | 0 (0.0%) |
| 65 to 74 Years | 5 (100.0%) | 0 (0.0%) |
| 75 Years and over | 0 (0.0%) | 0 (0.0%) |
Disability Class: Self-Care Difficulty
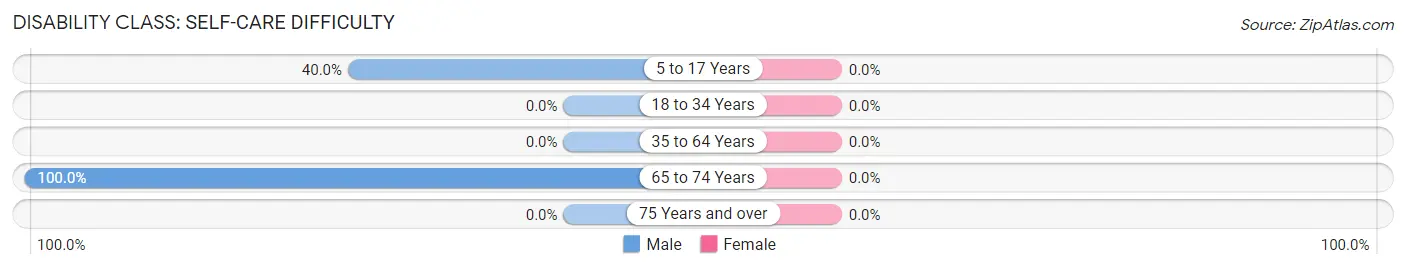
| Age Bracket | Male | Female |
| 5 to 17 Years | 12 (40.0%) | 0 (0.0%) |
| 18 to 34 Years | 0 (0.0%) | 0 (0.0%) |
| 35 to 64 Years | 0 (0.0%) | 0 (0.0%) |
| 65 to 74 Years | 5 (100.0%) | 0 (0.0%) |
| 75 Years and over | 0 (0.0%) | 0 (0.0%) |
Technology Access in Kanauga
Computing Device Access in Kanauga
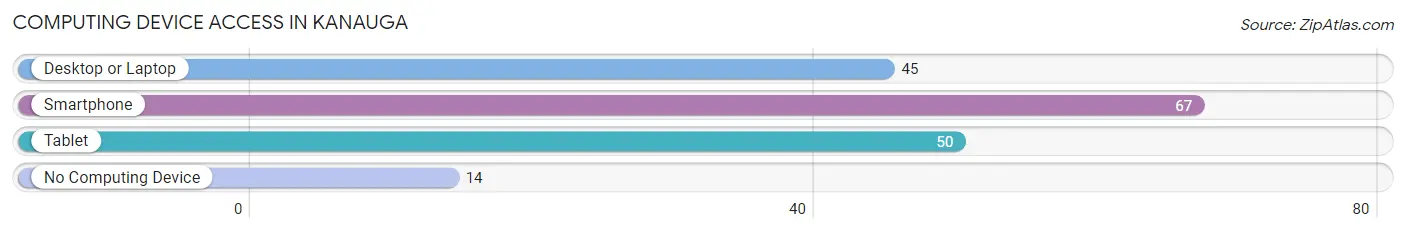
| Device Type | # Households | % Households |
| Desktop or Laptop | 45 | 55.6% |
| Smartphone | 67 | 82.7% |
| Tablet | 50 | 61.7% |
| No Computing Device | 14 | 17.3% |
| Total | 81 | 100.0% |
Internet Access in Kanauga
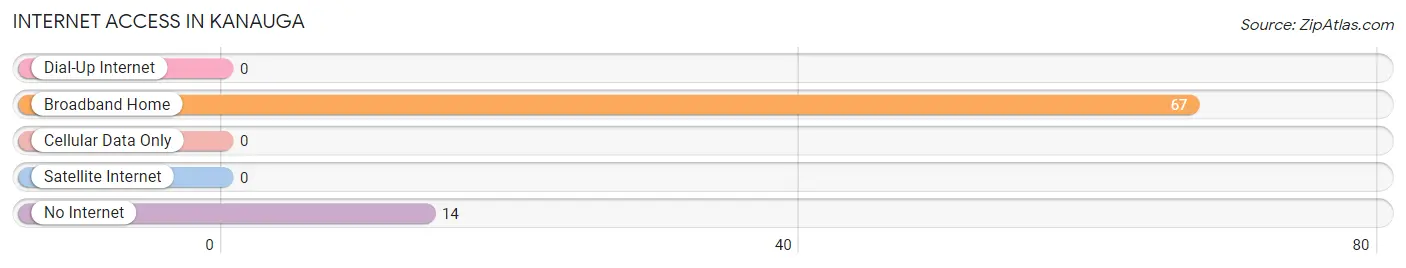
| Internet Type | # Households | % Households |
| Dial-Up Internet | 0 | 0.0% |
| Broadband Home | 67 | 82.7% |
| Cellular Data Only | 0 | 0.0% |
| Satellite Internet | 0 | 0.0% |
| No Internet | 14 | 17.3% |
| Total | 81 | 100.0% |
Kanauga Summary
Kanauga is a small village located in the southeastern corner of Ohio, in the Appalachian foothills of the Appalachian Mountains. It is situated in the county of Gallia, and is part of the Point Pleasant Micropolitan Statistical Area. The village has a population of approximately 1,000 people, and is located about 25 miles from the Ohio River.
History
Kanauga was founded in 1817 by a group of settlers from the nearby town of Gallipolis. The settlers were looking for a place to settle and farm, and chose the area due to its fertile soil and abundant natural resources. The village was named after the Kanauga River, which runs through the area. The river was named after the Native American tribe that lived in the area prior to the arrival of the settlers.
The village grew slowly over the years, and by the mid-1800s, it had become a thriving agricultural community. The village was home to several mills, a blacksmith, a general store, and a post office. The village also had a school, which was established in 1845.
In the late 1800s, the village began to experience a decline in population due to the decline of the local agricultural industry. This decline was further exacerbated by the Great Depression, which caused many of the villagers to leave in search of work elsewhere. By the 1950s, the population had dropped to just over 500 people.
Geography
Kanauga is located in the southeastern corner of Ohio, in the Appalachian foothills of the Appalachian Mountains. The village is situated in the county of Gallia, and is part of the Point Pleasant Micropolitan Statistical Area. The village is located about 25 miles from the Ohio River.
The village is situated on a plateau, with the Kanauga River running through it. The village is surrounded by rolling hills and forests, and is home to several small lakes and streams. The climate in the area is generally mild, with temperatures ranging from the mid-30s in the winter to the mid-80s in the summer.
Economy
Kanauga is a small, rural village, and the economy is largely based on agriculture. The village is home to several small farms, which produce a variety of crops, including corn, soybeans, wheat, and hay. The village also has a few small businesses, including a general store, a post office, and a few restaurants.
The village is also home to a few small manufacturing companies, which produce a variety of products, including furniture, clothing, and automotive parts. The village also has a few small service businesses, such as auto repair shops and a gas station.
Demographics
As of the 2010 census, the population of Kanauga was 1,000 people. The racial makeup of the village was 97.2% White, 0.7% African American, 0.3% Native American, 0.2% Asian, and 1.6% from other races. The median household income in the village was $35,000, and the median age was 40 years.
Kanauga is a small, rural village, and the population is largely made up of families. The village is home to several churches, and the community is close-knit and supportive. The village is also home to a few small businesses, which provide employment opportunities for the residents.
Common Questions
What is the Total Population of Kanauga?
Total Population of Kanauga is 277.
What is the Total Male Population of Kanauga?
Total Male Population of Kanauga is 166.
What is the Total Female Population of Kanauga?
Total Female Population of Kanauga is 111.
What is the Ratio of Males per 100 Females in Kanauga?
There are 149.55 Males per 100 Females in Kanauga.
What is the Ratio of Females per 100 Males in Kanauga?
There are 66.87 Females per 100 Males in Kanauga.
What is the Median Population Age in Kanauga?
Median Population Age in Kanauga is 36.7 Years.
What is the Average Family Size in Kanauga
Average Family Size in Kanauga is 4.3 People.
What is the Average Household Size in Kanauga
Average Household Size in Kanauga is 3.4 People.
What is Per Capita Income in Kanauga?
Per Capita income in Kanauga is $19,389.
What is the Median Family Income in Kanauga?
Median Family Income in Kanauga is $65,417.
What is the Median Household income in Kanauga?
Median Household Income in Kanauga is $62,250.
What is Inequality or Gini Index in Kanauga?
Inequality or Gini Index in Kanauga is 0.19.
How Large is the Labor Force in Kanauga?
There are 142 People in the Labor Forcein in Kanauga.
What is the Percentage of People in the Labor Force in Kanauga?
59.9% of People are in the Labor Force in Kanauga.