Darrtown, OH
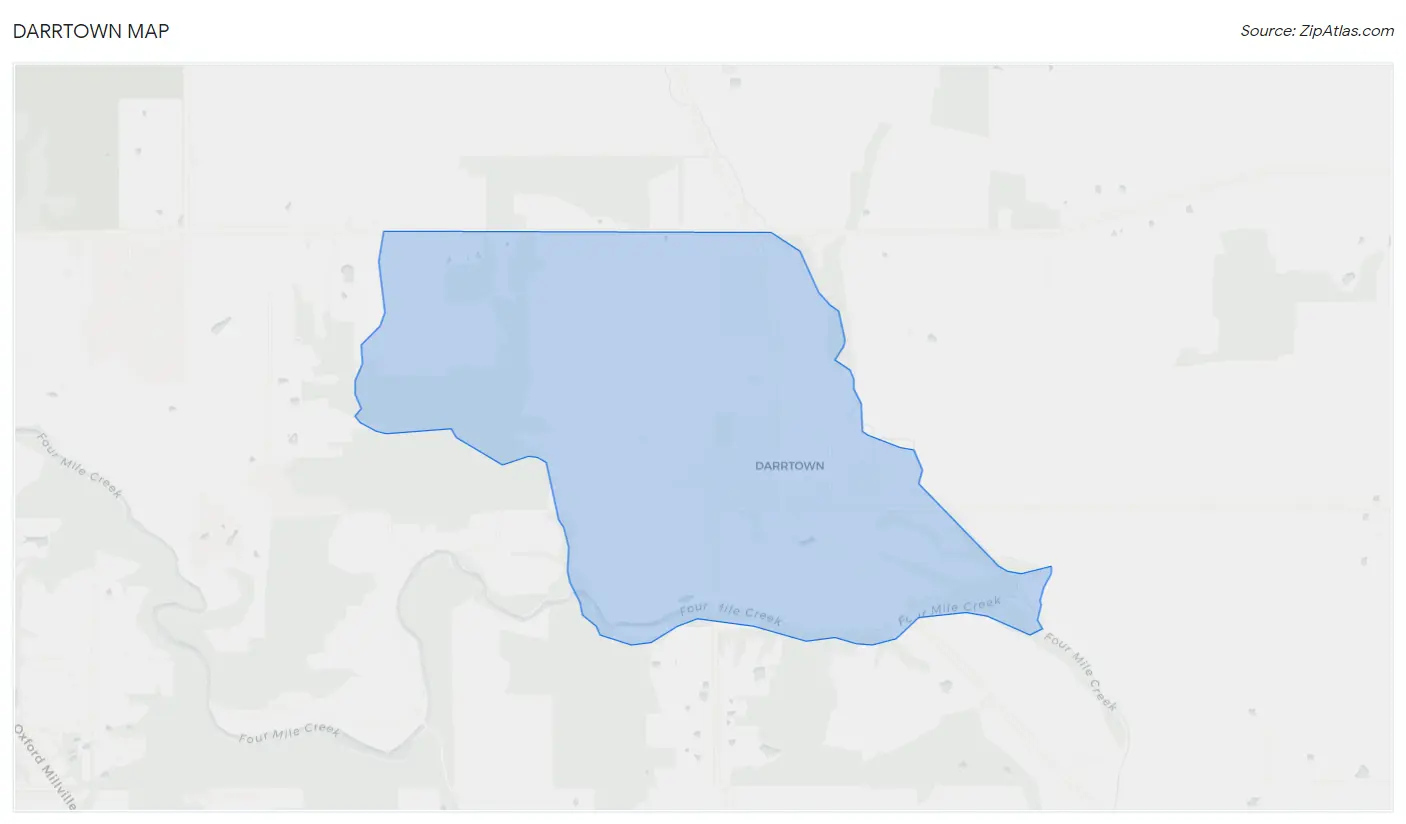
Darrtown Map
Darrtown Overview
679
TOTAL POPULATION
376
MALE POPULATION
303
FEMALE POPULATION
124.09
MALES / 100 FEMALES
80.59
FEMALES / 100 MALES
48.4
MEDIAN AGE
3.3
AVG FAMILY SIZE
2.3
AVG HOUSEHOLD SIZE
$30,277
PER CAPITA INCOME
$77,941
AVG FAMILY INCOME
$75,197
AVG HOUSEHOLD INCOME
7.5%
WAGE / INCOME GAP [ % ]
92.5¢/ $1
WAGE / INCOME GAP [ $ ]
0.27
INEQUALITY / GINI INDEX
363
LABOR FORCE [ PEOPLE ]
62.8%
PERCENT IN LABOR FORCE
Race in Darrtown
The most populous races in Darrtown are White / Caucasian (666 | 98.1%), and Two or more Races (13 | 1.9%).
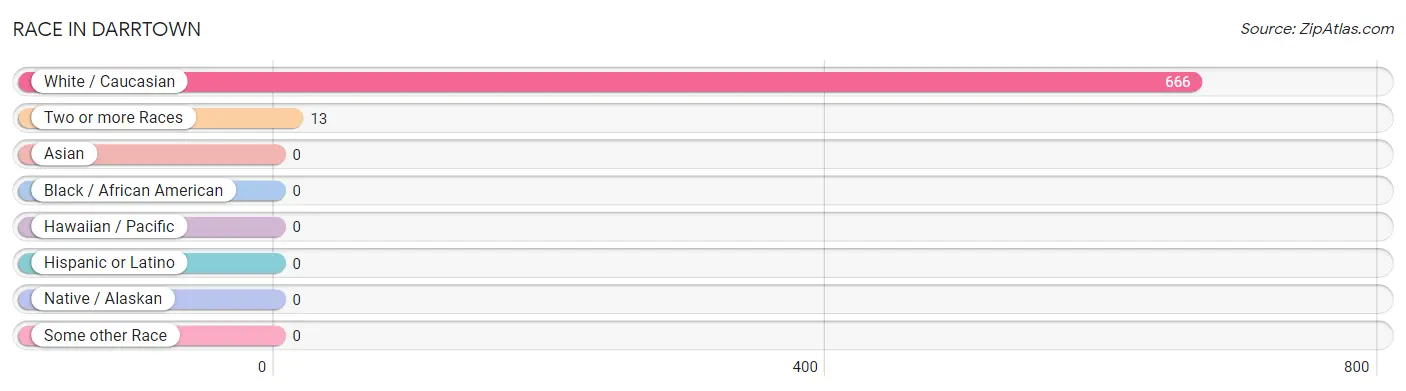
| Race | # Population | % Population |
| Asian | 0 | 0.0% |
| Black / African American | 0 | 0.0% |
| Hawaiian / Pacific | 0 | 0.0% |
| Hispanic or Latino | 0 | 0.0% |
| Native / Alaskan | 0 | 0.0% |
| White / Caucasian | 666 | 98.1% |
| Two or more Races | 13 | 1.9% |
| Some other Race | 0 | 0.0% |
| Total | 679 | 100.0% |
Ancestry in Darrtown
The most populous ancestries reported in Darrtown are German (227 | 33.4%), European (72 | 10.6%), Ukrainian (33 | 4.9%), Yugoslavian (33 | 4.9%), and Scottish (31 | 4.6%), together accounting for 58.3% of all Darrtown residents.
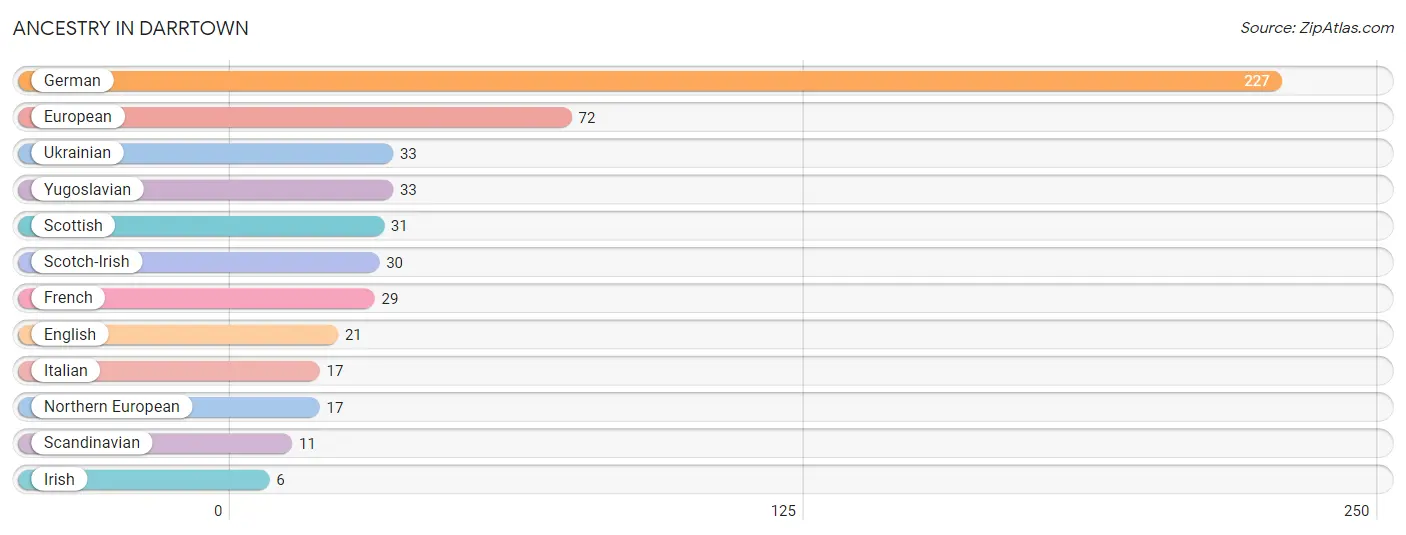
| Ancestry | # Population | % Population |
| English | 21 | 3.1% |
| European | 72 | 10.6% |
| French | 29 | 4.3% |
| German | 227 | 33.4% |
| Irish | 6 | 0.9% |
| Italian | 17 | 2.5% |
| Northern European | 17 | 2.5% |
| Scandinavian | 11 | 1.6% |
| Scotch-Irish | 30 | 4.4% |
| Scottish | 31 | 4.6% |
| Ukrainian | 33 | 4.9% |
| Yugoslavian | 33 | 4.9% | View All 12 Rows |
Immigrants in Darrtown

| Immigration Origin | # Population | % Population | View All 0 Rows |
Sex and Age in Darrtown
Sex and Age in Darrtown
The most populous age groups in Darrtown are 60 to 64 Years (93 | 24.7%) for men and 60 to 64 Years (64 | 21.1%) for women.
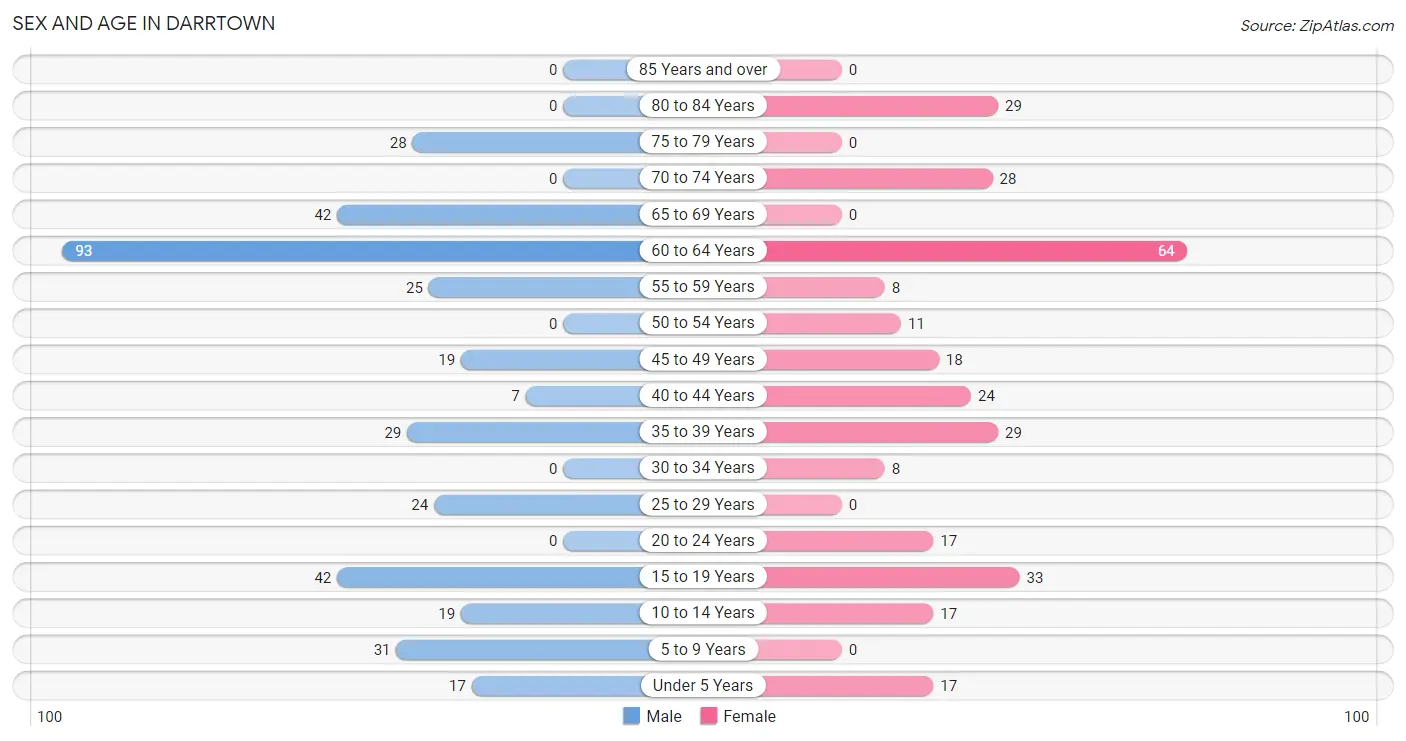
| Age Bracket | Male | Female |
| Under 5 Years | 17 (4.5%) | 17 (5.6%) |
| 5 to 9 Years | 31 (8.2%) | 0 (0.0%) |
| 10 to 14 Years | 19 (5.1%) | 17 (5.6%) |
| 15 to 19 Years | 42 (11.2%) | 33 (10.9%) |
| 20 to 24 Years | 0 (0.0%) | 17 (5.6%) |
| 25 to 29 Years | 24 (6.4%) | 0 (0.0%) |
| 30 to 34 Years | 0 (0.0%) | 8 (2.6%) |
| 35 to 39 Years | 29 (7.7%) | 29 (9.6%) |
| 40 to 44 Years | 7 (1.9%) | 24 (7.9%) |
| 45 to 49 Years | 19 (5.1%) | 18 (5.9%) |
| 50 to 54 Years | 0 (0.0%) | 11 (3.6%) |
| 55 to 59 Years | 25 (6.7%) | 8 (2.6%) |
| 60 to 64 Years | 93 (24.7%) | 64 (21.1%) |
| 65 to 69 Years | 42 (11.2%) | 0 (0.0%) |
| 70 to 74 Years | 0 (0.0%) | 28 (9.2%) |
| 75 to 79 Years | 28 (7.4%) | 0 (0.0%) |
| 80 to 84 Years | 0 (0.0%) | 29 (9.6%) |
| 85 Years and over | 0 (0.0%) | 0 (0.0%) |
| Total | 376 (100.0%) | 303 (100.0%) |
Families and Households in Darrtown
Median Family Size in Darrtown
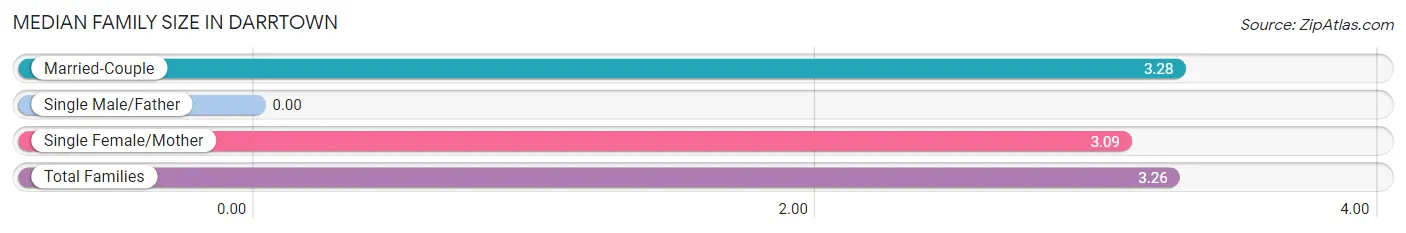
| Family Type | # Families | Family Size |
| Married-Couple | 148 (87.1%) | 3.28 |
| Single Male/Father | 0 (0.0%) | - |
| Single Female/Mother | 22 (12.9%) | 3.09 |
| Total Families | 170 (100.0%) | 3.26 |
Median Household Size in Darrtown
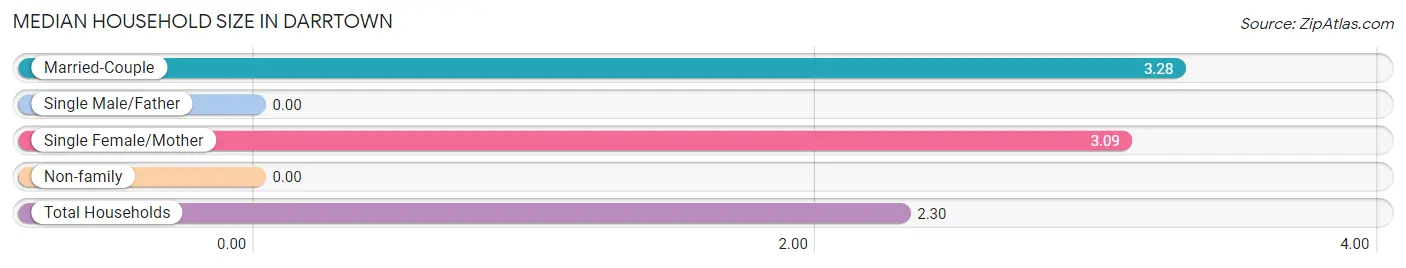
| Household Type | # Households | Household Size |
| Married-Couple | 148 (50.2%) | 3.28 |
| Single Male/Father | 0 (0.0%) | - |
| Single Female/Mother | 22 (7.5%) | 3.09 |
| Non-family | 125 (42.4%) | - |
| Total Households | 295 (100.0%) | 2.30 |
Household Size by Marriage Status in Darrtown
Out of a total of 295 households in Darrtown, 170 (57.6%) are family households, while 125 (42.4%) are nonfamily households. The most numerous type of family households are 3-person households, comprising 65, and the most common type of nonfamily households are 1-person households, comprising 125.
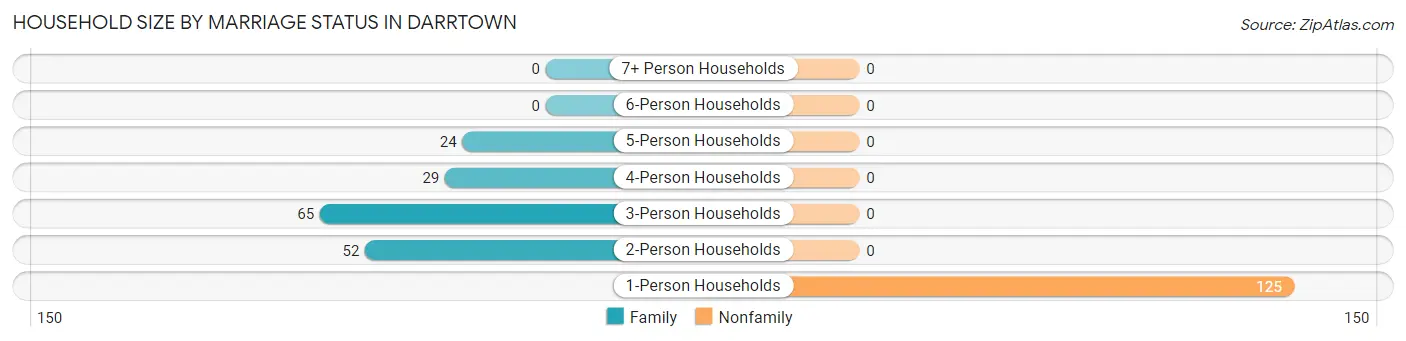
| Household Size | Family Households | Nonfamily Households |
| 1-Person Households | - | 125 (42.4%) |
| 2-Person Households | 52 (17.6%) | 0 (0.0%) |
| 3-Person Households | 65 (22.0%) | 0 (0.0%) |
| 4-Person Households | 29 (9.8%) | 0 (0.0%) |
| 5-Person Households | 24 (8.1%) | 0 (0.0%) |
| 6-Person Households | 0 (0.0%) | 0 (0.0%) |
| 7+ Person Households | 0 (0.0%) | 0 (0.0%) |
| Total | 170 (57.6%) | 125 (42.4%) |
Female Fertility in Darrtown
Fertility by Age in Darrtown
| Age Bracket | Women with Births | Births / 1,000 Women |
| 15 to 19 years | 0 (0.0%) | 0.0 |
| 20 to 34 years | 0 (0.0%) | 0.0 |
| 35 to 50 years | 0 (0.0%) | 0.0 |
| Total | 0 (0.0%) | 0.0 |
Fertility by Age by Marriage Status in Darrtown
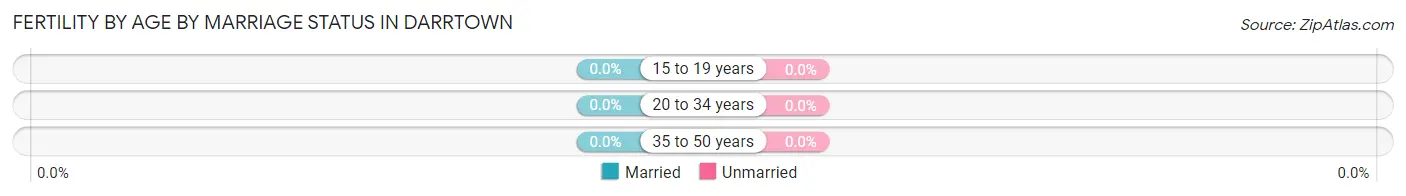
| Age Bracket | Married | Unmarried |
| 15 to 19 years | 0 (0.0%) | 0 (0.0%) |
| 20 to 34 years | 0 (0.0%) | 0 (0.0%) |
| 35 to 50 years | 0 (0.0%) | 0 (0.0%) |
| Total | 0 (0.0%) | 0 (0.0%) |
Fertility by Education in Darrtown
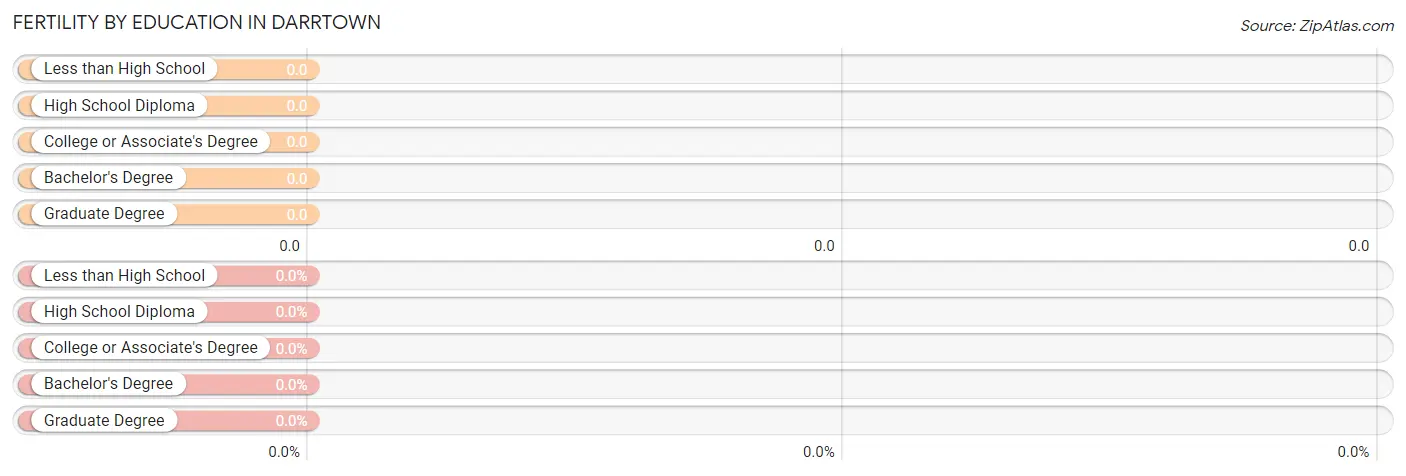
| Educational Attainment | Women with Births | Births / 1,000 Women |
| Less than High School | 0 (0.0%) | 0.0 |
| High School Diploma | 0 (0.0%) | 0.0 |
| College or Associate's Degree | 0 (0.0%) | 0.0 |
| Bachelor's Degree | 0 (0.0%) | 0.0 |
| Graduate Degree | 0 (0.0%) | 0.0 |
| Total | 0 (0.0%) | 0.0 |
Fertility by Education by Marriage Status in Darrtown
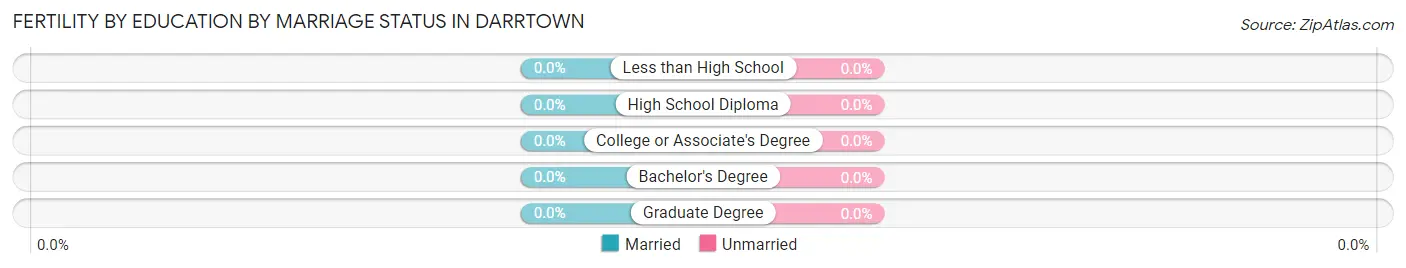
| Educational Attainment | Married | Unmarried |
| Less than High School | 0 (0.0%) | 0 (0.0%) |
| High School Diploma | 0 (0.0%) | 0 (0.0%) |
| College or Associate's Degree | 0 (0.0%) | 0 (0.0%) |
| Bachelor's Degree | 0 (0.0%) | 0 (0.0%) |
| Graduate Degree | 0 (0.0%) | 0 (0.0%) |
| Total | 0 (0.0%) | 0 (0.0%) |
Income in Darrtown
Income Overview in Darrtown
Per Capita Income in Darrtown is $30,277, while median incomes of families and households are $77,941 and $75,197 respectively.
| Characteristic | Number | Measure |
| Per Capita Income | 679 | $30,277 |
| Median Family Income | 170 | $77,941 |
| Mean Family Income | 170 | $77,039 |
| Median Household Income | 295 | $75,197 |
| Mean Household Income | 295 | $68,616 |
| Income Deficit | 170 | $0 |
| Wage / Income Gap (%) | 679 | 7.54% |
| Wage / Income Gap ($) | 679 | 92.46¢ per $1 |
| Gini / Inequality Index | 679 | 0.27 |
Earnings by Sex in Darrtown
Average Earnings in Darrtown are $42,750, $43,015 for men and $39,773 for women, a difference of 7.5%.
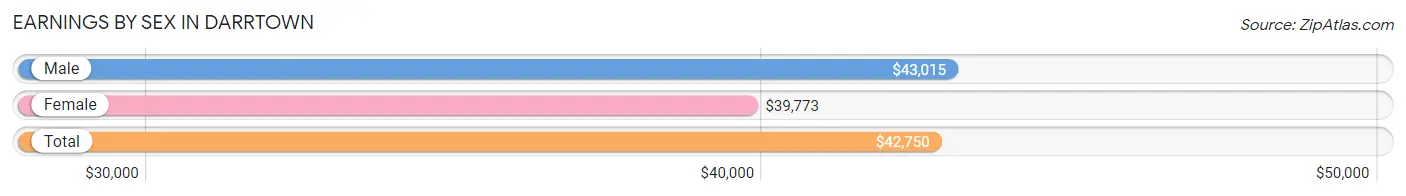
| Sex | Number | Average Earnings |
| Male | 267 (62.8%) | $43,015 |
| Female | 158 (37.2%) | $39,773 |
| Total | 425 (100.0%) | $42,750 |
Earnings by Sex by Income Bracket in Darrtown
The most common earnings brackets in Darrtown are $75,000 to $99,999 for men (68 | 25.5%) and $2,500 to $4,999 for women (26 | 16.5%).
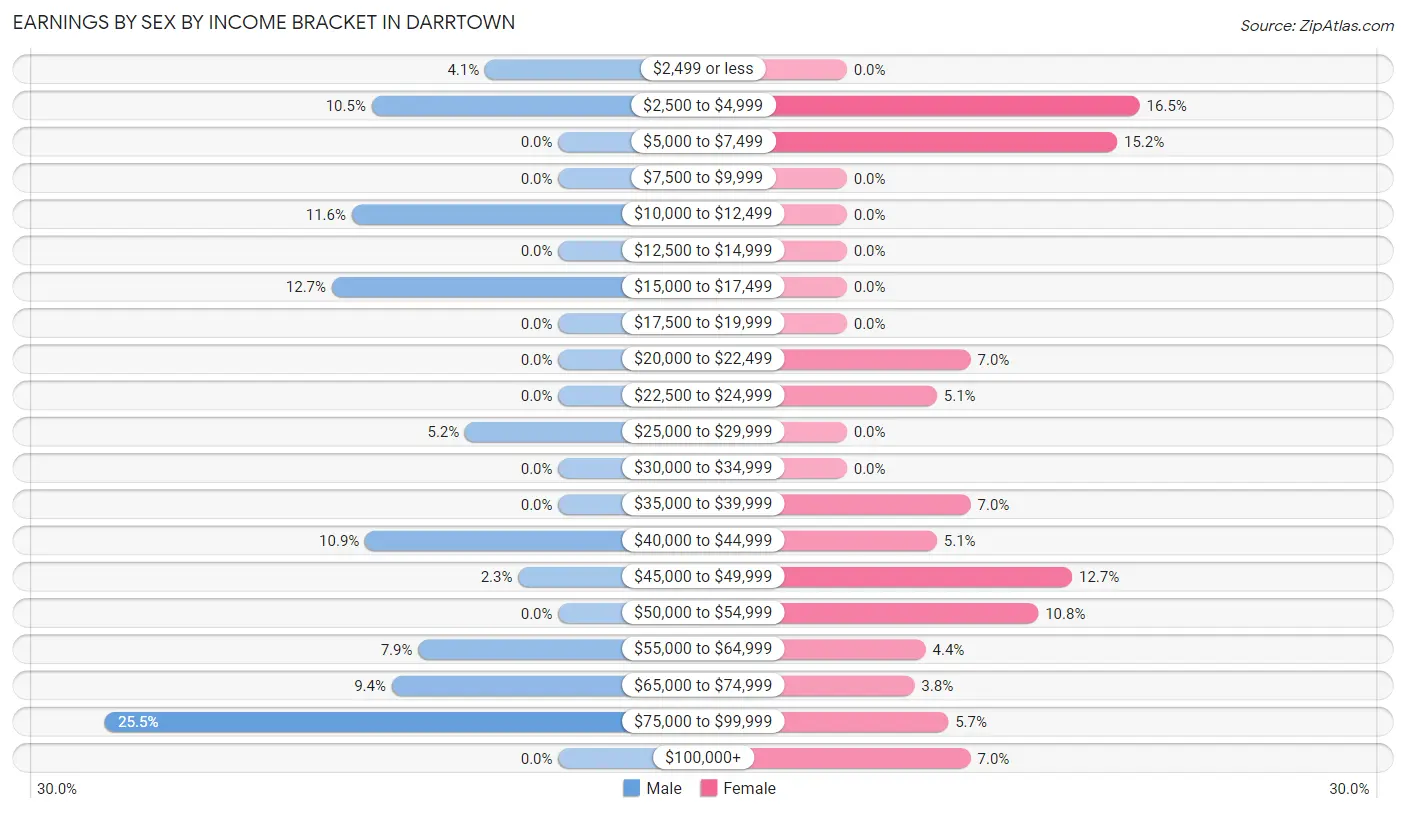
| Income | Male | Female |
| $2,499 or less | 11 (4.1%) | 0 (0.0%) |
| $2,500 to $4,999 | 28 (10.5%) | 26 (16.5%) |
| $5,000 to $7,499 | 0 (0.0%) | 24 (15.2%) |
| $7,500 to $9,999 | 0 (0.0%) | 0 (0.0%) |
| $10,000 to $12,499 | 31 (11.6%) | 0 (0.0%) |
| $12,500 to $14,999 | 0 (0.0%) | 0 (0.0%) |
| $15,000 to $17,499 | 34 (12.7%) | 0 (0.0%) |
| $17,500 to $19,999 | 0 (0.0%) | 0 (0.0%) |
| $20,000 to $22,499 | 0 (0.0%) | 11 (7.0%) |
| $22,500 to $24,999 | 0 (0.0%) | 8 (5.1%) |
| $25,000 to $29,999 | 14 (5.2%) | 0 (0.0%) |
| $30,000 to $34,999 | 0 (0.0%) | 0 (0.0%) |
| $35,000 to $39,999 | 0 (0.0%) | 11 (7.0%) |
| $40,000 to $44,999 | 29 (10.9%) | 8 (5.1%) |
| $45,000 to $49,999 | 6 (2.2%) | 20 (12.7%) |
| $50,000 to $54,999 | 0 (0.0%) | 17 (10.8%) |
| $55,000 to $64,999 | 21 (7.9%) | 7 (4.4%) |
| $65,000 to $74,999 | 25 (9.4%) | 6 (3.8%) |
| $75,000 to $99,999 | 68 (25.5%) | 9 (5.7%) |
| $100,000+ | 0 (0.0%) | 11 (7.0%) |
| Total | 267 (100.0%) | 158 (100.0%) |
Earnings by Sex by Educational Attainment in Darrtown
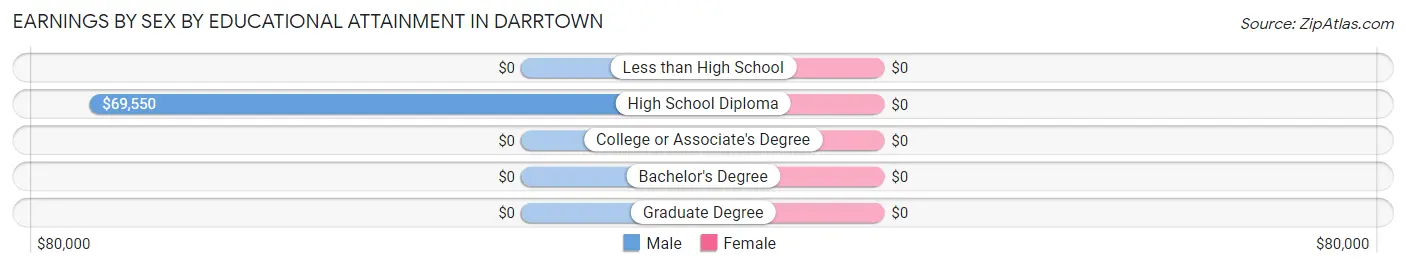
| Educational Attainment | Male Income | Female Income |
| Less than High School | - | - |
| High School Diploma | $69,550 | $0 |
| College or Associate's Degree | - | - |
| Bachelor's Degree | - | - |
| Graduate Degree | - | - |
| Total | $55,179 | $39,091 |
Family Income in Darrtown
Family Income Brackets in Darrtown
According to the Darrtown family income data, there are 49 families falling into the $75,000 to $99,999 income range, which is the most common income bracket and makes up 28.8% of all families.
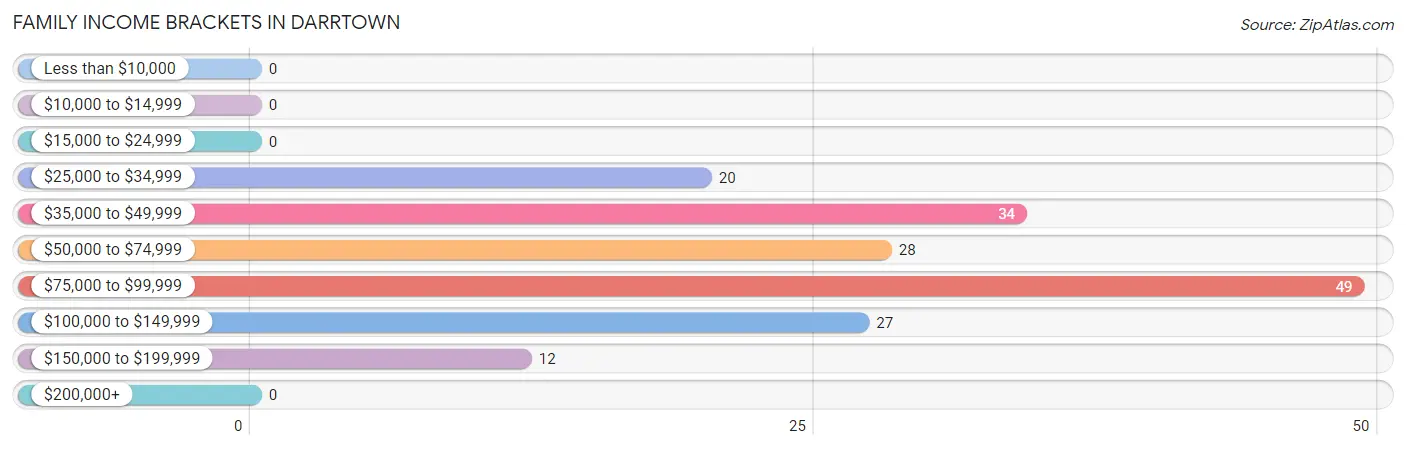
| Income Bracket | # Families | % Families |
| Less than $10,000 | 0 | 0.0% |
| $10,000 to $14,999 | 0 | 0.0% |
| $15,000 to $24,999 | 0 | 0.0% |
| $25,000 to $34,999 | 20 | 11.8% |
| $35,000 to $49,999 | 34 | 20.0% |
| $50,000 to $74,999 | 28 | 16.5% |
| $75,000 to $99,999 | 49 | 28.8% |
| $100,000 to $149,999 | 27 | 15.9% |
| $150,000 to $199,999 | 12 | 7.1% |
| $200,000+ | 0 | 0.0% |
Family Income by Famaliy Size in Darrtown
2-person families (52 | 30.6%) account for the highest median family income in Darrtown with $90,000 per family, while 2-person families (52 | 30.6%) have the highest median income of $45,000 per family member.
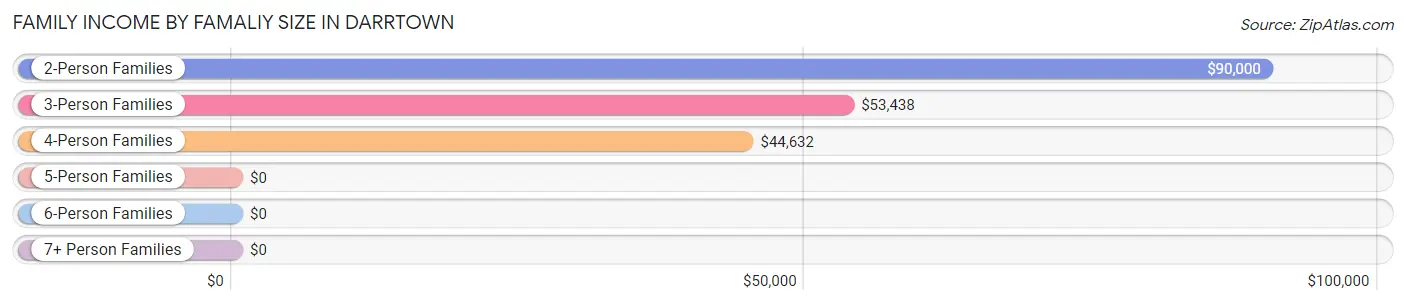
| Income Bracket | # Families | Median Income |
| 2-Person Families | 52 (30.6%) | $90,000 |
| 3-Person Families | 65 (38.2%) | $53,438 |
| 4-Person Families | 29 (17.1%) | $44,632 |
| 5-Person Families | 24 (14.1%) | $0 |
| 6-Person Families | 0 (0.0%) | $0 |
| 7+ Person Families | 0 (0.0%) | $0 |
| Total | 170 (100.0%) | $77,941 |
Family Income by Number of Earners in Darrtown
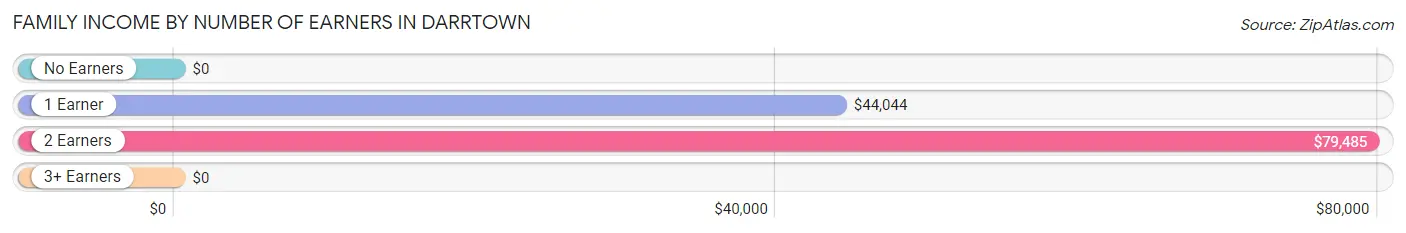
| Number of Earners | # Families | Median Income |
| No Earners | 9 (5.3%) | $0 |
| 1 Earner | 43 (25.3%) | $44,044 |
| 2 Earners | 83 (48.8%) | $79,485 |
| 3+ Earners | 35 (20.6%) | $0 |
| Total | 170 (100.0%) | $77,941 |
Household Income in Darrtown
Household Income Brackets in Darrtown
With 110 households falling in the category, the $75,000 to $99,999 income range is the most frequent in Darrtown, accounting for 37.3% of all households.
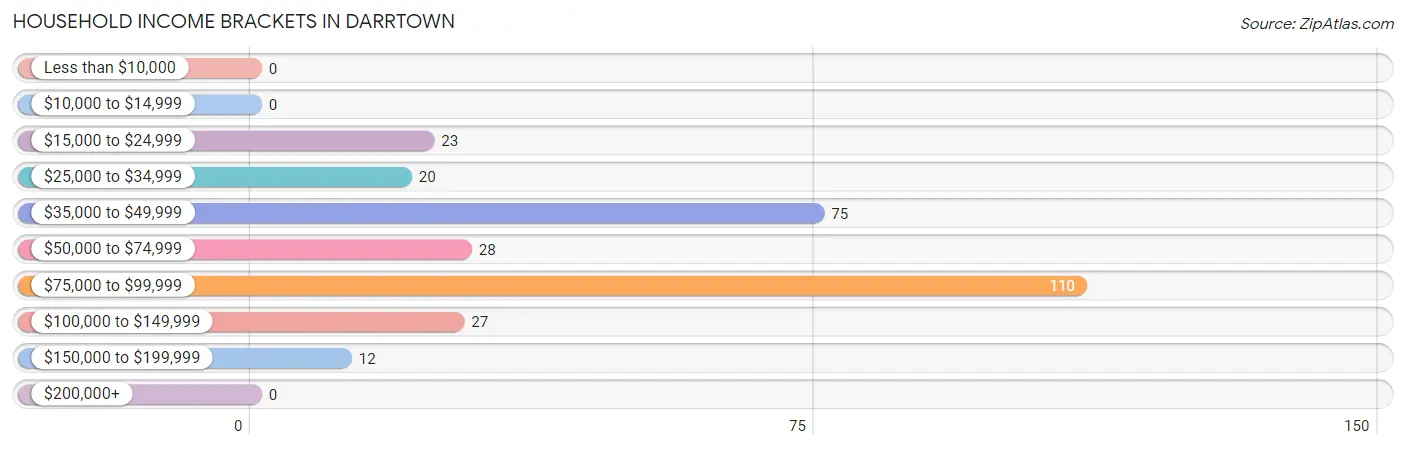
| Income Bracket | # Households | % Households |
| Less than $10,000 | 0 | 0.0% |
| $10,000 to $14,999 | 0 | 0.0% |
| $15,000 to $24,999 | 23 | 7.8% |
| $25,000 to $34,999 | 20 | 6.8% |
| $35,000 to $49,999 | 75 | 25.4% |
| $50,000 to $74,999 | 28 | 9.5% |
| $75,000 to $99,999 | 110 | 37.3% |
| $100,000 to $149,999 | 27 | 9.2% |
| $150,000 to $199,999 | 12 | 4.1% |
| $200,000+ | 0 | 0.0% |
Household Income by Householder Age in Darrtown
The median household income in Darrtown is $75,197, with the highest median household income of $95,859 found in the 25 to 44 years age bracket for the primary householder. A total of 68 households (23.1%) fall into this category. Meanwhile, the 15 to 24 years age bracket for the primary householder has the lowest median household income of $0, with 17 households (5.8%) in this group.
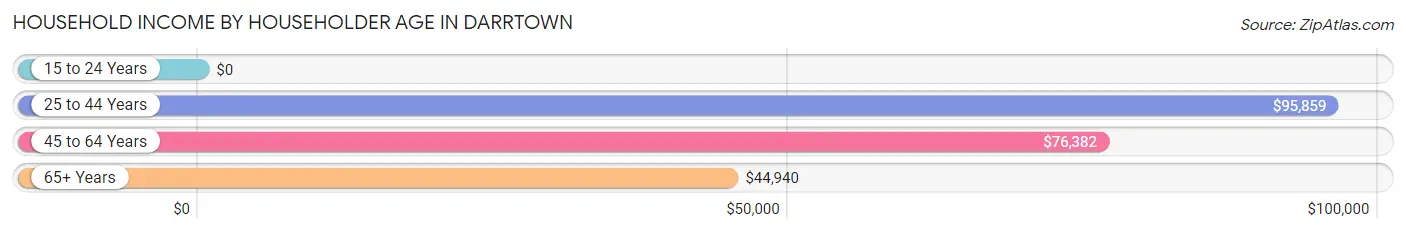
| Income Bracket | # Households | Median Income |
| 15 to 24 Years | 17 (5.8%) | $0 |
| 25 to 44 Years | 68 (23.1%) | $95,859 |
| 45 to 64 Years | 153 (51.9%) | $76,382 |
| 65+ Years | 57 (19.3%) | $44,940 |
| Total | 295 (100.0%) | $75,197 |
Poverty in Darrtown
Income Below Poverty by Sex and Age in Darrtown
| Age Bracket | Male | Female |
| Under 5 Years | 0 (0.0%) | 0 (0.0%) |
| 5 Years | 0 (0.0%) | 0 (0.0%) |
| 6 to 11 Years | 0 (0.0%) | 0 (0.0%) |
| 12 to 14 Years | 0 (0.0%) | 0 (0.0%) |
| 15 Years | 0 (0.0%) | 0 (0.0%) |
| 16 and 17 Years | 0 (0.0%) | 0 (0.0%) |
| 18 to 24 Years | 0 (0.0%) | 0 (0.0%) |
| 25 to 34 Years | 0 (0.0%) | 0 (0.0%) |
| 35 to 44 Years | 0 (0.0%) | 0 (0.0%) |
| 45 to 54 Years | 0 (0.0%) | 0 (0.0%) |
| 55 to 64 Years | 0 (0.0%) | 0 (0.0%) |
| 65 to 74 Years | 0 (0.0%) | 0 (0.0%) |
| 75 Years and over | 0 (0.0%) | 0 (0.0%) |
| Total | 0 (0.0%) | 0 (0.0%) |
Income Above Poverty by Sex and Age in Darrtown
According to the poverty statistics in Darrtown, males aged under 5 years and females aged under 5 years are the age groups that are most secure financially, with 100.0% of males and 100.0% of females in these age groups living above the poverty line.
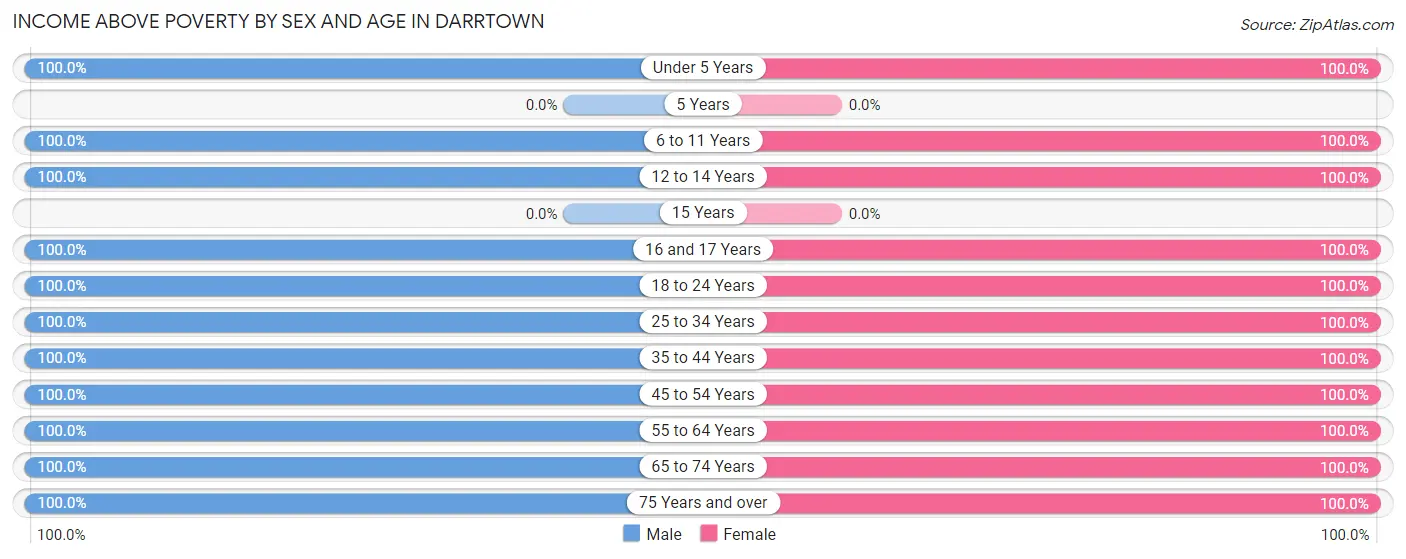
| Age Bracket | Male | Female |
| Under 5 Years | 17 (100.0%) | 17 (100.0%) |
| 5 Years | 0 (0.0%) | 0 (0.0%) |
| 6 to 11 Years | 44 (100.0%) | 6 (100.0%) |
| 12 to 14 Years | 6 (100.0%) | 11 (100.0%) |
| 15 Years | 0 (0.0%) | 0 (0.0%) |
| 16 and 17 Years | 11 (100.0%) | 22 (100.0%) |
| 18 to 24 Years | 31 (100.0%) | 28 (100.0%) |
| 25 to 34 Years | 24 (100.0%) | 8 (100.0%) |
| 35 to 44 Years | 36 (100.0%) | 53 (100.0%) |
| 45 to 54 Years | 19 (100.0%) | 29 (100.0%) |
| 55 to 64 Years | 118 (100.0%) | 72 (100.0%) |
| 65 to 74 Years | 42 (100.0%) | 28 (100.0%) |
| 75 Years and over | 28 (100.0%) | 29 (100.0%) |
| Total | 376 (100.0%) | 303 (100.0%) |
Income Below Poverty Among Married-Couple Families in Darrtown
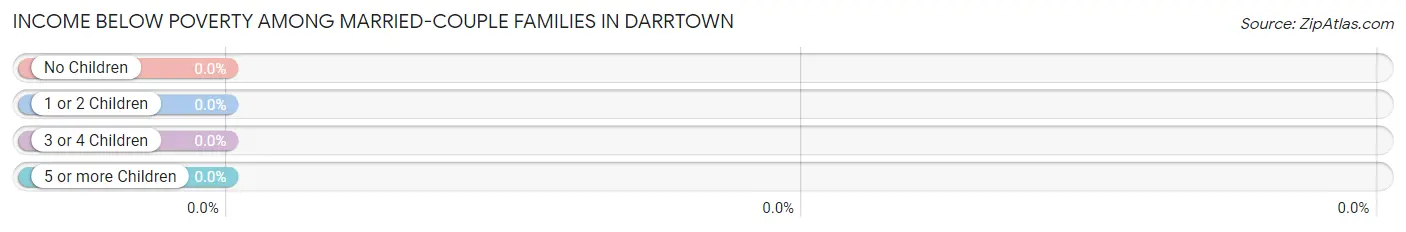
| Children | Above Poverty | Below Poverty |
| No Children | 80 (100.0%) | 0 (0.0%) |
| 1 or 2 Children | 68 (100.0%) | 0 (0.0%) |
| 3 or 4 Children | 0 (0.0%) | 0 (0.0%) |
| 5 or more Children | 0 (0.0%) | 0 (0.0%) |
| Total | 148 (100.0%) | 0 (0.0%) |
Income Below Poverty Among Single-Parent Households in Darrtown
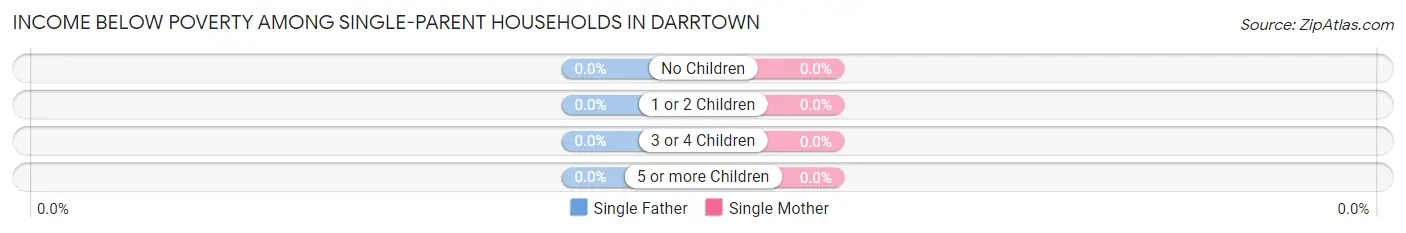
| Children | Single Father | Single Mother |
| No Children | 0 (0.0%) | 0 (0.0%) |
| 1 or 2 Children | 0 (0.0%) | 0 (0.0%) |
| 3 or 4 Children | 0 (0.0%) | 0 (0.0%) |
| 5 or more Children | 0 (0.0%) | 0 (0.0%) |
| Total | 0 (0.0%) | 0 (0.0%) |
Income Below Poverty Among Married-Couple vs Single-Parent Households in Darrtown
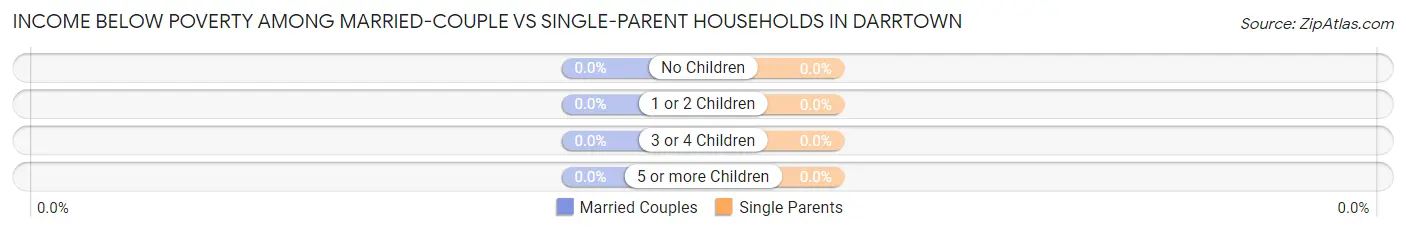
| Children | Married-Couple Families | Single-Parent Households |
| No Children | 0 (0.0%) | 0 (0.0%) |
| 1 or 2 Children | 0 (0.0%) | 0 (0.0%) |
| 3 or 4 Children | 0 (0.0%) | 0 (0.0%) |
| 5 or more Children | 0 (0.0%) | 0 (0.0%) |
| Total | 0 (0.0%) | 0 (0.0%) |
Employment Characteristics in Darrtown
Employment by Class of Employer in Darrtown
Among the 363 employed individuals in Darrtown, private company employees (256 | 70.5%), not-for-profit organizations (37 | 10.2%), and self-employed (not incorporated) (29 | 8.0%) make up the most common classes of employment.
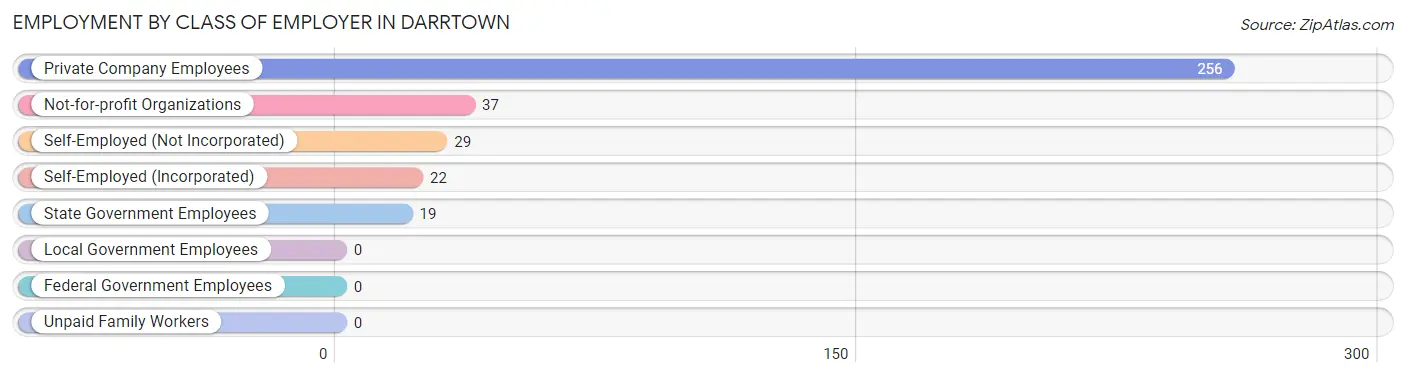
| Employer Class | # Employees | % Employees |
| Private Company Employees | 256 | 70.5% |
| Self-Employed (Incorporated) | 22 | 6.1% |
| Self-Employed (Not Incorporated) | 29 | 8.0% |
| Not-for-profit Organizations | 37 | 10.2% |
| Local Government Employees | 0 | 0.0% |
| State Government Employees | 19 | 5.2% |
| Federal Government Employees | 0 | 0.0% |
| Unpaid Family Workers | 0 | 0.0% |
| Total | 363 | 100.0% |
Employment Status by Age in Darrtown
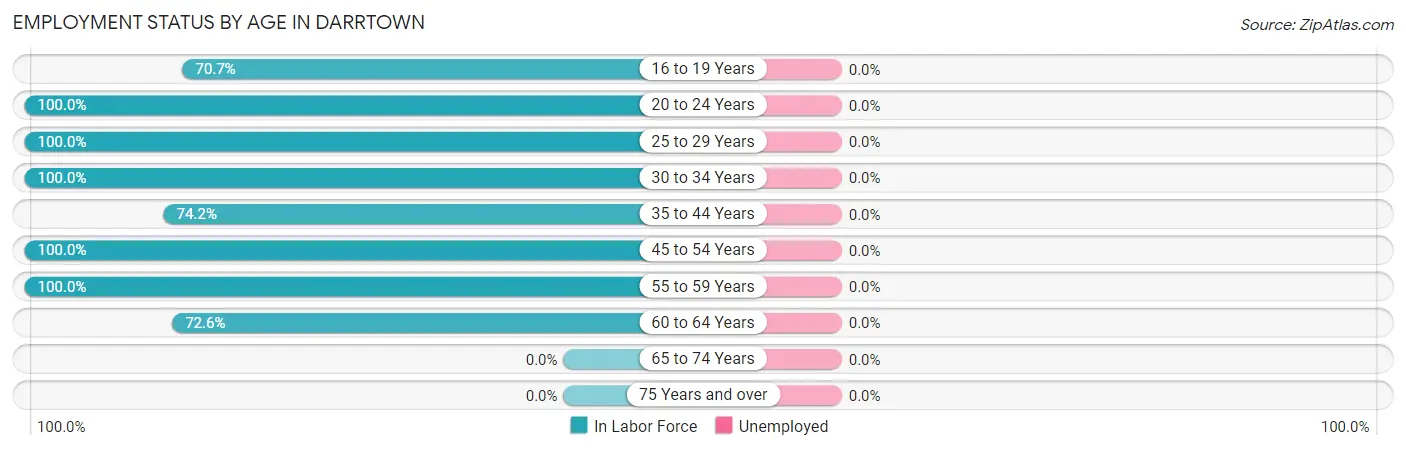
| Age Bracket | In Labor Force | Unemployed |
| 16 to 19 Years | 53 (70.7%) | 0 (0.0%) |
| 20 to 24 Years | 17 (100.0%) | 0 (0.0%) |
| 25 to 29 Years | 24 (100.0%) | 0 (0.0%) |
| 30 to 34 Years | 8 (100.0%) | 0 (0.0%) |
| 35 to 44 Years | 66 (74.2%) | 0 (0.0%) |
| 45 to 54 Years | 48 (100.0%) | 0 (0.0%) |
| 55 to 59 Years | 33 (100.0%) | 0 (0.0%) |
| 60 to 64 Years | 114 (72.6%) | 0 (0.0%) |
| 65 to 74 Years | 0 (0.0%) | 0 (0.0%) |
| 75 Years and over | 0 (0.0%) | 0 (0.0%) |
| Total | 363 (62.8%) | 0 (0.0%) |
Employment Status by Educational Attainment in Darrtown
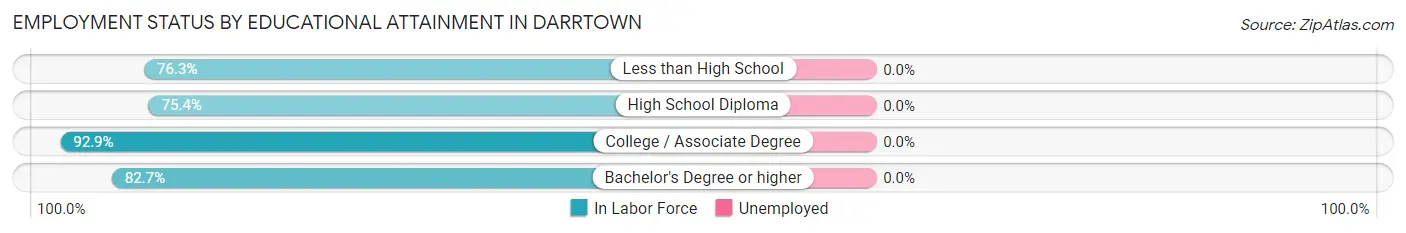
| Educational Attainment | In Labor Force | Unemployed |
| Less than High School | 29 (76.3%) | 0 (0.0%) |
| High School Diploma | 104 (75.4%) | 0 (0.0%) |
| College / Associate Degree | 79 (92.9%) | 0 (0.0%) |
| Bachelor's Degree or higher | 81 (82.7%) | 0 (0.0%) |
| Total | 293 (81.6%) | 0 (0.0%) |
Employment Occupations by Sex in Darrtown
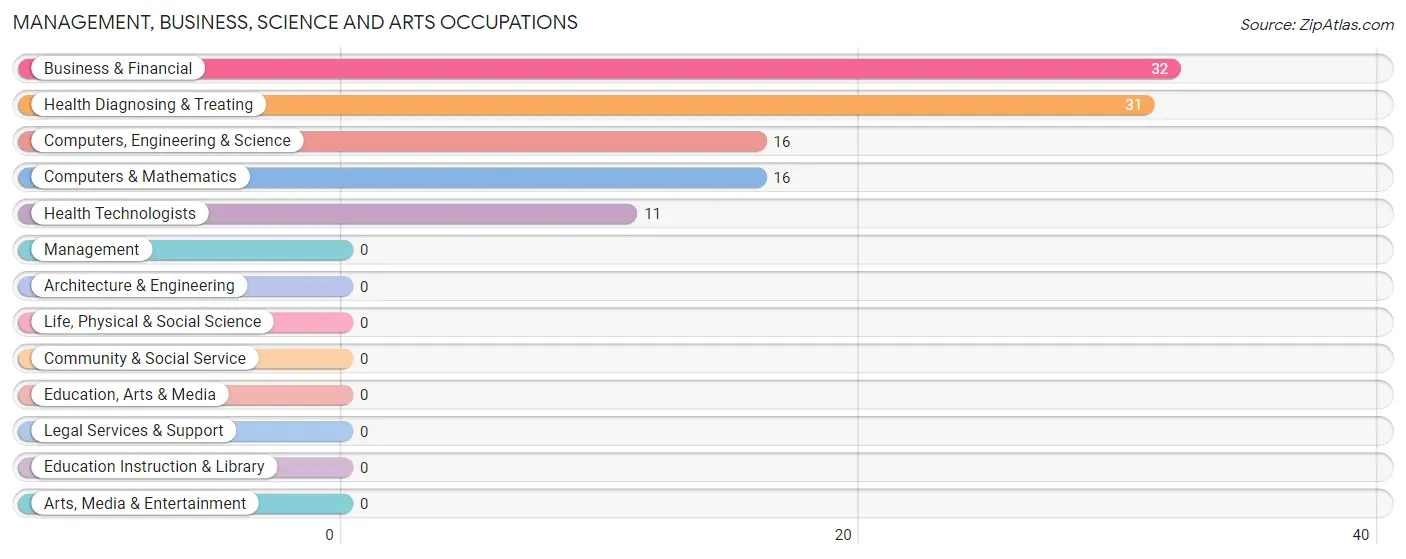
Management, Business, Science and Arts Occupations
The most common Management, Business, Science and Arts occupations in Darrtown are Business & Financial (32 | 8.8%), Health Diagnosing & Treating (31 | 8.5%), Computers, Engineering & Science (16 | 4.4%), Computers & Mathematics (16 | 4.4%), and Health Technologists (11 | 3.0%).
Management, Business, Science and Arts Occupations by Sex
Within the Management, Business, Science and Arts occupations in Darrtown, the most male-oriented occupations are Computers, Engineering & Science (43.8%), Computers & Mathematics (43.8%), and Business & Financial (37.5%), while the most female-oriented occupations are Health Technologists (100.0%), Health Diagnosing & Treating (80.6%), and Business & Financial (62.5%).
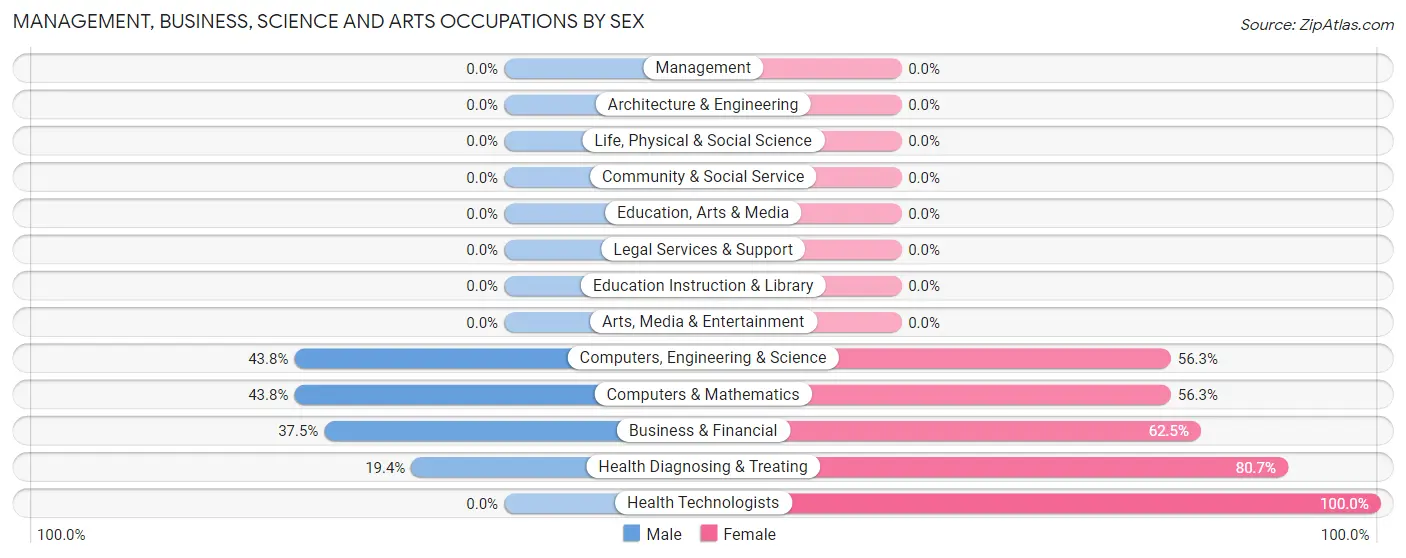
| Occupation | Male | Female |
| Management | 0 (0.0%) | 0 (0.0%) |
| Business & Financial | 12 (37.5%) | 20 (62.5%) |
| Computers, Engineering & Science | 7 (43.8%) | 9 (56.2%) |
| Computers & Mathematics | 7 (43.8%) | 9 (56.2%) |
| Architecture & Engineering | 0 (0.0%) | 0 (0.0%) |
| Life, Physical & Social Science | 0 (0.0%) | 0 (0.0%) |
| Community & Social Service | 0 (0.0%) | 0 (0.0%) |
| Education, Arts & Media | 0 (0.0%) | 0 (0.0%) |
| Legal Services & Support | 0 (0.0%) | 0 (0.0%) |
| Education Instruction & Library | 0 (0.0%) | 0 (0.0%) |
| Arts, Media & Entertainment | 0 (0.0%) | 0 (0.0%) |
| Health Diagnosing & Treating | 6 (19.4%) | 25 (80.6%) |
| Health Technologists | 0 (0.0%) | 11 (100.0%) |
| Total (Category) | 25 (31.7%) | 54 (68.3%) |
| Total (Overall) | 205 (56.5%) | 158 (43.5%) |
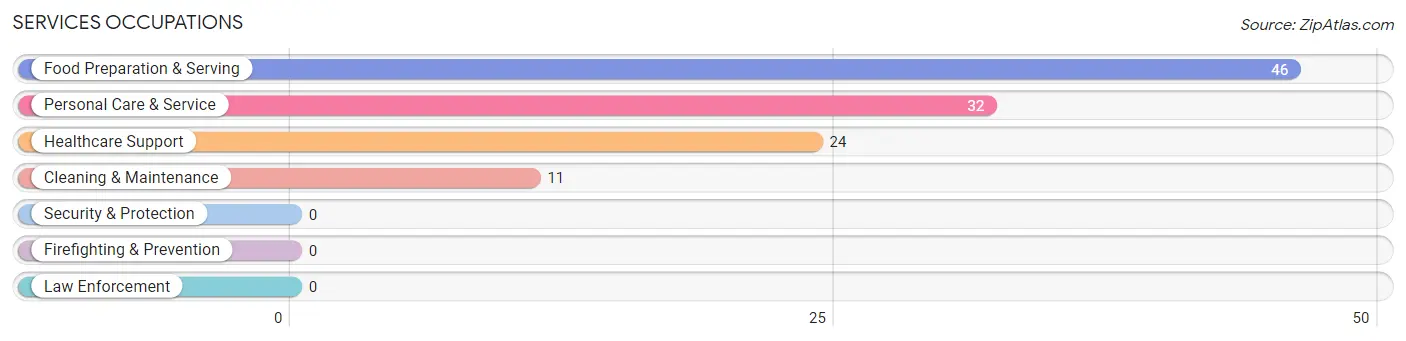
Services Occupations
The most common Services occupations in Darrtown are Food Preparation & Serving (46 | 12.7%), Personal Care & Service (32 | 8.8%), Healthcare Support (24 | 6.6%), and Cleaning & Maintenance (11 | 3.0%).
Services Occupations by Sex
Within the Services occupations in Darrtown, the most male-oriented occupations are Food Preparation & Serving (67.4%), and Personal Care & Service (43.8%), while the most female-oriented occupations are Healthcare Support (100.0%), Cleaning & Maintenance (100.0%), and Personal Care & Service (56.2%).
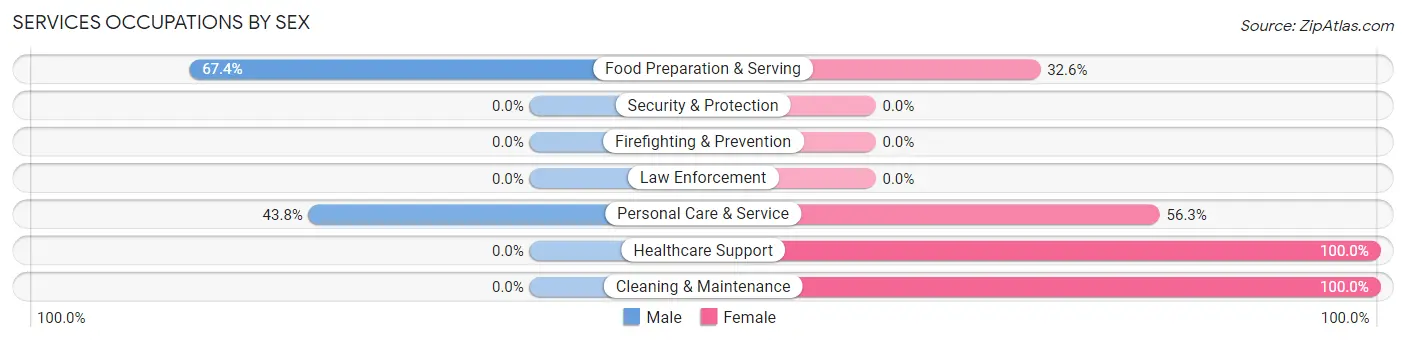
| Occupation | Male | Female |
| Healthcare Support | 0 (0.0%) | 24 (100.0%) |
| Security & Protection | 0 (0.0%) | 0 (0.0%) |
| Firefighting & Prevention | 0 (0.0%) | 0 (0.0%) |
| Law Enforcement | 0 (0.0%) | 0 (0.0%) |
| Food Preparation & Serving | 31 (67.4%) | 15 (32.6%) |
| Cleaning & Maintenance | 0 (0.0%) | 11 (100.0%) |
| Personal Care & Service | 14 (43.8%) | 18 (56.2%) |
| Total (Category) | 45 (39.8%) | 68 (60.2%) |
| Total (Overall) | 205 (56.5%) | 158 (43.5%) |
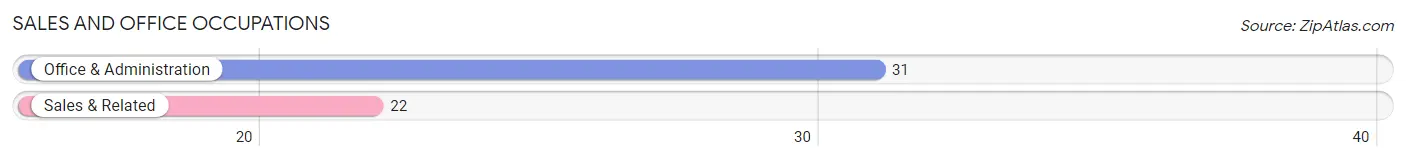
Sales and Office Occupations
The most common Sales and Office occupations in Darrtown are Office & Administration (31 | 8.5%), and Sales & Related (22 | 6.1%).
Sales and Office Occupations by Sex
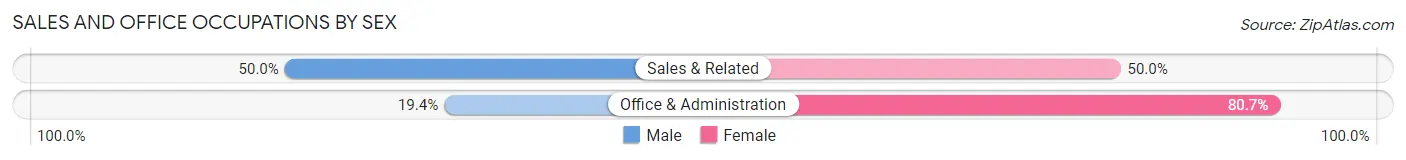
| Occupation | Male | Female |
| Sales & Related | 11 (50.0%) | 11 (50.0%) |
| Office & Administration | 6 (19.4%) | 25 (80.6%) |
| Total (Category) | 17 (32.1%) | 36 (67.9%) |
| Total (Overall) | 205 (56.5%) | 158 (43.5%) |
Natural Resources, Construction and Maintenance Occupations
Natural Resources, Construction and Maintenance Occupations by Sex
| Occupation | Male | Female |
| Farming, Fishing & Forestry | 0 (0.0%) | 0 (0.0%) |
| Construction & Extraction | 0 (0.0%) | 0 (0.0%) |
| Installation, Maintenance & Repair | 0 (0.0%) | 0 (0.0%) |
| Total (Category) | 0 (0.0%) | 0 (0.0%) |
| Total (Overall) | 205 (56.5%) | 158 (43.5%) |
Production, Transportation and Moving Occupations
The most common Production, Transportation and Moving occupations in Darrtown are Transportation (84 | 23.1%), Production (29 | 8.0%), and Material Moving (5 | 1.4%).
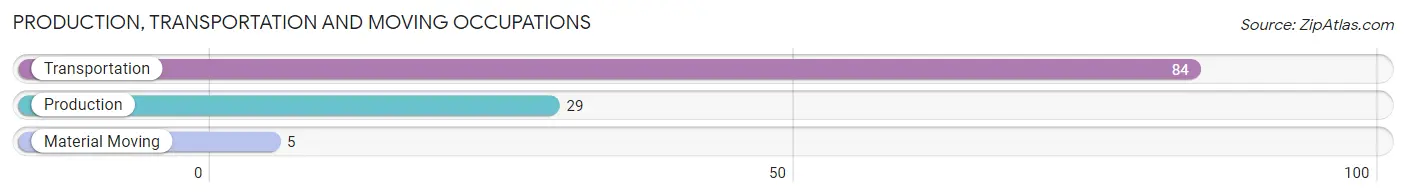
Production, Transportation and Moving Occupations by Sex
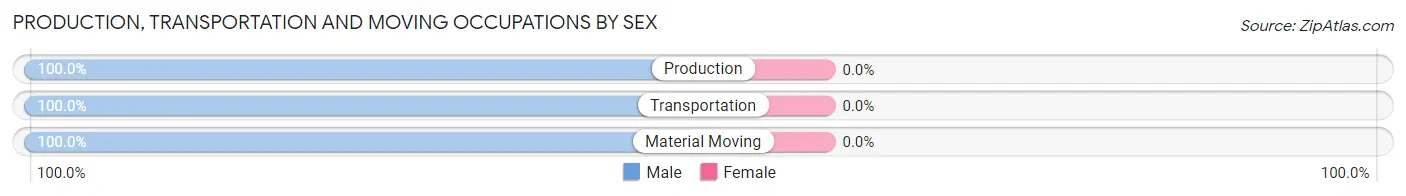
| Occupation | Male | Female |
| Production | 29 (100.0%) | 0 (0.0%) |
| Transportation | 84 (100.0%) | 0 (0.0%) |
| Material Moving | 5 (100.0%) | 0 (0.0%) |
| Total (Category) | 118 (100.0%) | 0 (0.0%) |
| Total (Overall) | 205 (56.5%) | 158 (43.5%) |
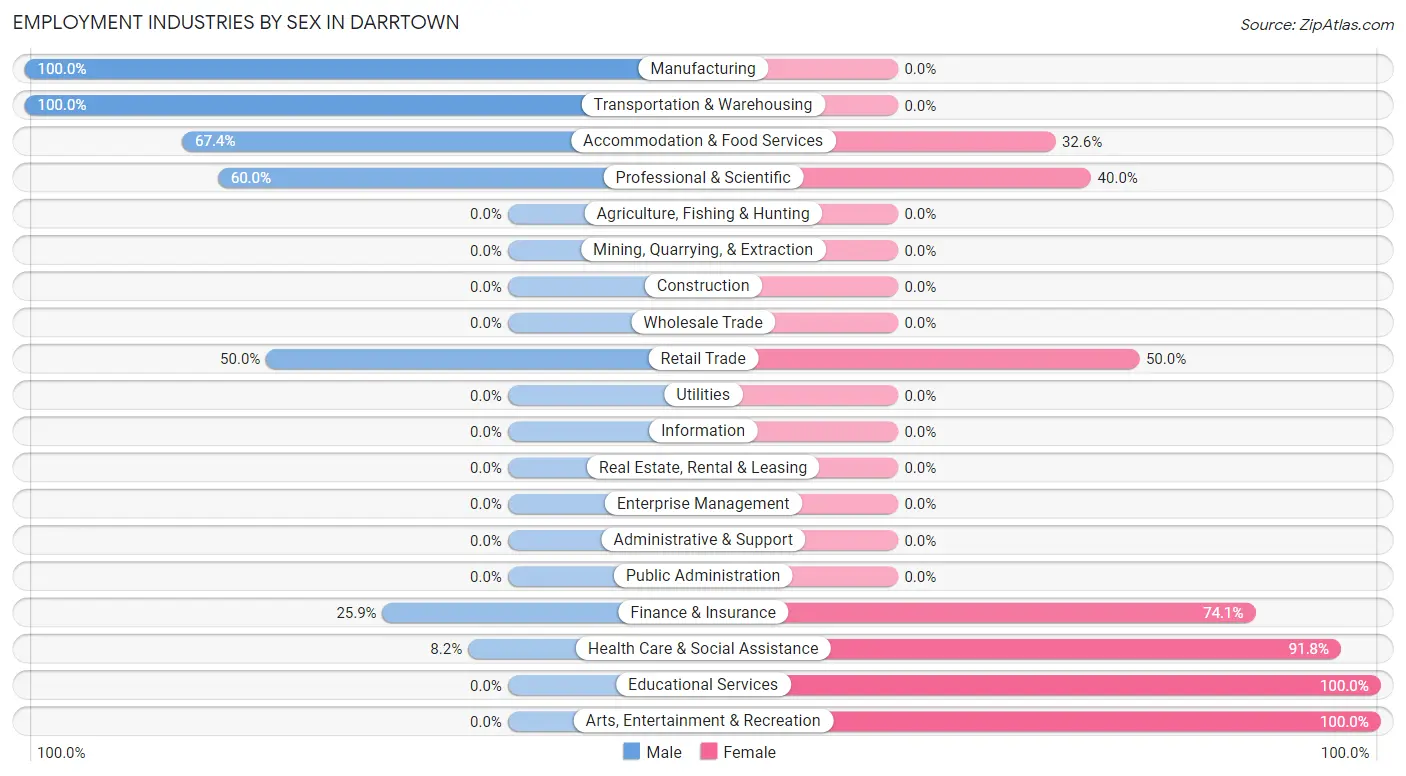
Employment Industries by Sex in Darrtown
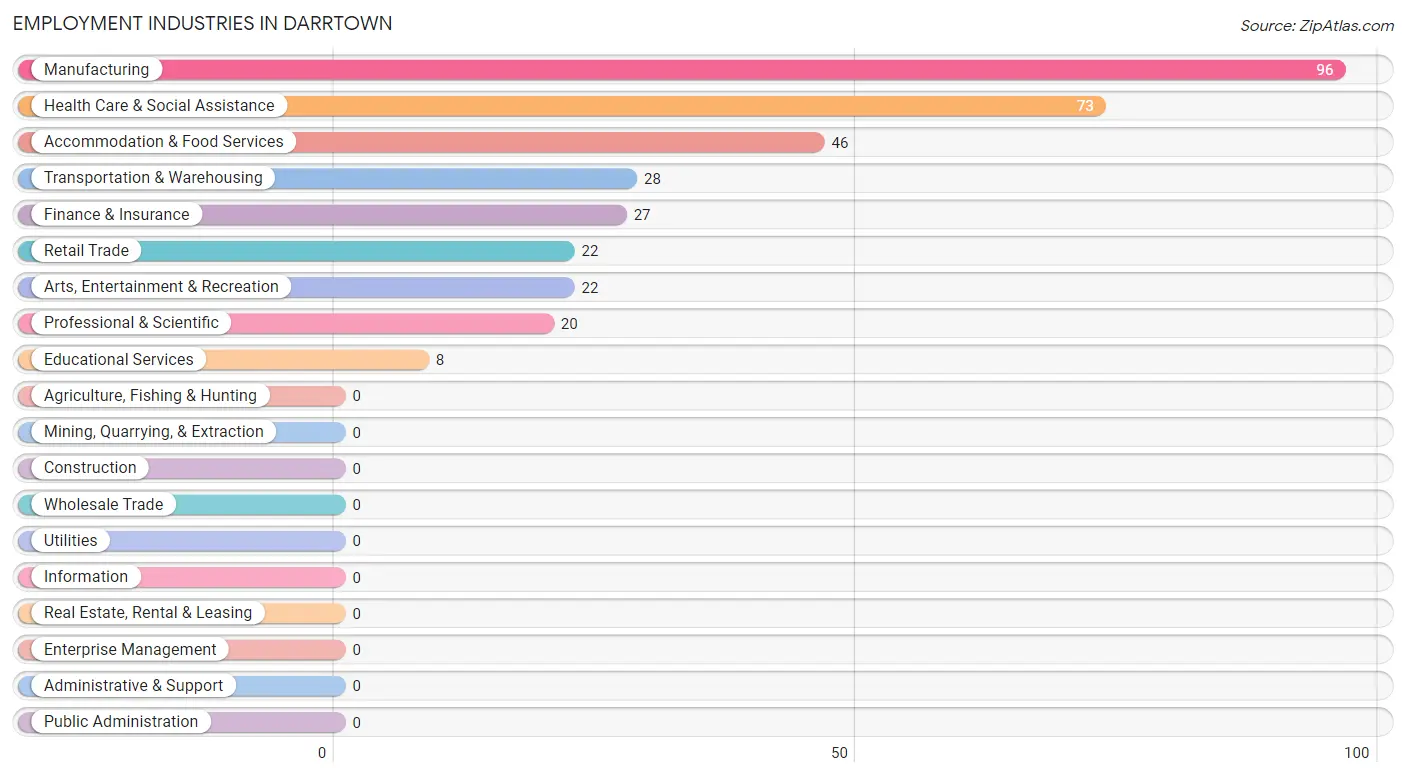
Employment Industries in Darrtown
The major employment industries in Darrtown include Manufacturing (96 | 26.5%), Health Care & Social Assistance (73 | 20.1%), Accommodation & Food Services (46 | 12.7%), Transportation & Warehousing (28 | 7.7%), and Finance & Insurance (27 | 7.4%).
Employment Industries by Sex in Darrtown
The Darrtown industries that see more men than women are Manufacturing (100.0%), Transportation & Warehousing (100.0%), and Accommodation & Food Services (67.4%), whereas the industries that tend to have a higher number of women are Educational Services (100.0%), Arts, Entertainment & Recreation (100.0%), and Health Care & Social Assistance (91.8%).
| Industry | Male | Female |
| Agriculture, Fishing & Hunting | 0 (0.0%) | 0 (0.0%) |
| Mining, Quarrying, & Extraction | 0 (0.0%) | 0 (0.0%) |
| Construction | 0 (0.0%) | 0 (0.0%) |
| Manufacturing | 96 (100.0%) | 0 (0.0%) |
| Wholesale Trade | 0 (0.0%) | 0 (0.0%) |
| Retail Trade | 11 (50.0%) | 11 (50.0%) |
| Transportation & Warehousing | 28 (100.0%) | 0 (0.0%) |
| Utilities | 0 (0.0%) | 0 (0.0%) |
| Information | 0 (0.0%) | 0 (0.0%) |
| Finance & Insurance | 7 (25.9%) | 20 (74.1%) |
| Real Estate, Rental & Leasing | 0 (0.0%) | 0 (0.0%) |
| Professional & Scientific | 12 (60.0%) | 8 (40.0%) |
| Enterprise Management | 0 (0.0%) | 0 (0.0%) |
| Administrative & Support | 0 (0.0%) | 0 (0.0%) |
| Educational Services | 0 (0.0%) | 8 (100.0%) |
| Health Care & Social Assistance | 6 (8.2%) | 67 (91.8%) |
| Arts, Entertainment & Recreation | 0 (0.0%) | 22 (100.0%) |
| Accommodation & Food Services | 31 (67.4%) | 15 (32.6%) |
| Public Administration | 0 (0.0%) | 0 (0.0%) |
| Total | 205 (56.5%) | 158 (43.5%) |
Education in Darrtown
School Enrollment in Darrtown
The most common levels of schooling among the 127 students in Darrtown are high school (50 | 39.4%), elementary school (31 | 24.4%), and middle school (30 | 23.6%).
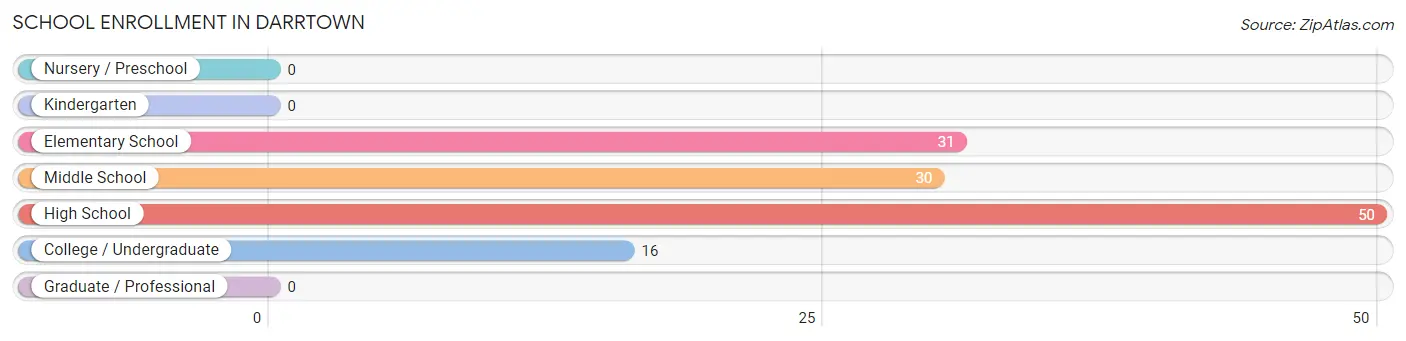
| School Level | # Students | % Students |
| Nursery / Preschool | 0 | 0.0% |
| Kindergarten | 0 | 0.0% |
| Elementary School | 31 | 24.4% |
| Middle School | 30 | 23.6% |
| High School | 50 | 39.4% |
| College / Undergraduate | 16 | 12.6% |
| Graduate / Professional | 0 | 0.0% |
| Total | 127 | 100.0% |
School Enrollment by Age by Funding Source in Darrtown
Out of a total of 127 students who are enrolled in schools in Darrtown, 6 (4.7%) attend a private institution, while the remaining 121 (95.3%) are enrolled in public schools. The age group of 35 years and over has the highest likelihood of being enrolled in private schools, with 6 (100.0% in the age bracket) enrolled. Conversely, the age group of 5 to 9 year old has the lowest likelihood of being enrolled in a private school, with 31 (100.0% in the age bracket) attending a public institution.
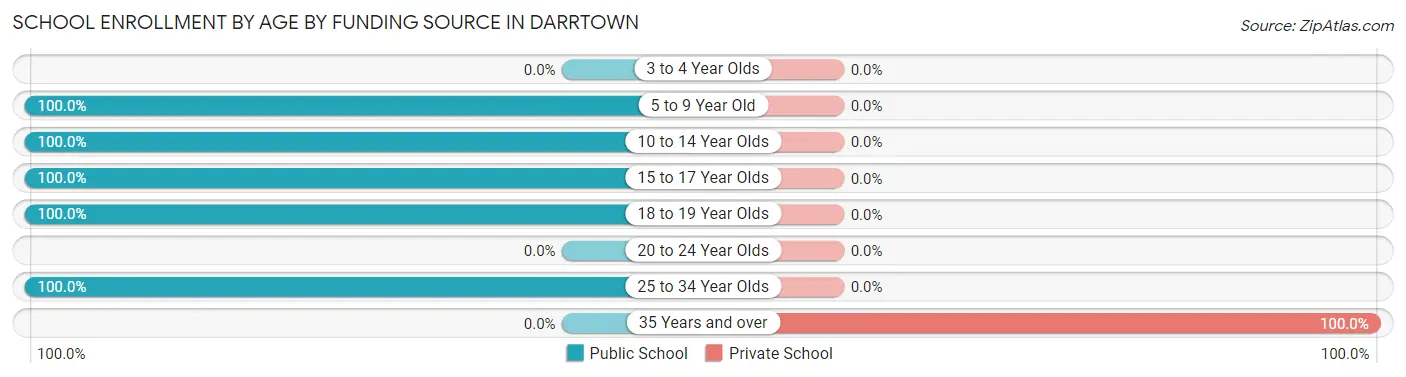
| Age Bracket | Public School | Private School |
| 3 to 4 Year Olds | 0 (0.0%) | 0 (0.0%) |
| 5 to 9 Year Old | 31 (100.0%) | 0 (0.0%) |
| 10 to 14 Year Olds | 36 (100.0%) | 0 (0.0%) |
| 15 to 17 Year Olds | 33 (100.0%) | 0 (0.0%) |
| 18 to 19 Year Olds | 11 (100.0%) | 0 (0.0%) |
| 20 to 24 Year Olds | 0 (0.0%) | 0 (0.0%) |
| 25 to 34 Year Olds | 10 (100.0%) | 0 (0.0%) |
| 35 Years and over | 0 (0.0%) | 6 (100.0%) |
| Total | 121 (95.3%) | 6 (4.7%) |
Educational Attainment by Field of Study in Darrtown
Bio, nature & agricultural (20 | 20.4%), science & technology (20 | 20.4%), business (19 | 19.4%), literature & languages (17 | 17.3%), and education (11 | 11.2%) are the most common fields of study among 98 individuals in Darrtown who have obtained a bachelor's degree or higher.
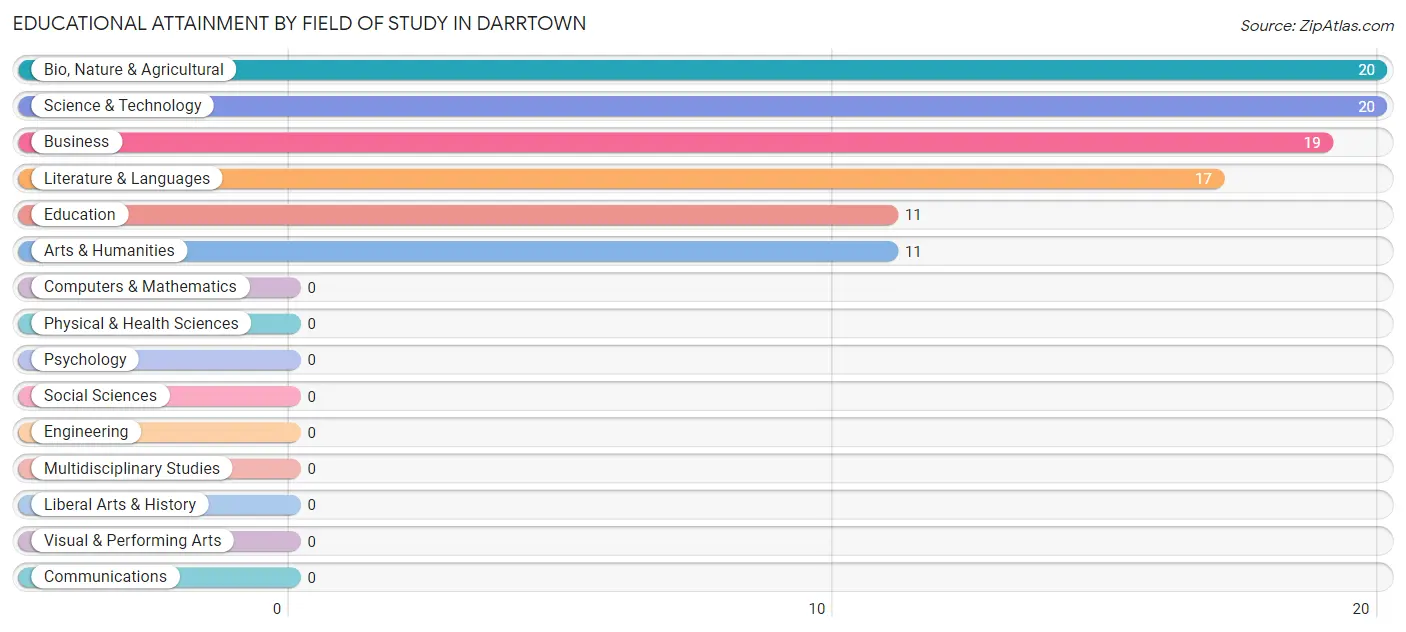
| Field of Study | # Graduates | % Graduates |
| Computers & Mathematics | 0 | 0.0% |
| Bio, Nature & Agricultural | 20 | 20.4% |
| Physical & Health Sciences | 0 | 0.0% |
| Psychology | 0 | 0.0% |
| Social Sciences | 0 | 0.0% |
| Engineering | 0 | 0.0% |
| Multidisciplinary Studies | 0 | 0.0% |
| Science & Technology | 20 | 20.4% |
| Business | 19 | 19.4% |
| Education | 11 | 11.2% |
| Literature & Languages | 17 | 17.3% |
| Liberal Arts & History | 0 | 0.0% |
| Visual & Performing Arts | 0 | 0.0% |
| Communications | 0 | 0.0% |
| Arts & Humanities | 11 | 11.2% |
| Total | 98 | 100.0% |
Transportation & Commute in Darrtown
Vehicle Availability by Sex in Darrtown
The most prevalent vehicle ownership categories in Darrtown are males with 3 vehicles (66, accounting for 32.2%) and females with 3 vehicles (29, making up 41.8%).
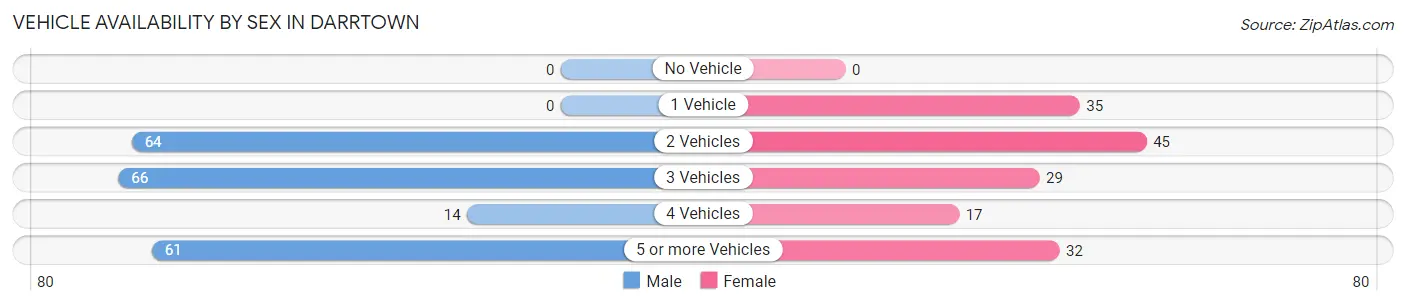
| Vehicles Available | Male | Female |
| No Vehicle | 0 (0.0%) | 0 (0.0%) |
| 1 Vehicle | 0 (0.0%) | 35 (22.2%) |
| 2 Vehicles | 64 (31.2%) | 45 (28.5%) |
| 3 Vehicles | 66 (32.2%) | 29 (18.3%) |
| 4 Vehicles | 14 (6.8%) | 17 (10.8%) |
| 5 or more Vehicles | 61 (29.8%) | 32 (20.3%) |
| Total | 205 (100.0%) | 158 (100.0%) |
Commute Time in Darrtown
The most frequently occuring commute durations in Darrtown are 30 to 34 minutes (72 commuters, 22.9%), 45 to 59 minutes (61 commuters, 19.4%), and 20 to 24 minutes (42 commuters, 13.3%).
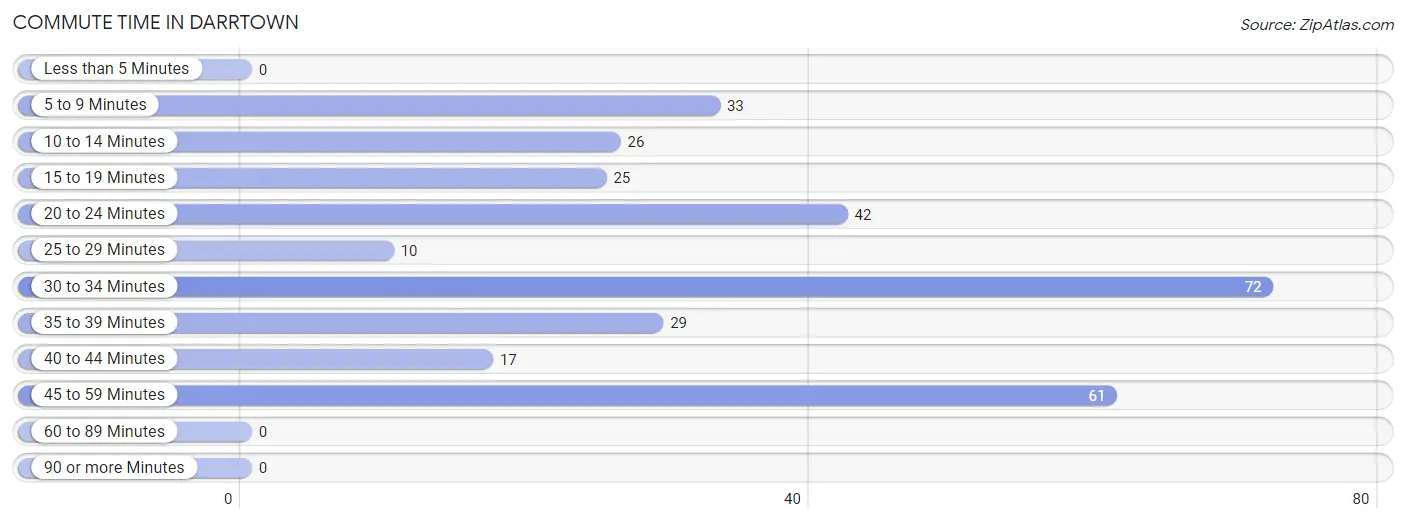
| Commute Time | # Commuters | % Commuters |
| Less than 5 Minutes | 0 | 0.0% |
| 5 to 9 Minutes | 33 | 10.5% |
| 10 to 14 Minutes | 26 | 8.3% |
| 15 to 19 Minutes | 25 | 7.9% |
| 20 to 24 Minutes | 42 | 13.3% |
| 25 to 29 Minutes | 10 | 3.2% |
| 30 to 34 Minutes | 72 | 22.9% |
| 35 to 39 Minutes | 29 | 9.2% |
| 40 to 44 Minutes | 17 | 5.4% |
| 45 to 59 Minutes | 61 | 19.4% |
| 60 to 89 Minutes | 0 | 0.0% |
| 90 or more Minutes | 0 | 0.0% |
Commute Time by Sex in Darrtown
The most common commute times in Darrtown are 30 to 34 minutes (48 commuters, 25.8%) for males and 10 to 14 minutes (26 commuters, 20.2%) for females.
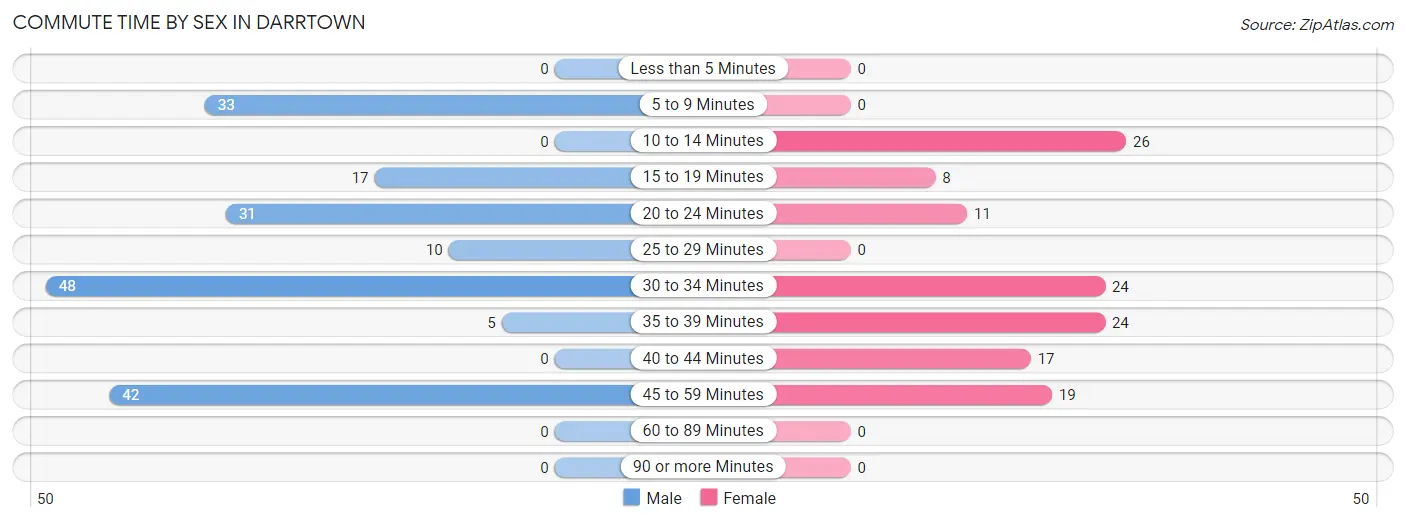
| Commute Time | Male | Female |
| Less than 5 Minutes | 0 (0.0%) | 0 (0.0%) |
| 5 to 9 Minutes | 33 (17.7%) | 0 (0.0%) |
| 10 to 14 Minutes | 0 (0.0%) | 26 (20.2%) |
| 15 to 19 Minutes | 17 (9.1%) | 8 (6.2%) |
| 20 to 24 Minutes | 31 (16.7%) | 11 (8.5%) |
| 25 to 29 Minutes | 10 (5.4%) | 0 (0.0%) |
| 30 to 34 Minutes | 48 (25.8%) | 24 (18.6%) |
| 35 to 39 Minutes | 5 (2.7%) | 24 (18.6%) |
| 40 to 44 Minutes | 0 (0.0%) | 17 (13.2%) |
| 45 to 59 Minutes | 42 (22.6%) | 19 (14.7%) |
| 60 to 89 Minutes | 0 (0.0%) | 0 (0.0%) |
| 90 or more Minutes | 0 (0.0%) | 0 (0.0%) |
Time of Departure to Work by Sex in Darrtown
The most frequent times of departure to work in Darrtown are 12:00 AM to 4:59 AM (108, 58.1%) for males and 7:00 AM to 7:29 AM (39, 30.2%) for females.
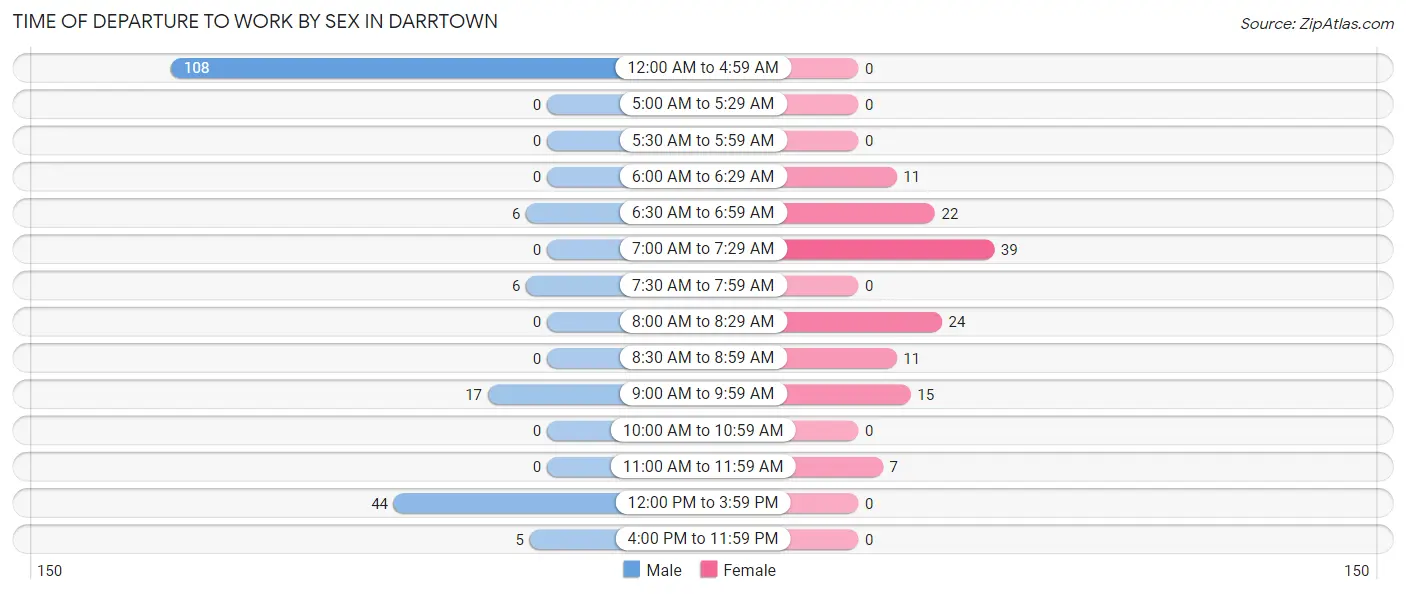
| Time of Departure | Male | Female |
| 12:00 AM to 4:59 AM | 108 (58.1%) | 0 (0.0%) |
| 5:00 AM to 5:29 AM | 0 (0.0%) | 0 (0.0%) |
| 5:30 AM to 5:59 AM | 0 (0.0%) | 0 (0.0%) |
| 6:00 AM to 6:29 AM | 0 (0.0%) | 11 (8.5%) |
| 6:30 AM to 6:59 AM | 6 (3.2%) | 22 (17.1%) |
| 7:00 AM to 7:29 AM | 0 (0.0%) | 39 (30.2%) |
| 7:30 AM to 7:59 AM | 6 (3.2%) | 0 (0.0%) |
| 8:00 AM to 8:29 AM | 0 (0.0%) | 24 (18.6%) |
| 8:30 AM to 8:59 AM | 0 (0.0%) | 11 (8.5%) |
| 9:00 AM to 9:59 AM | 17 (9.1%) | 15 (11.6%) |
| 10:00 AM to 10:59 AM | 0 (0.0%) | 0 (0.0%) |
| 11:00 AM to 11:59 AM | 0 (0.0%) | 7 (5.4%) |
| 12:00 PM to 3:59 PM | 44 (23.7%) | 0 (0.0%) |
| 4:00 PM to 11:59 PM | 5 (2.7%) | 0 (0.0%) |
| Total | 186 (100.0%) | 129 (100.0%) |
Housing Occupancy in Darrtown
Occupancy by Ownership in Darrtown
Of the total 295 dwellings in Darrtown, owner-occupied units account for 234 (79.3%), while renter-occupied units make up 61 (20.7%).
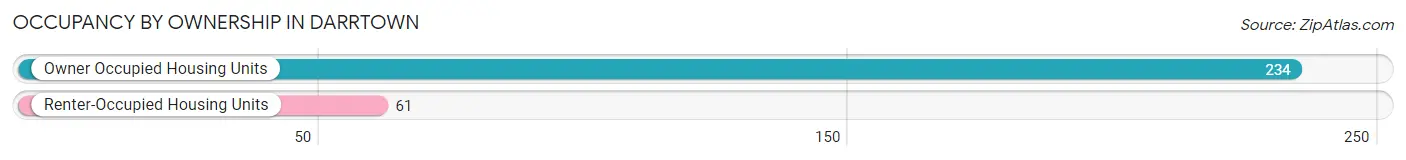
| Occupancy | # Housing Units | % Housing Units |
| Owner Occupied Housing Units | 234 | 79.3% |
| Renter-Occupied Housing Units | 61 | 20.7% |
| Total Occupied Housing Units | 295 | 100.0% |
Occupancy by Household Size in Darrtown
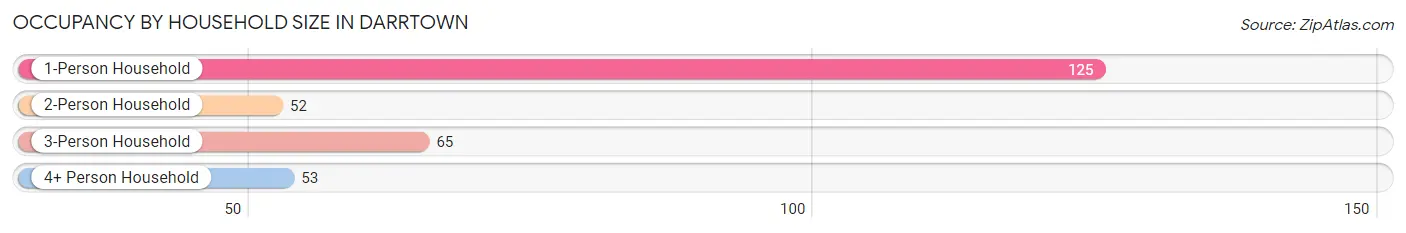
| Household Size | # Housing Units | % Housing Units |
| 1-Person Household | 125 | 42.4% |
| 2-Person Household | 52 | 17.6% |
| 3-Person Household | 65 | 22.0% |
| 4+ Person Household | 53 | 18.0% |
| Total Housing Units | 295 | 100.0% |
Occupancy by Ownership by Household Size in Darrtown
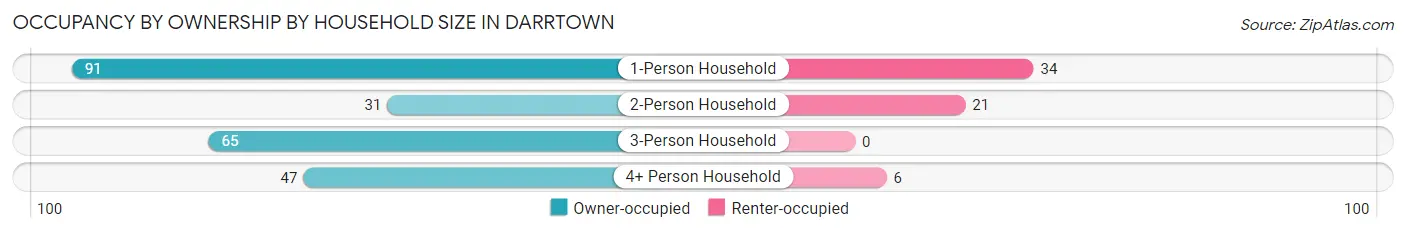
| Household Size | Owner-occupied | Renter-occupied |
| 1-Person Household | 91 (72.8%) | 34 (27.2%) |
| 2-Person Household | 31 (59.6%) | 21 (40.4%) |
| 3-Person Household | 65 (100.0%) | 0 (0.0%) |
| 4+ Person Household | 47 (88.7%) | 6 (11.3%) |
| Total Housing Units | 234 (79.3%) | 61 (20.7%) |
Occupancy by Educational Attainment in Darrtown
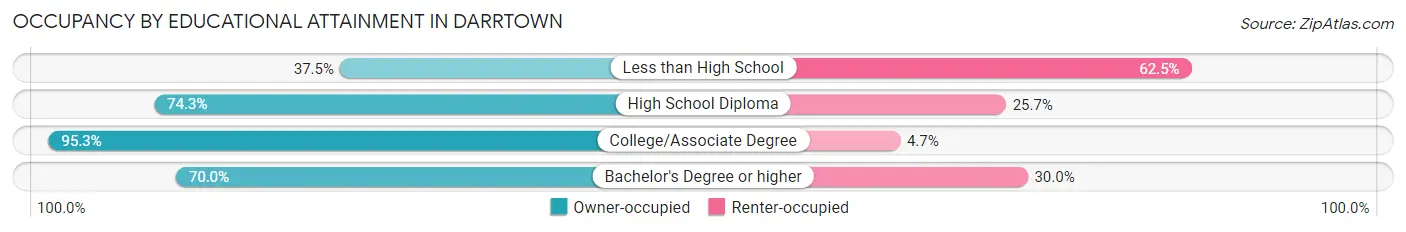
| Household Size | Owner-occupied | Renter-occupied |
| Less than High School | 9 (37.5%) | 15 (62.5%) |
| High School Diploma | 55 (74.3%) | 19 (25.7%) |
| College/Associate Degree | 121 (95.3%) | 6 (4.7%) |
| Bachelor's Degree or higher | 49 (70.0%) | 21 (30.0%) |
Occupancy by Age of Householder in Darrtown
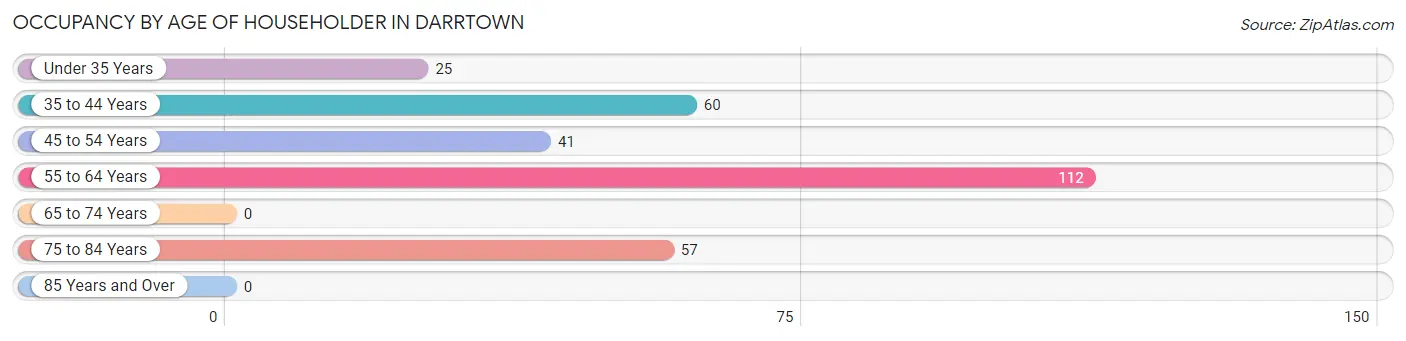
| Age Bracket | # Households | % Households |
| Under 35 Years | 25 | 8.5% |
| 35 to 44 Years | 60 | 20.3% |
| 45 to 54 Years | 41 | 13.9% |
| 55 to 64 Years | 112 | 38.0% |
| 65 to 74 Years | 0 | 0.0% |
| 75 to 84 Years | 57 | 19.3% |
| 85 Years and Over | 0 | 0.0% |
| Total | 295 | 100.0% |
Housing Finances in Darrtown
Median Income by Occupancy in Darrtown
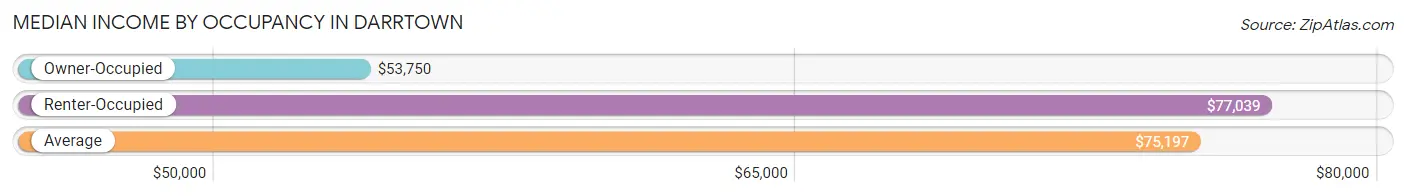
| Occupancy Type | # Households | Median Income |
| Owner-Occupied | 234 (79.3%) | $53,750 |
| Renter-Occupied | 61 (20.7%) | $77,039 |
| Average | 295 (100.0%) | $75,197 |
Occupancy by Householder Income Bracket in Darrtown
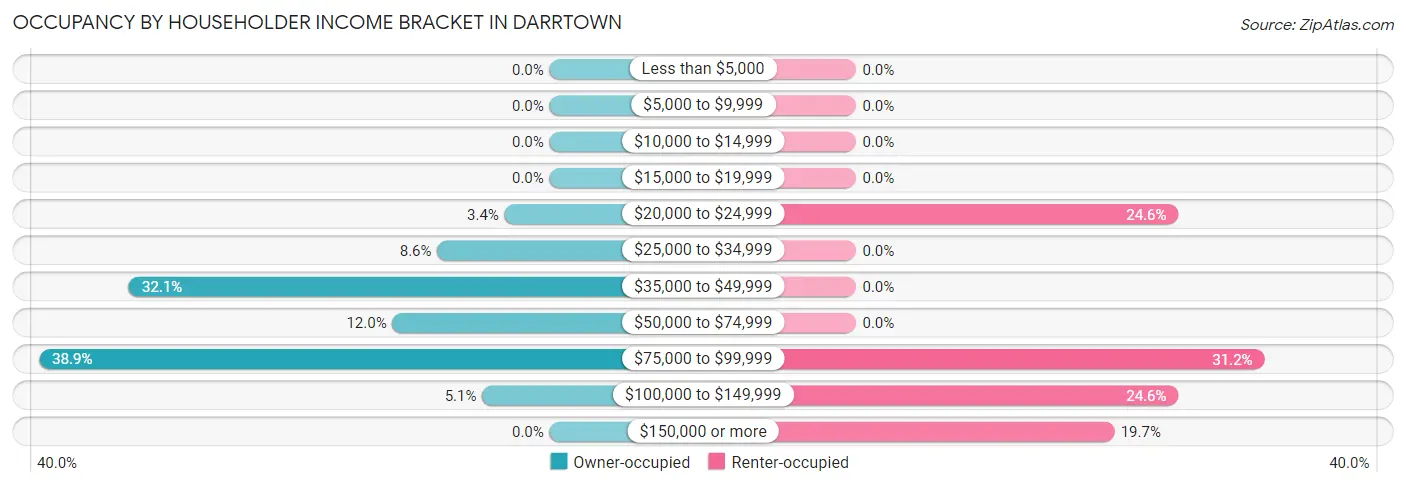
| Income Bracket | Owner-occupied | Renter-occupied |
| Less than $5,000 | 0 (0.0%) | 0 (0.0%) |
| $5,000 to $9,999 | 0 (0.0%) | 0 (0.0%) |
| $10,000 to $14,999 | 0 (0.0%) | 0 (0.0%) |
| $15,000 to $19,999 | 0 (0.0%) | 0 (0.0%) |
| $20,000 to $24,999 | 8 (3.4%) | 15 (24.6%) |
| $25,000 to $34,999 | 20 (8.6%) | 0 (0.0%) |
| $35,000 to $49,999 | 75 (32.1%) | 0 (0.0%) |
| $50,000 to $74,999 | 28 (12.0%) | 0 (0.0%) |
| $75,000 to $99,999 | 91 (38.9%) | 19 (31.1%) |
| $100,000 to $149,999 | 12 (5.1%) | 15 (24.6%) |
| $150,000 or more | 0 (0.0%) | 12 (19.7%) |
| Total | 234 (100.0%) | 61 (100.0%) |
Monthly Housing Cost Tiers in Darrtown
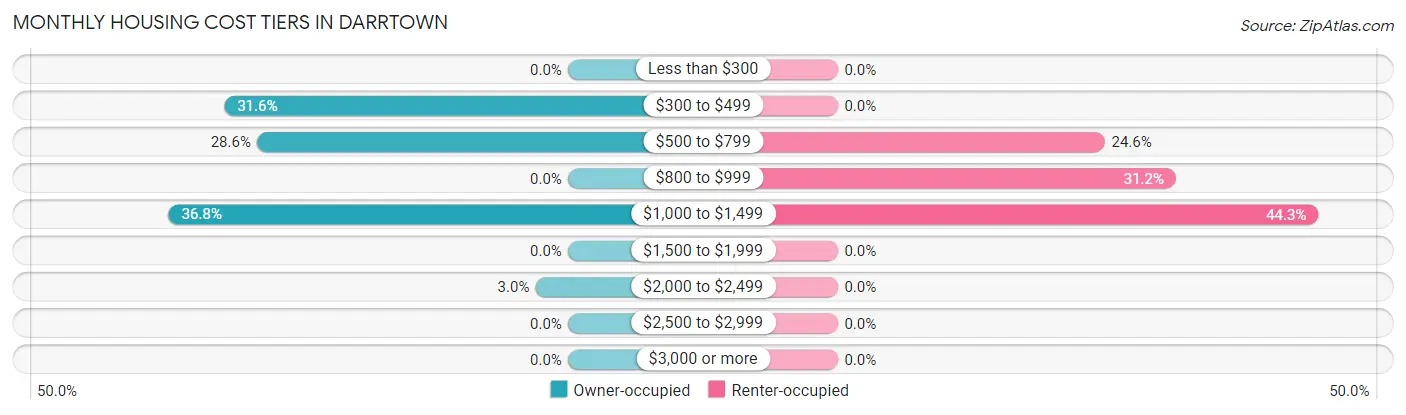
| Monthly Cost | Owner-occupied | Renter-occupied |
| Less than $300 | 0 (0.0%) | 0 (0.0%) |
| $300 to $499 | 74 (31.6%) | 0 (0.0%) |
| $500 to $799 | 67 (28.6%) | 15 (24.6%) |
| $800 to $999 | 0 (0.0%) | 19 (31.1%) |
| $1,000 to $1,499 | 86 (36.7%) | 27 (44.3%) |
| $1,500 to $1,999 | 0 (0.0%) | 0 (0.0%) |
| $2,000 to $2,499 | 7 (3.0%) | 0 (0.0%) |
| $2,500 to $2,999 | 0 (0.0%) | 0 (0.0%) |
| $3,000 or more | 0 (0.0%) | 0 (0.0%) |
| Total | 234 (100.0%) | 61 (100.0%) |
Physical Housing Characteristics in Darrtown
Housing Structures in Darrtown
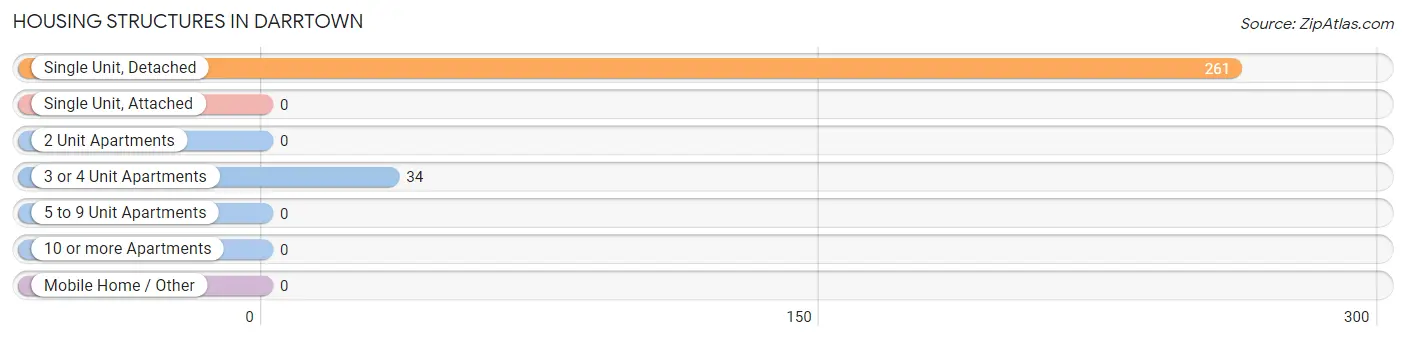
| Structure Type | # Housing Units | % Housing Units |
| Single Unit, Detached | 261 | 88.5% |
| Single Unit, Attached | 0 | 0.0% |
| 2 Unit Apartments | 0 | 0.0% |
| 3 or 4 Unit Apartments | 34 | 11.5% |
| 5 to 9 Unit Apartments | 0 | 0.0% |
| 10 or more Apartments | 0 | 0.0% |
| Mobile Home / Other | 0 | 0.0% |
| Total | 295 | 100.0% |
Housing Structures by Occupancy in Darrtown
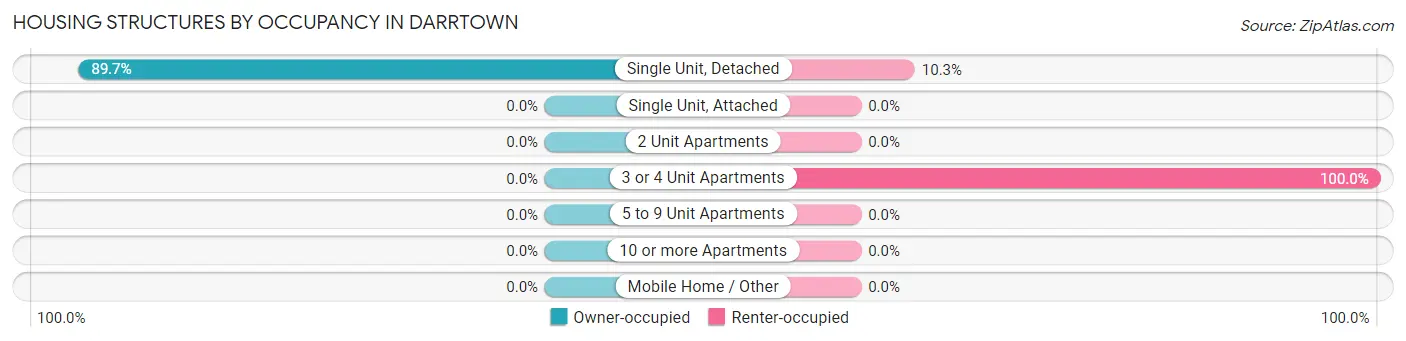
| Structure Type | Owner-occupied | Renter-occupied |
| Single Unit, Detached | 234 (89.7%) | 27 (10.3%) |
| Single Unit, Attached | 0 (0.0%) | 0 (0.0%) |
| 2 Unit Apartments | 0 (0.0%) | 0 (0.0%) |
| 3 or 4 Unit Apartments | 0 (0.0%) | 34 (100.0%) |
| 5 to 9 Unit Apartments | 0 (0.0%) | 0 (0.0%) |
| 10 or more Apartments | 0 (0.0%) | 0 (0.0%) |
| Mobile Home / Other | 0 (0.0%) | 0 (0.0%) |
| Total | 234 (79.3%) | 61 (20.7%) |
Housing Structures by Number of Rooms in Darrtown
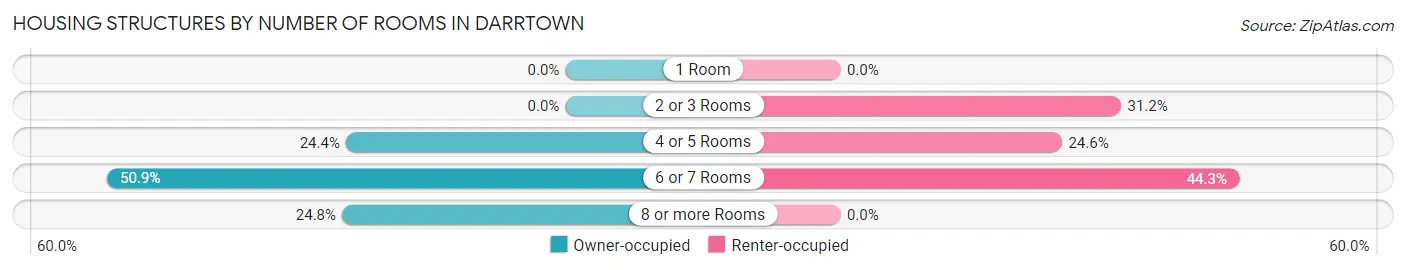
| Number of Rooms | Owner-occupied | Renter-occupied |
| 1 Room | 0 (0.0%) | 0 (0.0%) |
| 2 or 3 Rooms | 0 (0.0%) | 19 (31.1%) |
| 4 or 5 Rooms | 57 (24.4%) | 15 (24.6%) |
| 6 or 7 Rooms | 119 (50.8%) | 27 (44.3%) |
| 8 or more Rooms | 58 (24.8%) | 0 (0.0%) |
| Total | 234 (100.0%) | 61 (100.0%) |
Housing Structure by Heating Type in Darrtown
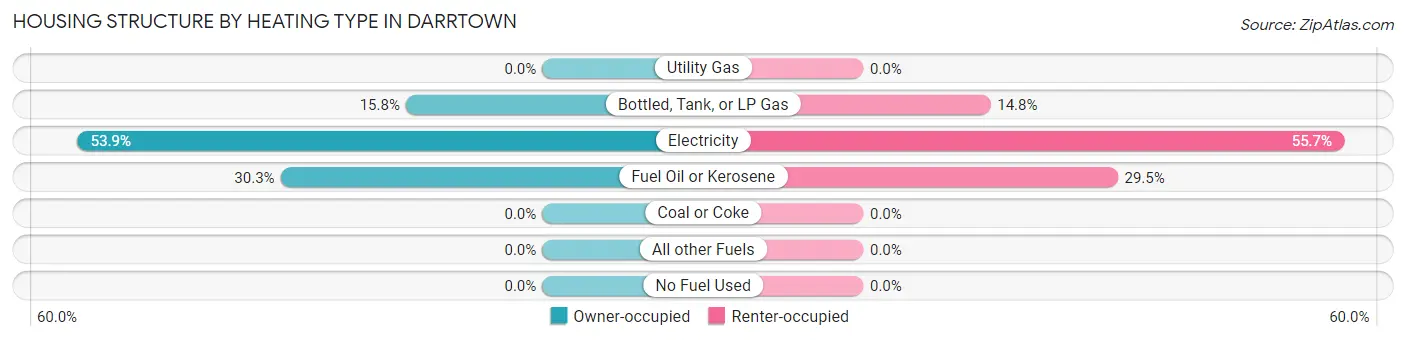
| Heating Type | Owner-occupied | Renter-occupied |
| Utility Gas | 0 (0.0%) | 0 (0.0%) |
| Bottled, Tank, or LP Gas | 37 (15.8%) | 9 (14.7%) |
| Electricity | 126 (53.8%) | 34 (55.7%) |
| Fuel Oil or Kerosene | 71 (30.3%) | 18 (29.5%) |
| Coal or Coke | 0 (0.0%) | 0 (0.0%) |
| All other Fuels | 0 (0.0%) | 0 (0.0%) |
| No Fuel Used | 0 (0.0%) | 0 (0.0%) |
| Total | 234 (100.0%) | 61 (100.0%) |
Household Vehicle Usage in Darrtown
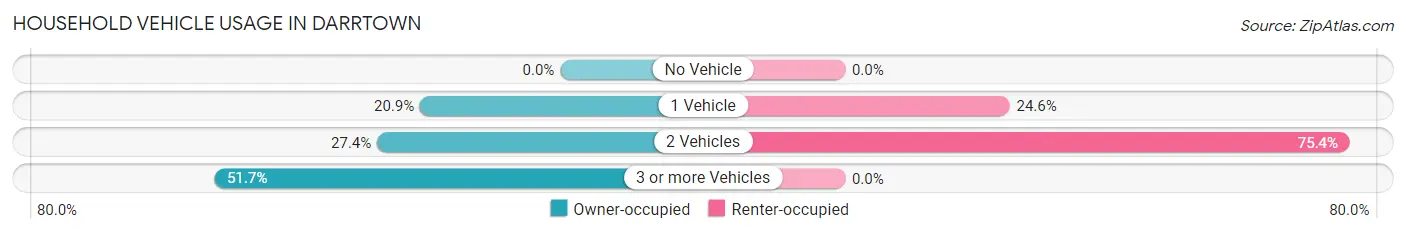
| Vehicles per Household | Owner-occupied | Renter-occupied |
| No Vehicle | 0 (0.0%) | 0 (0.0%) |
| 1 Vehicle | 49 (20.9%) | 15 (24.6%) |
| 2 Vehicles | 64 (27.4%) | 46 (75.4%) |
| 3 or more Vehicles | 121 (51.7%) | 0 (0.0%) |
| Total | 234 (100.0%) | 61 (100.0%) |
Real Estate & Mortgages in Darrtown
Real Estate and Mortgage Overview in Darrtown
| Characteristic | Without Mortgage | With Mortgage |
| Housing Units | 113 | 121 |
| Median Property Value | $179,200 | $155,500 |
| Median Household Income | $53,705 | $0 |
| Monthly Housing Costs | $445 | $0 |
| Real Estate Taxes | $2,071 | $0 |
Property Value by Mortgage Status in Darrtown
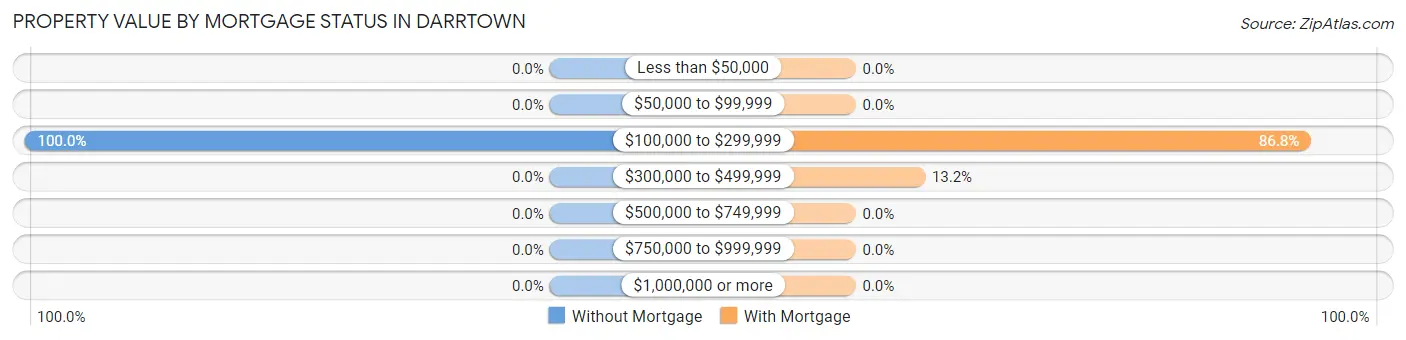
| Property Value | Without Mortgage | With Mortgage |
| Less than $50,000 | 0 (0.0%) | 0 (0.0%) |
| $50,000 to $99,999 | 0 (0.0%) | 0 (0.0%) |
| $100,000 to $299,999 | 113 (100.0%) | 105 (86.8%) |
| $300,000 to $499,999 | 0 (0.0%) | 16 (13.2%) |
| $500,000 to $749,999 | 0 (0.0%) | 0 (0.0%) |
| $750,000 to $999,999 | 0 (0.0%) | 0 (0.0%) |
| $1,000,000 or more | 0 (0.0%) | 0 (0.0%) |
| Total | 113 (100.0%) | 121 (100.0%) |
Household Income by Mortgage Status in Darrtown
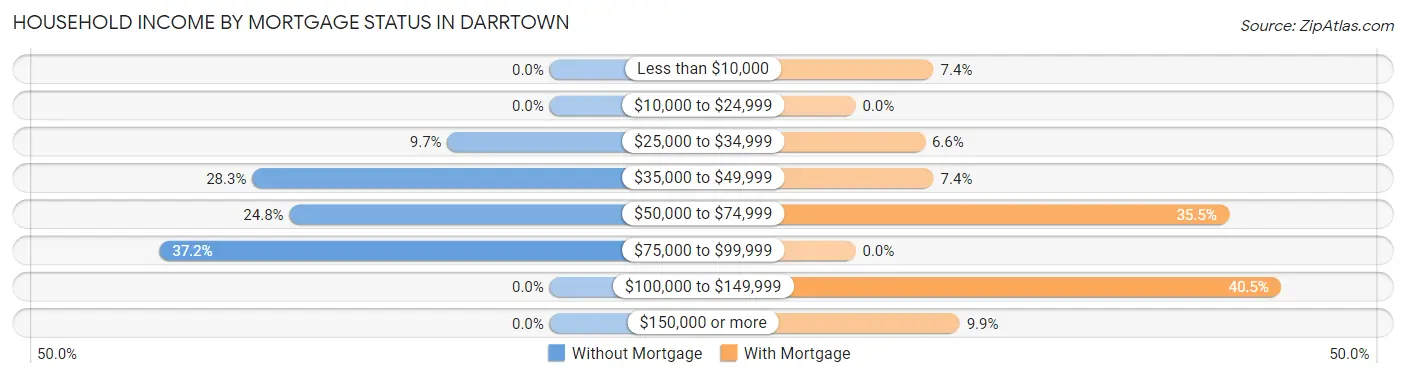
| Household Income | Without Mortgage | With Mortgage |
| Less than $10,000 | 0 (0.0%) | 9 (7.4%) |
| $10,000 to $24,999 | 0 (0.0%) | 0 (0.0%) |
| $25,000 to $34,999 | 11 (9.7%) | 8 (6.6%) |
| $35,000 to $49,999 | 32 (28.3%) | 9 (7.4%) |
| $50,000 to $74,999 | 28 (24.8%) | 43 (35.5%) |
| $75,000 to $99,999 | 42 (37.2%) | 0 (0.0%) |
| $100,000 to $149,999 | 0 (0.0%) | 49 (40.5%) |
| $150,000 or more | 0 (0.0%) | 12 (9.9%) |
| Total | 113 (100.0%) | 121 (100.0%) |
Property Value to Household Income Ratio in Darrtown
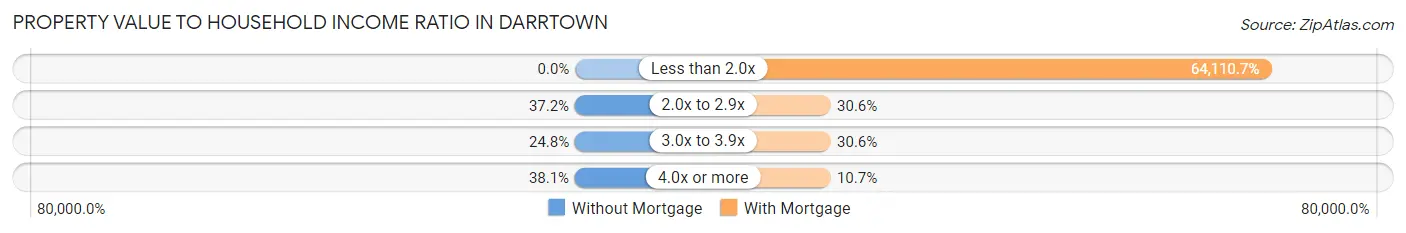
| Value-to-Income Ratio | Without Mortgage | With Mortgage |
| Less than 2.0x | 0 (0.0%) | 77,574 (64,110.7%) |
| 2.0x to 2.9x | 42 (37.2%) | 37 (30.6%) |
| 3.0x to 3.9x | 28 (24.8%) | 37 (30.6%) |
| 4.0x or more | 43 (38.1%) | 13 (10.7%) |
| Total | 113 (100.0%) | 121 (100.0%) |
Real Estate Taxes by Mortgage Status in Darrtown
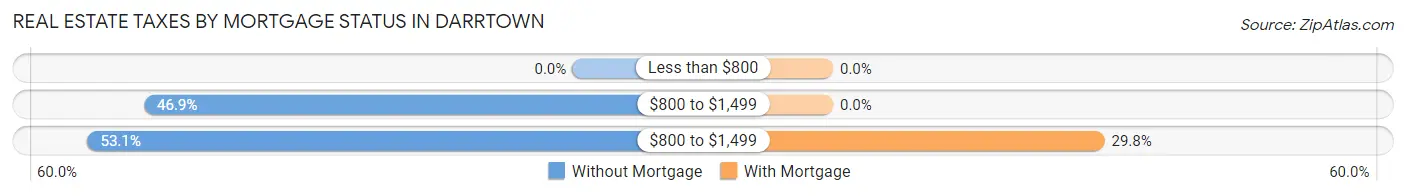
| Property Taxes | Without Mortgage | With Mortgage |
| Less than $800 | 0 (0.0%) | 0 (0.0%) |
| $800 to $1,499 | 53 (46.9%) | 0 (0.0%) |
| $800 to $1,499 | 60 (53.1%) | 36 (29.7%) |
| Total | 113 (100.0%) | 121 (100.0%) |
Health & Disability in Darrtown
Health Insurance Coverage by Age in Darrtown
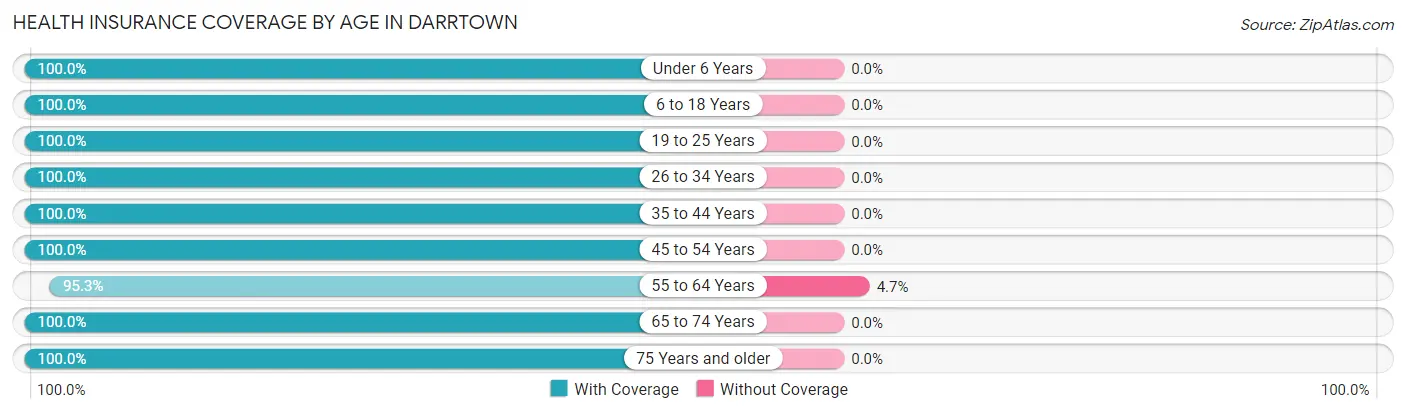
| Age Bracket | With Coverage | Without Coverage |
| Under 6 Years | 34 (100.0%) | 0 (0.0%) |
| 6 to 18 Years | 111 (100.0%) | 0 (0.0%) |
| 19 to 25 Years | 62 (100.0%) | 0 (0.0%) |
| 26 to 34 Years | 18 (100.0%) | 0 (0.0%) |
| 35 to 44 Years | 89 (100.0%) | 0 (0.0%) |
| 45 to 54 Years | 48 (100.0%) | 0 (0.0%) |
| 55 to 64 Years | 181 (95.3%) | 9 (4.7%) |
| 65 to 74 Years | 70 (100.0%) | 0 (0.0%) |
| 75 Years and older | 57 (100.0%) | 0 (0.0%) |
| Total | 670 (98.7%) | 9 (1.3%) |
Health Insurance Coverage by Citizenship Status in Darrtown
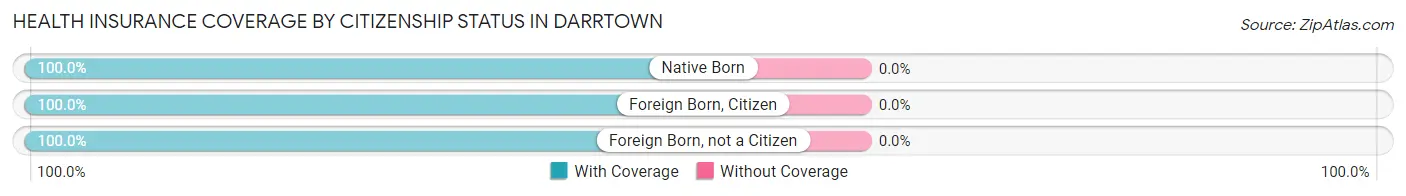
| Citizenship Status | With Coverage | Without Coverage |
| Native Born | 34 (100.0%) | 0 (0.0%) |
| Foreign Born, Citizen | 111 (100.0%) | 0 (0.0%) |
| Foreign Born, not a Citizen | 62 (100.0%) | 0 (0.0%) |
Health Insurance Coverage by Household Income in Darrtown
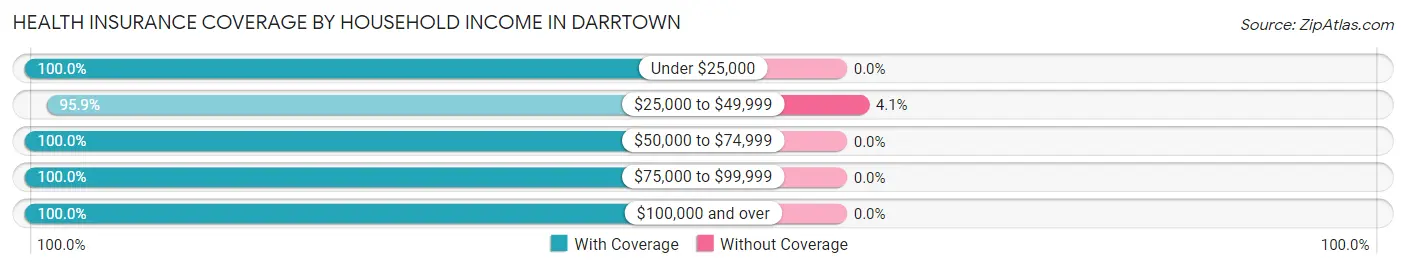
| Household Income | With Coverage | Without Coverage |
| Under $25,000 | 23 (100.0%) | 0 (0.0%) |
| $25,000 to $49,999 | 209 (95.9%) | 9 (4.1%) |
| $50,000 to $74,999 | 90 (100.0%) | 0 (0.0%) |
| $75,000 to $99,999 | 249 (100.0%) | 0 (0.0%) |
| $100,000 and over | 99 (100.0%) | 0 (0.0%) |
Public vs Private Health Insurance Coverage by Age in Darrtown
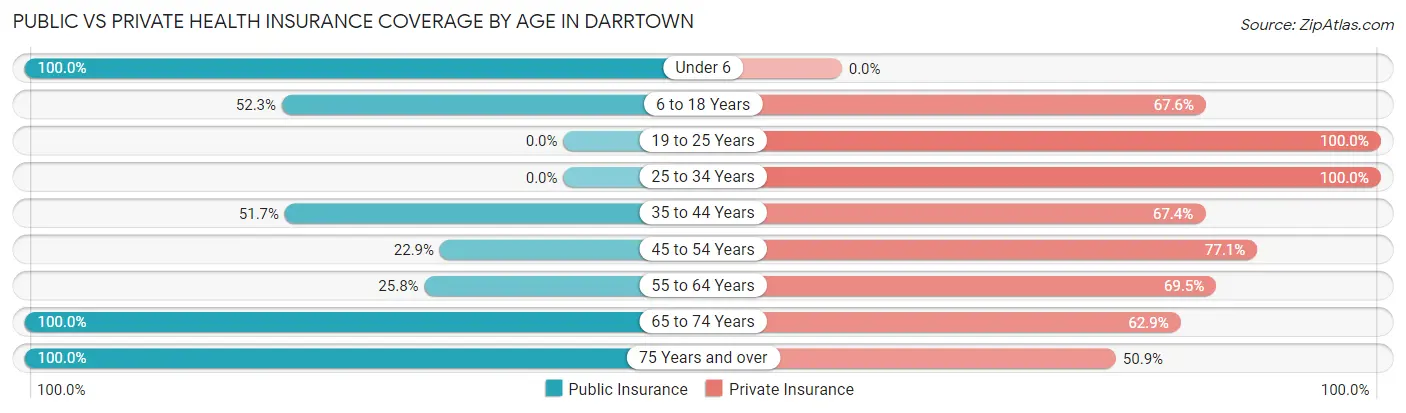
| Age Bracket | Public Insurance | Private Insurance |
| Under 6 | 34 (100.0%) | 0 (0.0%) |
| 6 to 18 Years | 58 (52.2%) | 75 (67.6%) |
| 19 to 25 Years | 0 (0.0%) | 62 (100.0%) |
| 25 to 34 Years | 0 (0.0%) | 18 (100.0%) |
| 35 to 44 Years | 46 (51.7%) | 60 (67.4%) |
| 45 to 54 Years | 11 (22.9%) | 37 (77.1%) |
| 55 to 64 Years | 49 (25.8%) | 132 (69.5%) |
| 65 to 74 Years | 70 (100.0%) | 44 (62.9%) |
| 75 Years and over | 57 (100.0%) | 29 (50.9%) |
| Total | 325 (47.9%) | 457 (67.3%) |
Disability Status by Sex by Age in Darrtown
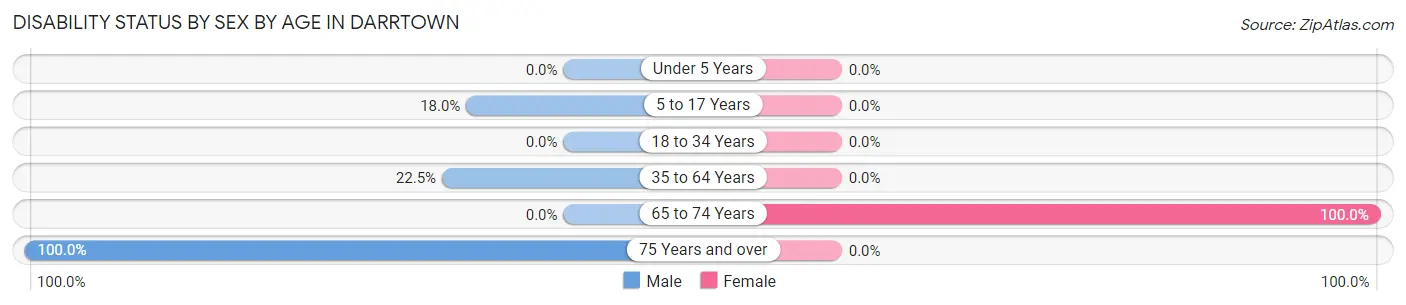
| Age Bracket | Male | Female |
| Under 5 Years | 0 (0.0%) | 0 (0.0%) |
| 5 to 17 Years | 11 (18.0%) | 0 (0.0%) |
| 18 to 34 Years | 0 (0.0%) | 0 (0.0%) |
| 35 to 64 Years | 39 (22.5%) | 0 (0.0%) |
| 65 to 74 Years | 0 (0.0%) | 28 (100.0%) |
| 75 Years and over | 28 (100.0%) | 0 (0.0%) |
Disability Class by Sex by Age in Darrtown
Disability Class: Hearing Difficulty
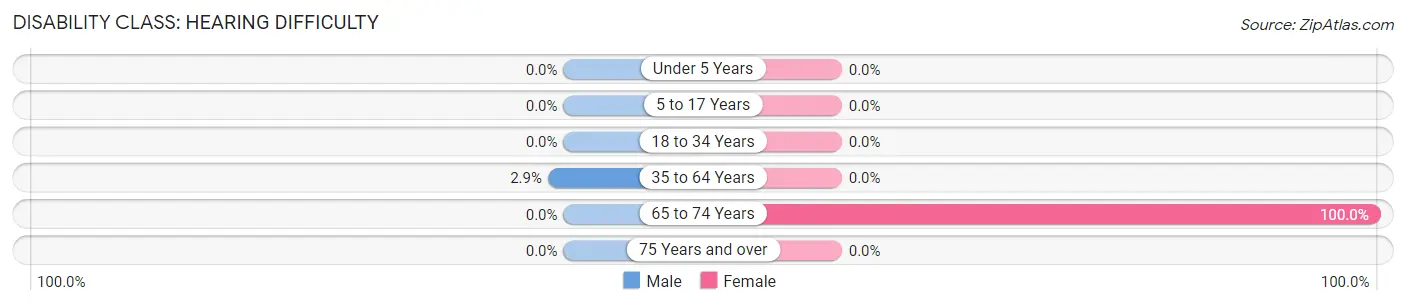
| Age Bracket | Male | Female |
| Under 5 Years | 0 (0.0%) | 0 (0.0%) |
| 5 to 17 Years | 0 (0.0%) | 0 (0.0%) |
| 18 to 34 Years | 0 (0.0%) | 0 (0.0%) |
| 35 to 64 Years | 5 (2.9%) | 0 (0.0%) |
| 65 to 74 Years | 0 (0.0%) | 28 (100.0%) |
| 75 Years and over | 0 (0.0%) | 0 (0.0%) |
Disability Class: Vision Difficulty
| Age Bracket | Male | Female |
| Under 5 Years | 0 (0.0%) | 0 (0.0%) |
| 5 to 17 Years | 0 (0.0%) | 0 (0.0%) |
| 18 to 34 Years | 0 (0.0%) | 0 (0.0%) |
| 35 to 64 Years | 0 (0.0%) | 0 (0.0%) |
| 65 to 74 Years | 0 (0.0%) | 0 (0.0%) |
| 75 Years and over | 0 (0.0%) | 0 (0.0%) |
Disability Class: Cognitive Difficulty
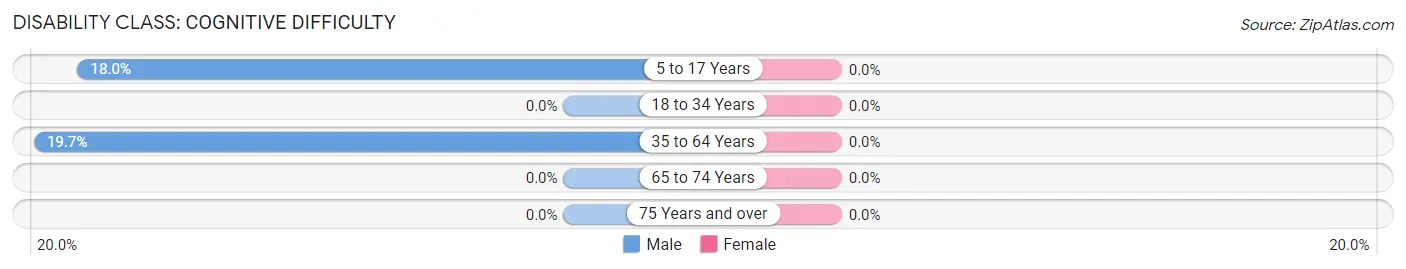
| Age Bracket | Male | Female |
| 5 to 17 Years | 11 (18.0%) | 0 (0.0%) |
| 18 to 34 Years | 0 (0.0%) | 0 (0.0%) |
| 35 to 64 Years | 34 (19.7%) | 0 (0.0%) |
| 65 to 74 Years | 0 (0.0%) | 0 (0.0%) |
| 75 Years and over | 0 (0.0%) | 0 (0.0%) |
Disability Class: Ambulatory Difficulty
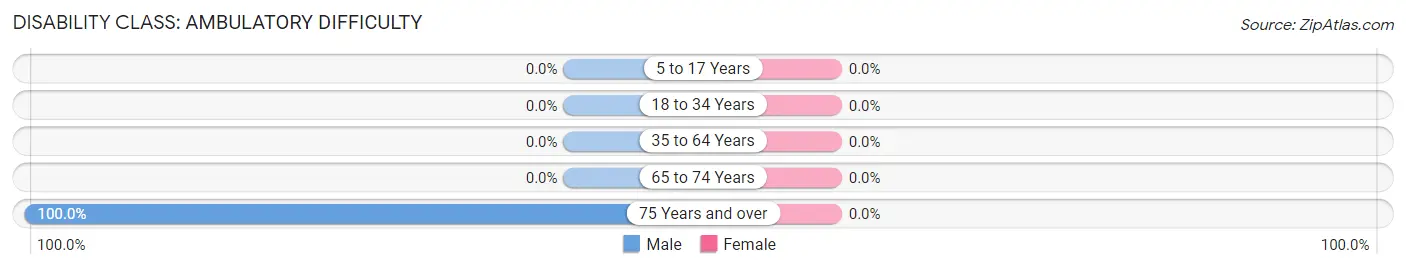
| Age Bracket | Male | Female |
| 5 to 17 Years | 0 (0.0%) | 0 (0.0%) |
| 18 to 34 Years | 0 (0.0%) | 0 (0.0%) |
| 35 to 64 Years | 0 (0.0%) | 0 (0.0%) |
| 65 to 74 Years | 0 (0.0%) | 0 (0.0%) |
| 75 Years and over | 28 (100.0%) | 0 (0.0%) |
Disability Class: Self-Care Difficulty
| Age Bracket | Male | Female |
| 5 to 17 Years | 0 (0.0%) | 0 (0.0%) |
| 18 to 34 Years | 0 (0.0%) | 0 (0.0%) |
| 35 to 64 Years | 0 (0.0%) | 0 (0.0%) |
| 65 to 74 Years | 0 (0.0%) | 0 (0.0%) |
| 75 Years and over | 0 (0.0%) | 0 (0.0%) |
Technology Access in Darrtown
Computing Device Access in Darrtown
| Device Type | # Households | % Households |
| Desktop or Laptop | 261 | 88.5% |
| Smartphone | 231 | 78.3% |
| Tablet | 217 | 73.6% |
| No Computing Device | 0 | 0.0% |
| Total | 295 | 100.0% |
Internet Access in Darrtown
| Internet Type | # Households | % Households |
| Dial-Up Internet | 0 | 0.0% |
| Broadband Home | 218 | 73.9% |
| Cellular Data Only | 41 | 13.9% |
| Satellite Internet | 0 | 0.0% |
| No Internet | 15 | 5.1% |
| Total | 295 | 100.0% |
Darrtown Summary
Darrtown is a small unincorporated community located in the southeastern corner of Butler County, Ohio. It is situated along the banks of the Great Miami River, approximately 10 miles northwest of Hamilton and 25 miles north of Cincinnati. The population of Darrtown was estimated to be around 500 in 2000.
History
Darrtown was founded in 1817 by John Darr, a Revolutionary War veteran who had moved to the area from Pennsylvania. He purchased a large tract of land along the Great Miami River and built a log cabin, which served as the first home in the village. The village was originally known as Darrtown, but the name was changed to Darrtown in 1820.
The village grew slowly over the years, and by the mid-1800s it had become a thriving agricultural community. The village was home to several mills, a blacksmith shop, a general store, and a post office. In 1876, the village was incorporated as a village, and the first mayor was elected.
Geography
Darrtown is located in the southeastern corner of Butler County, Ohio. It is situated along the banks of the Great Miami River, approximately 10 miles northwest of Hamilton and 25 miles north of Cincinnati. The village is located in a rural area, and the surrounding landscape is mostly farmland.
The village is located in the Miami Valley region of Ohio, which is characterized by rolling hills and fertile soil. The climate in the area is generally mild, with hot summers and cold winters.
Economy
The economy of Darrtown is largely based on agriculture. The village is home to several farms, which produce a variety of crops, including corn, soybeans, wheat, and hay. The village also has several small businesses, including a general store, a post office, and a few restaurants.
Demographics
As of the 2000 census, the population of Darrtown was estimated to be around 500. The racial makeup of the village was 97.2% White, 0.8% African American, 0.4% Native American, 0.2% Asian, and 1.4% from other races. The median household income was $37,500, and the median family income was $45,000.
Conclusion
Darrtown is a small unincorporated community located in the southeastern corner of Butler County, Ohio. It is situated along the banks of the Great Miami River, approximately 10 miles northwest of Hamilton and 25 miles north of Cincinnati. The village was founded in 1817 by John Darr, and it has grown slowly over the years. The economy of Darrtown is largely based on agriculture, and the population of the village was estimated to be around 500 in 2000.
Common Questions
What is the Total Population of Darrtown?
Total Population of Darrtown is 679.
What is the Total Male Population of Darrtown?
Total Male Population of Darrtown is 376.
What is the Total Female Population of Darrtown?
Total Female Population of Darrtown is 303.
What is the Ratio of Males per 100 Females in Darrtown?
There are 124.09 Males per 100 Females in Darrtown.
What is the Ratio of Females per 100 Males in Darrtown?
There are 80.59 Females per 100 Males in Darrtown.
What is the Median Population Age in Darrtown?
Median Population Age in Darrtown is 48.4 Years.
What is the Average Family Size in Darrtown
Average Family Size in Darrtown is 3.3 People.
What is the Average Household Size in Darrtown
Average Household Size in Darrtown is 2.3 People.
What is Per Capita Income in Darrtown?
Per Capita income in Darrtown is $30,277.
What is the Median Family Income in Darrtown?
Median Family Income in Darrtown is $77,941.
What is the Median Household income in Darrtown?
Median Household Income in Darrtown is $75,197.
What is Income or Wage Gap in Darrtown?
Income or Wage Gap in Darrtown is 7.5%.
Women in Darrtown earn 92.5 cents for every dollar earned by a man.
What is Inequality or Gini Index in Darrtown?
Inequality or Gini Index in Darrtown is 0.27.
How Large is the Labor Force in Darrtown?
There are 363 People in the Labor Forcein in Darrtown.
What is the Percentage of People in the Labor Force in Darrtown?
62.8% of People are in the Labor Force in Darrtown.