Stanaford, WV
Stanaford Map
Stanaford Overview
1,401
TOTAL POPULATION
688
MALE POPULATION
713
FEMALE POPULATION
96.49
MALES / 100 FEMALES
103.63
FEMALES / 100 MALES
53.0
MEDIAN AGE
3.0
AVG FAMILY SIZE
2.4
AVG HOUSEHOLD SIZE
$25,690
PER CAPITA INCOME
$64,360
AVG FAMILY INCOME
$60,375
AVG HOUSEHOLD INCOME
21.9%
WAGE / INCOME GAP [ % ]
78.1¢/ $1
WAGE / INCOME GAP [ $ ]
$10,809
FAMILY INCOME DEFICIT
0.42
INEQUALITY / GINI INDEX
547
LABOR FORCE [ PEOPLE ]
53.5%
PERCENT IN LABOR FORCE
9.5%
UNEMPLOYMENT RATE
Stanaford Area Codes
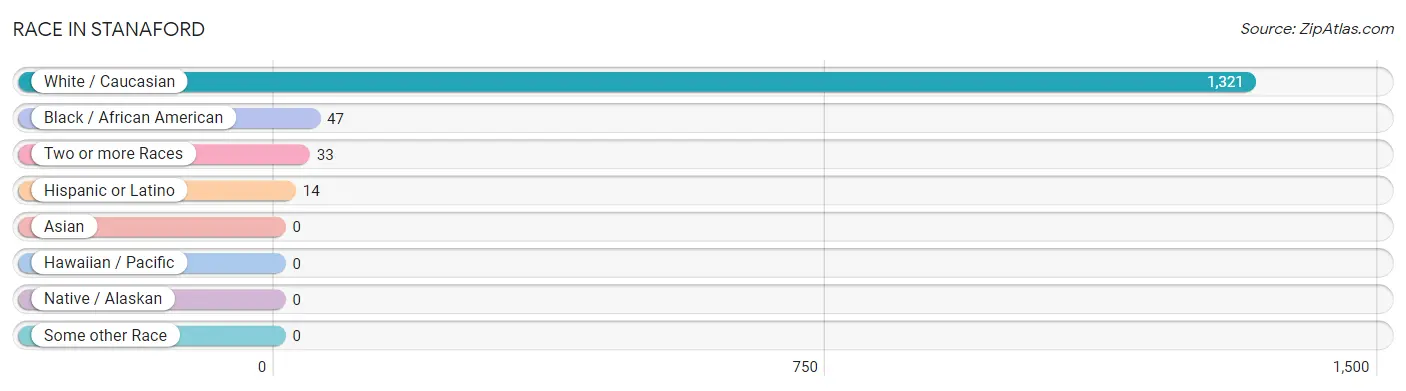
Race in Stanaford
The most populous races in Stanaford are White / Caucasian (1,321 | 94.3%), Black / African American (47 | 3.4%), and Two or more Races (33 | 2.4%).
| Race | # Population | % Population |
| Asian | 0 | 0.0% |
| Black / African American | 47 | 3.4% |
| Hawaiian / Pacific | 0 | 0.0% |
| Hispanic or Latino | 14 | 1.0% |
| Native / Alaskan | 0 | 0.0% |
| White / Caucasian | 1,321 | 94.3% |
| Two or more Races | 33 | 2.4% |
| Some other Race | 0 | 0.0% |
| Total | 1,401 | 100.0% |
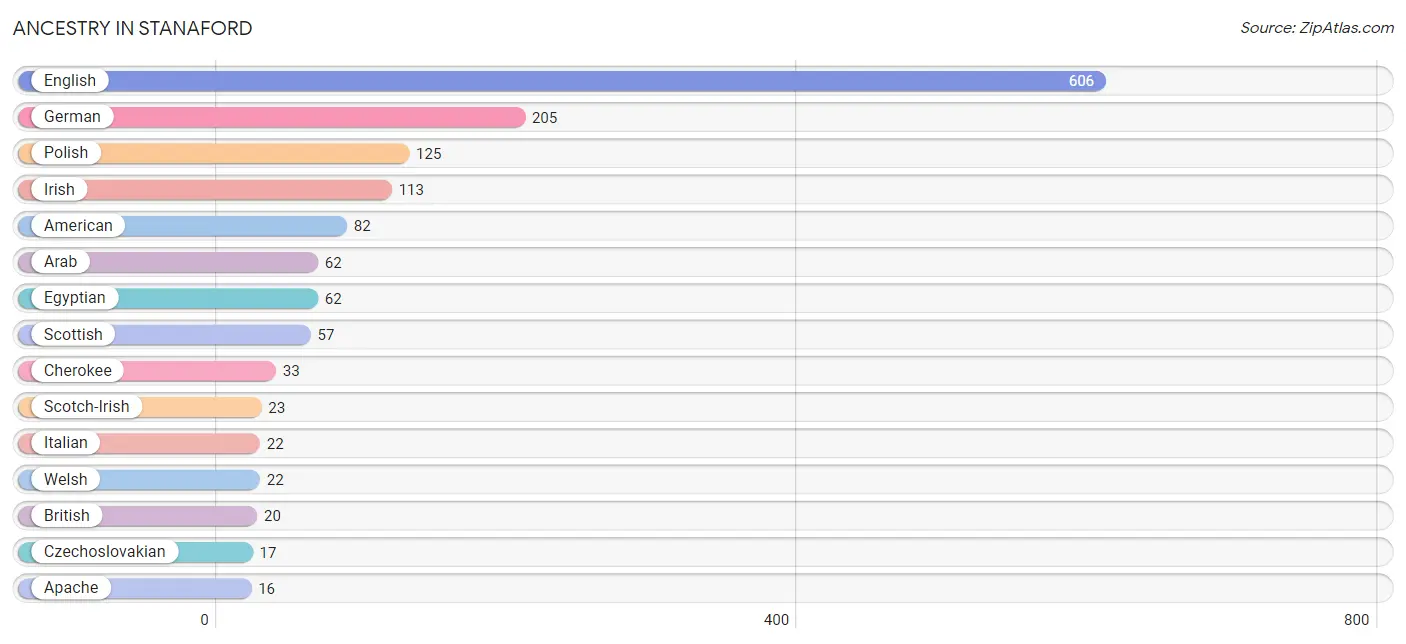
Ancestry in Stanaford
The most populous ancestries reported in Stanaford are English (606 | 43.2%), German (205 | 14.6%), Polish (125 | 8.9%), Irish (113 | 8.1%), and American (82 | 5.9%), together accounting for 80.7% of all Stanaford residents.
| Ancestry | # Population | % Population |
| American | 82 | 5.9% |
| Apache | 16 | 1.1% |
| Arab | 62 | 4.4% |
| British | 20 | 1.4% |
| Bulgarian | 4 | 0.3% |
| Cherokee | 33 | 2.4% |
| Czechoslovakian | 17 | 1.2% |
| Dutch | 8 | 0.6% |
| Egyptian | 62 | 4.4% |
| English | 606 | 43.2% |
| German | 205 | 14.6% |
| Irish | 113 | 8.1% |
| Italian | 22 | 1.6% |
| Mexican | 14 | 1.0% |
| Polish | 125 | 8.9% |
| Romanian | 12 | 0.9% |
| Russian | 12 | 0.9% |
| Scotch-Irish | 23 | 1.6% |
| Scottish | 57 | 4.1% |
| Slavic | 10 | 0.7% |
| Welsh | 22 | 1.6% | View All 21 Rows |
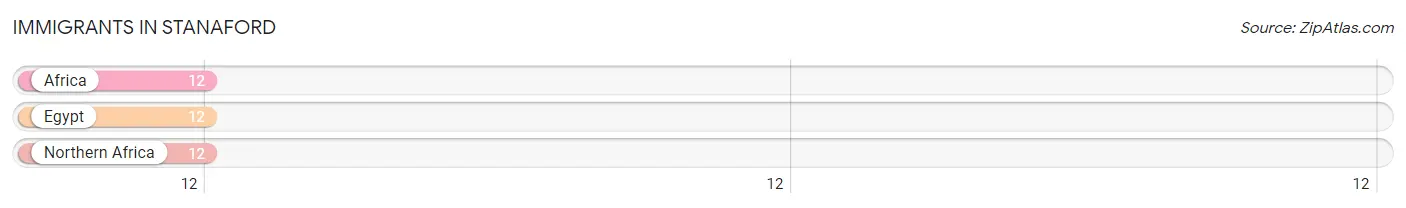
Immigrants in Stanaford
The most numerous immigrant groups reported in Stanaford came from Africa (12 | 0.9%), Egypt (12 | 0.9%), and Northern Africa (12 | 0.9%), together accounting for 2.6% of all Stanaford residents.
| Immigration Origin | # Population | % Population |
| Africa | 12 | 0.9% |
| Egypt | 12 | 0.9% |
| Northern Africa | 12 | 0.9% | View All 3 Rows |
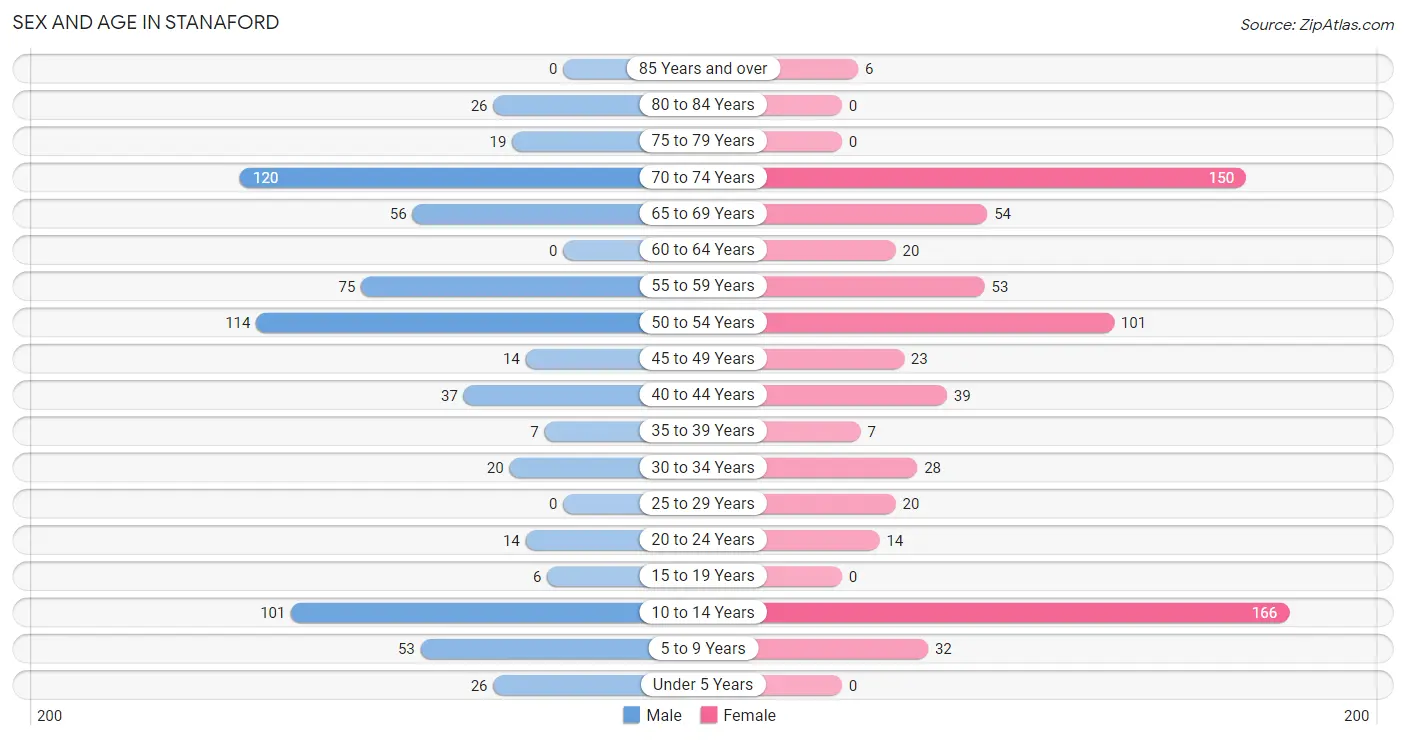
Sex and Age in Stanaford
Sex and Age in Stanaford
The most populous age groups in Stanaford are 70 to 74 Years (120 | 17.4%) for men and 10 to 14 Years (166 | 23.3%) for women.
| Age Bracket | Male | Female |
| Under 5 Years | 26 (3.8%) | 0 (0.0%) |
| 5 to 9 Years | 53 (7.7%) | 32 (4.5%) |
| 10 to 14 Years | 101 (14.7%) | 166 (23.3%) |
| 15 to 19 Years | 6 (0.9%) | 0 (0.0%) |
| 20 to 24 Years | 14 (2.0%) | 14 (2.0%) |
| 25 to 29 Years | 0 (0.0%) | 20 (2.8%) |
| 30 to 34 Years | 20 (2.9%) | 28 (3.9%) |
| 35 to 39 Years | 7 (1.0%) | 7 (1.0%) |
| 40 to 44 Years | 37 (5.4%) | 39 (5.5%) |
| 45 to 49 Years | 14 (2.0%) | 23 (3.2%) |
| 50 to 54 Years | 114 (16.6%) | 101 (14.2%) |
| 55 to 59 Years | 75 (10.9%) | 53 (7.4%) |
| 60 to 64 Years | 0 (0.0%) | 20 (2.8%) |
| 65 to 69 Years | 56 (8.1%) | 54 (7.6%) |
| 70 to 74 Years | 120 (17.4%) | 150 (21.0%) |
| 75 to 79 Years | 19 (2.8%) | 0 (0.0%) |
| 80 to 84 Years | 26 (3.8%) | 0 (0.0%) |
| 85 Years and over | 0 (0.0%) | 6 (0.8%) |
| Total | 688 (100.0%) | 713 (100.0%) |
Families and Households in Stanaford
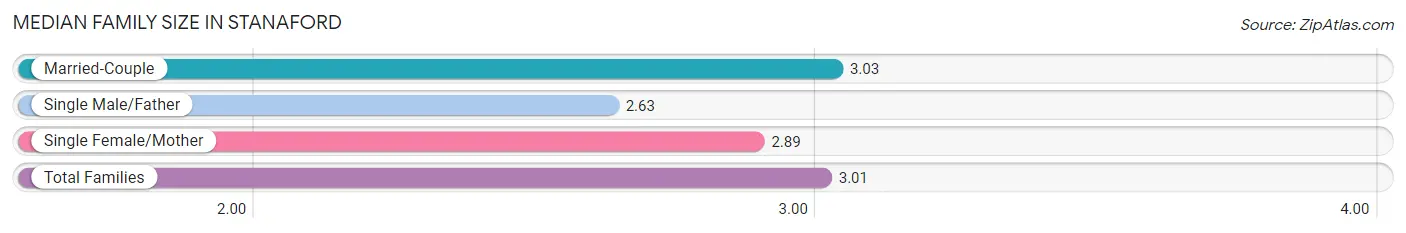
Median Family Size in Stanaford
The median family size in Stanaford is 3.01 persons per family, with married-couple families (360 | 87.4%) accounting for the largest median family size of 3.03 persons per family. On the other hand, single male/father families (8 | 1.9%) represent the smallest median family size with 2.63 persons per family.
| Family Type | # Families | Family Size |
| Married-Couple | 360 (87.4%) | 3.03 |
| Single Male/Father | 8 (1.9%) | 2.63 |
| Single Female/Mother | 44 (10.7%) | 2.89 |
| Total Families | 412 (100.0%) | 3.01 |
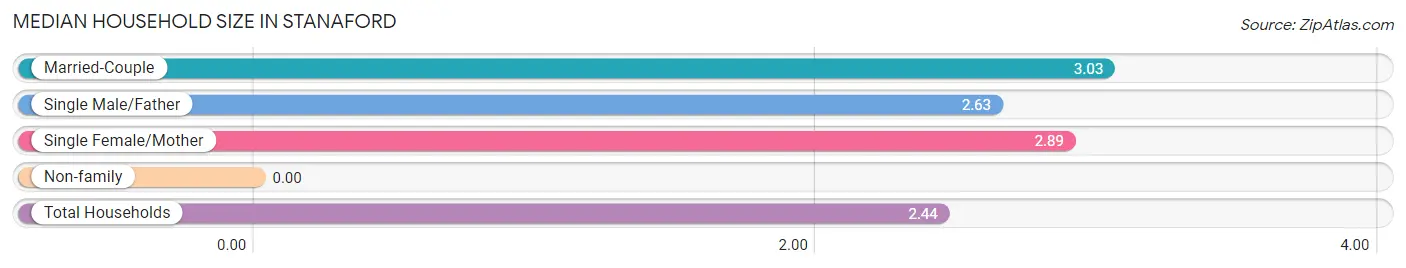
Median Household Size in Stanaford
| Household Type | # Households | Household Size |
| Married-Couple | 360 (62.7%) | 3.03 |
| Single Male/Father | 8 (1.4%) | 2.63 |
| Single Female/Mother | 44 (7.7%) | 2.89 |
| Non-family | 162 (28.2%) | - |
| Total Households | 574 (100.0%) | 2.44 |
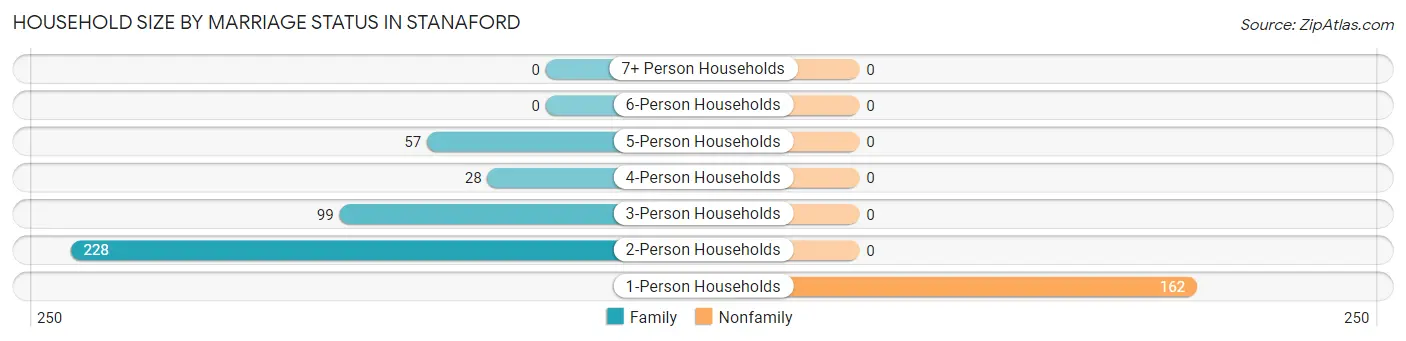
Household Size by Marriage Status in Stanaford
Out of a total of 574 households in Stanaford, 412 (71.8%) are family households, while 162 (28.2%) are nonfamily households. The most numerous type of family households are 2-person households, comprising 228, and the most common type of nonfamily households are 1-person households, comprising 162.
| Household Size | Family Households | Nonfamily Households |
| 1-Person Households | - | 162 (28.2%) |
| 2-Person Households | 228 (39.7%) | 0 (0.0%) |
| 3-Person Households | 99 (17.2%) | 0 (0.0%) |
| 4-Person Households | 28 (4.9%) | 0 (0.0%) |
| 5-Person Households | 57 (9.9%) | 0 (0.0%) |
| 6-Person Households | 0 (0.0%) | 0 (0.0%) |
| 7+ Person Households | 0 (0.0%) | 0 (0.0%) |
| Total | 412 (71.8%) | 162 (28.2%) |
Female Fertility in Stanaford
Fertility by Age in Stanaford
Average fertility rate in Stanaford is 42.0 births per 1,000 women. Women in the age bracket of 35 to 50 years have the highest fertility rate with 67.0 births per 1,000 women. Women in the age bracket of 35 to 50 years acount for 100.0% of all women with births.
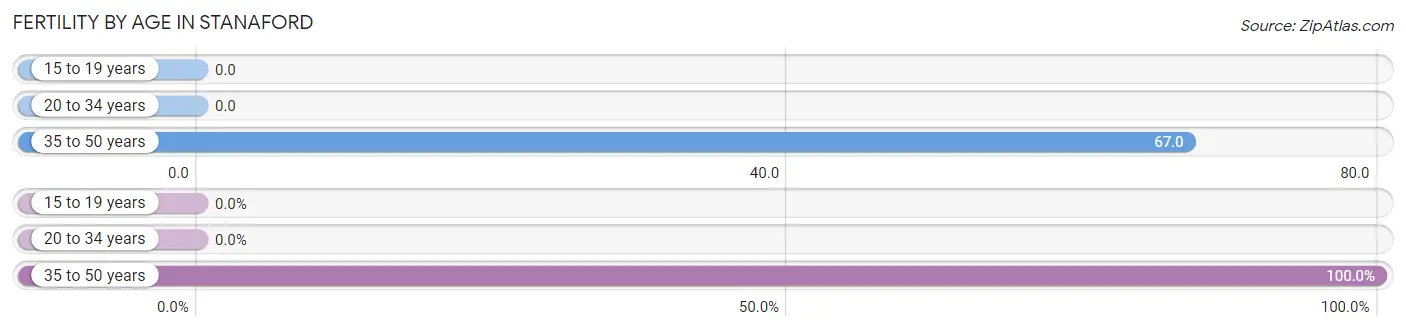
| Age Bracket | Women with Births | Births / 1,000 Women |
| 15 to 19 years | 0 (0.0%) | 0.0 |
| 20 to 34 years | 0 (0.0%) | 0.0 |
| 35 to 50 years | 7 (100.0%) | 67.0 |
| Total | 7 (100.0%) | 42.0 |
Fertility by Age by Marriage Status in Stanaford
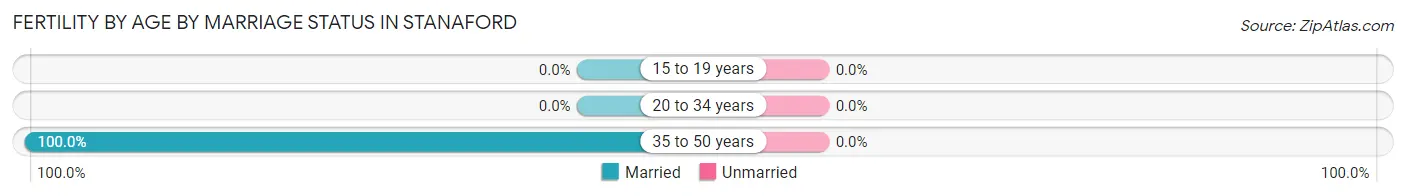
| Age Bracket | Married | Unmarried |
| 15 to 19 years | 0 (0.0%) | 0 (0.0%) |
| 20 to 34 years | 0 (0.0%) | 0 (0.0%) |
| 35 to 50 years | 7 (100.0%) | 0 (0.0%) |
| Total | 7 (100.0%) | 0 (0.0%) |
Fertility by Education in Stanaford
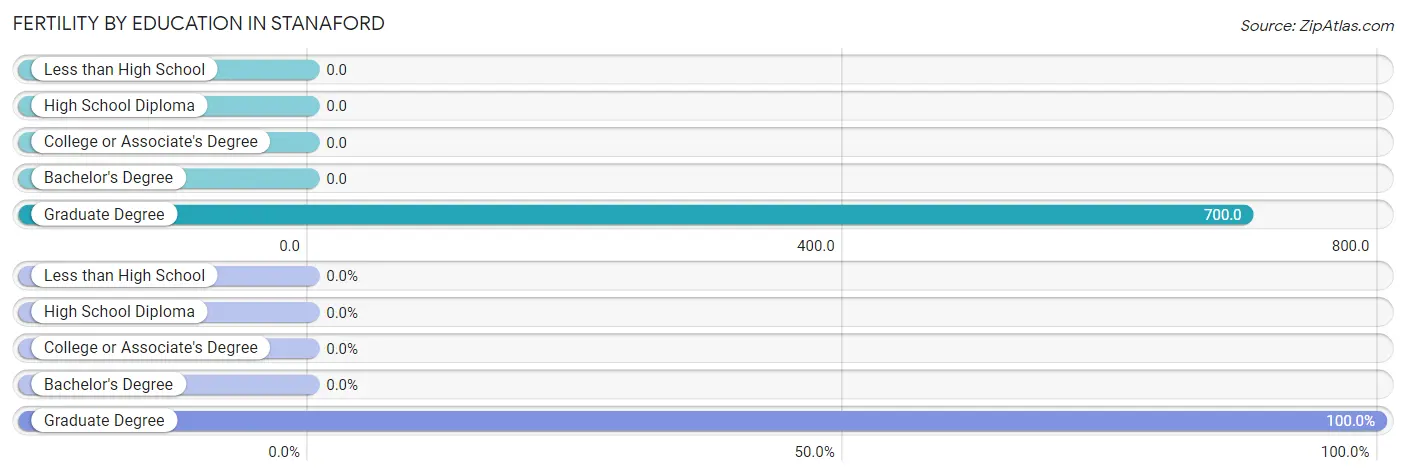
| Educational Attainment | Women with Births | Births / 1,000 Women |
| Less than High School | 0 (0.0%) | 0.0 |
| High School Diploma | 0 (0.0%) | 0.0 |
| College or Associate's Degree | 0 (0.0%) | 0.0 |
| Bachelor's Degree | 0 (0.0%) | 0.0 |
| Graduate Degree | 7 (100.0%) | 700.0 |
| Total | 7 (100.0%) | 42.0 |
Fertility by Education by Marriage Status in Stanaford
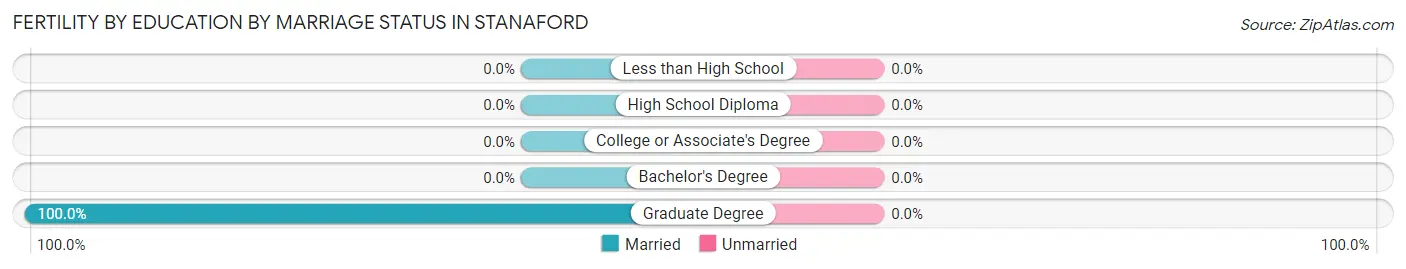
| Educational Attainment | Married | Unmarried |
| Less than High School | 0 (0.0%) | 0 (0.0%) |
| High School Diploma | 0 (0.0%) | 0 (0.0%) |
| College or Associate's Degree | 0 (0.0%) | 0 (0.0%) |
| Bachelor's Degree | 0 (0.0%) | 0 (0.0%) |
| Graduate Degree | 7 (100.0%) | 0 (0.0%) |
| Total | 7 (100.0%) | 0 (0.0%) |
Income in Stanaford
Income Overview in Stanaford
Per Capita Income in Stanaford is $25,690, while median incomes of families and households are $64,360 and $60,375 respectively.
| Characteristic | Number | Measure |
| Per Capita Income | 1,401 | $25,690 |
| Median Family Income | 412 | $64,360 |
| Mean Family Income | 412 | $68,262 |
| Median Household Income | 574 | $60,375 |
| Mean Household Income | 574 | $59,973 |
| Income Deficit | 412 | $10,809 |
| Wage / Income Gap (%) | 1,401 | 21.87% |
| Wage / Income Gap ($) | 1,401 | 78.13¢ per $1 |
| Gini / Inequality Index | 1,401 | 0.42 |
Earnings by Sex in Stanaford
Average Earnings in Stanaford are $41,250, $39,844 for men and $51,000 for women, a difference of 21.9%.
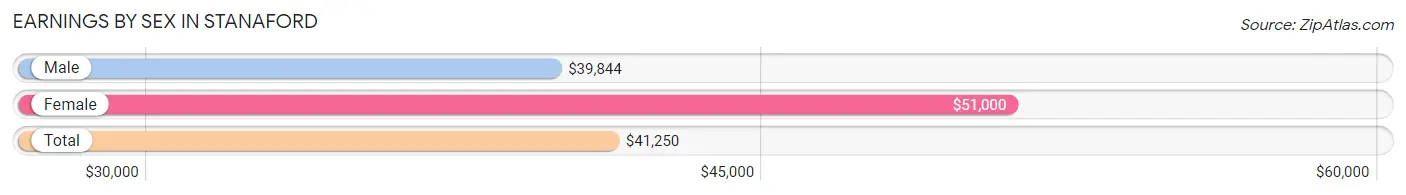
| Sex | Number | Average Earnings |
| Male | 354 (59.4%) | $39,844 |
| Female | 242 (40.6%) | $51,000 |
| Total | 596 (100.0%) | $41,250 |
Earnings by Sex by Income Bracket in Stanaford
The most common earnings brackets in Stanaford are $45,000 to $49,999 for men (70 | 19.8%) and $75,000 to $99,999 for women (59 | 24.4%).
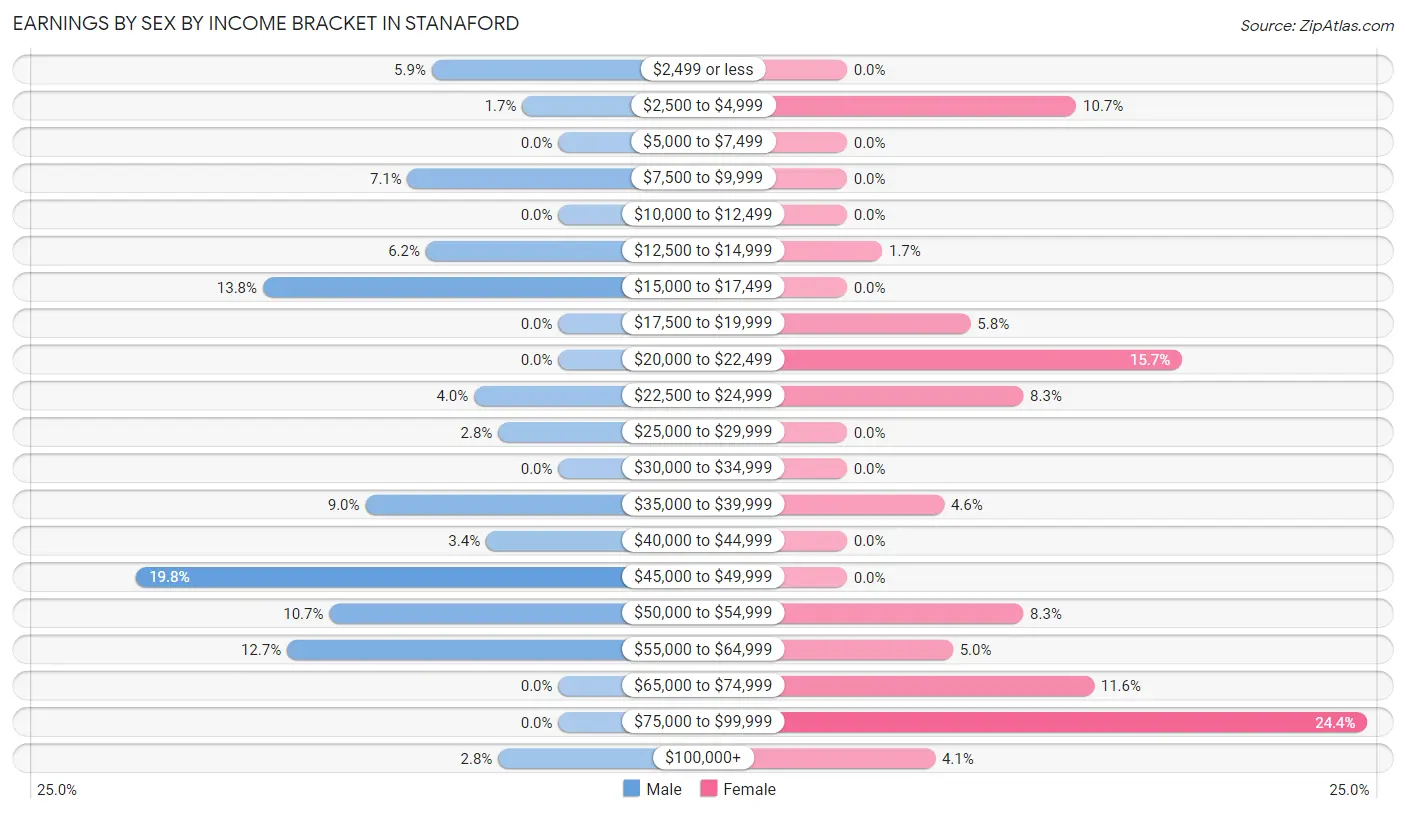
| Income | Male | Female |
| $2,499 or less | 21 (5.9%) | 0 (0.0%) |
| $2,500 to $4,999 | 6 (1.7%) | 26 (10.7%) |
| $5,000 to $7,499 | 0 (0.0%) | 0 (0.0%) |
| $7,500 to $9,999 | 25 (7.1%) | 0 (0.0%) |
| $10,000 to $12,499 | 0 (0.0%) | 0 (0.0%) |
| $12,500 to $14,999 | 22 (6.2%) | 4 (1.7%) |
| $15,000 to $17,499 | 49 (13.8%) | 0 (0.0%) |
| $17,500 to $19,999 | 0 (0.0%) | 14 (5.8%) |
| $20,000 to $22,499 | 0 (0.0%) | 38 (15.7%) |
| $22,500 to $24,999 | 14 (4.0%) | 20 (8.3%) |
| $25,000 to $29,999 | 10 (2.8%) | 0 (0.0%) |
| $30,000 to $34,999 | 0 (0.0%) | 0 (0.0%) |
| $35,000 to $39,999 | 32 (9.0%) | 11 (4.5%) |
| $40,000 to $44,999 | 12 (3.4%) | 0 (0.0%) |
| $45,000 to $49,999 | 70 (19.8%) | 0 (0.0%) |
| $50,000 to $54,999 | 38 (10.7%) | 20 (8.3%) |
| $55,000 to $64,999 | 45 (12.7%) | 12 (5.0%) |
| $65,000 to $74,999 | 0 (0.0%) | 28 (11.6%) |
| $75,000 to $99,999 | 0 (0.0%) | 59 (24.4%) |
| $100,000+ | 10 (2.8%) | 10 (4.1%) |
| Total | 354 (100.0%) | 242 (100.0%) |
Earnings by Sex by Educational Attainment in Stanaford
Average earnings in Stanaford are $41,667 for men and $51,875 for women, a difference of 19.7%. Men with an educational attainment of high school diploma enjoy the highest average annual earnings of $46,054, while those with graduate degree education earn the least with $41,354. Women with an educational attainment of college or associate's degree earn the most with the average annual earnings of $75,000, while those with bachelor's degree education have the smallest earnings of $71,250.
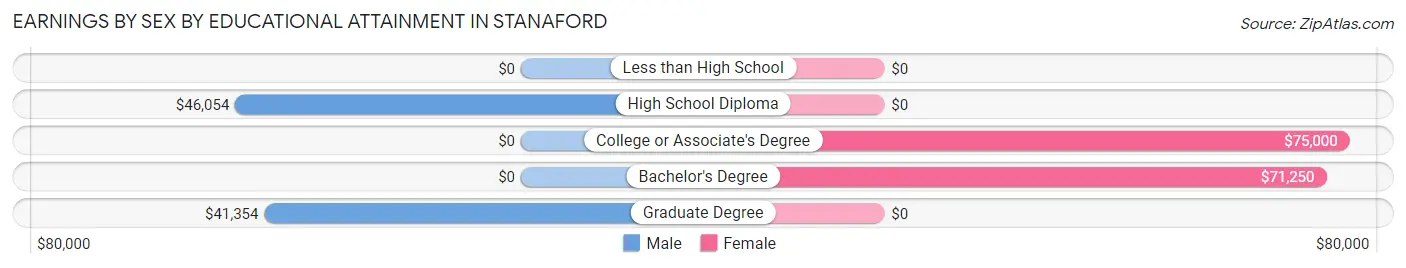
| Educational Attainment | Male Income | Female Income |
| Less than High School | - | - |
| High School Diploma | $46,054 | $0 |
| College or Associate's Degree | - | - |
| Bachelor's Degree | - | - |
| Graduate Degree | $41,354 | $0 |
| Total | $41,667 | $51,875 |
Family Income in Stanaford
Family Income Brackets in Stanaford
According to the Stanaford family income data, there are 125 families falling into the $50,000 to $74,999 income range, which is the most common income bracket and makes up 30.3% of all families.
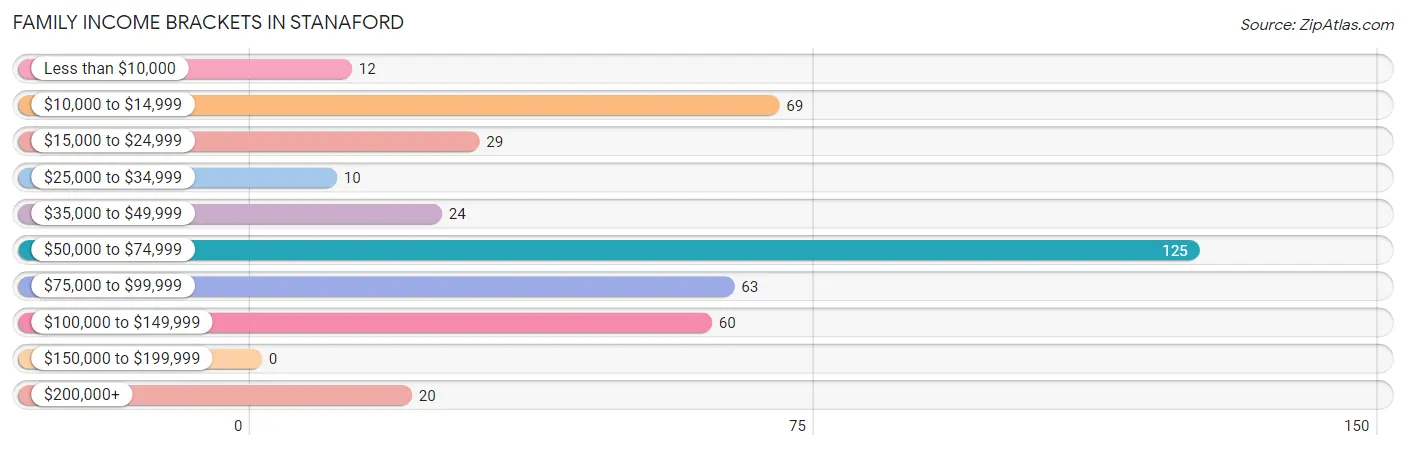
| Income Bracket | # Families | % Families |
| Less than $10,000 | 12 | 2.9% |
| $10,000 to $14,999 | 69 | 16.7% |
| $15,000 to $24,999 | 29 | 7.0% |
| $25,000 to $34,999 | 10 | 2.4% |
| $35,000 to $49,999 | 24 | 5.8% |
| $50,000 to $74,999 | 125 | 30.3% |
| $75,000 to $99,999 | 63 | 15.3% |
| $100,000 to $149,999 | 60 | 14.6% |
| $150,000 to $199,999 | 0 | 0.0% |
| $200,000+ | 20 | 4.9% |
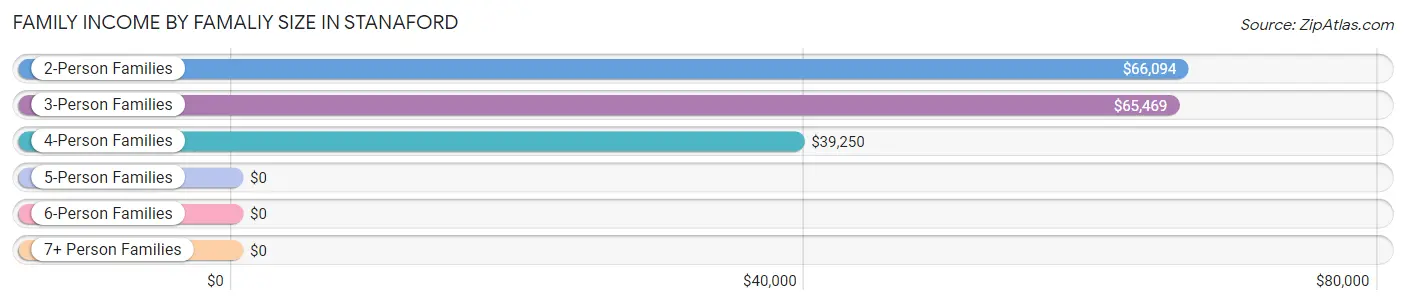
Family Income by Famaliy Size in Stanaford
2-person families (228 | 55.3%) account for the highest median family income in Stanaford with $66,094 per family, while 2-person families (228 | 55.3%) have the highest median income of $33,047 per family member.
| Income Bracket | # Families | Median Income |
| 2-Person Families | 228 (55.3%) | $66,094 |
| 3-Person Families | 99 (24.0%) | $65,469 |
| 4-Person Families | 28 (6.8%) | $39,250 |
| 5-Person Families | 57 (13.8%) | $0 |
| 6-Person Families | 0 (0.0%) | $0 |
| 7+ Person Families | 0 (0.0%) | $0 |
| Total | 412 (100.0%) | $64,360 |
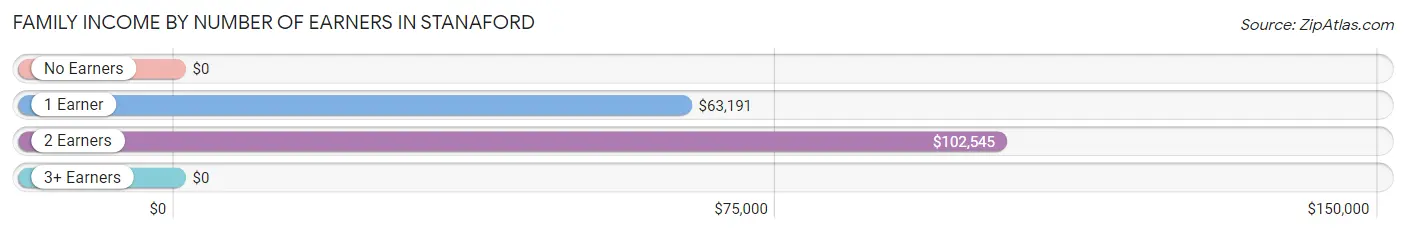
Family Income by Number of Earners in Stanaford
| Number of Earners | # Families | Median Income |
| No Earners | 84 (20.4%) | $0 |
| 1 Earner | 169 (41.0%) | $63,191 |
| 2 Earners | 159 (38.6%) | $102,545 |
| 3+ Earners | 0 (0.0%) | $0 |
| Total | 412 (100.0%) | $64,360 |
Household Income in Stanaford
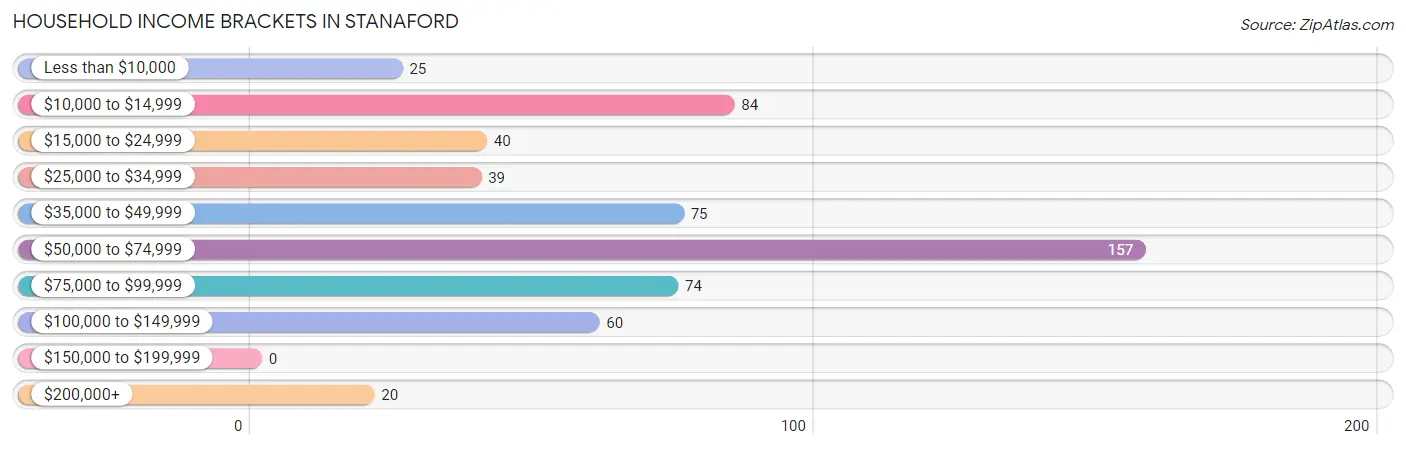
Household Income Brackets in Stanaford
With 157 households falling in the category, the $50,000 to $74,999 income range is the most frequent in Stanaford, accounting for 27.4% of all households.
| Income Bracket | # Households | % Households |
| Less than $10,000 | 25 | 4.4% |
| $10,000 to $14,999 | 84 | 14.6% |
| $15,000 to $24,999 | 40 | 7.0% |
| $25,000 to $34,999 | 39 | 6.8% |
| $35,000 to $49,999 | 75 | 13.1% |
| $50,000 to $74,999 | 157 | 27.4% |
| $75,000 to $99,999 | 74 | 12.9% |
| $100,000 to $149,999 | 60 | 10.5% |
| $150,000 to $199,999 | 0 | 0.0% |
| $200,000+ | 20 | 3.5% |
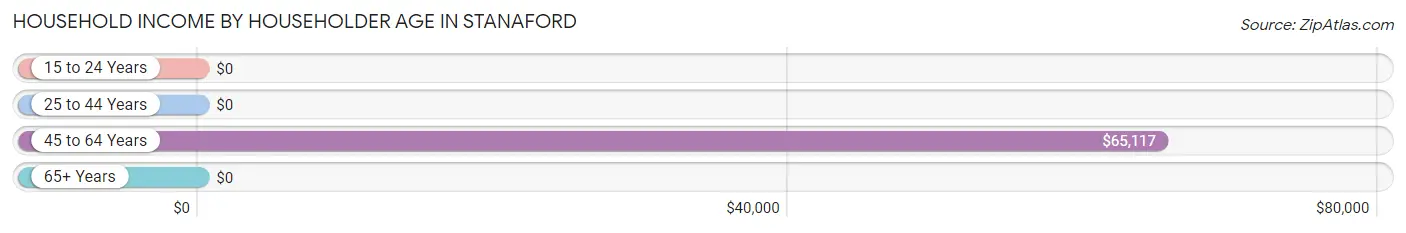
Household Income by Householder Age in Stanaford
The median household income in Stanaford is $60,375, with the highest median household income of $65,117 found in the 45 to 64 years age bracket for the primary householder. A total of 225 households (39.2%) fall into this category.
| Income Bracket | # Households | Median Income |
| 15 to 24 Years | 0 (0.0%) | $0 |
| 25 to 44 Years | 92 (16.0%) | $0 |
| 45 to 64 Years | 225 (39.2%) | $65,117 |
| 65+ Years | 257 (44.8%) | $0 |
| Total | 574 (100.0%) | $60,375 |
Poverty in Stanaford
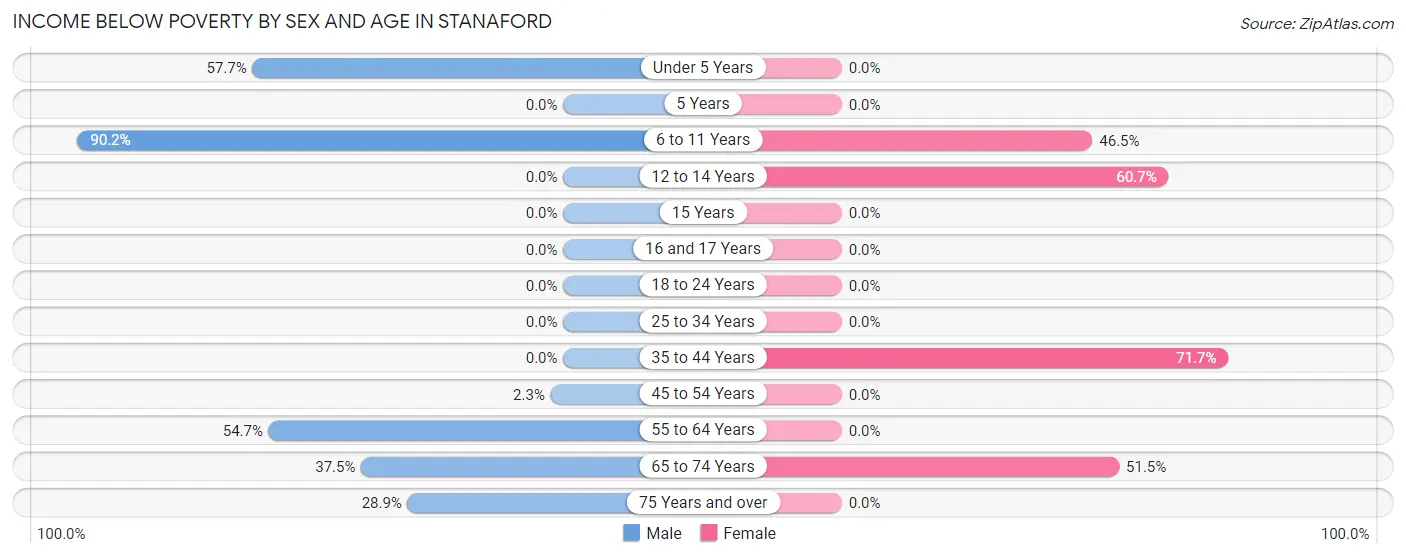
Income Below Poverty by Sex and Age in Stanaford
With 26.7% poverty level for males and 35.3% for females among the residents of Stanaford, 6 to 11 year old males and 35 to 44 year old females are the most vulnerable to poverty, with 46 males (90.2%) and 33 females (71.7%) in their respective age groups living below the poverty level.
| Age Bracket | Male | Female |
| Under 5 Years | 15 (57.7%) | 0 (0.0%) |
| 5 Years | 0 (0.0%) | 0 (0.0%) |
| 6 to 11 Years | 46 (90.2%) | 20 (46.5%) |
| 12 to 14 Years | 0 (0.0%) | 94 (60.7%) |
| 15 Years | 0 (0.0%) | 0 (0.0%) |
| 16 and 17 Years | 0 (0.0%) | 0 (0.0%) |
| 18 to 24 Years | 0 (0.0%) | 0 (0.0%) |
| 25 to 34 Years | 0 (0.0%) | 0 (0.0%) |
| 35 to 44 Years | 0 (0.0%) | 33 (71.7%) |
| 45 to 54 Years | 3 (2.3%) | 0 (0.0%) |
| 55 to 64 Years | 41 (54.7%) | 0 (0.0%) |
| 65 to 74 Years | 66 (37.5%) | 105 (51.5%) |
| 75 Years and over | 13 (28.9%) | 0 (0.0%) |
| Total | 184 (26.7%) | 252 (35.3%) |
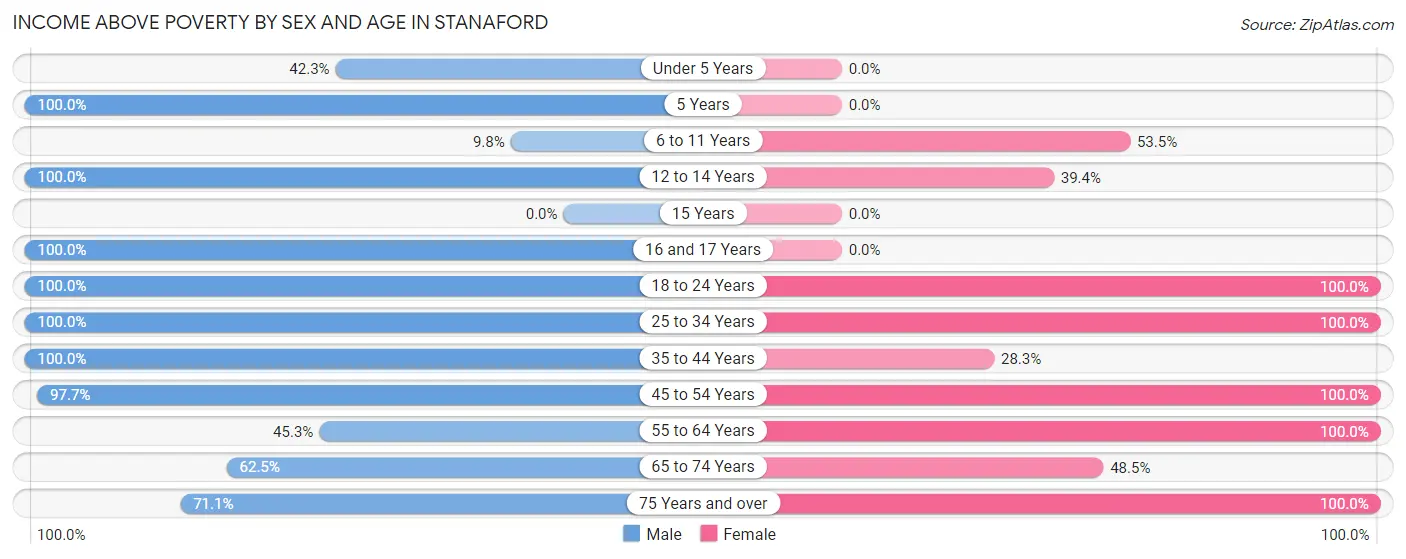
Income Above Poverty by Sex and Age in Stanaford
According to the poverty statistics in Stanaford, males aged 5 years and females aged 18 to 24 years are the age groups that are most secure financially, with 100.0% of males and 100.0% of females in these age groups living above the poverty line.
| Age Bracket | Male | Female |
| Under 5 Years | 11 (42.3%) | 0 (0.0%) |
| 5 Years | 19 (100.0%) | 0 (0.0%) |
| 6 to 11 Years | 5 (9.8%) | 23 (53.5%) |
| 12 to 14 Years | 84 (100.0%) | 61 (39.4%) |
| 15 Years | 0 (0.0%) | 0 (0.0%) |
| 16 and 17 Years | 6 (100.0%) | 0 (0.0%) |
| 18 to 24 Years | 14 (100.0%) | 14 (100.0%) |
| 25 to 34 Years | 20 (100.0%) | 48 (100.0%) |
| 35 to 44 Years | 44 (100.0%) | 13 (28.3%) |
| 45 to 54 Years | 125 (97.7%) | 124 (100.0%) |
| 55 to 64 Years | 34 (45.3%) | 73 (100.0%) |
| 65 to 74 Years | 110 (62.5%) | 99 (48.5%) |
| 75 Years and over | 32 (71.1%) | 6 (100.0%) |
| Total | 504 (73.3%) | 461 (64.7%) |
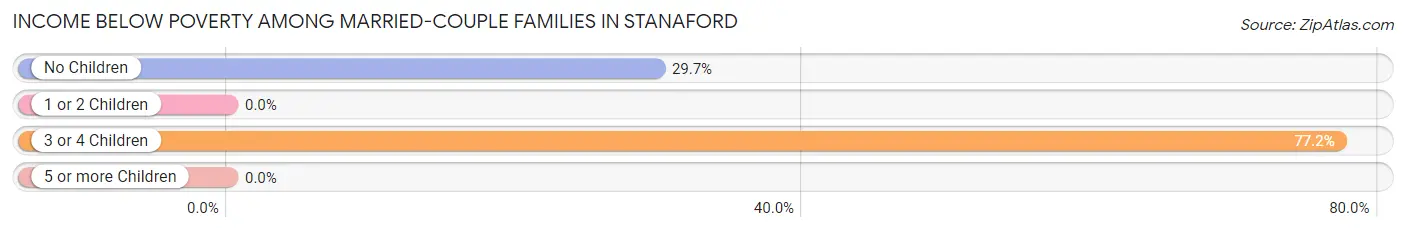
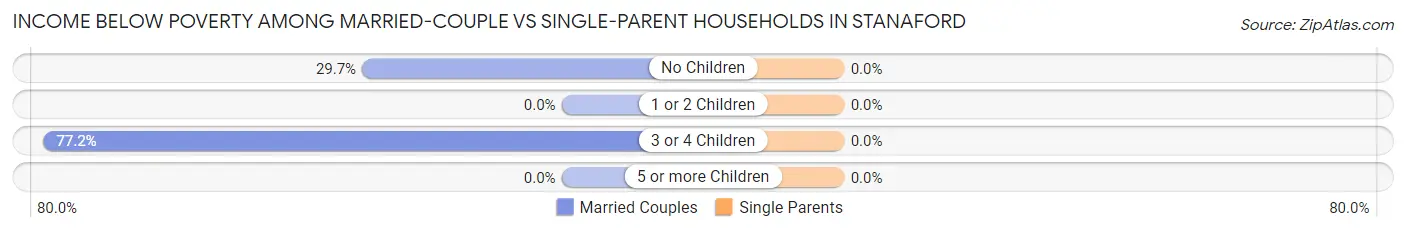
Income Below Poverty Among Married-Couple Families in Stanaford
The poverty statistics for married-couple families in Stanaford show that 30.6% or 110 of the total 360 families live below the poverty line. Families with 3 or 4 children have the highest poverty rate of 77.2%, comprising of 44 families. On the other hand, families with 1 or 2 children have the lowest poverty rate of 0.0%, which includes 0 families.
| Children | Above Poverty | Below Poverty |
| No Children | 156 (70.3%) | 66 (29.7%) |
| 1 or 2 Children | 81 (100.0%) | 0 (0.0%) |
| 3 or 4 Children | 13 (22.8%) | 44 (77.2%) |
| 5 or more Children | 0 (0.0%) | 0 (0.0%) |
| Total | 250 (69.4%) | 110 (30.6%) |
Income Below Poverty Among Single-Parent Households in Stanaford
| Children | Single Father | Single Mother |
| No Children | 0 (0.0%) | 0 (0.0%) |
| 1 or 2 Children | 0 (0.0%) | 0 (0.0%) |
| 3 or 4 Children | 0 (0.0%) | 0 (0.0%) |
| 5 or more Children | 0 (0.0%) | 0 (0.0%) |
| Total | 0 (0.0%) | 0 (0.0%) |
Income Below Poverty Among Married-Couple vs Single-Parent Households in Stanaford
| Children | Married-Couple Families | Single-Parent Households |
| No Children | 66 (29.7%) | 0 (0.0%) |
| 1 or 2 Children | 0 (0.0%) | 0 (0.0%) |
| 3 or 4 Children | 44 (77.2%) | 0 (0.0%) |
| 5 or more Children | 0 (0.0%) | 0 (0.0%) |
| Total | 110 (30.6%) | 0 (0.0%) |
Employment Characteristics in Stanaford
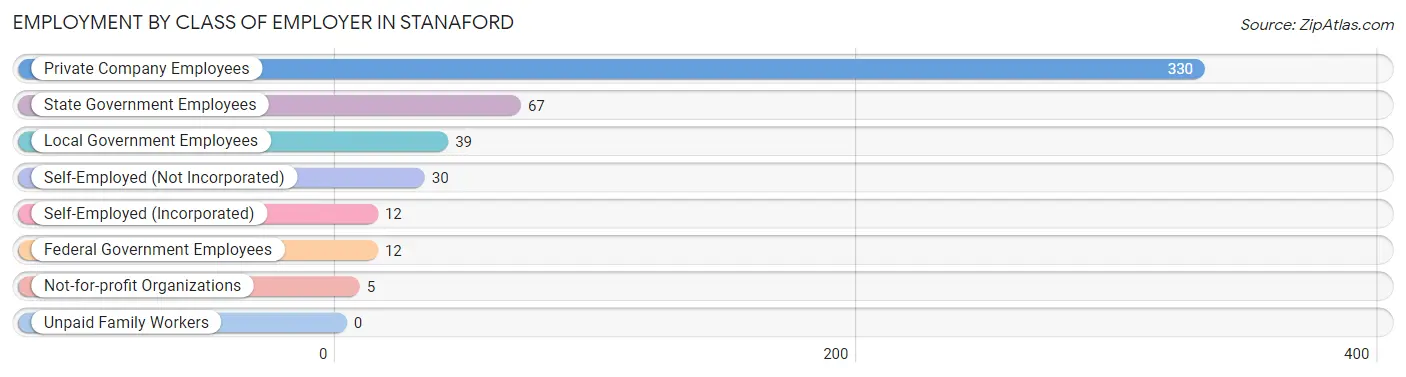
Employment by Class of Employer in Stanaford
Among the 495 employed individuals in Stanaford, private company employees (330 | 66.7%), state government employees (67 | 13.5%), and local government employees (39 | 7.9%) make up the most common classes of employment.
| Employer Class | # Employees | % Employees |
| Private Company Employees | 330 | 66.7% |
| Self-Employed (Incorporated) | 12 | 2.4% |
| Self-Employed (Not Incorporated) | 30 | 6.1% |
| Not-for-profit Organizations | 5 | 1.0% |
| Local Government Employees | 39 | 7.9% |
| State Government Employees | 67 | 13.5% |
| Federal Government Employees | 12 | 2.4% |
| Unpaid Family Workers | 0 | 0.0% |
| Total | 495 | 100.0% |
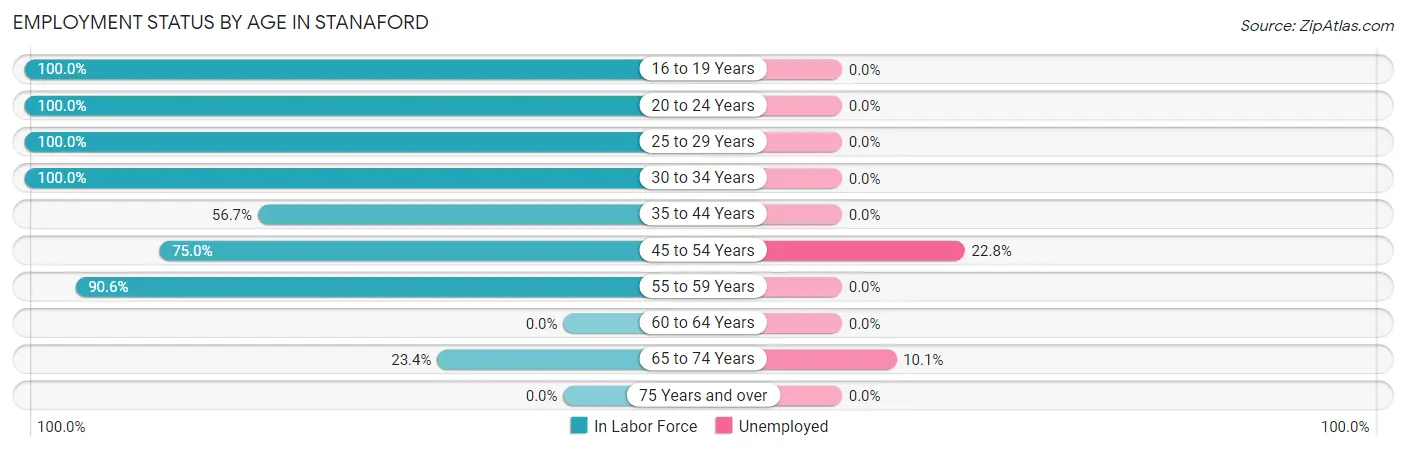
Employment Status by Age in Stanaford
According to the labor force statistics for Stanaford, out of the total population over 16 years of age (1,023), 53.5% or 547 individuals are in the labor force, with 9.5% or 52 of them unemployed. The age group with the highest labor force participation rate is 16 to 19 years, with 100.0% or 6 individuals in the labor force. Within the labor force, the 45 to 54 years age range has the highest percentage of unemployed individuals, with 22.8% or 43 of them being unemployed.
| Age Bracket | In Labor Force | Unemployed |
| 16 to 19 Years | 6 (100.0%) | 0 (0.0%) |
| 20 to 24 Years | 28 (100.0%) | 0 (0.0%) |
| 25 to 29 Years | 20 (100.0%) | 0 (0.0%) |
| 30 to 34 Years | 48 (100.0%) | 0 (0.0%) |
| 35 to 44 Years | 51 (56.7%) | 0 (0.0%) |
| 45 to 54 Years | 189 (75.0%) | 43 (22.8%) |
| 55 to 59 Years | 116 (90.6%) | 0 (0.0%) |
| 60 to 64 Years | 0 (0.0%) | 0 (0.0%) |
| 65 to 74 Years | 89 (23.4%) | 9 (10.1%) |
| 75 Years and over | 0 (0.0%) | 0 (0.0%) |
| Total | 547 (53.5%) | 52 (9.5%) |
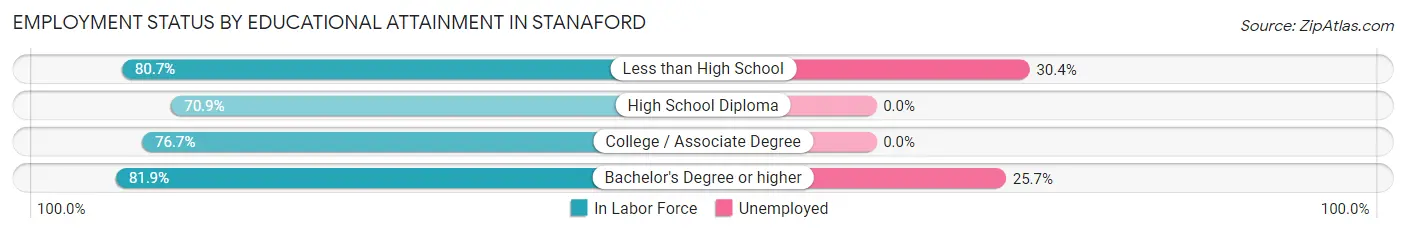
Employment Status by Educational Attainment in Stanaford
According to labor force statistics for Stanaford, 76.0% of individuals (424) out of the total population between 25 and 64 years of age (558) are in the labor force, with 10.1% or 43 of them being unemployed. The group with the highest labor force participation rate are those with the educational attainment of bachelor's degree or higher, with 81.9% or 113 individuals in the labor force. Within the labor force, individuals with less than high school education have the highest percentage of unemployment, with 30.4% or 14 of them being unemployed.
| Educational Attainment | In Labor Force | Unemployed |
| Less than High School | 46 (80.7%) | 17 (30.4%) |
| High School Diploma | 166 (70.9%) | 0 (0.0%) |
| College / Associate Degree | 99 (76.7%) | 0 (0.0%) |
| Bachelor's Degree or higher | 113 (81.9%) | 35 (25.7%) |
| Total | 424 (76.0%) | 56 (10.1%) |
Employment Occupations by Sex in Stanaford
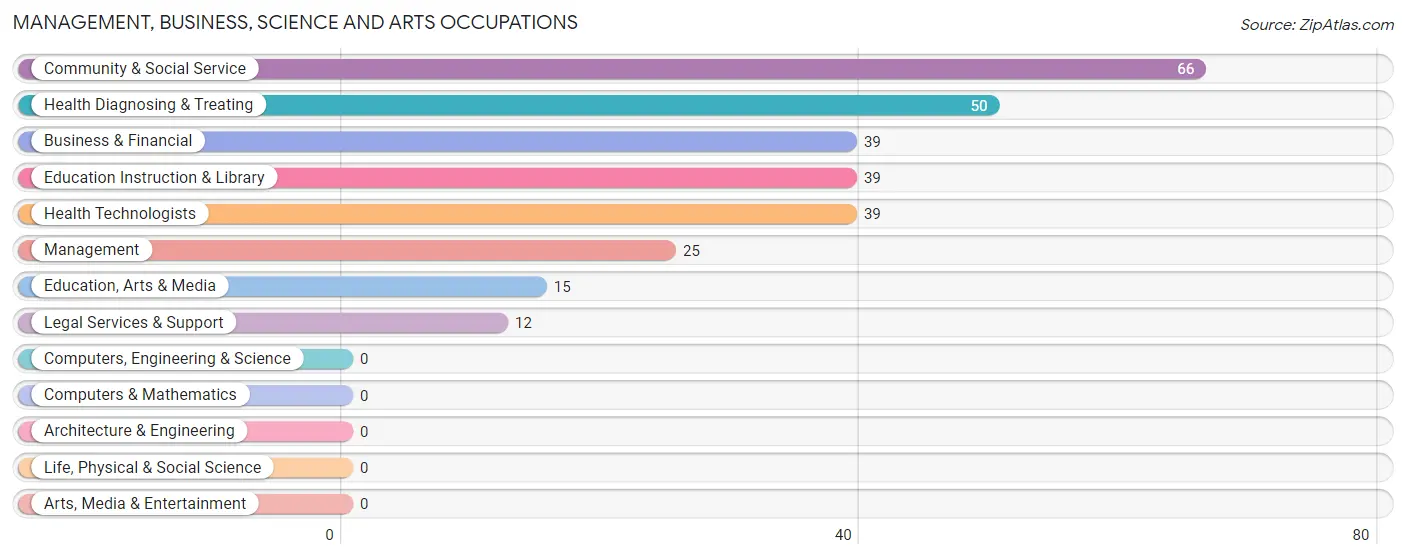
Management, Business, Science and Arts Occupations
The most common Management, Business, Science and Arts occupations in Stanaford are Community & Social Service (66 | 13.3%), Health Diagnosing & Treating (50 | 10.1%), Business & Financial (39 | 7.9%), Education Instruction & Library (39 | 7.9%), and Health Technologists (39 | 7.9%).
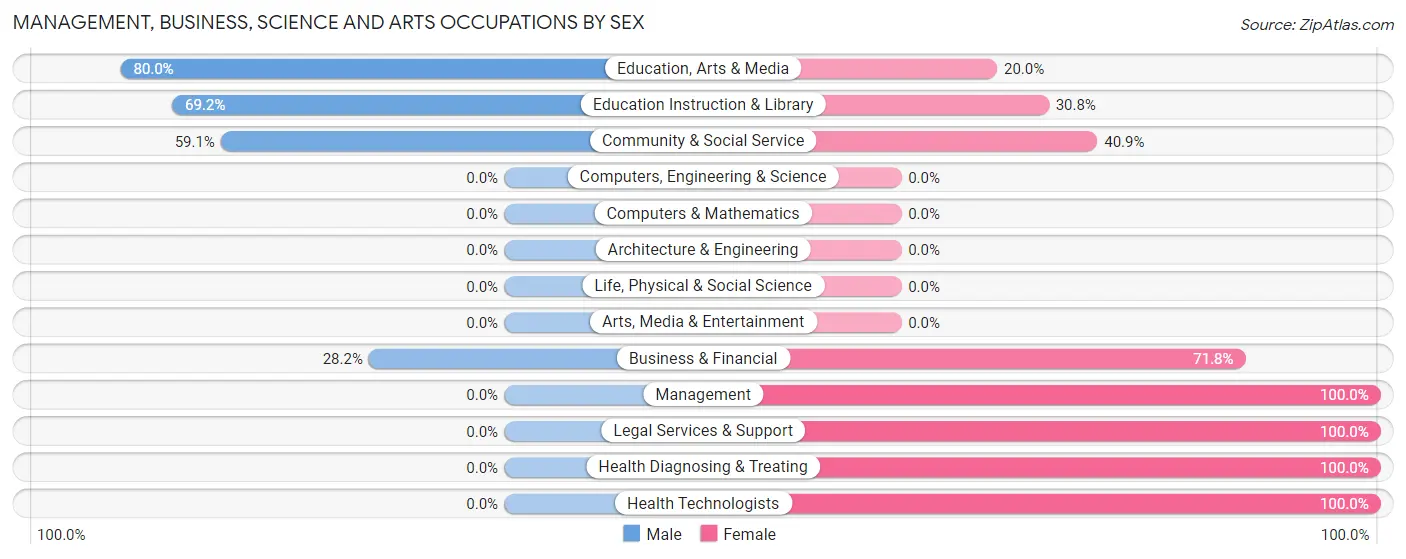
Management, Business, Science and Arts Occupations by Sex
Within the Management, Business, Science and Arts occupations in Stanaford, the most male-oriented occupations are Education, Arts & Media (80.0%), Education Instruction & Library (69.2%), and Community & Social Service (59.1%), while the most female-oriented occupations are Management (100.0%), Legal Services & Support (100.0%), and Health Diagnosing & Treating (100.0%).
| Occupation | Male | Female |
| Management | 0 (0.0%) | 25 (100.0%) |
| Business & Financial | 11 (28.2%) | 28 (71.8%) |
| Computers, Engineering & Science | 0 (0.0%) | 0 (0.0%) |
| Computers & Mathematics | 0 (0.0%) | 0 (0.0%) |
| Architecture & Engineering | 0 (0.0%) | 0 (0.0%) |
| Life, Physical & Social Science | 0 (0.0%) | 0 (0.0%) |
| Community & Social Service | 39 (59.1%) | 27 (40.9%) |
| Education, Arts & Media | 12 (80.0%) | 3 (20.0%) |
| Legal Services & Support | 0 (0.0%) | 12 (100.0%) |
| Education Instruction & Library | 27 (69.2%) | 12 (30.8%) |
| Arts, Media & Entertainment | 0 (0.0%) | 0 (0.0%) |
| Health Diagnosing & Treating | 0 (0.0%) | 50 (100.0%) |
| Health Technologists | 0 (0.0%) | 39 (100.0%) |
| Total (Category) | 50 (27.8%) | 130 (72.2%) |
| Total (Overall) | 308 (62.2%) | 187 (37.8%) |
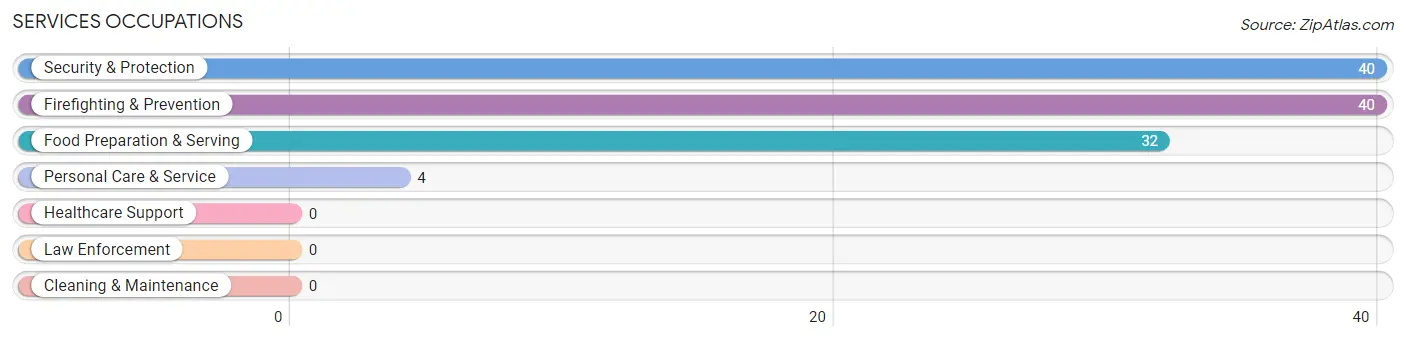
Services Occupations
The most common Services occupations in Stanaford are Security & Protection (40 | 8.1%), Firefighting & Prevention (40 | 8.1%), Food Preparation & Serving (32 | 6.5%), and Personal Care & Service (4 | 0.8%).
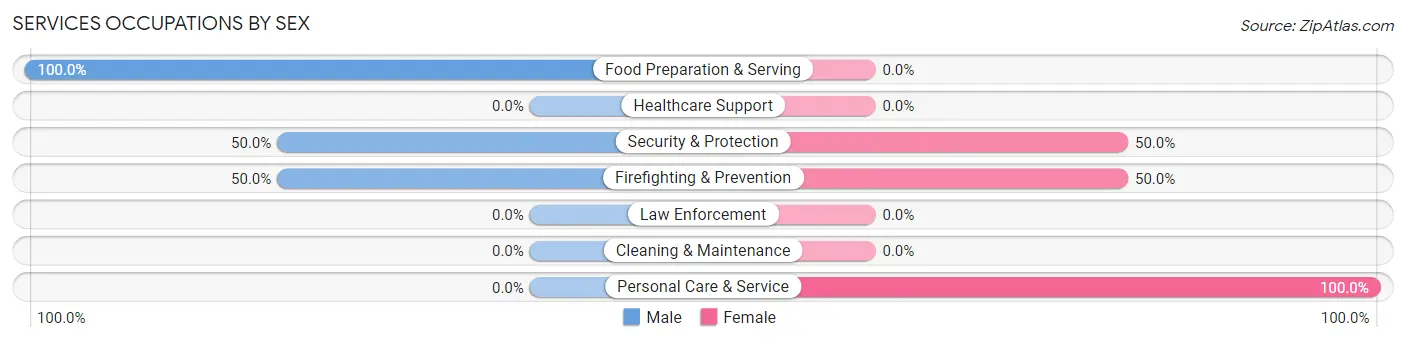
Services Occupations by Sex
Within the Services occupations in Stanaford, the most male-oriented occupations are Food Preparation & Serving (100.0%), Security & Protection (50.0%), and Firefighting & Prevention (50.0%), while the most female-oriented occupations are Personal Care & Service (100.0%), Security & Protection (50.0%), and Firefighting & Prevention (50.0%).
| Occupation | Male | Female |
| Healthcare Support | 0 (0.0%) | 0 (0.0%) |
| Security & Protection | 20 (50.0%) | 20 (50.0%) |
| Firefighting & Prevention | 20 (50.0%) | 20 (50.0%) |
| Law Enforcement | 0 (0.0%) | 0 (0.0%) |
| Food Preparation & Serving | 32 (100.0%) | 0 (0.0%) |
| Cleaning & Maintenance | 0 (0.0%) | 0 (0.0%) |
| Personal Care & Service | 0 (0.0%) | 4 (100.0%) |
| Total (Category) | 52 (68.4%) | 24 (31.6%) |
| Total (Overall) | 308 (62.2%) | 187 (37.8%) |
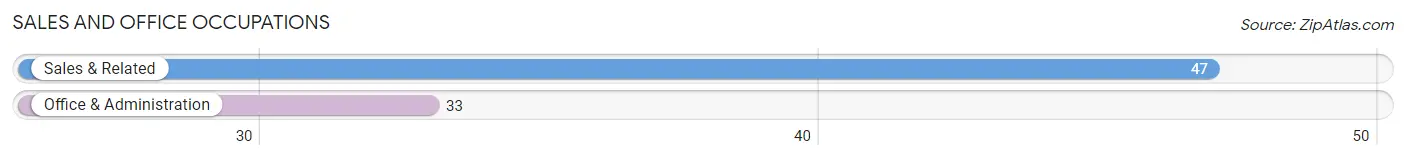
Sales and Office Occupations
The most common Sales and Office occupations in Stanaford are Sales & Related (47 | 9.5%), and Office & Administration (33 | 6.7%).
Sales and Office Occupations by Sex
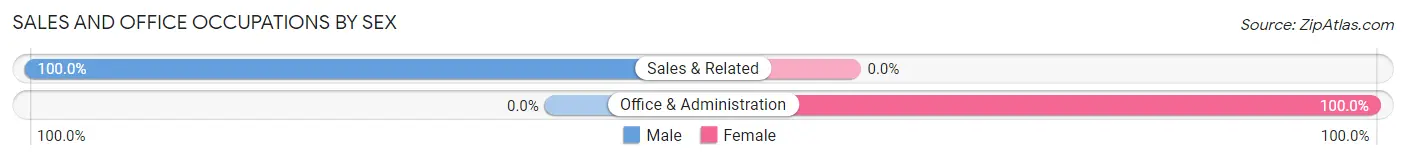
| Occupation | Male | Female |
| Sales & Related | 47 (100.0%) | 0 (0.0%) |
| Office & Administration | 0 (0.0%) | 33 (100.0%) |
| Total (Category) | 47 (58.8%) | 33 (41.2%) |
| Total (Overall) | 308 (62.2%) | 187 (37.8%) |
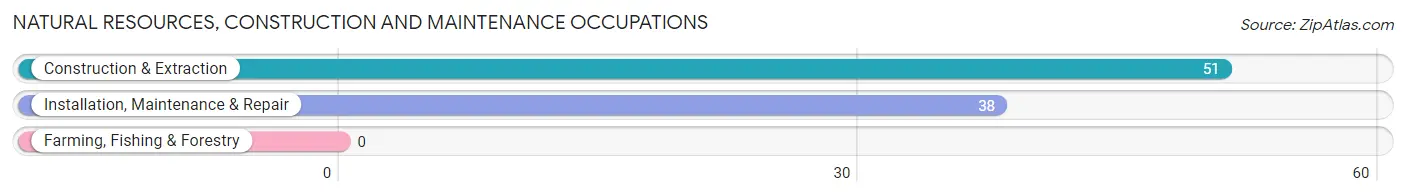
Natural Resources, Construction and Maintenance Occupations
The most common Natural Resources, Construction and Maintenance occupations in Stanaford are Construction & Extraction (51 | 10.3%), and Installation, Maintenance & Repair (38 | 7.7%).
Natural Resources, Construction and Maintenance Occupations by Sex
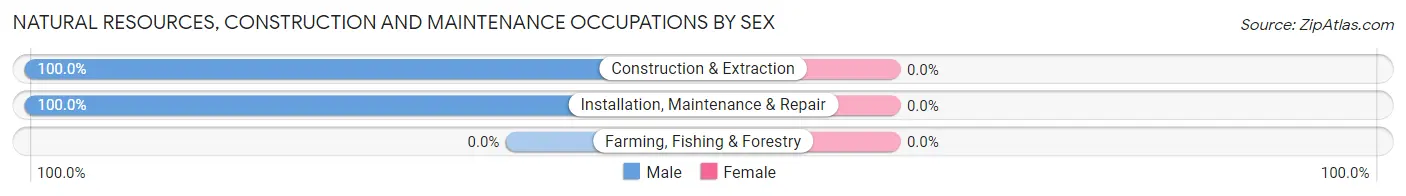
| Occupation | Male | Female |
| Farming, Fishing & Forestry | 0 (0.0%) | 0 (0.0%) |
| Construction & Extraction | 51 (100.0%) | 0 (0.0%) |
| Installation, Maintenance & Repair | 38 (100.0%) | 0 (0.0%) |
| Total (Category) | 89 (100.0%) | 0 (0.0%) |
| Total (Overall) | 308 (62.2%) | 187 (37.8%) |
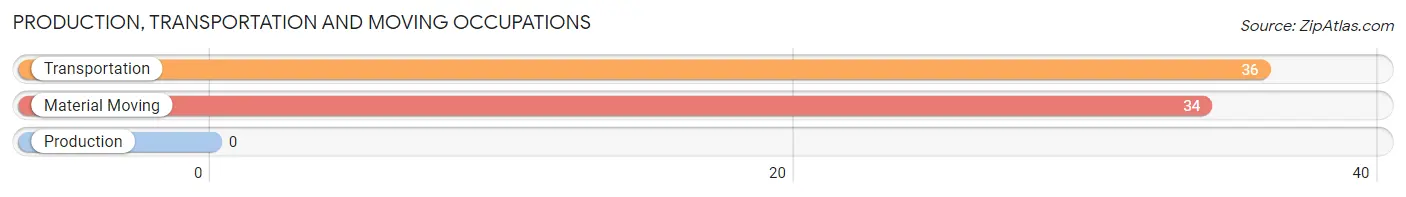
Production, Transportation and Moving Occupations
The most common Production, Transportation and Moving occupations in Stanaford are Transportation (36 | 7.3%), and Material Moving (34 | 6.9%).
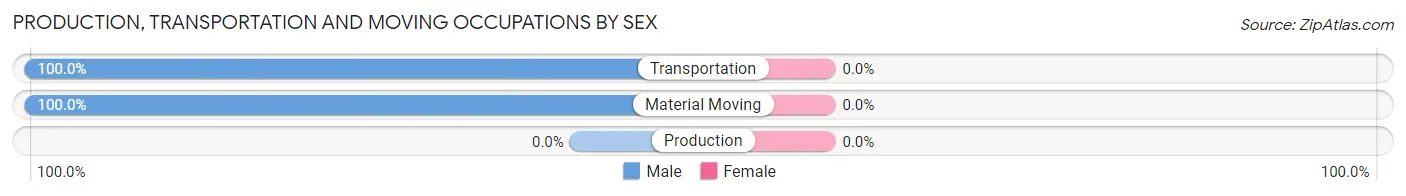
Production, Transportation and Moving Occupations by Sex
| Occupation | Male | Female |
| Production | 0 (0.0%) | 0 (0.0%) |
| Transportation | 36 (100.0%) | 0 (0.0%) |
| Material Moving | 34 (100.0%) | 0 (0.0%) |
| Total (Category) | 70 (100.0%) | 0 (0.0%) |
| Total (Overall) | 308 (62.2%) | 187 (37.8%) |
Employment Industries by Sex in Stanaford
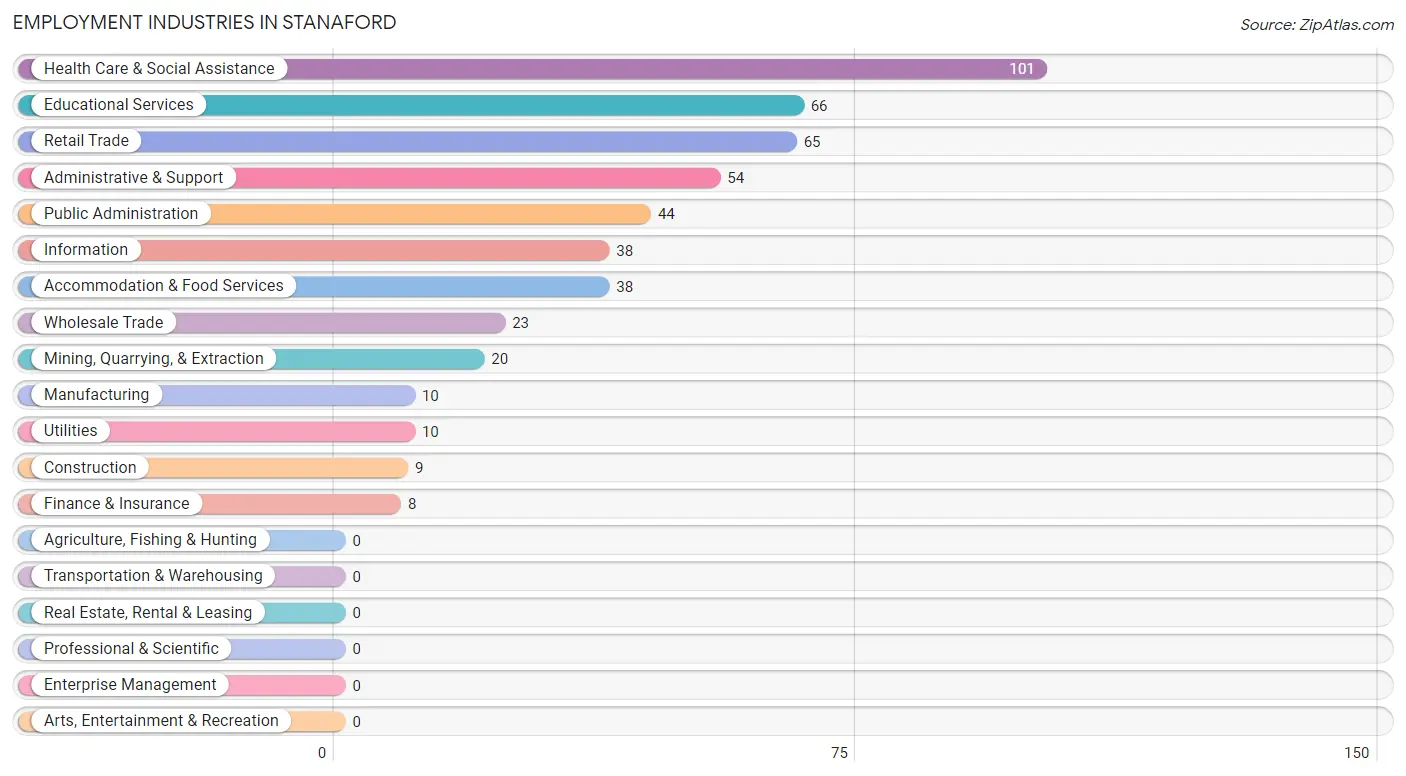
Employment Industries in Stanaford
The major employment industries in Stanaford include Health Care & Social Assistance (101 | 20.4%), Educational Services (66 | 13.3%), Retail Trade (65 | 13.1%), Administrative & Support (54 | 10.9%), and Public Administration (44 | 8.9%).
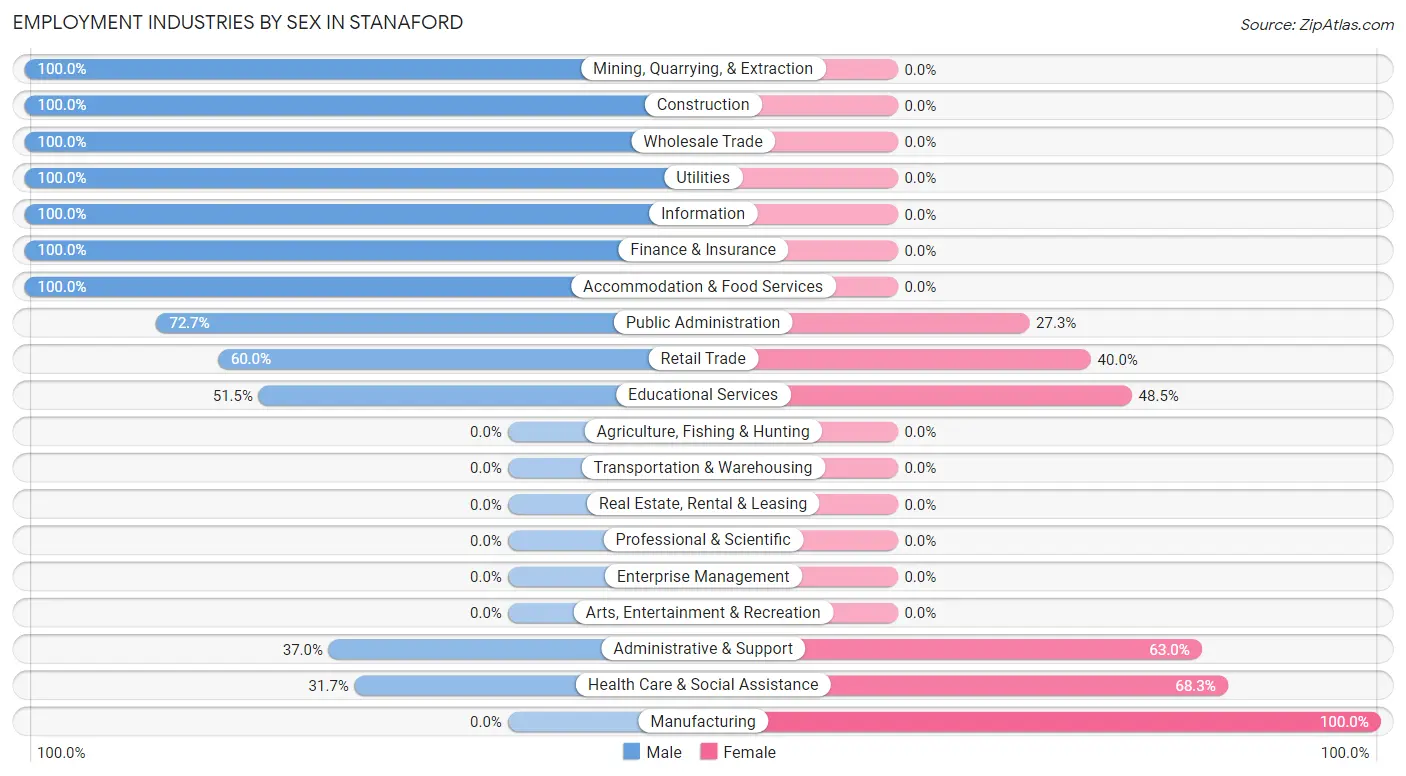
Employment Industries by Sex in Stanaford
The Stanaford industries that see more men than women are Mining, Quarrying, & Extraction (100.0%), Construction (100.0%), and Wholesale Trade (100.0%), whereas the industries that tend to have a higher number of women are Manufacturing (100.0%), Health Care & Social Assistance (68.3%), and Administrative & Support (63.0%).
| Industry | Male | Female |
| Agriculture, Fishing & Hunting | 0 (0.0%) | 0 (0.0%) |
| Mining, Quarrying, & Extraction | 20 (100.0%) | 0 (0.0%) |
| Construction | 9 (100.0%) | 0 (0.0%) |
| Manufacturing | 0 (0.0%) | 10 (100.0%) |
| Wholesale Trade | 23 (100.0%) | 0 (0.0%) |
| Retail Trade | 39 (60.0%) | 26 (40.0%) |
| Transportation & Warehousing | 0 (0.0%) | 0 (0.0%) |
| Utilities | 10 (100.0%) | 0 (0.0%) |
| Information | 38 (100.0%) | 0 (0.0%) |
| Finance & Insurance | 8 (100.0%) | 0 (0.0%) |
| Real Estate, Rental & Leasing | 0 (0.0%) | 0 (0.0%) |
| Professional & Scientific | 0 (0.0%) | 0 (0.0%) |
| Enterprise Management | 0 (0.0%) | 0 (0.0%) |
| Administrative & Support | 20 (37.0%) | 34 (63.0%) |
| Educational Services | 34 (51.5%) | 32 (48.5%) |
| Health Care & Social Assistance | 32 (31.7%) | 69 (68.3%) |
| Arts, Entertainment & Recreation | 0 (0.0%) | 0 (0.0%) |
| Accommodation & Food Services | 38 (100.0%) | 0 (0.0%) |
| Public Administration | 32 (72.7%) | 12 (27.3%) |
| Total | 308 (62.2%) | 187 (37.8%) |
Education in Stanaford
School Enrollment in Stanaford
The most common levels of schooling among the 305 students in Stanaford are middle school (162 | 53.1%), high school (61 | 20.0%), and elementary school (41 | 13.4%).
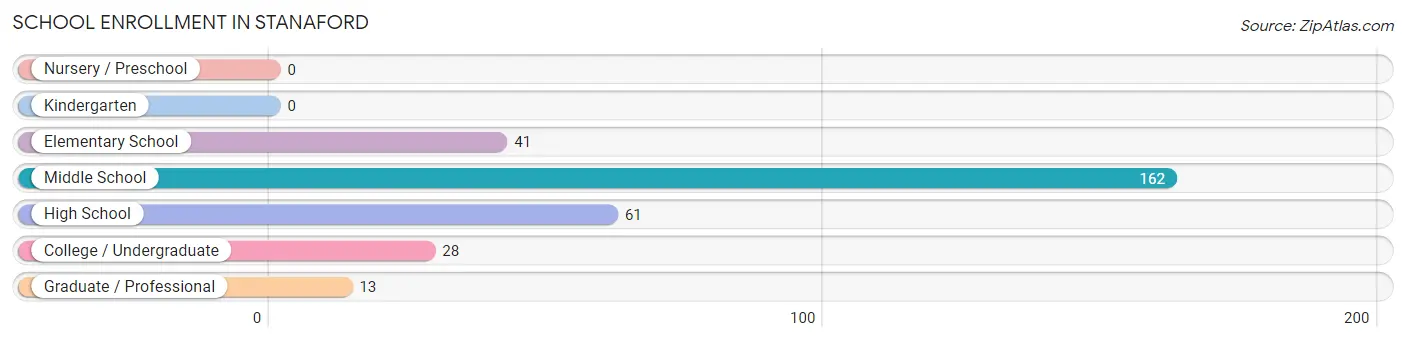
| School Level | # Students | % Students |
| Nursery / Preschool | 0 | 0.0% |
| Kindergarten | 0 | 0.0% |
| Elementary School | 41 | 13.4% |
| Middle School | 162 | 53.1% |
| High School | 61 | 20.0% |
| College / Undergraduate | 28 | 9.2% |
| Graduate / Professional | 13 | 4.3% |
| Total | 305 | 100.0% |
School Enrollment by Age by Funding Source in Stanaford
Out of a total of 305 students who are enrolled in schools in Stanaford, 173 (56.7%) attend a private institution, while the remaining 132 (43.3%) are enrolled in public schools. The age group of 15 to 17 year olds has the highest likelihood of being enrolled in private schools, with 6 (100.0% in the age bracket) enrolled. Conversely, the age group of 25 to 34 year olds has the lowest likelihood of being enrolled in a private school, with 28 (100.0% in the age bracket) attending a public institution.
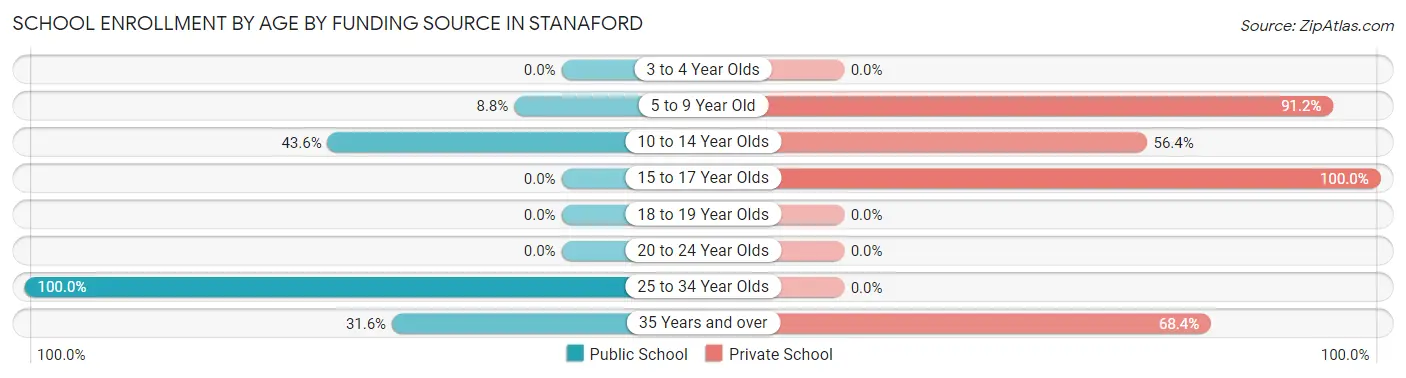
| Age Bracket | Public School | Private School |
| 3 to 4 Year Olds | 0 (0.0%) | 0 (0.0%) |
| 5 to 9 Year Old | 3 (8.8%) | 31 (91.2%) |
| 10 to 14 Year Olds | 95 (43.6%) | 123 (56.4%) |
| 15 to 17 Year Olds | 0 (0.0%) | 6 (100.0%) |
| 18 to 19 Year Olds | 0 (0.0%) | 0 (0.0%) |
| 20 to 24 Year Olds | 0 (0.0%) | 0 (0.0%) |
| 25 to 34 Year Olds | 28 (100.0%) | 0 (0.0%) |
| 35 Years and over | 6 (31.6%) | 13 (68.4%) |
| Total | 132 (43.3%) | 173 (56.7%) |
Educational Attainment by Field of Study in Stanaford
Education (69 | 25.5%), business (68 | 25.1%), literature & languages (23 | 8.5%), psychology (22 | 8.1%), and social sciences (22 | 8.1%) are the most common fields of study among 271 individuals in Stanaford who have obtained a bachelor's degree or higher.
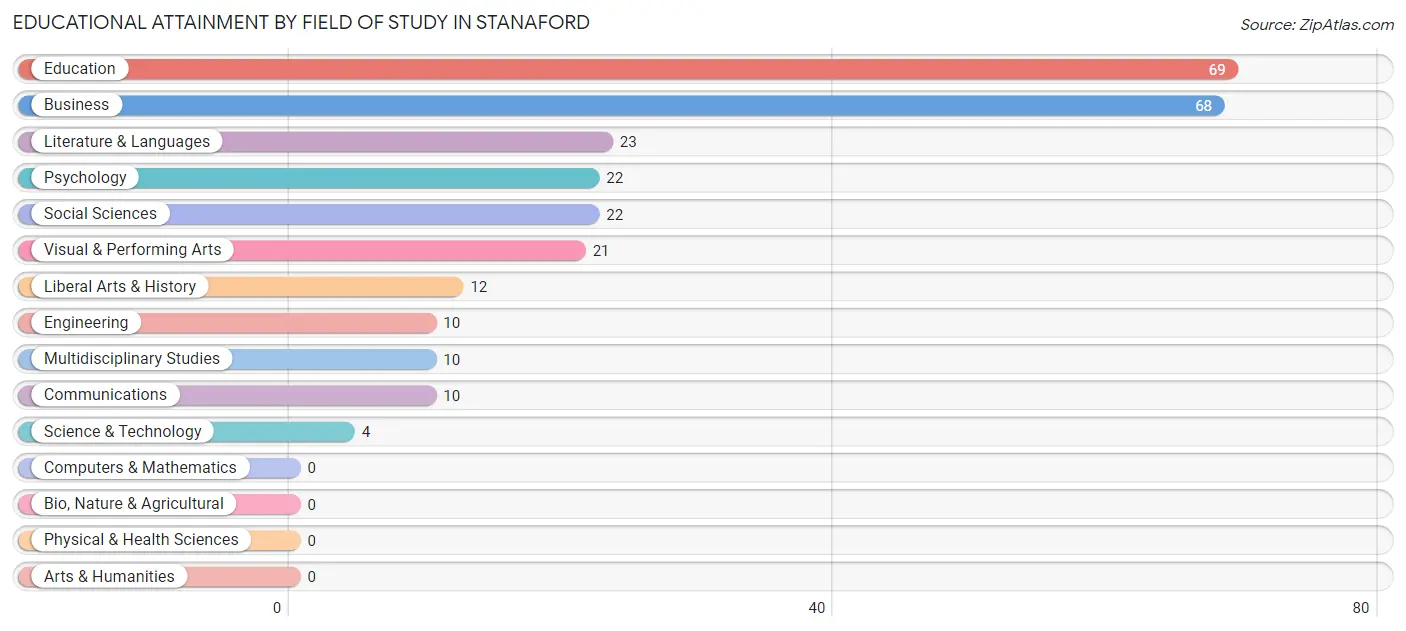
| Field of Study | # Graduates | % Graduates |
| Computers & Mathematics | 0 | 0.0% |
| Bio, Nature & Agricultural | 0 | 0.0% |
| Physical & Health Sciences | 0 | 0.0% |
| Psychology | 22 | 8.1% |
| Social Sciences | 22 | 8.1% |
| Engineering | 10 | 3.7% |
| Multidisciplinary Studies | 10 | 3.7% |
| Science & Technology | 4 | 1.5% |
| Business | 68 | 25.1% |
| Education | 69 | 25.5% |
| Literature & Languages | 23 | 8.5% |
| Liberal Arts & History | 12 | 4.4% |
| Visual & Performing Arts | 21 | 7.7% |
| Communications | 10 | 3.7% |
| Arts & Humanities | 0 | 0.0% |
| Total | 271 | 100.0% |
Transportation & Commute in Stanaford
Vehicle Availability by Sex in Stanaford
The most prevalent vehicle ownership categories in Stanaford are males with 2 vehicles (220, accounting for 71.4%) and females with 2 vehicles (120, making up 117.7%).
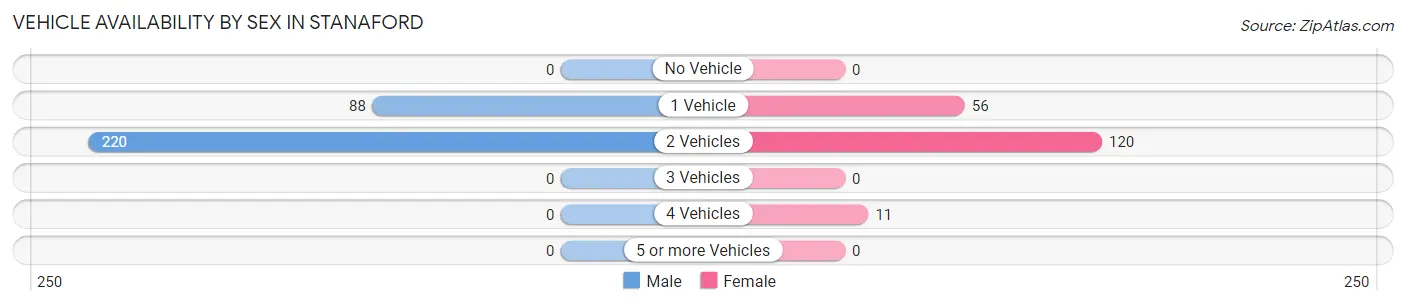
| Vehicles Available | Male | Female |
| No Vehicle | 0 (0.0%) | 0 (0.0%) |
| 1 Vehicle | 88 (28.6%) | 56 (29.9%) |
| 2 Vehicles | 220 (71.4%) | 120 (64.2%) |
| 3 Vehicles | 0 (0.0%) | 0 (0.0%) |
| 4 Vehicles | 0 (0.0%) | 11 (5.9%) |
| 5 or more Vehicles | 0 (0.0%) | 0 (0.0%) |
| Total | 308 (100.0%) | 187 (100.0%) |
Commute Time in Stanaford
The most frequently occuring commute durations in Stanaford are 15 to 19 minutes (161 commuters, 34.6%), 5 to 9 minutes (131 commuters, 28.2%), and 10 to 14 minutes (123 commuters, 26.5%).
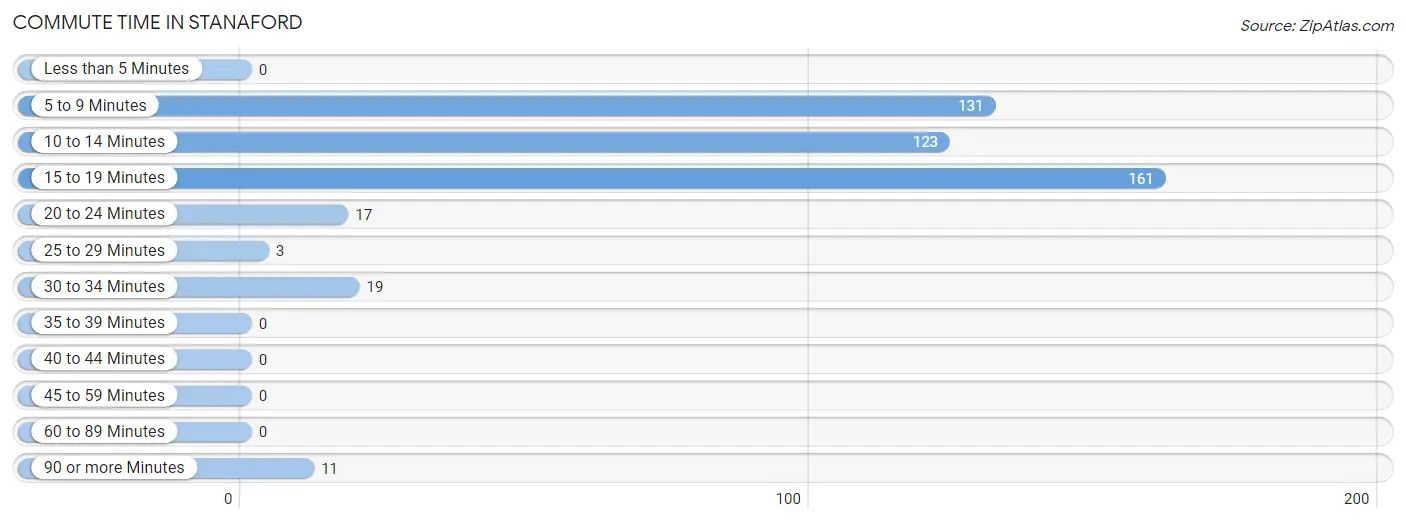
| Commute Time | # Commuters | % Commuters |
| Less than 5 Minutes | 0 | 0.0% |
| 5 to 9 Minutes | 131 | 28.2% |
| 10 to 14 Minutes | 123 | 26.5% |
| 15 to 19 Minutes | 161 | 34.6% |
| 20 to 24 Minutes | 17 | 3.7% |
| 25 to 29 Minutes | 3 | 0.6% |
| 30 to 34 Minutes | 19 | 4.1% |
| 35 to 39 Minutes | 0 | 0.0% |
| 40 to 44 Minutes | 0 | 0.0% |
| 45 to 59 Minutes | 0 | 0.0% |
| 60 to 89 Minutes | 0 | 0.0% |
| 90 or more Minutes | 11 | 2.4% |
Commute Time by Sex in Stanaford
The most common commute times in Stanaford are 5 to 9 minutes (93 commuters, 32.2%) for males and 15 to 19 minutes (79 commuters, 44.9%) for females.
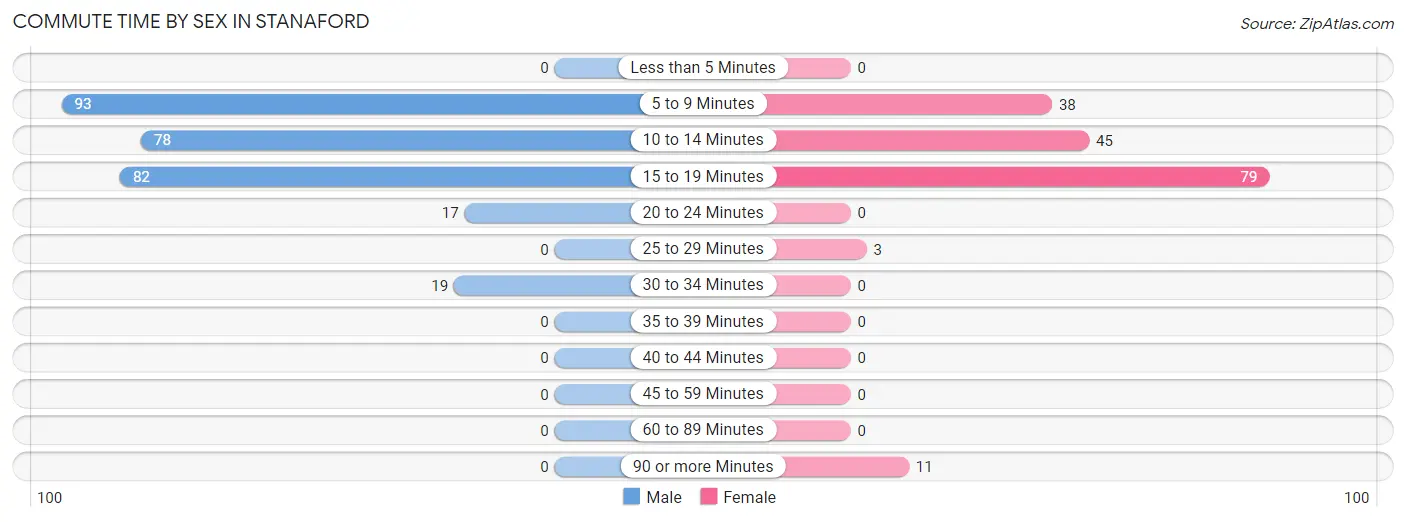
| Commute Time | Male | Female |
| Less than 5 Minutes | 0 (0.0%) | 0 (0.0%) |
| 5 to 9 Minutes | 93 (32.2%) | 38 (21.6%) |
| 10 to 14 Minutes | 78 (27.0%) | 45 (25.6%) |
| 15 to 19 Minutes | 82 (28.4%) | 79 (44.9%) |
| 20 to 24 Minutes | 17 (5.9%) | 0 (0.0%) |
| 25 to 29 Minutes | 0 (0.0%) | 3 (1.7%) |
| 30 to 34 Minutes | 19 (6.6%) | 0 (0.0%) |
| 35 to 39 Minutes | 0 (0.0%) | 0 (0.0%) |
| 40 to 44 Minutes | 0 (0.0%) | 0 (0.0%) |
| 45 to 59 Minutes | 0 (0.0%) | 0 (0.0%) |
| 60 to 89 Minutes | 0 (0.0%) | 0 (0.0%) |
| 90 or more Minutes | 0 (0.0%) | 11 (6.2%) |
Time of Departure to Work by Sex in Stanaford
The most frequent times of departure to work in Stanaford are 8:00 AM to 8:29 AM (91, 31.5%) for males and 6:30 AM to 6:59 AM (79, 44.9%) for females.
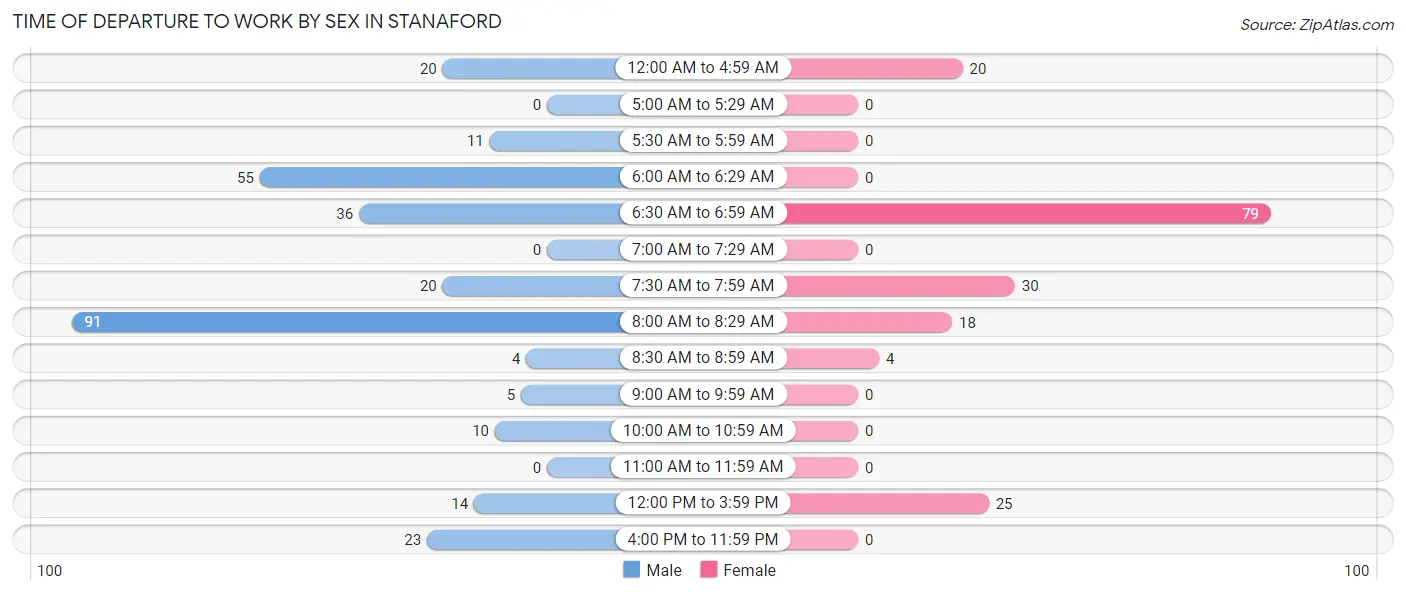
| Time of Departure | Male | Female |
| 12:00 AM to 4:59 AM | 20 (6.9%) | 20 (11.4%) |
| 5:00 AM to 5:29 AM | 0 (0.0%) | 0 (0.0%) |
| 5:30 AM to 5:59 AM | 11 (3.8%) | 0 (0.0%) |
| 6:00 AM to 6:29 AM | 55 (19.0%) | 0 (0.0%) |
| 6:30 AM to 6:59 AM | 36 (12.5%) | 79 (44.9%) |
| 7:00 AM to 7:29 AM | 0 (0.0%) | 0 (0.0%) |
| 7:30 AM to 7:59 AM | 20 (6.9%) | 30 (17.1%) |
| 8:00 AM to 8:29 AM | 91 (31.5%) | 18 (10.2%) |
| 8:30 AM to 8:59 AM | 4 (1.4%) | 4 (2.3%) |
| 9:00 AM to 9:59 AM | 5 (1.7%) | 0 (0.0%) |
| 10:00 AM to 10:59 AM | 10 (3.5%) | 0 (0.0%) |
| 11:00 AM to 11:59 AM | 0 (0.0%) | 0 (0.0%) |
| 12:00 PM to 3:59 PM | 14 (4.8%) | 25 (14.2%) |
| 4:00 PM to 11:59 PM | 23 (8.0%) | 0 (0.0%) |
| Total | 289 (100.0%) | 176 (100.0%) |
Housing Occupancy in Stanaford
Occupancy by Ownership in Stanaford
Of the total 574 dwellings in Stanaford, owner-occupied units account for 490 (85.4%), while renter-occupied units make up 84 (14.6%).
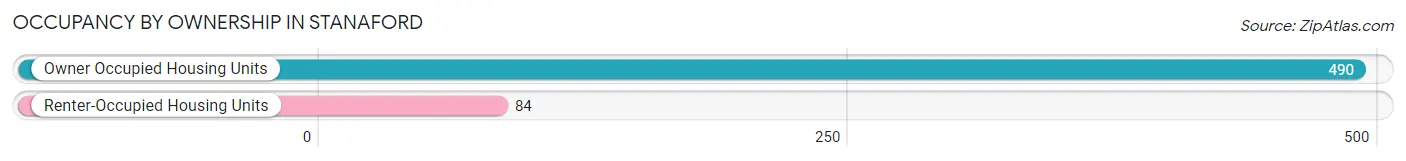
| Occupancy | # Housing Units | % Housing Units |
| Owner Occupied Housing Units | 490 | 85.4% |
| Renter-Occupied Housing Units | 84 | 14.6% |
| Total Occupied Housing Units | 574 | 100.0% |
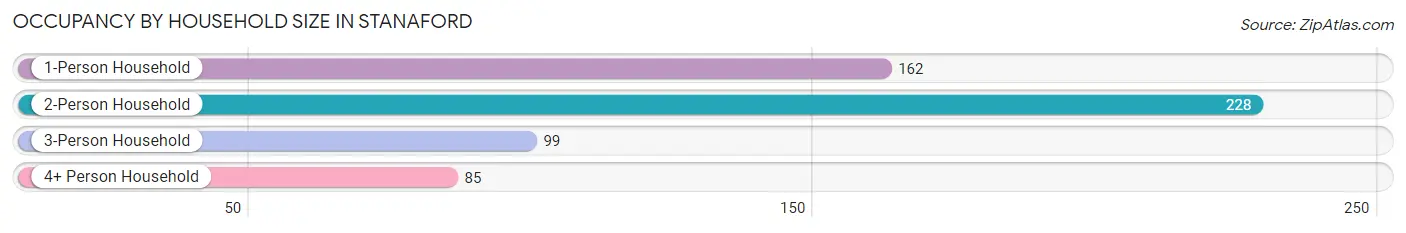
Occupancy by Household Size in Stanaford
| Household Size | # Housing Units | % Housing Units |
| 1-Person Household | 162 | 28.2% |
| 2-Person Household | 228 | 39.7% |
| 3-Person Household | 99 | 17.2% |
| 4+ Person Household | 85 | 14.8% |
| Total Housing Units | 574 | 100.0% |
Occupancy by Ownership by Household Size in Stanaford
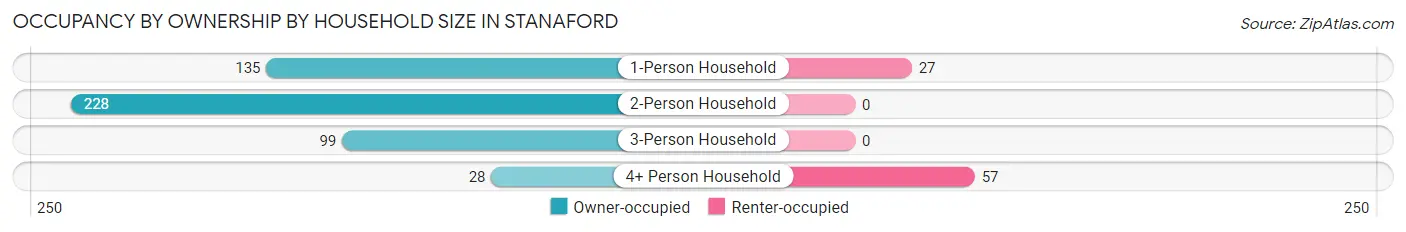
| Household Size | Owner-occupied | Renter-occupied |
| 1-Person Household | 135 (83.3%) | 27 (16.7%) |
| 2-Person Household | 228 (100.0%) | 0 (0.0%) |
| 3-Person Household | 99 (100.0%) | 0 (0.0%) |
| 4+ Person Household | 28 (32.9%) | 57 (67.1%) |
| Total Housing Units | 490 (85.4%) | 84 (14.6%) |
Occupancy by Educational Attainment in Stanaford
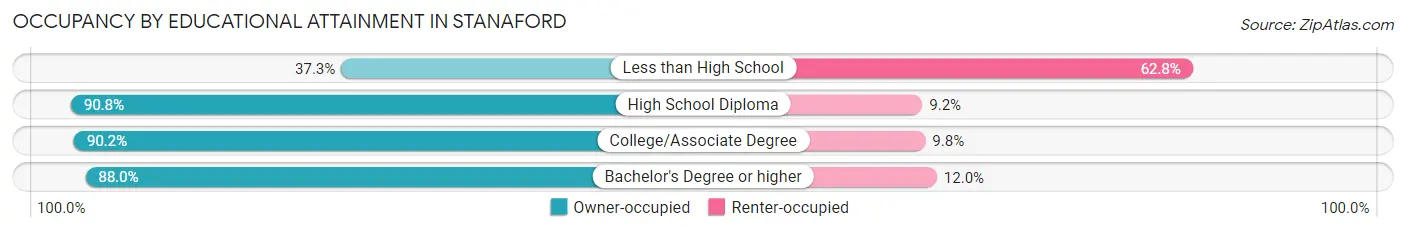
| Household Size | Owner-occupied | Renter-occupied |
| Less than High School | 19 (37.2%) | 32 (62.7%) |
| High School Diploma | 228 (90.8%) | 23 (9.2%) |
| College/Associate Degree | 148 (90.2%) | 16 (9.8%) |
| Bachelor's Degree or higher | 95 (88.0%) | 13 (12.0%) |
Occupancy by Age of Householder in Stanaford
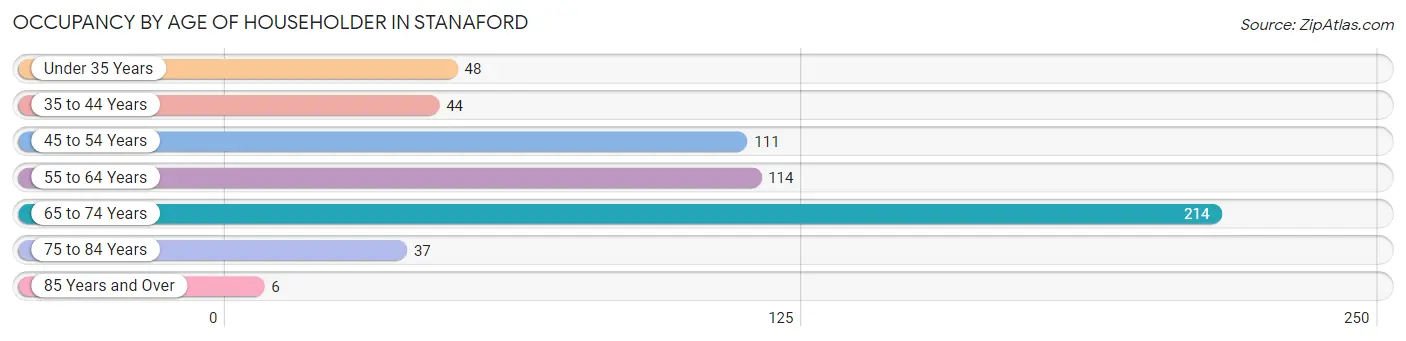
| Age Bracket | # Households | % Households |
| Under 35 Years | 48 | 8.4% |
| 35 to 44 Years | 44 | 7.7% |
| 45 to 54 Years | 111 | 19.3% |
| 55 to 64 Years | 114 | 19.9% |
| 65 to 74 Years | 214 | 37.3% |
| 75 to 84 Years | 37 | 6.5% |
| 85 Years and Over | 6 | 1.1% |
| Total | 574 | 100.0% |
Housing Finances in Stanaford
Median Income by Occupancy in Stanaford
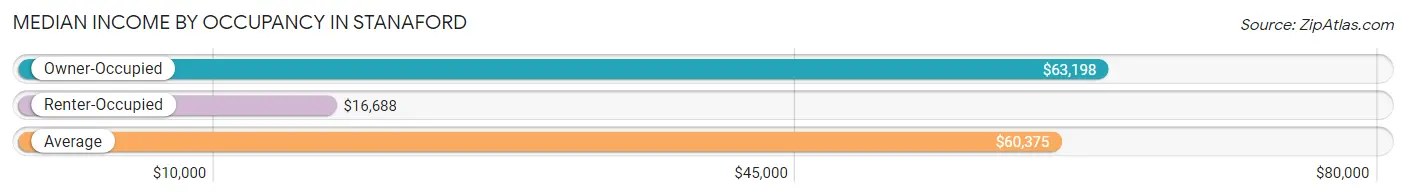
| Occupancy Type | # Households | Median Income |
| Owner-Occupied | 490 (85.4%) | $63,198 |
| Renter-Occupied | 84 (14.6%) | $16,688 |
| Average | 574 (100.0%) | $60,375 |
Occupancy by Householder Income Bracket in Stanaford
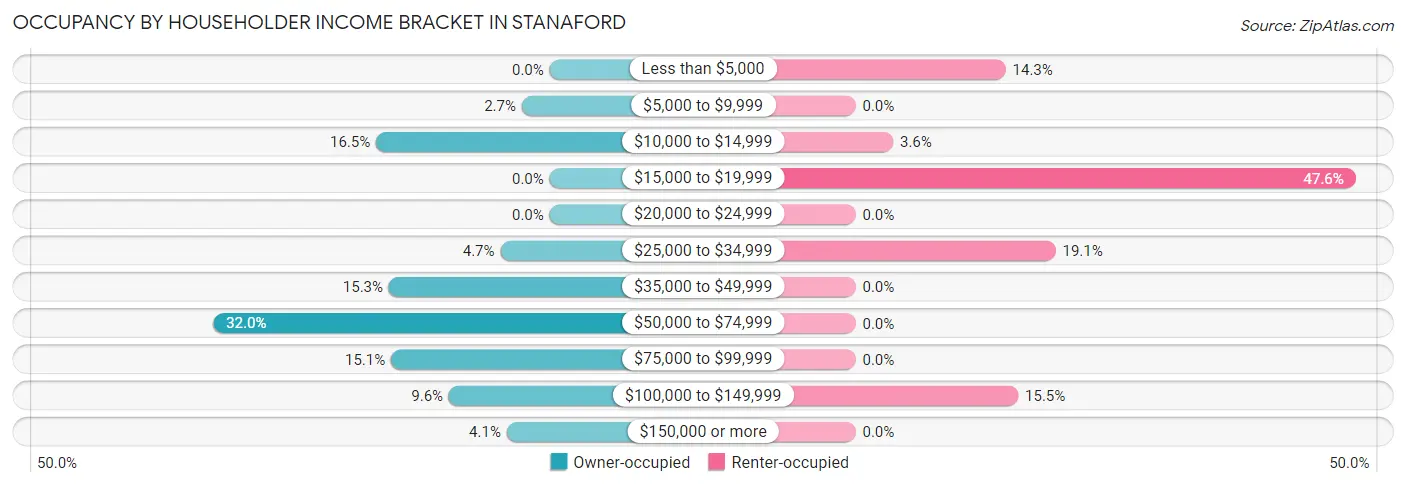
| Income Bracket | Owner-occupied | Renter-occupied |
| Less than $5,000 | 0 (0.0%) | 12 (14.3%) |
| $5,000 to $9,999 | 13 (2.6%) | 0 (0.0%) |
| $10,000 to $14,999 | 81 (16.5%) | 3 (3.6%) |
| $15,000 to $19,999 | 0 (0.0%) | 40 (47.6%) |
| $20,000 to $24,999 | 0 (0.0%) | 0 (0.0%) |
| $25,000 to $34,999 | 23 (4.7%) | 16 (19.1%) |
| $35,000 to $49,999 | 75 (15.3%) | 0 (0.0%) |
| $50,000 to $74,999 | 157 (32.0%) | 0 (0.0%) |
| $75,000 to $99,999 | 74 (15.1%) | 0 (0.0%) |
| $100,000 to $149,999 | 47 (9.6%) | 13 (15.5%) |
| $150,000 or more | 20 (4.1%) | 0 (0.0%) |
| Total | 490 (100.0%) | 84 (100.0%) |
Monthly Housing Cost Tiers in Stanaford
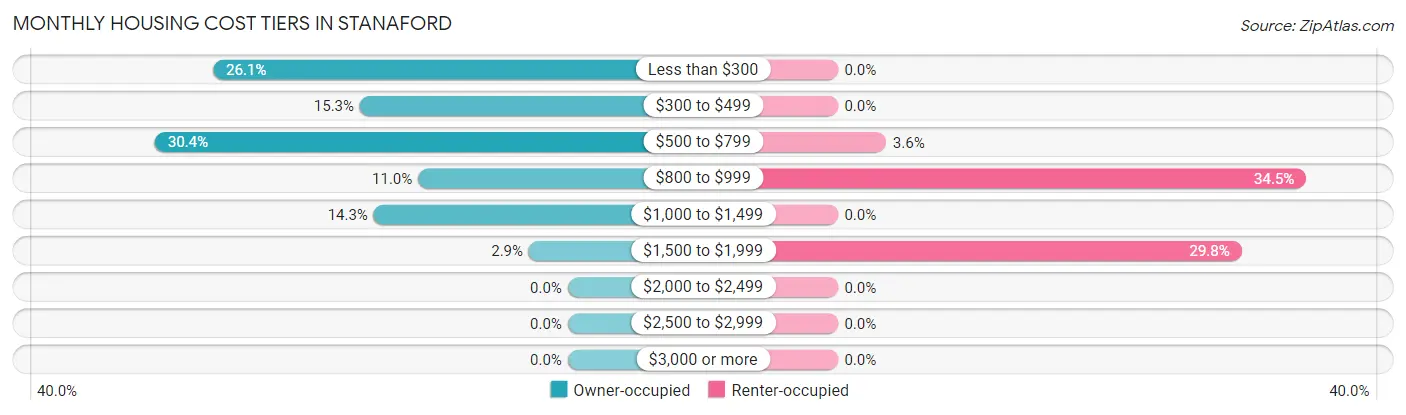
| Monthly Cost | Owner-occupied | Renter-occupied |
| Less than $300 | 128 (26.1%) | 0 (0.0%) |
| $300 to $499 | 75 (15.3%) | 0 (0.0%) |
| $500 to $799 | 149 (30.4%) | 3 (3.6%) |
| $800 to $999 | 54 (11.0%) | 29 (34.5%) |
| $1,000 to $1,499 | 70 (14.3%) | 0 (0.0%) |
| $1,500 to $1,999 | 14 (2.9%) | 25 (29.8%) |
| $2,000 to $2,499 | 0 (0.0%) | 0 (0.0%) |
| $2,500 to $2,999 | 0 (0.0%) | 0 (0.0%) |
| $3,000 or more | 0 (0.0%) | 0 (0.0%) |
| Total | 490 (100.0%) | 84 (100.0%) |
Physical Housing Characteristics in Stanaford
Housing Structures in Stanaford
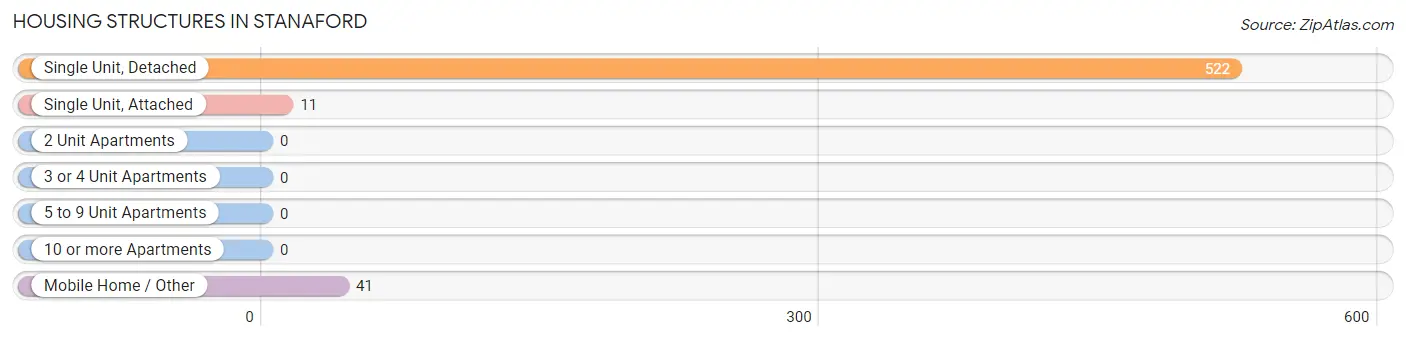
| Structure Type | # Housing Units | % Housing Units |
| Single Unit, Detached | 522 | 90.9% |
| Single Unit, Attached | 11 | 1.9% |
| 2 Unit Apartments | 0 | 0.0% |
| 3 or 4 Unit Apartments | 0 | 0.0% |
| 5 to 9 Unit Apartments | 0 | 0.0% |
| 10 or more Apartments | 0 | 0.0% |
| Mobile Home / Other | 41 | 7.1% |
| Total | 574 | 100.0% |
Housing Structures by Occupancy in Stanaford
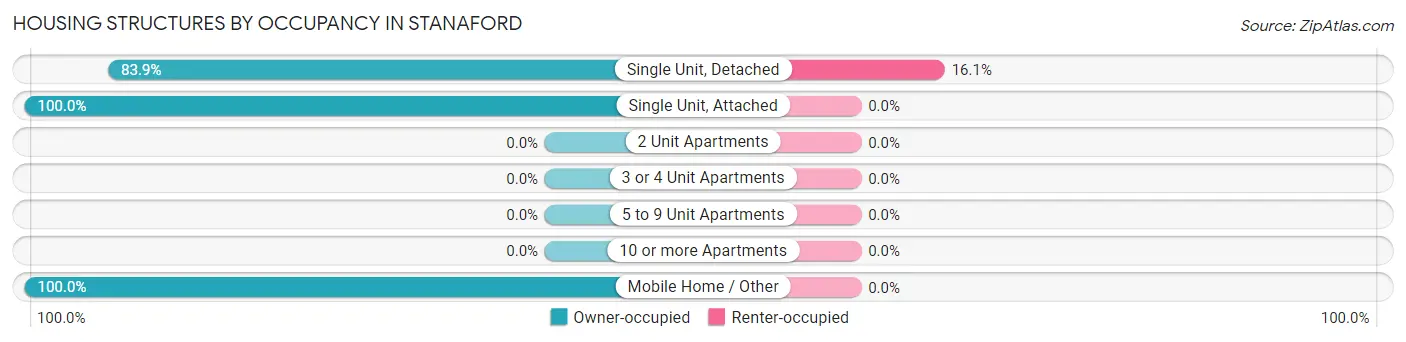
| Structure Type | Owner-occupied | Renter-occupied |
| Single Unit, Detached | 438 (83.9%) | 84 (16.1%) |
| Single Unit, Attached | 11 (100.0%) | 0 (0.0%) |
| 2 Unit Apartments | 0 (0.0%) | 0 (0.0%) |
| 3 or 4 Unit Apartments | 0 (0.0%) | 0 (0.0%) |
| 5 to 9 Unit Apartments | 0 (0.0%) | 0 (0.0%) |
| 10 or more Apartments | 0 (0.0%) | 0 (0.0%) |
| Mobile Home / Other | 41 (100.0%) | 0 (0.0%) |
| Total | 490 (85.4%) | 84 (14.6%) |
Housing Structures by Number of Rooms in Stanaford
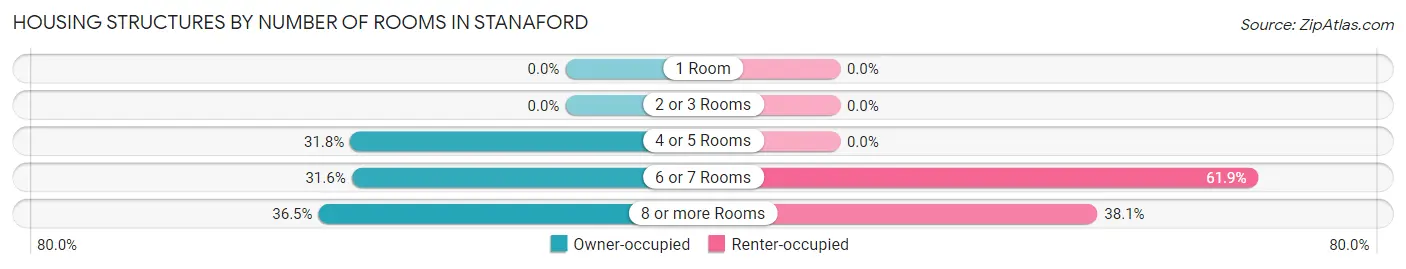
| Number of Rooms | Owner-occupied | Renter-occupied |
| 1 Room | 0 (0.0%) | 0 (0.0%) |
| 2 or 3 Rooms | 0 (0.0%) | 0 (0.0%) |
| 4 or 5 Rooms | 156 (31.8%) | 0 (0.0%) |
| 6 or 7 Rooms | 155 (31.6%) | 52 (61.9%) |
| 8 or more Rooms | 179 (36.5%) | 32 (38.1%) |
| Total | 490 (100.0%) | 84 (100.0%) |
Housing Structure by Heating Type in Stanaford
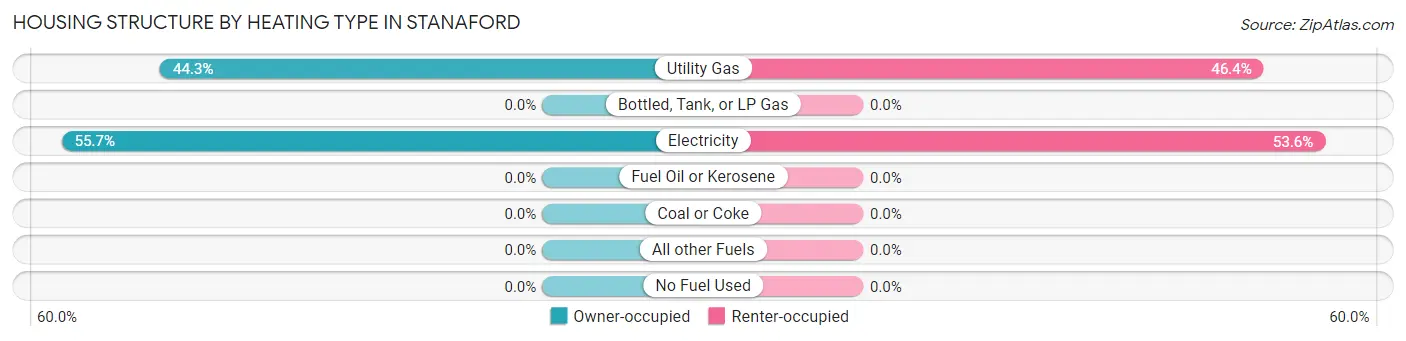
| Heating Type | Owner-occupied | Renter-occupied |
| Utility Gas | 217 (44.3%) | 39 (46.4%) |
| Bottled, Tank, or LP Gas | 0 (0.0%) | 0 (0.0%) |
| Electricity | 273 (55.7%) | 45 (53.6%) |
| Fuel Oil or Kerosene | 0 (0.0%) | 0 (0.0%) |
| Coal or Coke | 0 (0.0%) | 0 (0.0%) |
| All other Fuels | 0 (0.0%) | 0 (0.0%) |
| No Fuel Used | 0 (0.0%) | 0 (0.0%) |
| Total | 490 (100.0%) | 84 (100.0%) |
Household Vehicle Usage in Stanaford
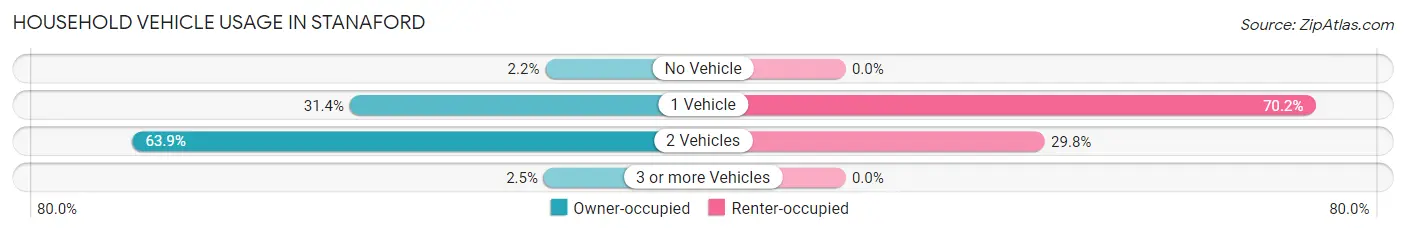
| Vehicles per Household | Owner-occupied | Renter-occupied |
| No Vehicle | 11 (2.2%) | 0 (0.0%) |
| 1 Vehicle | 154 (31.4%) | 59 (70.2%) |
| 2 Vehicles | 313 (63.9%) | 25 (29.8%) |
| 3 or more Vehicles | 12 (2.5%) | 0 (0.0%) |
| Total | 490 (100.0%) | 84 (100.0%) |
Real Estate & Mortgages in Stanaford
Real Estate and Mortgage Overview in Stanaford
| Characteristic | Without Mortgage | With Mortgage |
| Housing Units | 290 | 200 |
| Median Property Value | $132,400 | $151,000 |
| Median Household Income | $39,567 | $10 |
| Monthly Housing Costs | $355 | $0 |
| Real Estate Taxes | $488 | $13 |
Property Value by Mortgage Status in Stanaford
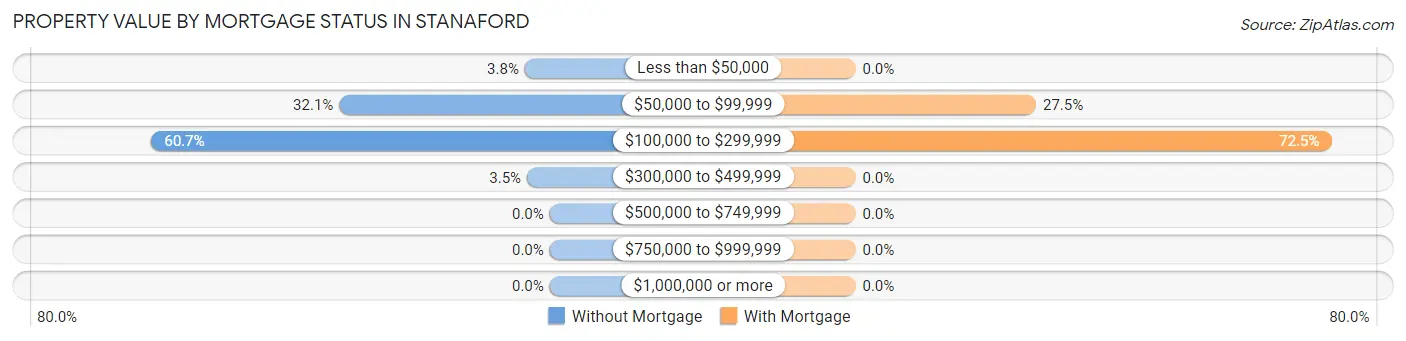
| Property Value | Without Mortgage | With Mortgage |
| Less than $50,000 | 11 (3.8%) | 0 (0.0%) |
| $50,000 to $99,999 | 93 (32.1%) | 55 (27.5%) |
| $100,000 to $299,999 | 176 (60.7%) | 145 (72.5%) |
| $300,000 to $499,999 | 10 (3.5%) | 0 (0.0%) |
| $500,000 to $749,999 | 0 (0.0%) | 0 (0.0%) |
| $750,000 to $999,999 | 0 (0.0%) | 0 (0.0%) |
| $1,000,000 or more | 0 (0.0%) | 0 (0.0%) |
| Total | 290 (100.0%) | 200 (100.0%) |
Household Income by Mortgage Status in Stanaford
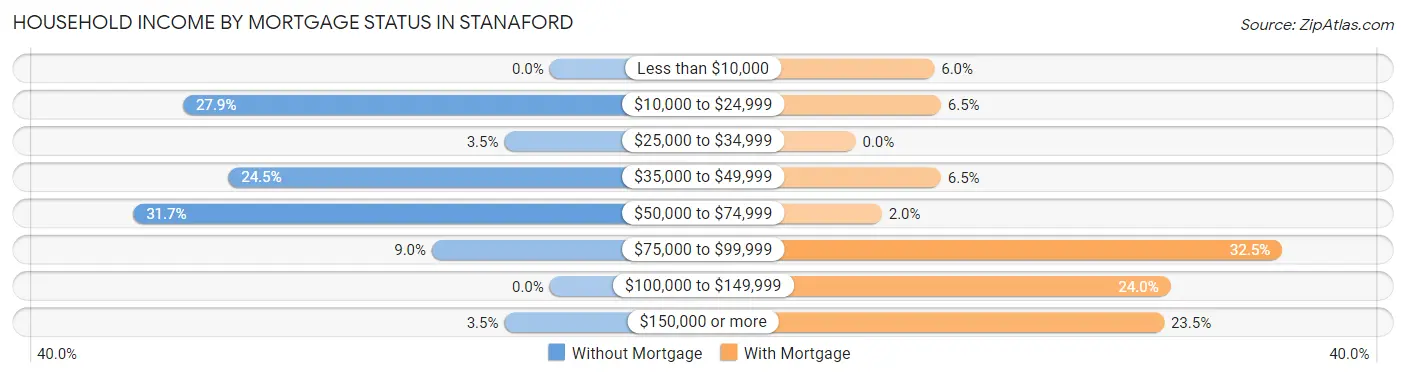
| Household Income | Without Mortgage | With Mortgage |
| Less than $10,000 | 0 (0.0%) | 12 (6.0%) |
| $10,000 to $24,999 | 81 (27.9%) | 13 (6.5%) |
| $25,000 to $34,999 | 10 (3.5%) | 0 (0.0%) |
| $35,000 to $49,999 | 71 (24.5%) | 13 (6.5%) |
| $50,000 to $74,999 | 92 (31.7%) | 4 (2.0%) |
| $75,000 to $99,999 | 26 (9.0%) | 65 (32.5%) |
| $100,000 to $149,999 | 0 (0.0%) | 48 (24.0%) |
| $150,000 or more | 10 (3.5%) | 47 (23.5%) |
| Total | 290 (100.0%) | 200 (100.0%) |
Property Value to Household Income Ratio in Stanaford
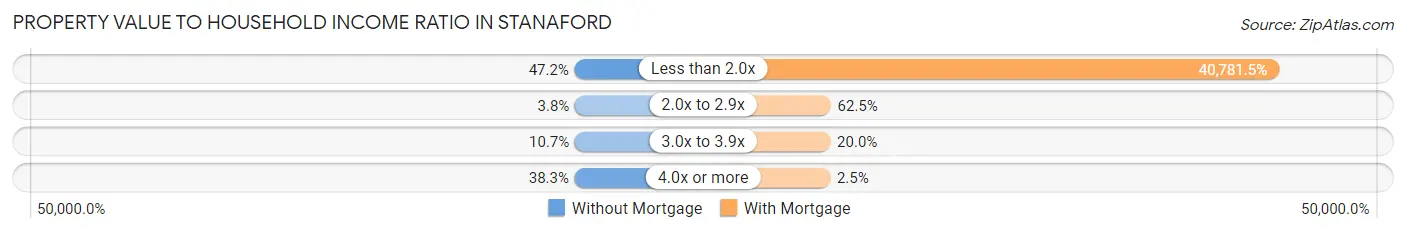
| Value-to-Income Ratio | Without Mortgage | With Mortgage |
| Less than 2.0x | 137 (47.2%) | 81,563 (40,781.5%) |
| 2.0x to 2.9x | 11 (3.8%) | 125 (62.5%) |
| 3.0x to 3.9x | 31 (10.7%) | 40 (20.0%) |
| 4.0x or more | 111 (38.3%) | 5 (2.5%) |
| Total | 290 (100.0%) | 200 (100.0%) |
Real Estate Taxes by Mortgage Status in Stanaford
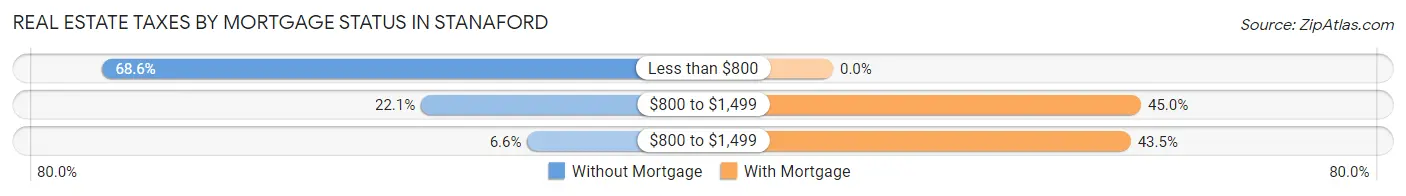
| Property Taxes | Without Mortgage | With Mortgage |
| Less than $800 | 199 (68.6%) | 0 (0.0%) |
| $800 to $1,499 | 64 (22.1%) | 90 (45.0%) |
| $800 to $1,499 | 19 (6.6%) | 87 (43.5%) |
| Total | 290 (100.0%) | 200 (100.0%) |
Health & Disability in Stanaford
Health Insurance Coverage by Age in Stanaford
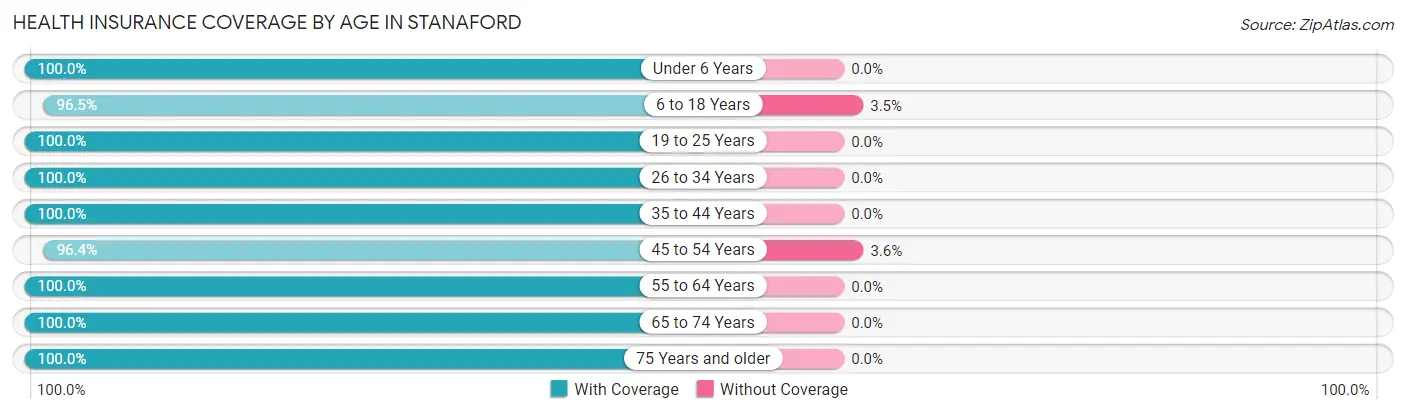
| Age Bracket | With Coverage | Without Coverage |
| Under 6 Years | 45 (100.0%) | 0 (0.0%) |
| 6 to 18 Years | 327 (96.5%) | 12 (3.5%) |
| 19 to 25 Years | 28 (100.0%) | 0 (0.0%) |
| 26 to 34 Years | 68 (100.0%) | 0 (0.0%) |
| 35 to 44 Years | 90 (100.0%) | 0 (0.0%) |
| 45 to 54 Years | 243 (96.4%) | 9 (3.6%) |
| 55 to 64 Years | 148 (100.0%) | 0 (0.0%) |
| 65 to 74 Years | 380 (100.0%) | 0 (0.0%) |
| 75 Years and older | 51 (100.0%) | 0 (0.0%) |
| Total | 1,380 (98.5%) | 21 (1.5%) |
Health Insurance Coverage by Citizenship Status in Stanaford
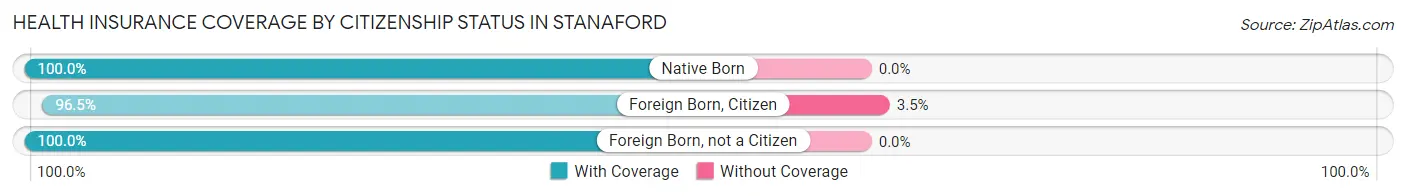
| Citizenship Status | With Coverage | Without Coverage |
| Native Born | 45 (100.0%) | 0 (0.0%) |
| Foreign Born, Citizen | 327 (96.5%) | 12 (3.5%) |
| Foreign Born, not a Citizen | 28 (100.0%) | 0 (0.0%) |
Health Insurance Coverage by Household Income in Stanaford
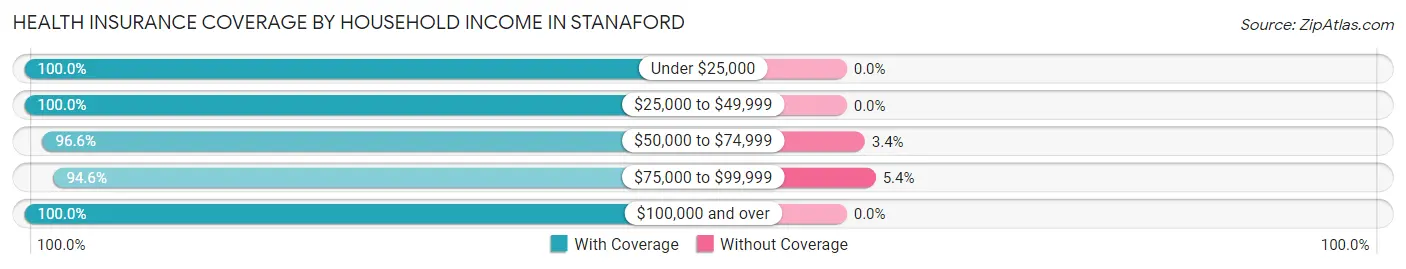
| Household Income | With Coverage | Without Coverage |
| Under $25,000 | 462 (100.0%) | 0 (0.0%) |
| $25,000 to $49,999 | 186 (100.0%) | 0 (0.0%) |
| $50,000 to $74,999 | 343 (96.6%) | 12 (3.4%) |
| $75,000 to $99,999 | 157 (94.6%) | 9 (5.4%) |
| $100,000 and over | 232 (100.0%) | 0 (0.0%) |
Public vs Private Health Insurance Coverage by Age in Stanaford
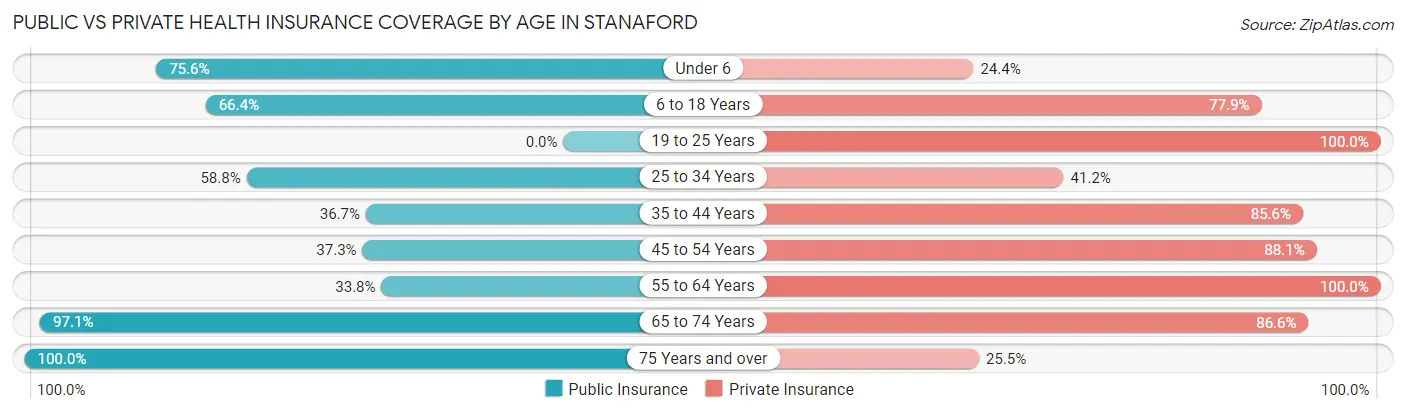
| Age Bracket | Public Insurance | Private Insurance |
| Under 6 | 34 (75.6%) | 11 (24.4%) |
| 6 to 18 Years | 225 (66.4%) | 264 (77.9%) |
| 19 to 25 Years | 0 (0.0%) | 28 (100.0%) |
| 25 to 34 Years | 40 (58.8%) | 28 (41.2%) |
| 35 to 44 Years | 33 (36.7%) | 77 (85.6%) |
| 45 to 54 Years | 94 (37.3%) | 222 (88.1%) |
| 55 to 64 Years | 50 (33.8%) | 148 (100.0%) |
| 65 to 74 Years | 369 (97.1%) | 329 (86.6%) |
| 75 Years and over | 51 (100.0%) | 13 (25.5%) |
| Total | 896 (63.9%) | 1,120 (79.9%) |
Disability Status by Sex by Age in Stanaford
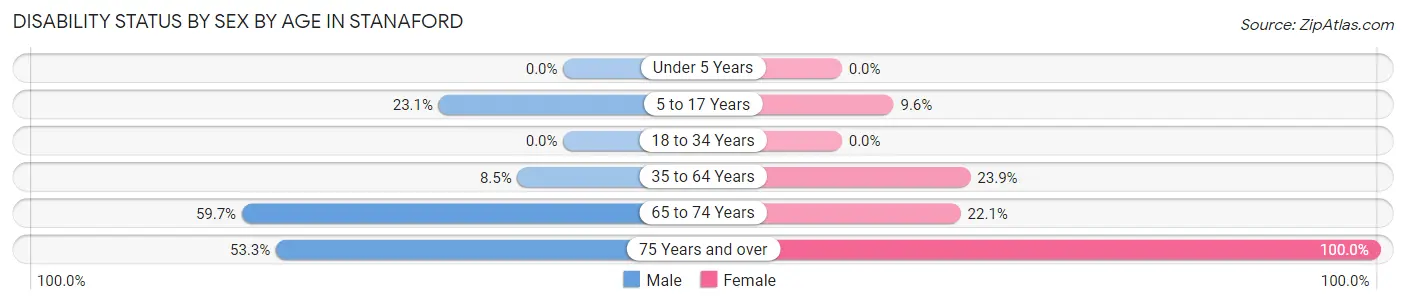
| Age Bracket | Male | Female |
| Under 5 Years | 0 (0.0%) | 0 (0.0%) |
| 5 to 17 Years | 37 (23.1%) | 19 (9.6%) |
| 18 to 34 Years | 0 (0.0%) | 0 (0.0%) |
| 35 to 64 Years | 21 (8.5%) | 58 (23.9%) |
| 65 to 74 Years | 105 (59.7%) | 45 (22.1%) |
| 75 Years and over | 24 (53.3%) | 6 (100.0%) |
Disability Class by Sex by Age in Stanaford
Disability Class: Hearing Difficulty
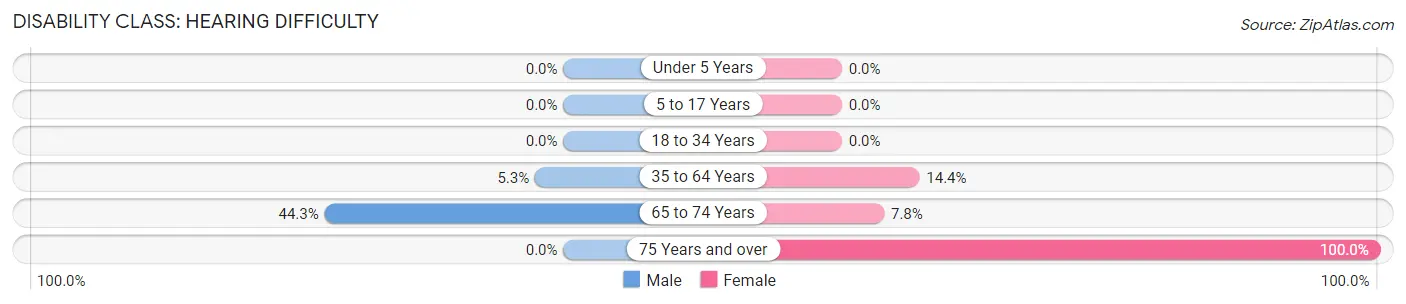
| Age Bracket | Male | Female |
| Under 5 Years | 0 (0.0%) | 0 (0.0%) |
| 5 to 17 Years | 0 (0.0%) | 0 (0.0%) |
| 18 to 34 Years | 0 (0.0%) | 0 (0.0%) |
| 35 to 64 Years | 13 (5.3%) | 35 (14.4%) |
| 65 to 74 Years | 78 (44.3%) | 16 (7.8%) |
| 75 Years and over | 0 (0.0%) | 6 (100.0%) |
Disability Class: Vision Difficulty
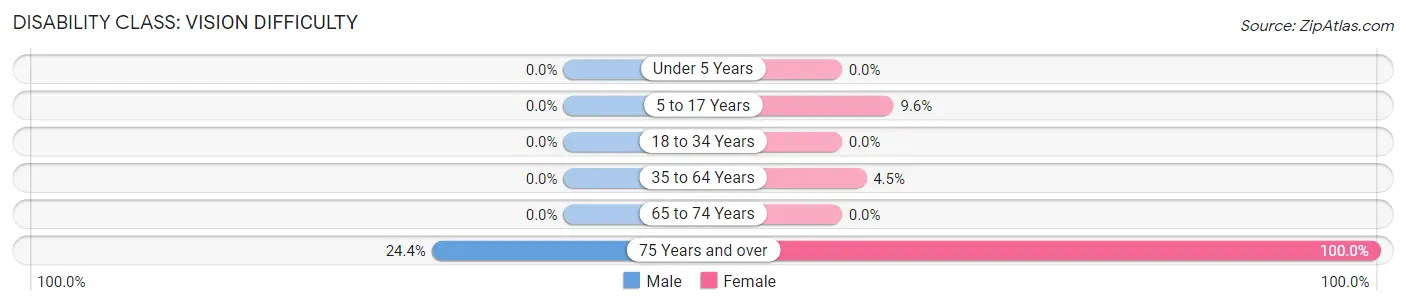
| Age Bracket | Male | Female |
| Under 5 Years | 0 (0.0%) | 0 (0.0%) |
| 5 to 17 Years | 0 (0.0%) | 19 (9.6%) |
| 18 to 34 Years | 0 (0.0%) | 0 (0.0%) |
| 35 to 64 Years | 0 (0.0%) | 11 (4.5%) |
| 65 to 74 Years | 0 (0.0%) | 0 (0.0%) |
| 75 Years and over | 11 (24.4%) | 6 (100.0%) |
Disability Class: Cognitive Difficulty
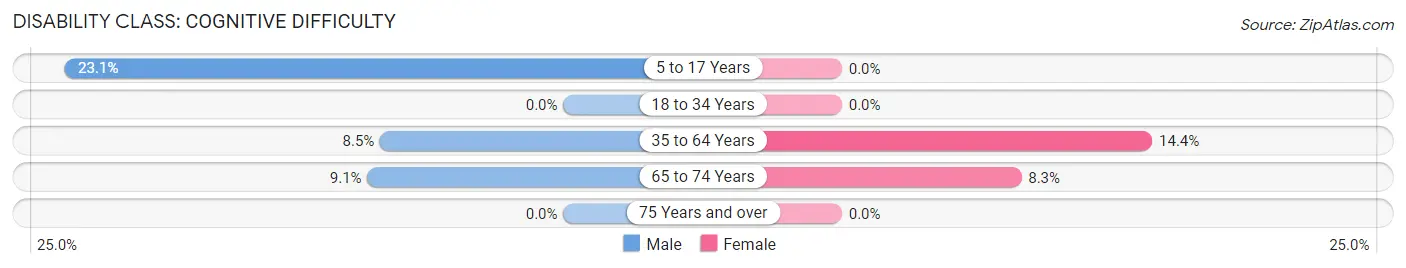
| Age Bracket | Male | Female |
| 5 to 17 Years | 37 (23.1%) | 0 (0.0%) |
| 18 to 34 Years | 0 (0.0%) | 0 (0.0%) |
| 35 to 64 Years | 21 (8.5%) | 35 (14.4%) |
| 65 to 74 Years | 16 (9.1%) | 17 (8.3%) |
| 75 Years and over | 0 (0.0%) | 0 (0.0%) |
Disability Class: Ambulatory Difficulty
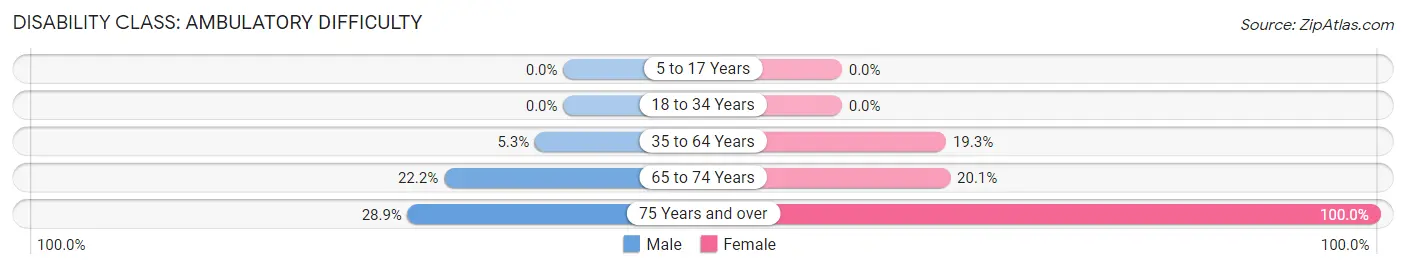
| Age Bracket | Male | Female |
| 5 to 17 Years | 0 (0.0%) | 0 (0.0%) |
| 18 to 34 Years | 0 (0.0%) | 0 (0.0%) |
| 35 to 64 Years | 13 (5.3%) | 47 (19.3%) |
| 65 to 74 Years | 39 (22.2%) | 41 (20.1%) |
| 75 Years and over | 13 (28.9%) | 6 (100.0%) |
Disability Class: Self-Care Difficulty
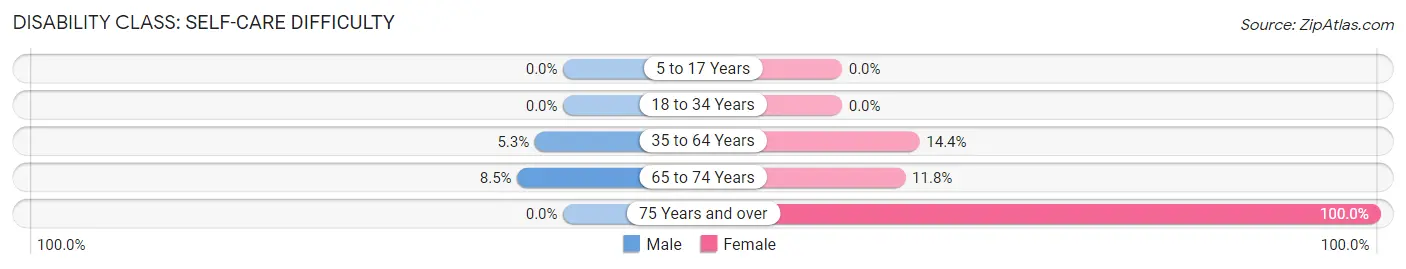
| Age Bracket | Male | Female |
| 5 to 17 Years | 0 (0.0%) | 0 (0.0%) |
| 18 to 34 Years | 0 (0.0%) | 0 (0.0%) |
| 35 to 64 Years | 13 (5.3%) | 35 (14.4%) |
| 65 to 74 Years | 15 (8.5%) | 24 (11.8%) |
| 75 Years and over | 0 (0.0%) | 6 (100.0%) |
Technology Access in Stanaford
Computing Device Access in Stanaford
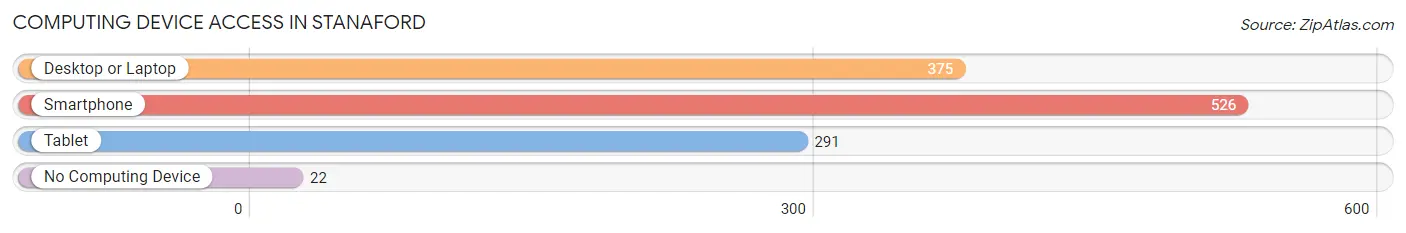
| Device Type | # Households | % Households |
| Desktop or Laptop | 375 | 65.3% |
| Smartphone | 526 | 91.6% |
| Tablet | 291 | 50.7% |
| No Computing Device | 22 | 3.8% |
| Total | 574 | 100.0% |
Internet Access in Stanaford
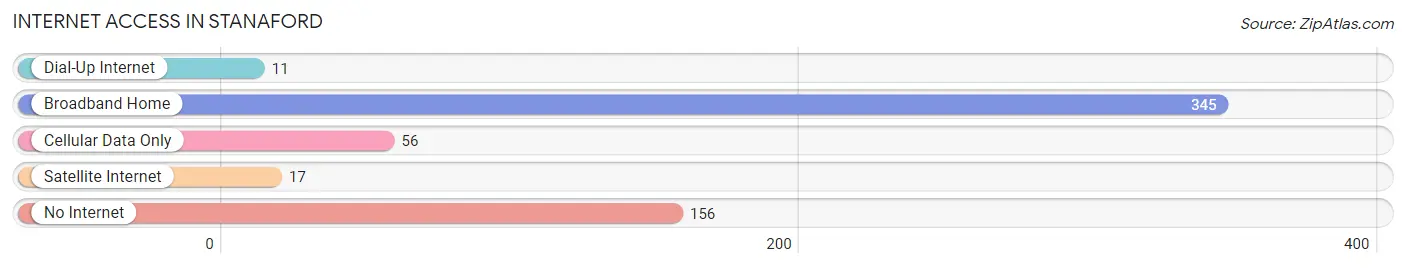
| Internet Type | # Households | % Households |
| Dial-Up Internet | 11 | 1.9% |
| Broadband Home | 345 | 60.1% |
| Cellular Data Only | 56 | 9.8% |
| Satellite Internet | 17 | 3.0% |
| No Internet | 156 | 27.2% |
| Total | 574 | 100.0% |
Stanaford Summary
Stanaford is a small unincorporated community located in Raleigh County, West Virginia. It is situated in the Appalachian Mountains, approximately 10 miles south of Beckley and 5 miles north of Sophia. The population of Stanaford was estimated to be around 500 in 2020.
History
Stanaford was first settled in the late 1800s by a group of settlers from the nearby town of Sophia. The town was named after a local family, the Stanafords, who owned a large amount of land in the area. The town was officially incorporated in 1891.
In the early 1900s, Stanaford was a thriving coal mining town. The town was home to several coal mines, including the Stanaford Coal Company, which was founded in 1902. The coal industry provided employment for many of the town’s residents.
In the 1950s, the coal industry began to decline in Stanaford. Many of the coal mines closed and the town’s population began to decline. In the 1960s, the town was hit hard by the decline of the coal industry and many of the town’s residents moved away in search of work.
Geography
Stanaford is located in the Appalachian Mountains of West Virginia. The town is situated in a valley between two mountain ranges, the Allegheny Mountains to the east and the Blue Ridge Mountains to the west. The town is located at an elevation of 2,000 feet above sea level.
The climate in Stanaford is humid continental, with hot summers and cold winters. The average annual temperature is around 50 degrees Fahrenheit. The average annual precipitation is around 40 inches.
Economy
The economy of Stanaford is largely based on agriculture and tourism. The town is home to several farms, which produce a variety of crops, including corn, soybeans, and hay. The town is also home to several tourist attractions, including the Stanaford Wildlife Refuge and the Stanaford National Forest.
The town is also home to several small businesses, including a grocery store, a hardware store, and a gas station. The town is also home to several restaurants, including a pizza parlor and a diner.
Demographics
The population of Stanaford was estimated to be around 500 in 2020. The town is predominantly white, with around 95% of the population being white. The remaining 5% of the population is made up of African Americans, Hispanics, and Native Americans.
The median household income in Stanaford is around $30,000. The median home value is around $90,000. The town has a poverty rate of around 20%.
Conclusion
Stanaford is a small unincorporated community located in Raleigh County, West Virginia. It is situated in the Appalachian Mountains, approximately 10 miles south of Beckley and 5 miles north of Sophia. The population of Stanaford was estimated to be around 500 in 2020. The town’s economy is largely based on agriculture and tourism, and the town is home to several small businesses. The population of Stanaford is predominantly white, with around 95% of the population being white. The median household income in Stanaford is around $30,000 and the median home value is around $90,000.
Common Questions
What is the Total Population of Stanaford?
Total Population of Stanaford is 1,401.
What is the Total Male Population of Stanaford?
Total Male Population of Stanaford is 688.
What is the Total Female Population of Stanaford?
Total Female Population of Stanaford is 713.
What is the Ratio of Males per 100 Females in Stanaford?
There are 96.49 Males per 100 Females in Stanaford.
What is the Ratio of Females per 100 Males in Stanaford?
There are 103.63 Females per 100 Males in Stanaford.
What is the Median Population Age in Stanaford?
Median Population Age in Stanaford is 53.0 Years.
What is the Average Family Size in Stanaford
Average Family Size in Stanaford is 3.0 People.
What is the Average Household Size in Stanaford
Average Household Size in Stanaford is 2.4 People.
What is Per Capita Income in Stanaford?
Per Capita income in Stanaford is $25,690.
What is the Median Family Income in Stanaford?
Median Family Income in Stanaford is $64,360.
What is the Median Household income in Stanaford?
Median Household Income in Stanaford is $60,375.
What is Income or Wage Gap in Stanaford?
Income or Wage Gap in Stanaford is 21.9%.
Women in Stanaford earn 78.1 cents for every dollar earned by a man.
What is Family Income Deficit in Stanaford?
Family Income Deficit in Stanaford is $10,809.
Families that are below poverty line in Stanaford earn $10,809 less on average than the poverty threshold level.
What is Inequality or Gini Index in Stanaford?
Inequality or Gini Index in Stanaford is 0.42.
How Large is the Labor Force in Stanaford?
There are 547 People in the Labor Forcein in Stanaford.
What is the Percentage of People in the Labor Force in Stanaford?
53.5% of People are in the Labor Force in Stanaford.
What is the Unemployment Rate in Stanaford?
Unemployment Rate in Stanaford is 9.5%.