Carpendale, WV
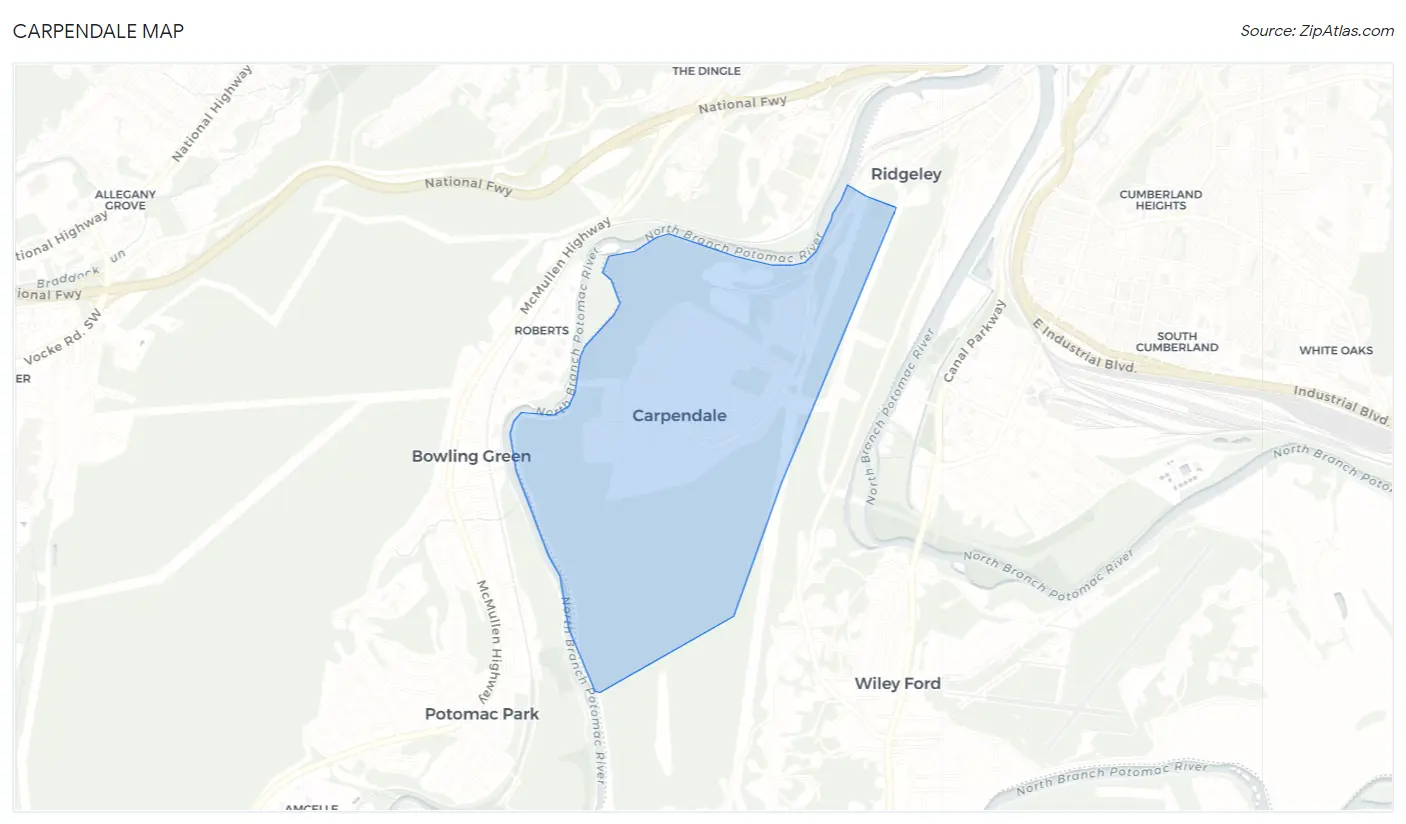
Carpendale Map
Carpendale Overview
1,256
TOTAL POPULATION
702
MALE POPULATION
554
FEMALE POPULATION
126.71
MALES / 100 FEMALES
78.92
FEMALES / 100 MALES
45.4
MEDIAN AGE
3.1
AVG FAMILY SIZE
2.7
AVG HOUSEHOLD SIZE
$29,478
PER CAPITA INCOME
$74,886
AVG FAMILY INCOME
$65,938
AVG HOUSEHOLD INCOME
38.7%
WAGE / INCOME GAP [ % ]
61.3¢/ $1
WAGE / INCOME GAP [ $ ]
0.32
INEQUALITY / GINI INDEX
661
LABOR FORCE [ PEOPLE ]
60.3%
PERCENT IN LABOR FORCE
8.9%
UNEMPLOYMENT RATE
Carpendale Area Codes
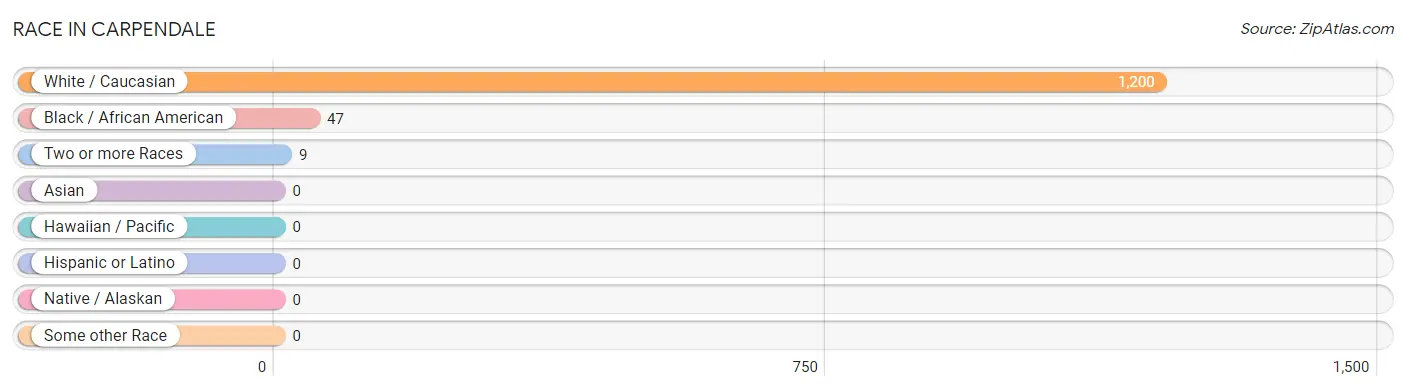
Race in Carpendale
The most populous races in Carpendale are White / Caucasian (1,200 | 95.5%), Black / African American (47 | 3.7%), and Two or more Races (9 | 0.7%).
| Race | # Population | % Population |
| Asian | 0 | 0.0% |
| Black / African American | 47 | 3.7% |
| Hawaiian / Pacific | 0 | 0.0% |
| Hispanic or Latino | 0 | 0.0% |
| Native / Alaskan | 0 | 0.0% |
| White / Caucasian | 1,200 | 95.5% |
| Two or more Races | 9 | 0.7% |
| Some other Race | 0 | 0.0% |
| Total | 1,256 | 100.0% |
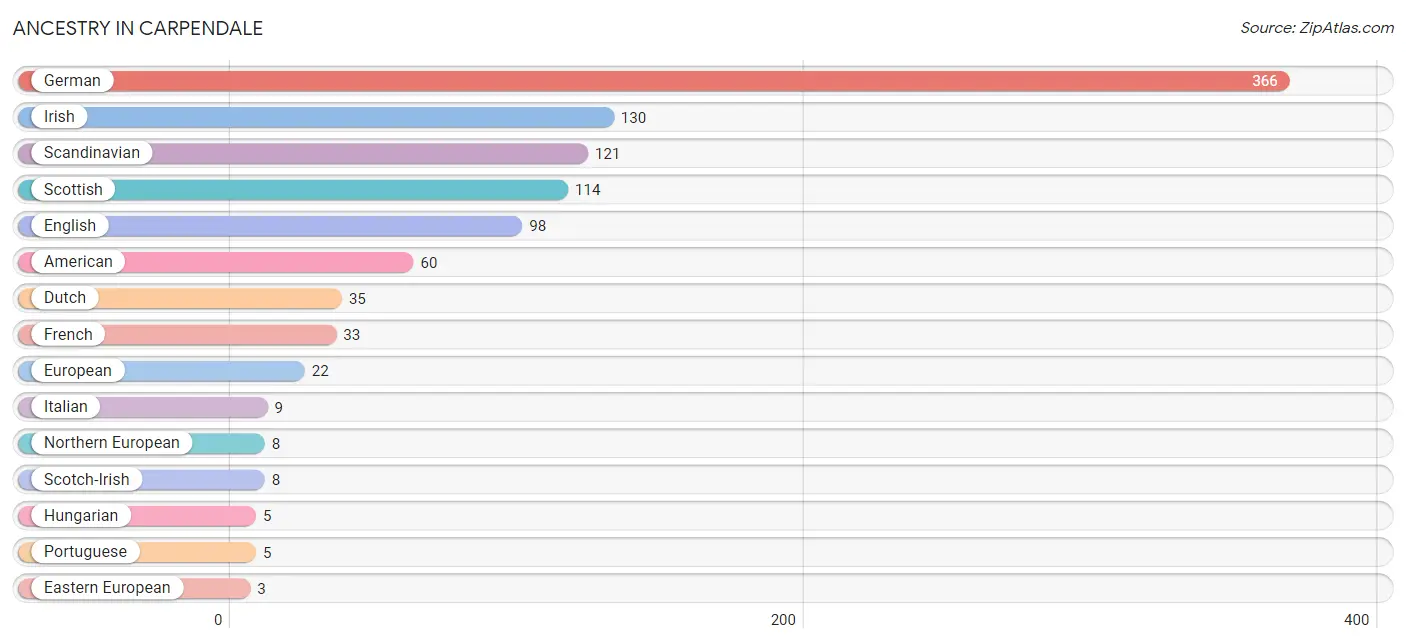
Ancestry in Carpendale
The most populous ancestries reported in Carpendale are German (366 | 29.1%), Irish (130 | 10.3%), Scandinavian (121 | 9.6%), Scottish (114 | 9.1%), and English (98 | 7.8%), together accounting for 66.0% of all Carpendale residents.
| Ancestry | # Population | % Population |
| American | 60 | 4.8% |
| Apache | 2 | 0.2% |
| Dutch | 35 | 2.8% |
| Eastern European | 3 | 0.2% |
| English | 98 | 7.8% |
| European | 22 | 1.8% |
| French | 33 | 2.6% |
| German | 366 | 29.1% |
| Hungarian | 5 | 0.4% |
| Irish | 130 | 10.3% |
| Italian | 9 | 0.7% |
| Northern European | 8 | 0.6% |
| Portuguese | 5 | 0.4% |
| Scandinavian | 121 | 9.6% |
| Scotch-Irish | 8 | 0.6% |
| Scottish | 114 | 9.1% |
| Swedish | 2 | 0.2% | View All 17 Rows |
Immigrants in Carpendale

| Immigration Origin | # Population | % Population | View All 0 Rows |
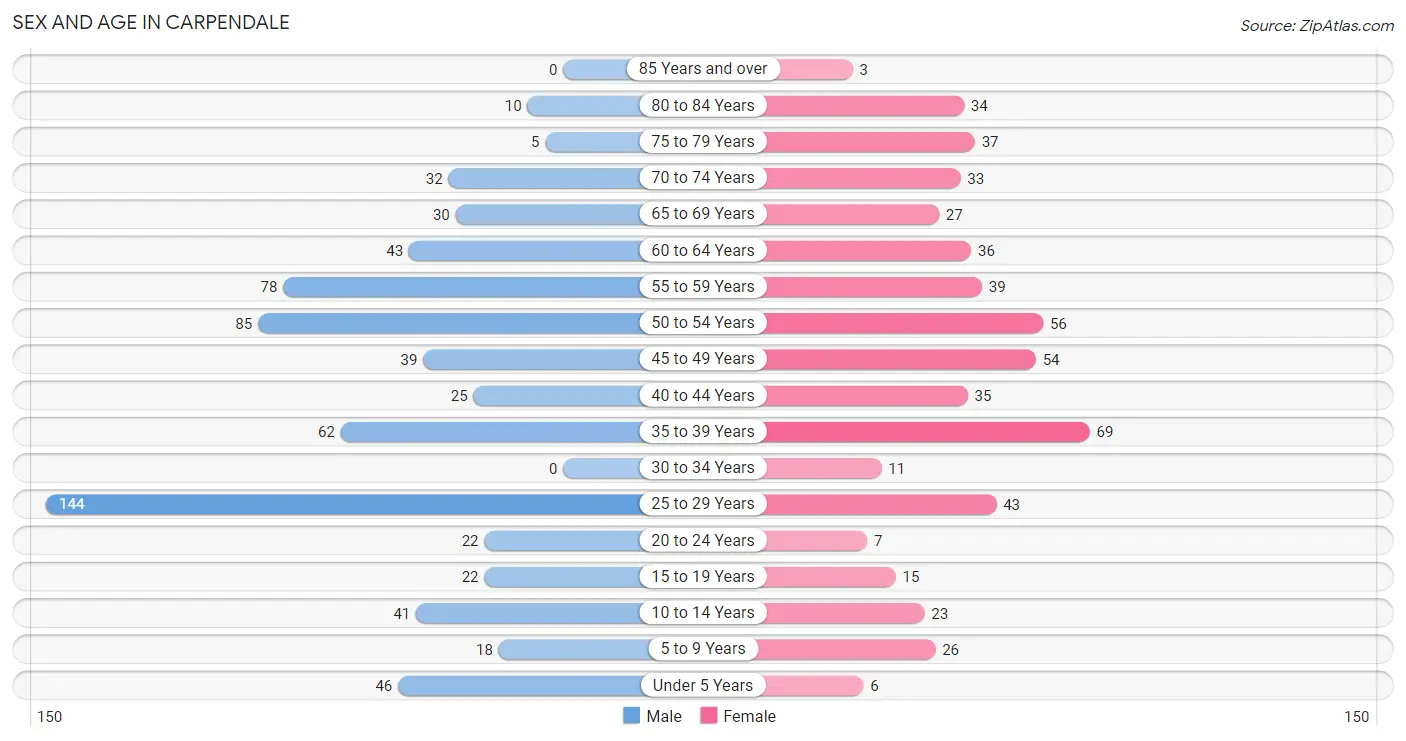
Sex and Age in Carpendale
Sex and Age in Carpendale
The most populous age groups in Carpendale are 25 to 29 Years (144 | 20.5%) for men and 35 to 39 Years (69 | 12.4%) for women.
| Age Bracket | Male | Female |
| Under 5 Years | 46 (6.6%) | 6 (1.1%) |
| 5 to 9 Years | 18 (2.6%) | 26 (4.7%) |
| 10 to 14 Years | 41 (5.8%) | 23 (4.2%) |
| 15 to 19 Years | 22 (3.1%) | 15 (2.7%) |
| 20 to 24 Years | 22 (3.1%) | 7 (1.3%) |
| 25 to 29 Years | 144 (20.5%) | 43 (7.8%) |
| 30 to 34 Years | 0 (0.0%) | 11 (2.0%) |
| 35 to 39 Years | 62 (8.8%) | 69 (12.4%) |
| 40 to 44 Years | 25 (3.6%) | 35 (6.3%) |
| 45 to 49 Years | 39 (5.6%) | 54 (9.8%) |
| 50 to 54 Years | 85 (12.1%) | 56 (10.1%) |
| 55 to 59 Years | 78 (11.1%) | 39 (7.0%) |
| 60 to 64 Years | 43 (6.1%) | 36 (6.5%) |
| 65 to 69 Years | 30 (4.3%) | 27 (4.9%) |
| 70 to 74 Years | 32 (4.6%) | 33 (6.0%) |
| 75 to 79 Years | 5 (0.7%) | 37 (6.7%) |
| 80 to 84 Years | 10 (1.4%) | 34 (6.1%) |
| 85 Years and over | 0 (0.0%) | 3 (0.5%) |
| Total | 702 (100.0%) | 554 (100.0%) |
Families and Households in Carpendale
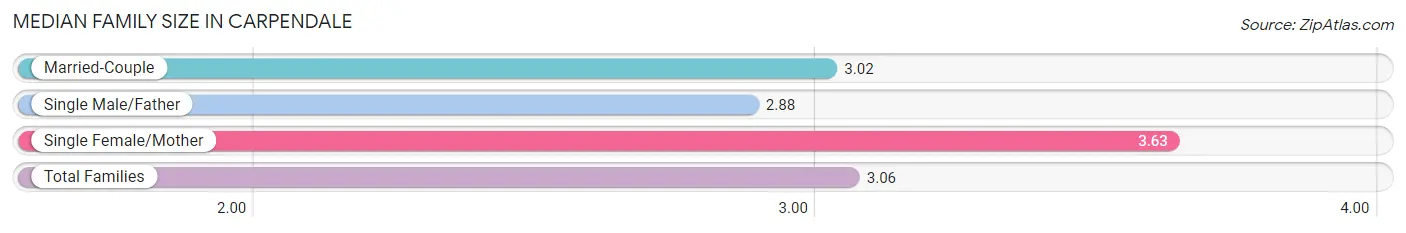
Median Family Size in Carpendale
The median family size in Carpendale is 3.06 persons per family, with single female/mother families (30 | 9.8%) accounting for the largest median family size of 3.63 persons per family. On the other hand, single male/father families (50 | 16.4%) represent the smallest median family size with 2.88 persons per family.
| Family Type | # Families | Family Size |
| Married-Couple | 225 (73.8%) | 3.02 |
| Single Male/Father | 50 (16.4%) | 2.88 |
| Single Female/Mother | 30 (9.8%) | 3.63 |
| Total Families | 305 (100.0%) | 3.06 |
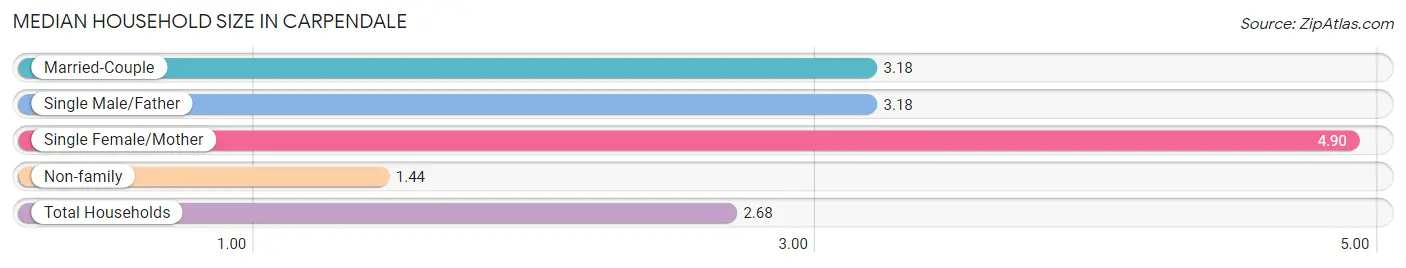
Median Household Size in Carpendale
The median household size in Carpendale is 2.68 persons per household, with single female/mother households (30 | 6.4%) accounting for the largest median household size of 4.9 persons per household. non-family households (163 | 34.8%) represent the smallest median household size with 1.44 persons per household.
| Household Type | # Households | Household Size |
| Married-Couple | 225 (48.1%) | 3.18 |
| Single Male/Father | 50 (10.7%) | 3.18 |
| Single Female/Mother | 30 (6.4%) | 4.90 |
| Non-family | 163 (34.8%) | 1.44 |
| Total Households | 468 (100.0%) | 2.68 |
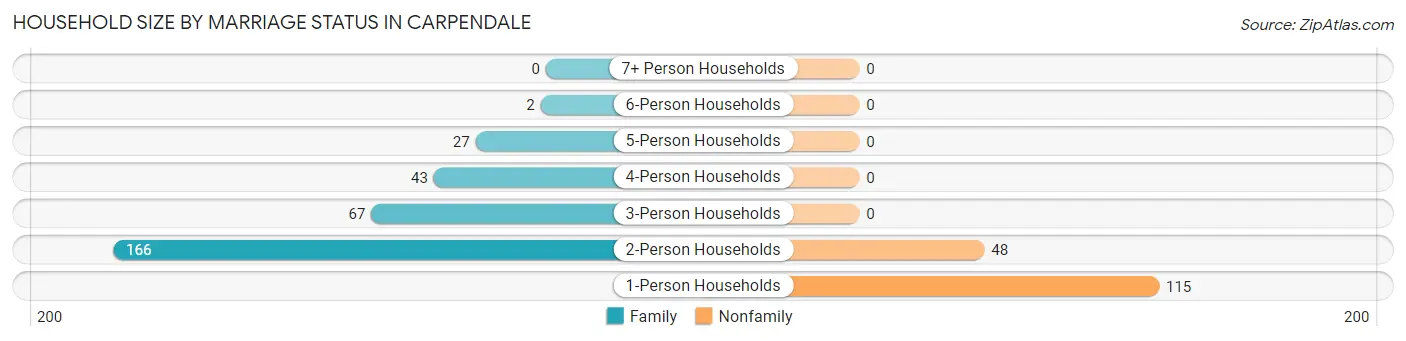
Household Size by Marriage Status in Carpendale
Out of a total of 468 households in Carpendale, 305 (65.2%) are family households, while 163 (34.8%) are nonfamily households. The most numerous type of family households are 2-person households, comprising 166, and the most common type of nonfamily households are 1-person households, comprising 115.
| Household Size | Family Households | Nonfamily Households |
| 1-Person Households | - | 115 (24.6%) |
| 2-Person Households | 166 (35.5%) | 48 (10.3%) |
| 3-Person Households | 67 (14.3%) | 0 (0.0%) |
| 4-Person Households | 43 (9.2%) | 0 (0.0%) |
| 5-Person Households | 27 (5.8%) | 0 (0.0%) |
| 6-Person Households | 2 (0.4%) | 0 (0.0%) |
| 7+ Person Households | 0 (0.0%) | 0 (0.0%) |
| Total | 305 (65.2%) | 163 (34.8%) |
Female Fertility in Carpendale
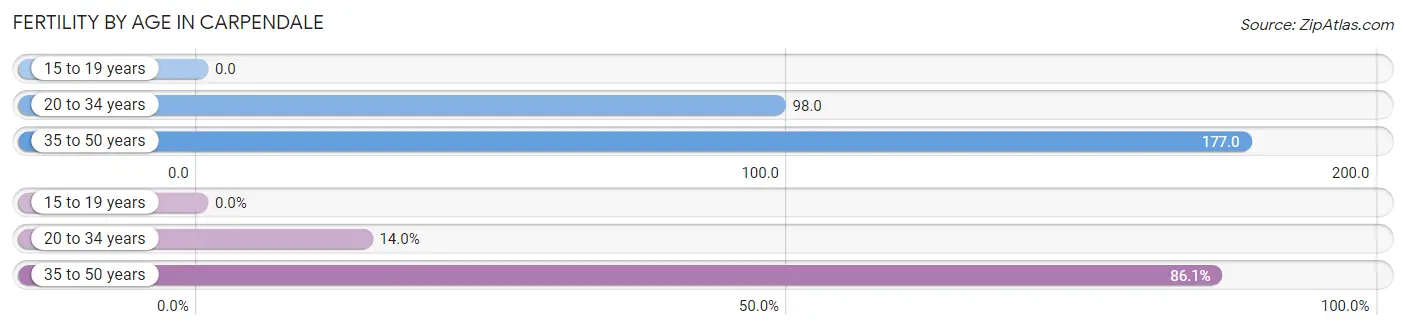
Fertility by Age in Carpendale
Average fertility rate in Carpendale is 151.0 births per 1,000 women. Women in the age bracket of 35 to 50 years have the highest fertility rate with 177.0 births per 1,000 women. Women in the age bracket of 35 to 50 years acount for 86.1% of all women with births.
| Age Bracket | Women with Births | Births / 1,000 Women |
| 15 to 19 years | 0 (0.0%) | 0.0 |
| 20 to 34 years | 6 (14.0%) | 98.0 |
| 35 to 50 years | 37 (86.1%) | 177.0 |
| Total | 43 (100.0%) | 151.0 |
Fertility by Age by Marriage Status in Carpendale
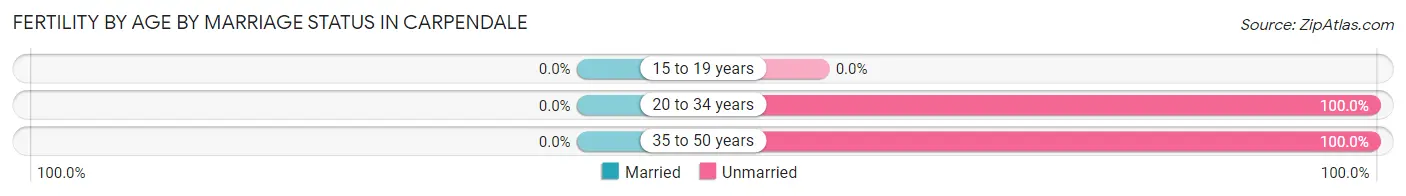
| Age Bracket | Married | Unmarried |
| 15 to 19 years | 0 (0.0%) | 0 (0.0%) |
| 20 to 34 years | 0 (0.0%) | 6 (100.0%) |
| 35 to 50 years | 0 (0.0%) | 37 (100.0%) |
| Total | 0 (0.0%) | 43 (100.0%) |
Fertility by Education in Carpendale
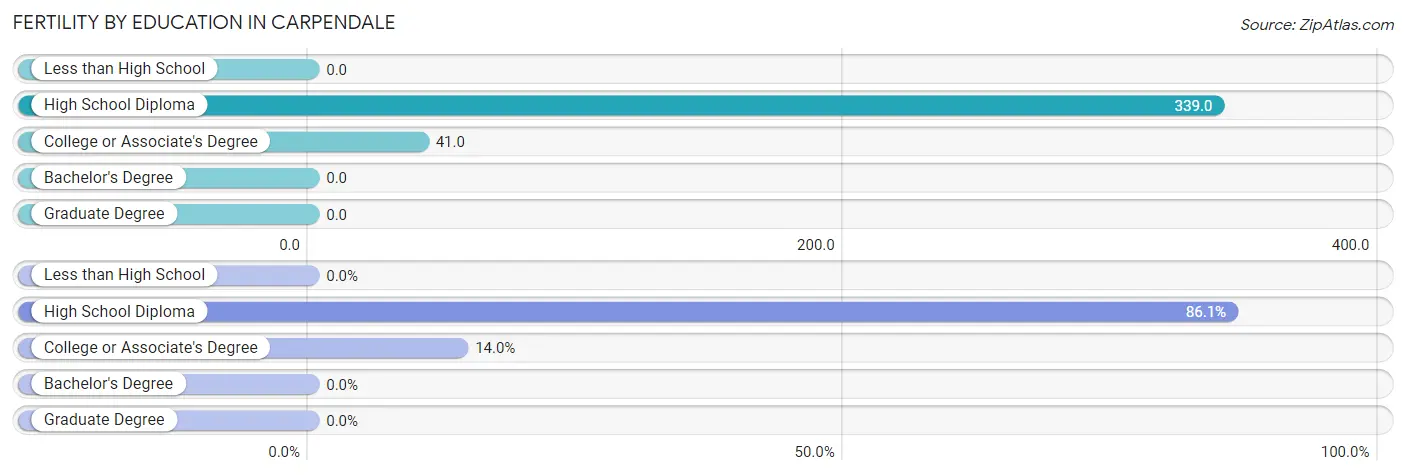
| Educational Attainment | Women with Births | Births / 1,000 Women |
| Less than High School | 0 (0.0%) | 0.0 |
| High School Diploma | 37 (86.1%) | 339.0 |
| College or Associate's Degree | 6 (14.0%) | 41.0 |
| Bachelor's Degree | 0 (0.0%) | 0.0 |
| Graduate Degree | 0 (0.0%) | 0.0 |
| Total | 43 (100.0%) | 151.0 |
Fertility by Education by Marriage Status in Carpendale
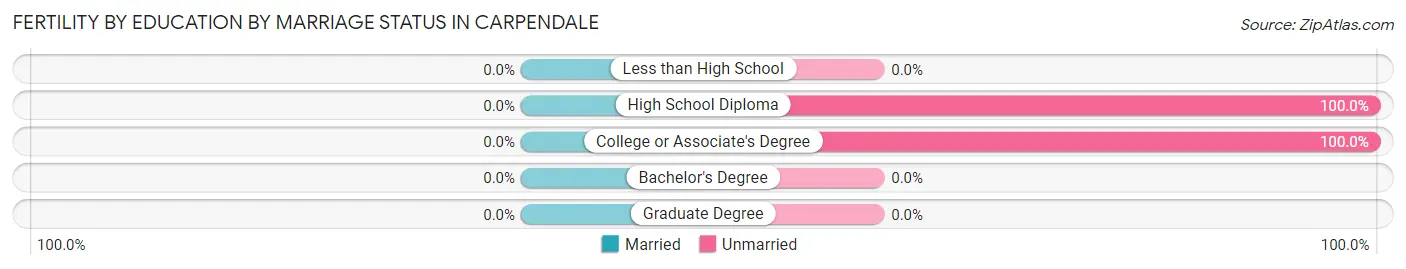
| Educational Attainment | Married | Unmarried |
| Less than High School | 0 (0.0%) | 0 (0.0%) |
| High School Diploma | 0 (0.0%) | 37 (100.0%) |
| College or Associate's Degree | 0 (0.0%) | 6 (100.0%) |
| Bachelor's Degree | 0 (0.0%) | 0 (0.0%) |
| Graduate Degree | 0 (0.0%) | 0 (0.0%) |
| Total | 0 (0.0%) | 43 (100.0%) |
Income in Carpendale
Income Overview in Carpendale
Per Capita Income in Carpendale is $29,478, while median incomes of families and households are $74,886 and $65,938 respectively.
| Characteristic | Number | Measure |
| Per Capita Income | 1,256 | $29,478 |
| Median Family Income | 305 | $74,886 |
| Mean Family Income | 305 | $71,640 |
| Median Household Income | 468 | $65,938 |
| Mean Household Income | 468 | $71,227 |
| Income Deficit | 305 | $0 |
| Wage / Income Gap (%) | 1,256 | 38.72% |
| Wage / Income Gap ($) | 1,256 | 61.28¢ per $1 |
| Gini / Inequality Index | 1,256 | 0.32 |
Earnings by Sex in Carpendale
Average Earnings in Carpendale are $29,510, $45,313 for men and $27,770 for women, a difference of 38.7%.
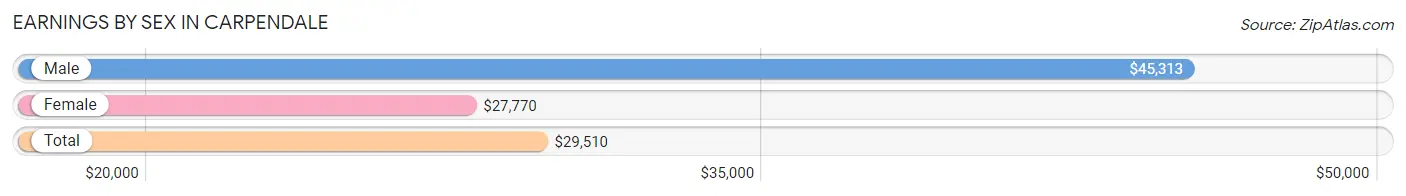
| Sex | Number | Average Earnings |
| Male | 460 (64.0%) | $45,313 |
| Female | 259 (36.0%) | $27,770 |
| Total | 719 (100.0%) | $29,510 |
Earnings by Sex by Income Bracket in Carpendale
The most common earnings brackets in Carpendale are $2,499 or less for men (64 | 13.9%) and $25,000 to $29,999 for women (62 | 23.9%).
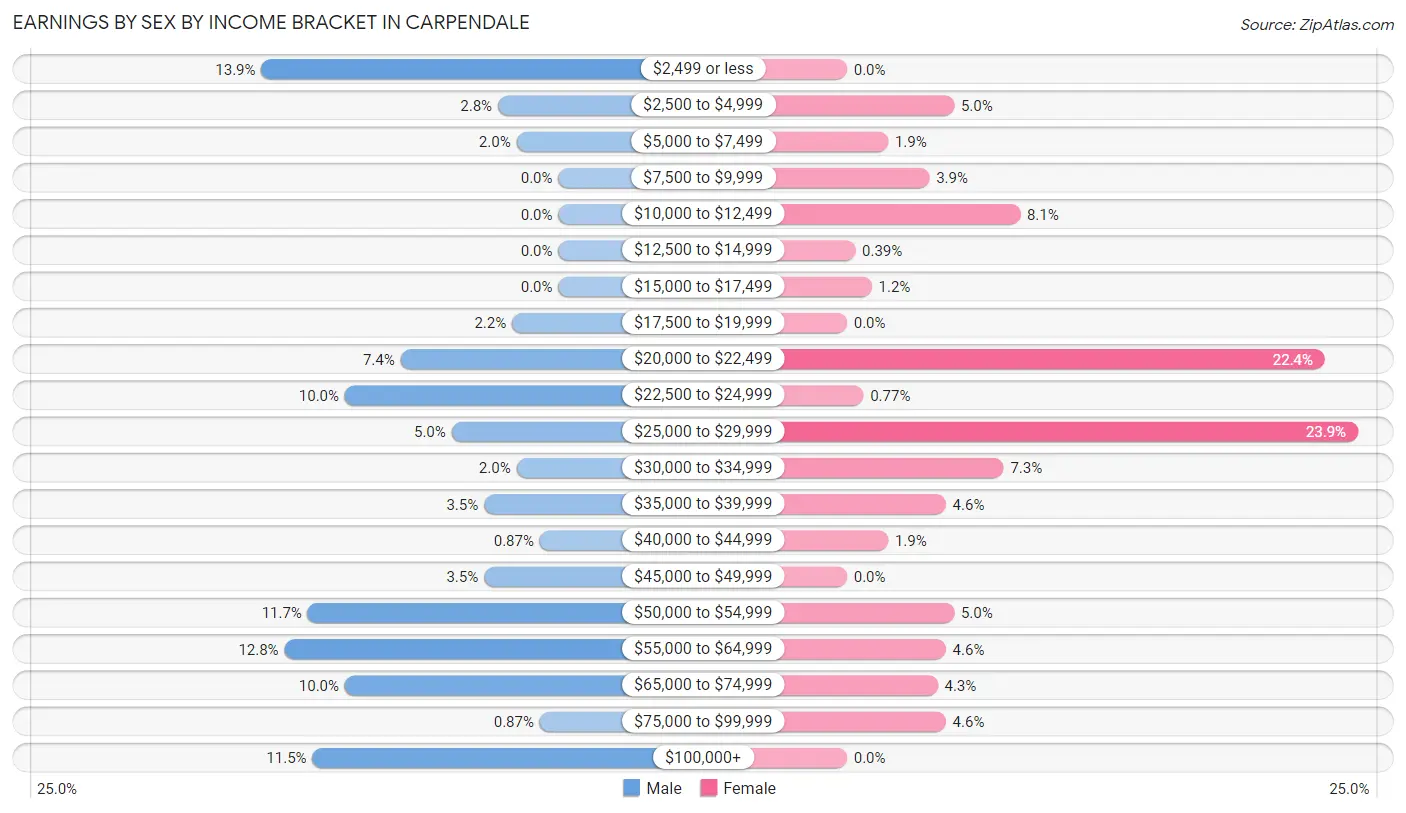
| Income | Male | Female |
| $2,499 or less | 64 (13.9%) | 0 (0.0%) |
| $2,500 to $4,999 | 13 (2.8%) | 13 (5.0%) |
| $5,000 to $7,499 | 9 (2.0%) | 5 (1.9%) |
| $7,500 to $9,999 | 0 (0.0%) | 10 (3.9%) |
| $10,000 to $12,499 | 0 (0.0%) | 21 (8.1%) |
| $12,500 to $14,999 | 0 (0.0%) | 1 (0.4%) |
| $15,000 to $17,499 | 0 (0.0%) | 3 (1.2%) |
| $17,500 to $19,999 | 10 (2.2%) | 0 (0.0%) |
| $20,000 to $22,499 | 34 (7.4%) | 58 (22.4%) |
| $22,500 to $24,999 | 46 (10.0%) | 2 (0.8%) |
| $25,000 to $29,999 | 23 (5.0%) | 62 (23.9%) |
| $30,000 to $34,999 | 9 (2.0%) | 19 (7.3%) |
| $35,000 to $39,999 | 16 (3.5%) | 12 (4.6%) |
| $40,000 to $44,999 | 4 (0.9%) | 5 (1.9%) |
| $45,000 to $49,999 | 16 (3.5%) | 0 (0.0%) |
| $50,000 to $54,999 | 54 (11.7%) | 13 (5.0%) |
| $55,000 to $64,999 | 59 (12.8%) | 12 (4.6%) |
| $65,000 to $74,999 | 46 (10.0%) | 11 (4.3%) |
| $75,000 to $99,999 | 4 (0.9%) | 12 (4.6%) |
| $100,000+ | 53 (11.5%) | 0 (0.0%) |
| Total | 460 (100.0%) | 259 (100.0%) |
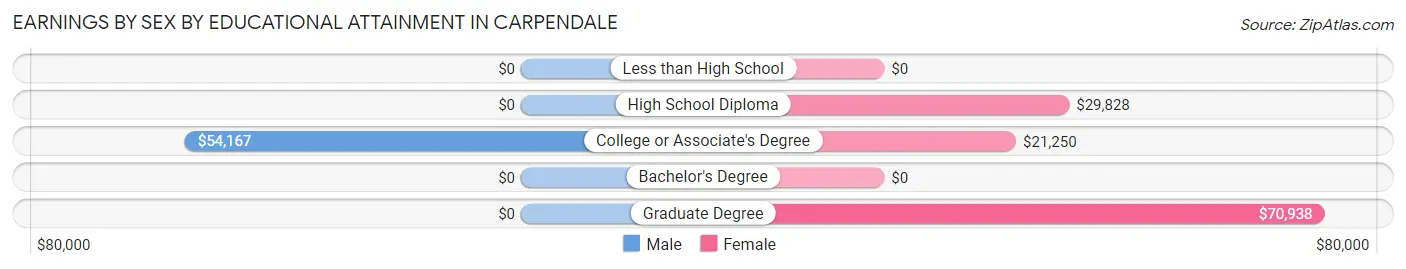
Earnings by Sex by Educational Attainment in Carpendale
Average earnings in Carpendale are $50,329 for men and $27,941 for women, a difference of 44.5%. Men with an educational attainment of college or associate's degree enjoy the highest average annual earnings of $54,167, while those with college or associate's degree education earn the least with $54,167. Women with an educational attainment of graduate degree earn the most with the average annual earnings of $70,938, while those with college or associate's degree education have the smallest earnings of $21,250.
| Educational Attainment | Male Income | Female Income |
| Less than High School | - | - |
| High School Diploma | - | - |
| College or Associate's Degree | $54,167 | $21,250 |
| Bachelor's Degree | - | - |
| Graduate Degree | - | - |
| Total | $50,329 | $27,941 |
Family Income in Carpendale
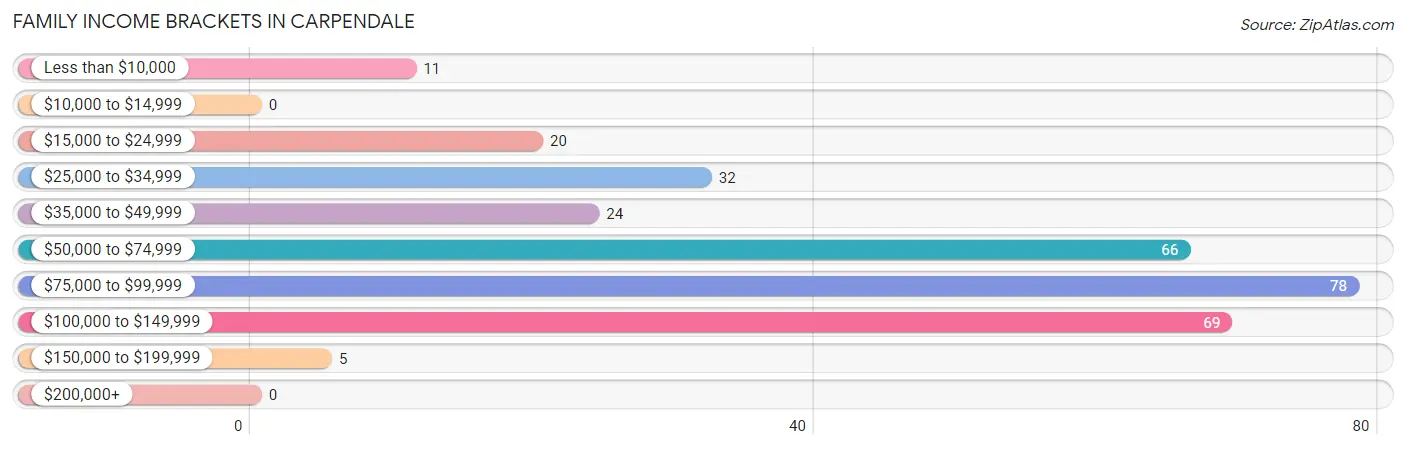
Family Income Brackets in Carpendale
According to the Carpendale family income data, there are 78 families falling into the $75,000 to $99,999 income range, which is the most common income bracket and makes up 25.6% of all families.
| Income Bracket | # Families | % Families |
| Less than $10,000 | 11 | 3.6% |
| $10,000 to $14,999 | 0 | 0.0% |
| $15,000 to $24,999 | 20 | 6.6% |
| $25,000 to $34,999 | 32 | 10.5% |
| $35,000 to $49,999 | 24 | 7.9% |
| $50,000 to $74,999 | 66 | 21.6% |
| $75,000 to $99,999 | 78 | 25.6% |
| $100,000 to $149,999 | 69 | 22.6% |
| $150,000 to $199,999 | 5 | 1.6% |
| $200,000+ | 0 | 0.0% |
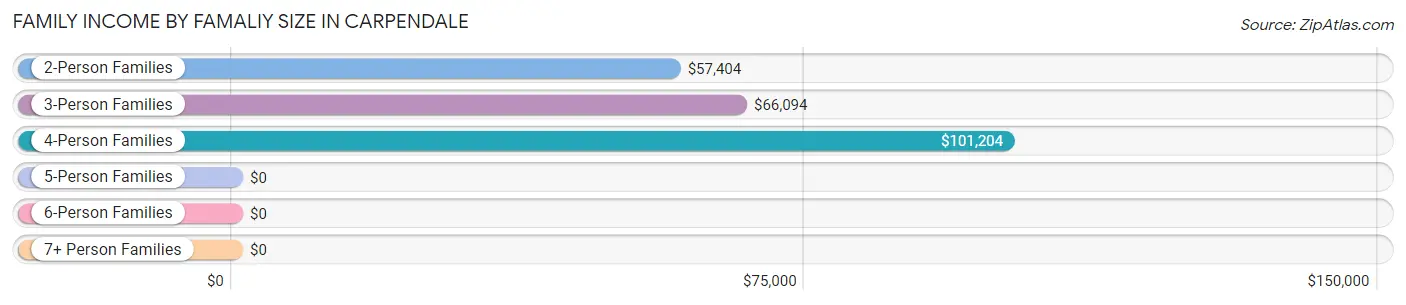
Family Income by Famaliy Size in Carpendale
4-person families (56 | 18.4%) account for the highest median family income in Carpendale with $101,204 per family, while 2-person families (184 | 60.3%) have the highest median income of $28,702 per family member.
| Income Bracket | # Families | Median Income |
| 2-Person Families | 184 (60.3%) | $57,404 |
| 3-Person Families | 63 (20.7%) | $66,094 |
| 4-Person Families | 56 (18.4%) | $101,204 |
| 5-Person Families | 0 (0.0%) | $0 |
| 6-Person Families | 2 (0.7%) | $0 |
| 7+ Person Families | 0 (0.0%) | $0 |
| Total | 305 (100.0%) | $74,886 |
Family Income by Number of Earners in Carpendale
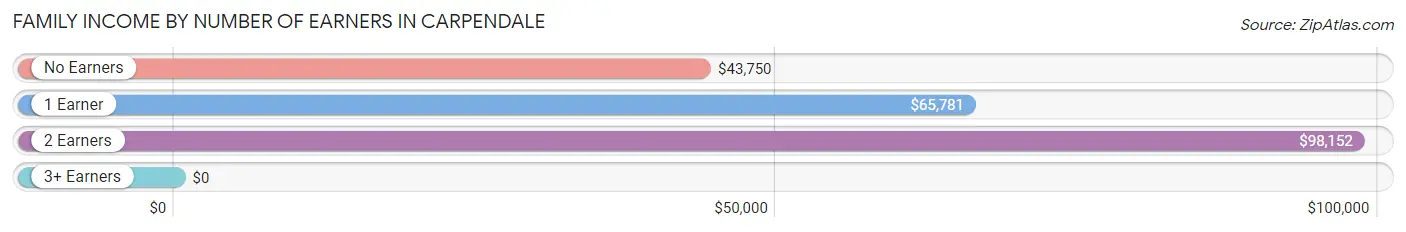
| Number of Earners | # Families | Median Income |
| No Earners | 62 (20.3%) | $43,750 |
| 1 Earner | 99 (32.5%) | $65,781 |
| 2 Earners | 108 (35.4%) | $98,152 |
| 3+ Earners | 36 (11.8%) | $0 |
| Total | 305 (100.0%) | $74,886 |
Household Income in Carpendale
Household Income Brackets in Carpendale
With 116 households falling in the category, the $50,000 to $74,999 income range is the most frequent in Carpendale, accounting for 24.8% of all households.
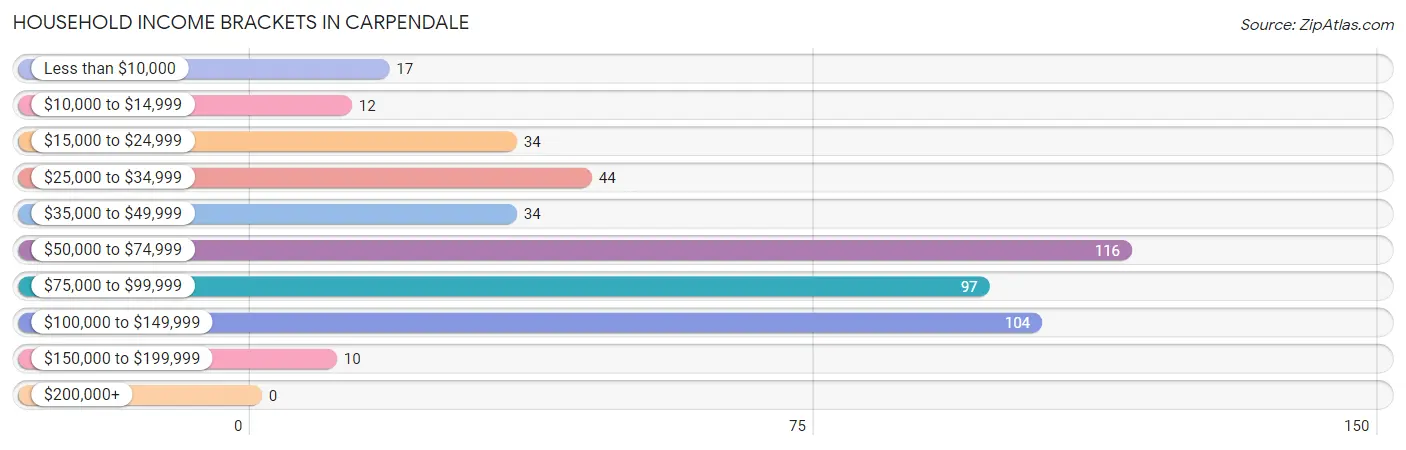
| Income Bracket | # Households | % Households |
| Less than $10,000 | 17 | 3.6% |
| $10,000 to $14,999 | 12 | 2.6% |
| $15,000 to $24,999 | 34 | 7.3% |
| $25,000 to $34,999 | 44 | 9.4% |
| $35,000 to $49,999 | 34 | 7.3% |
| $50,000 to $74,999 | 116 | 24.8% |
| $75,000 to $99,999 | 97 | 20.7% |
| $100,000 to $149,999 | 104 | 22.2% |
| $150,000 to $199,999 | 10 | 2.1% |
| $200,000+ | 0 | 0.0% |
Household Income by Householder Age in Carpendale
The median household income in Carpendale is $65,938, with the highest median household income of $97,772 found in the 45 to 64 years age bracket for the primary householder. A total of 219 households (46.8%) fall into this category. Meanwhile, the 15 to 24 years age bracket for the primary householder has the lowest median household income of $0, with 13 households (2.8%) in this group.
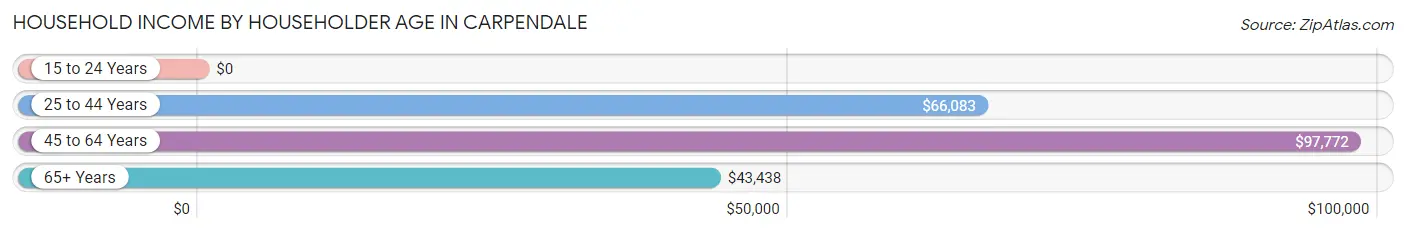
| Income Bracket | # Households | Median Income |
| 15 to 24 Years | 13 (2.8%) | $0 |
| 25 to 44 Years | 91 (19.4%) | $66,083 |
| 45 to 64 Years | 219 (46.8%) | $97,772 |
| 65+ Years | 145 (31.0%) | $43,438 |
| Total | 468 (100.0%) | $65,938 |
Poverty in Carpendale
Income Below Poverty by Sex and Age in Carpendale
With 6.3% poverty level for males and 11.2% for females among the residents of Carpendale, under 5 year old males and 35 to 44 year old females are the most vulnerable to poverty, with 20 males (43.5%) and 39 females (37.5%) in their respective age groups living below the poverty level.
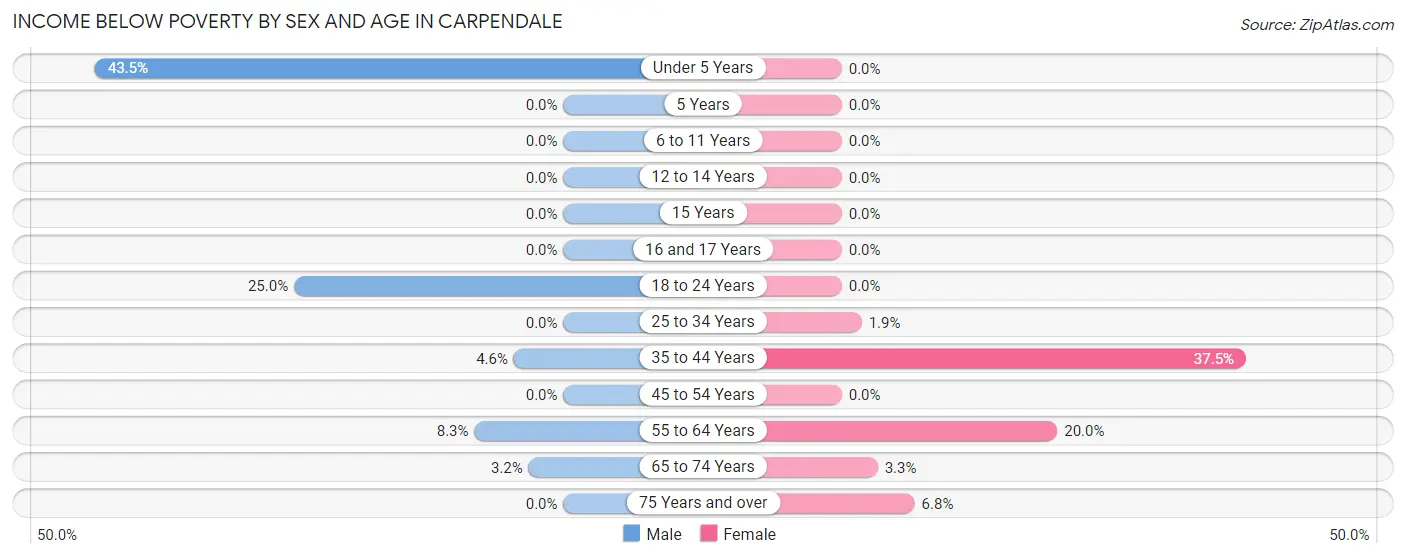
| Age Bracket | Male | Female |
| Under 5 Years | 20 (43.5%) | 0 (0.0%) |
| 5 Years | 0 (0.0%) | 0 (0.0%) |
| 6 to 11 Years | 0 (0.0%) | 0 (0.0%) |
| 12 to 14 Years | 0 (0.0%) | 0 (0.0%) |
| 15 Years | 0 (0.0%) | 0 (0.0%) |
| 16 and 17 Years | 0 (0.0%) | 0 (0.0%) |
| 18 to 24 Years | 8 (25.0%) | 0 (0.0%) |
| 25 to 34 Years | 0 (0.0%) | 1 (1.8%) |
| 35 to 44 Years | 4 (4.6%) | 39 (37.5%) |
| 45 to 54 Years | 0 (0.0%) | 0 (0.0%) |
| 55 to 64 Years | 10 (8.3%) | 15 (20.0%) |
| 65 to 74 Years | 2 (3.2%) | 2 (3.3%) |
| 75 Years and over | 0 (0.0%) | 5 (6.8%) |
| Total | 44 (6.3%) | 62 (11.2%) |
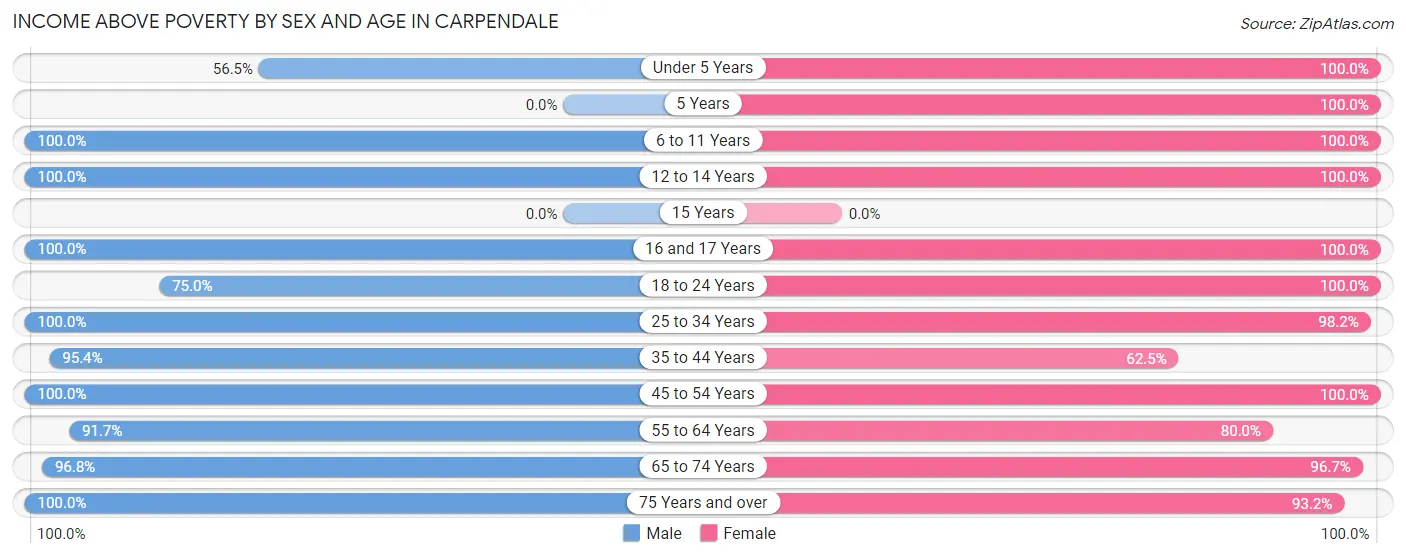
Income Above Poverty by Sex and Age in Carpendale
According to the poverty statistics in Carpendale, males aged 6 to 11 years and females aged under 5 years are the age groups that are most secure financially, with 100.0% of males and 100.0% of females in these age groups living above the poverty line.
| Age Bracket | Male | Female |
| Under 5 Years | 26 (56.5%) | 6 (100.0%) |
| 5 Years | 0 (0.0%) | 3 (100.0%) |
| 6 to 11 Years | 35 (100.0%) | 29 (100.0%) |
| 12 to 14 Years | 24 (100.0%) | 17 (100.0%) |
| 15 Years | 0 (0.0%) | 0 (0.0%) |
| 16 and 17 Years | 12 (100.0%) | 15 (100.0%) |
| 18 to 24 Years | 24 (75.0%) | 7 (100.0%) |
| 25 to 34 Years | 144 (100.0%) | 53 (98.2%) |
| 35 to 44 Years | 83 (95.4%) | 65 (62.5%) |
| 45 to 54 Years | 124 (100.0%) | 110 (100.0%) |
| 55 to 64 Years | 111 (91.7%) | 60 (80.0%) |
| 65 to 74 Years | 60 (96.8%) | 58 (96.7%) |
| 75 Years and over | 15 (100.0%) | 69 (93.2%) |
| Total | 658 (93.7%) | 492 (88.8%) |
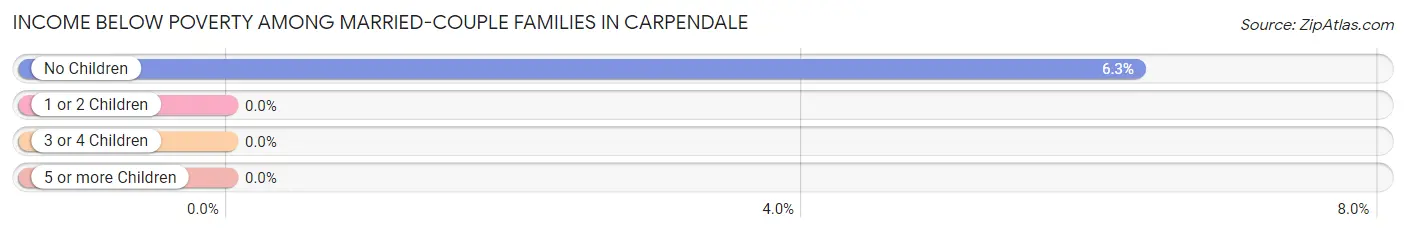
Income Below Poverty Among Married-Couple Families in Carpendale
The poverty statistics for married-couple families in Carpendale show that 4.9% or 11 of the total 225 families live below the poverty line. Families with no children have the highest poverty rate of 6.3%, comprising of 11 families. On the other hand, families with 1 or 2 children have the lowest poverty rate of 0.0%, which includes 0 families.
| Children | Above Poverty | Below Poverty |
| No Children | 163 (93.7%) | 11 (6.3%) |
| 1 or 2 Children | 49 (100.0%) | 0 (0.0%) |
| 3 or 4 Children | 2 (100.0%) | 0 (0.0%) |
| 5 or more Children | 0 (0.0%) | 0 (0.0%) |
| Total | 214 (95.1%) | 11 (4.9%) |
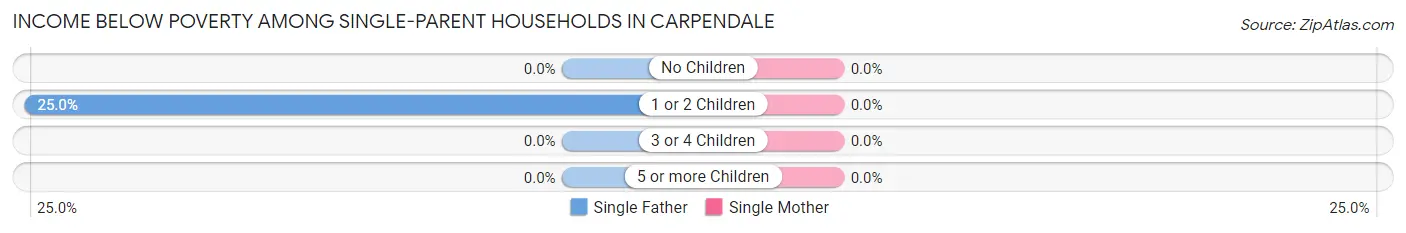
Income Below Poverty Among Single-Parent Households in Carpendale
| Children | Single Father | Single Mother |
| No Children | 0 (0.0%) | 0 (0.0%) |
| 1 or 2 Children | 8 (25.0%) | 0 (0.0%) |
| 3 or 4 Children | 0 (0.0%) | 0 (0.0%) |
| 5 or more Children | 0 (0.0%) | 0 (0.0%) |
| Total | 8 (16.0%) | 0 (0.0%) |
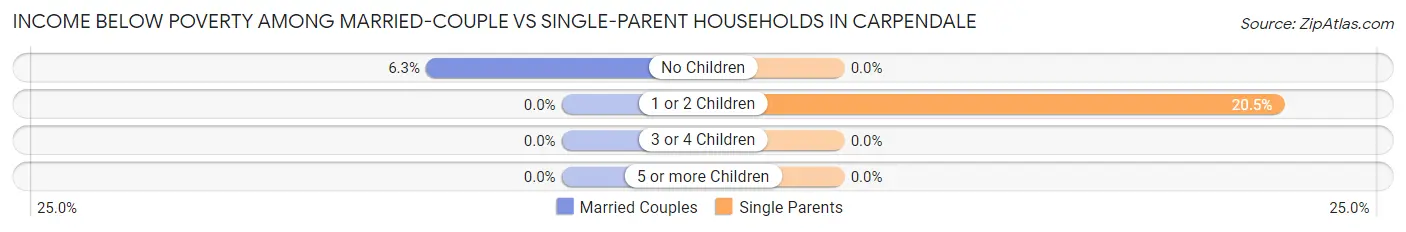
Income Below Poverty Among Married-Couple vs Single-Parent Households in Carpendale
The poverty data for Carpendale shows that 11 of the married-couple family households (4.9%) and 8 of the single-parent households (10.0%) are living below the poverty level. Within the married-couple family households, those with no children have the highest poverty rate, with 11 households (6.3%) falling below the poverty line. Among the single-parent households, those with 1 or 2 children have the highest poverty rate, with 8 household (20.5%) living below poverty.
| Children | Married-Couple Families | Single-Parent Households |
| No Children | 11 (6.3%) | 0 (0.0%) |
| 1 or 2 Children | 0 (0.0%) | 8 (20.5%) |
| 3 or 4 Children | 0 (0.0%) | 0 (0.0%) |
| 5 or more Children | 0 (0.0%) | 0 (0.0%) |
| Total | 11 (4.9%) | 8 (10.0%) |
Employment Characteristics in Carpendale
Employment by Class of Employer in Carpendale
Among the 602 employed individuals in Carpendale, private company employees (498 | 82.7%), not-for-profit organizations (32 | 5.3%), and self-employed (not incorporated) (26 | 4.3%) make up the most common classes of employment.
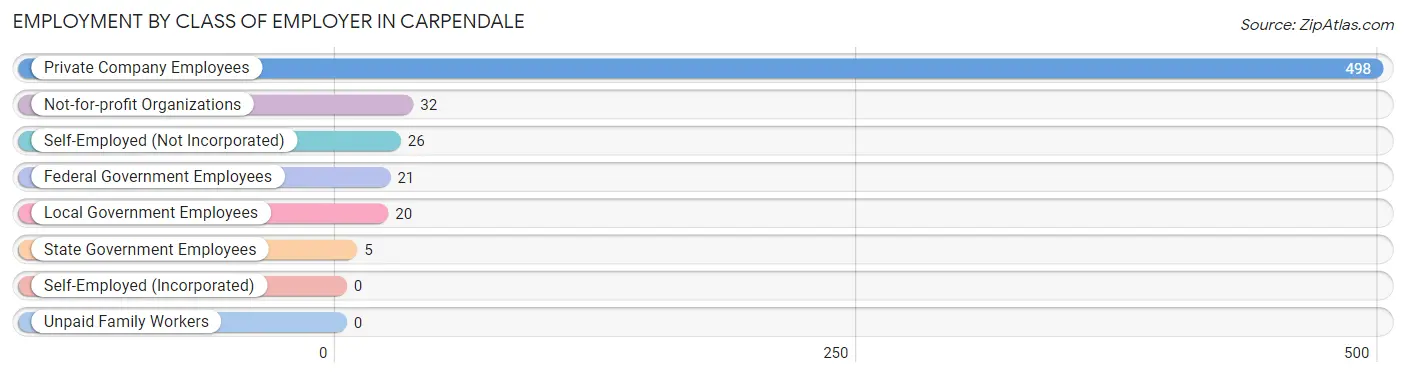
| Employer Class | # Employees | % Employees |
| Private Company Employees | 498 | 82.7% |
| Self-Employed (Incorporated) | 0 | 0.0% |
| Self-Employed (Not Incorporated) | 26 | 4.3% |
| Not-for-profit Organizations | 32 | 5.3% |
| Local Government Employees | 20 | 3.3% |
| State Government Employees | 5 | 0.8% |
| Federal Government Employees | 21 | 3.5% |
| Unpaid Family Workers | 0 | 0.0% |
| Total | 602 | 100.0% |
Employment Status by Age in Carpendale
According to the labor force statistics for Carpendale, out of the total population over 16 years of age (1,096), 60.3% or 661 individuals are in the labor force, with 8.9% or 59 of them unemployed. The age group with the highest labor force participation rate is 20 to 24 years, with 100.0% or 29 individuals in the labor force. Within the labor force, the 25 to 29 years age range has the highest percentage of unemployed individuals, with 37.2% or 48 of them being unemployed.
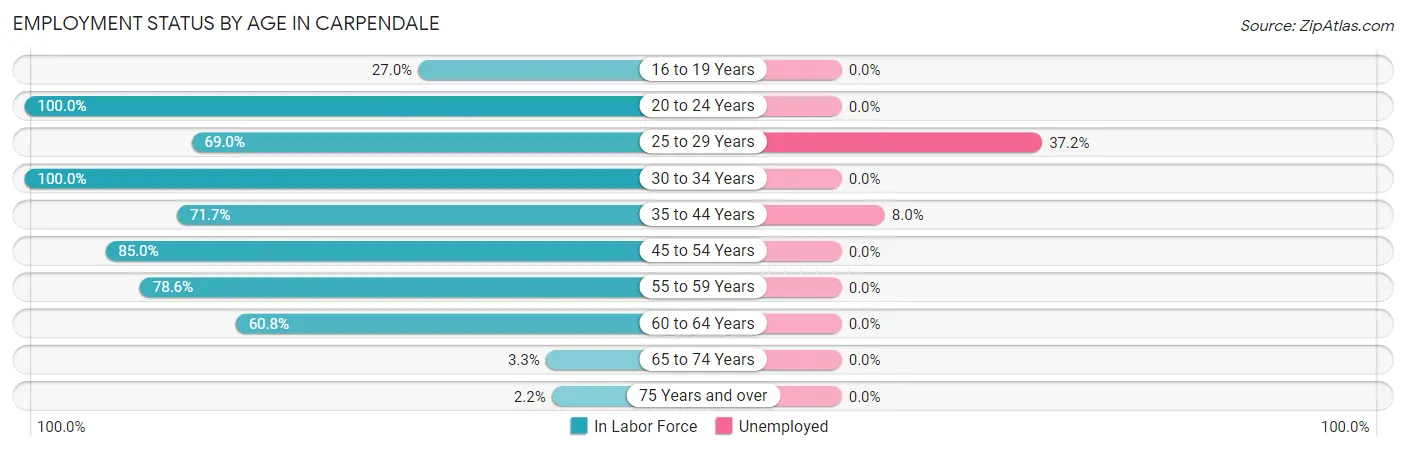
| Age Bracket | In Labor Force | Unemployed |
| 16 to 19 Years | 10 (27.0%) | 0 (0.0%) |
| 20 to 24 Years | 29 (100.0%) | 0 (0.0%) |
| 25 to 29 Years | 129 (69.0%) | 48 (37.2%) |
| 30 to 34 Years | 11 (100.0%) | 0 (0.0%) |
| 35 to 44 Years | 137 (71.7%) | 11 (8.0%) |
| 45 to 54 Years | 199 (85.0%) | 0 (0.0%) |
| 55 to 59 Years | 92 (78.6%) | 0 (0.0%) |
| 60 to 64 Years | 48 (60.8%) | 0 (0.0%) |
| 65 to 74 Years | 4 (3.3%) | 0 (0.0%) |
| 75 Years and over | 2 (2.2%) | 0 (0.0%) |
| Total | 661 (60.3%) | 59 (8.9%) |
Employment Status by Educational Attainment in Carpendale
According to labor force statistics for Carpendale, 75.2% of individuals (616) out of the total population between 25 and 64 years of age (819) are in the labor force, with 9.6% or 59 of them being unemployed. The group with the highest labor force participation rate are those with the educational attainment of bachelor's degree or higher, with 88.9% or 56 individuals in the labor force. Within the labor force, individuals with high school diploma education have the highest percentage of unemployment, with 16.7% or 55 of them being unemployed.
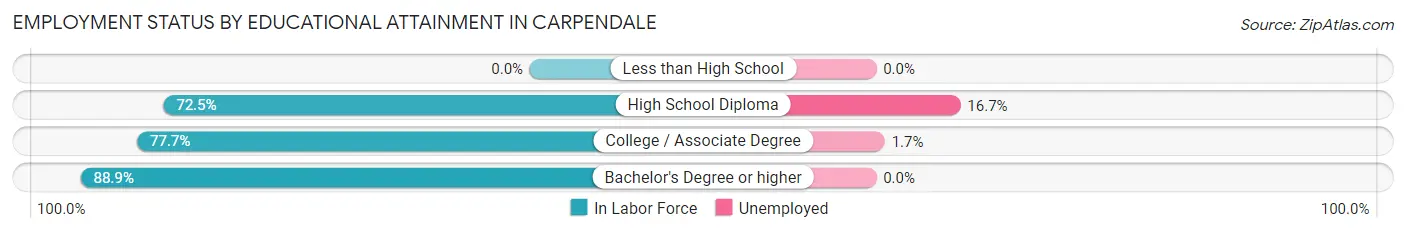
| Educational Attainment | In Labor Force | Unemployed |
| Less than High School | 0 (0.0%) | 0 (0.0%) |
| High School Diploma | 330 (72.5%) | 76 (16.7%) |
| College / Associate Degree | 230 (77.7%) | 5 (1.7%) |
| Bachelor's Degree or higher | 56 (88.9%) | 0 (0.0%) |
| Total | 616 (75.2%) | 79 (9.6%) |
Employment Occupations by Sex in Carpendale
Management, Business, Science and Arts Occupations
The most common Management, Business, Science and Arts occupations in Carpendale are Business & Financial (48 | 8.0%), Management (32 | 5.3%), Community & Social Service (20 | 3.3%), Health Diagnosing & Treating (19 | 3.2%), and Computers, Engineering & Science (16 | 2.7%).
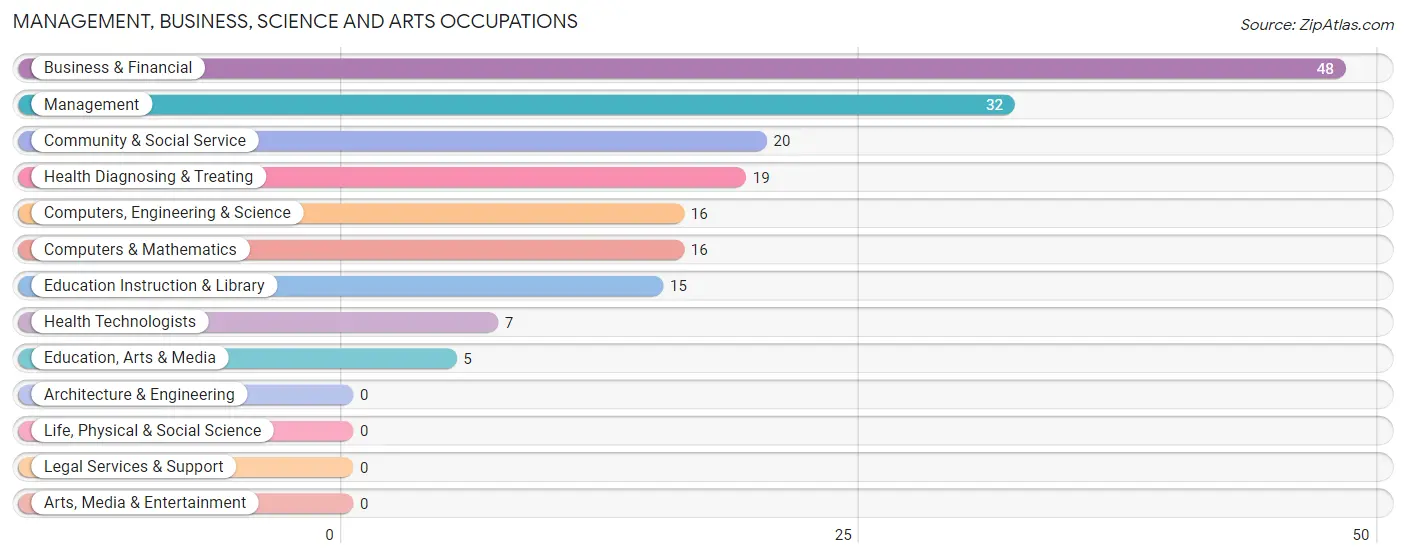
Management, Business, Science and Arts Occupations by Sex
Within the Management, Business, Science and Arts occupations in Carpendale, the most male-oriented occupations are Business & Financial (100.0%), Computers, Engineering & Science (100.0%), and Computers & Mathematics (100.0%), while the most female-oriented occupations are Community & Social Service (100.0%), Education, Arts & Media (100.0%), and Education Instruction & Library (100.0%).
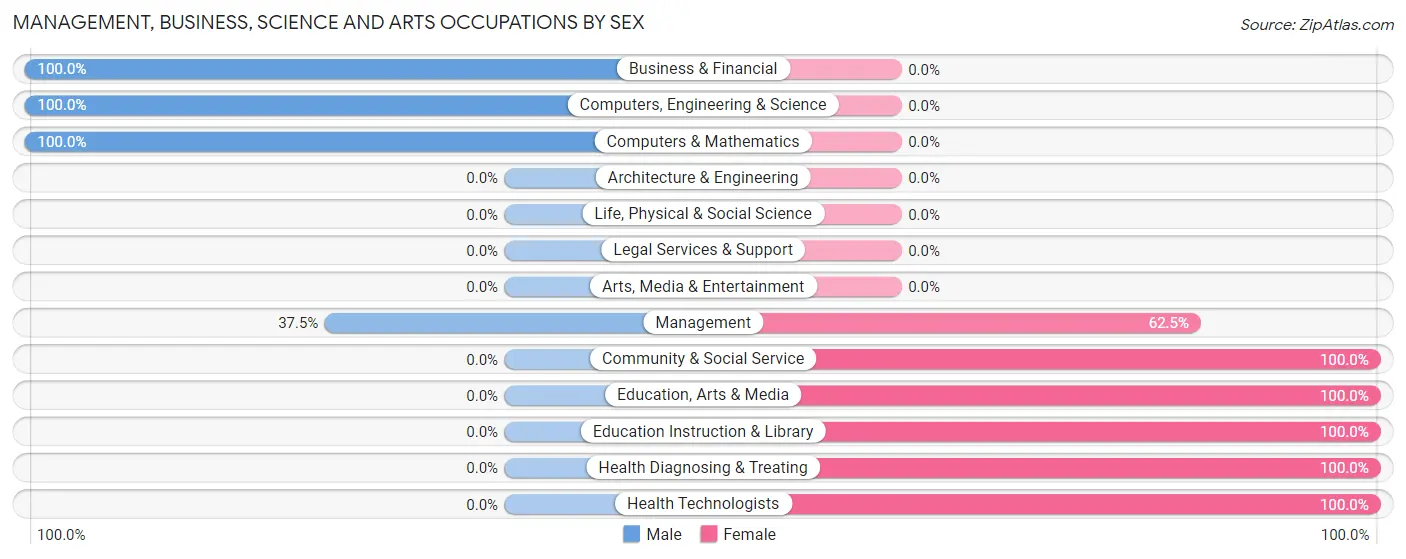
| Occupation | Male | Female |
| Management | 12 (37.5%) | 20 (62.5%) |
| Business & Financial | 48 (100.0%) | 0 (0.0%) |
| Computers, Engineering & Science | 16 (100.0%) | 0 (0.0%) |
| Computers & Mathematics | 16 (100.0%) | 0 (0.0%) |
| Architecture & Engineering | 0 (0.0%) | 0 (0.0%) |
| Life, Physical & Social Science | 0 (0.0%) | 0 (0.0%) |
| Community & Social Service | 0 (0.0%) | 20 (100.0%) |
| Education, Arts & Media | 0 (0.0%) | 5 (100.0%) |
| Legal Services & Support | 0 (0.0%) | 0 (0.0%) |
| Education Instruction & Library | 0 (0.0%) | 15 (100.0%) |
| Arts, Media & Entertainment | 0 (0.0%) | 0 (0.0%) |
| Health Diagnosing & Treating | 0 (0.0%) | 19 (100.0%) |
| Health Technologists | 0 (0.0%) | 7 (100.0%) |
| Total (Category) | 76 (56.3%) | 59 (43.7%) |
| Total (Overall) | 365 (60.6%) | 237 (39.4%) |
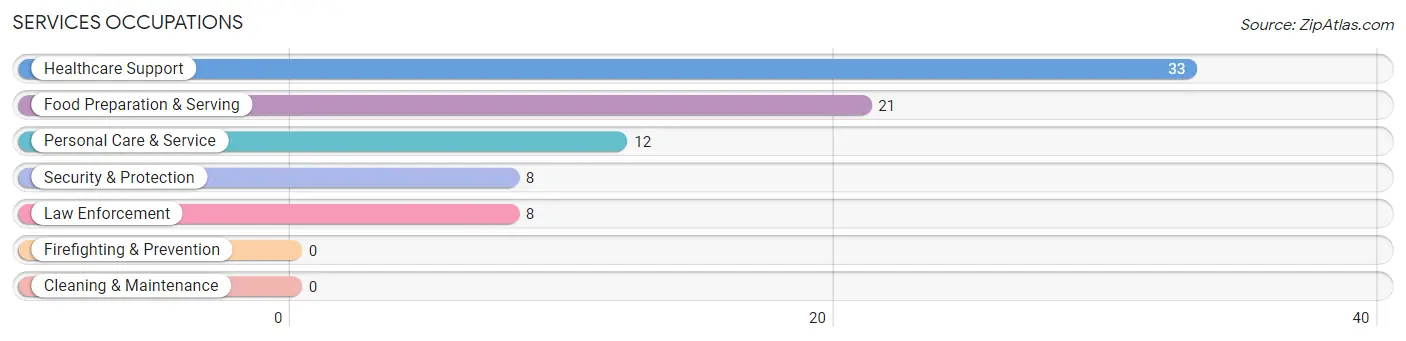
Services Occupations
The most common Services occupations in Carpendale are Healthcare Support (33 | 5.5%), Food Preparation & Serving (21 | 3.5%), Personal Care & Service (12 | 2.0%), Security & Protection (8 | 1.3%), and Law Enforcement (8 | 1.3%).
Services Occupations by Sex
Within the Services occupations in Carpendale, the most male-oriented occupations are Security & Protection (100.0%), Law Enforcement (100.0%), and Personal Care & Service (100.0%), while the most female-oriented occupations are Healthcare Support (100.0%), and Food Preparation & Serving (100.0%).
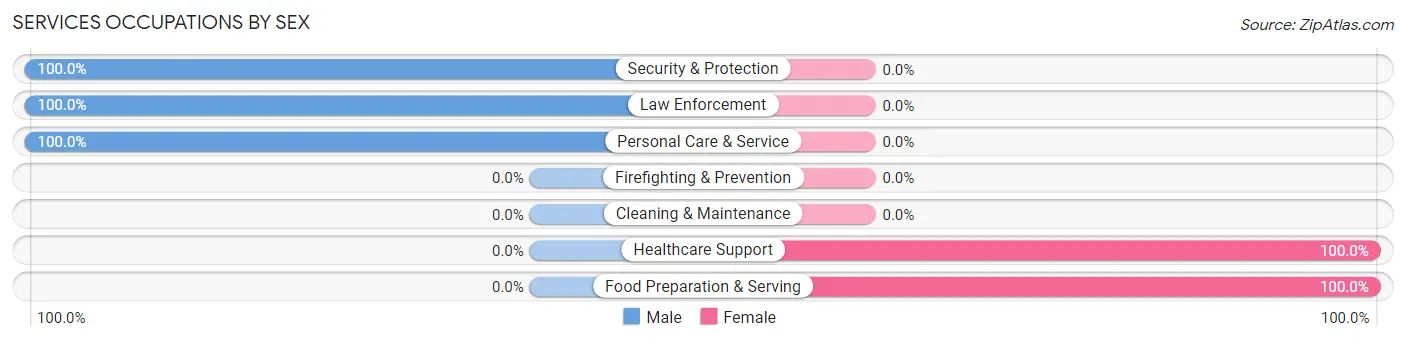
| Occupation | Male | Female |
| Healthcare Support | 0 (0.0%) | 33 (100.0%) |
| Security & Protection | 8 (100.0%) | 0 (0.0%) |
| Firefighting & Prevention | 0 (0.0%) | 0 (0.0%) |
| Law Enforcement | 8 (100.0%) | 0 (0.0%) |
| Food Preparation & Serving | 0 (0.0%) | 21 (100.0%) |
| Cleaning & Maintenance | 0 (0.0%) | 0 (0.0%) |
| Personal Care & Service | 12 (100.0%) | 0 (0.0%) |
| Total (Category) | 20 (27.0%) | 54 (73.0%) |
| Total (Overall) | 365 (60.6%) | 237 (39.4%) |
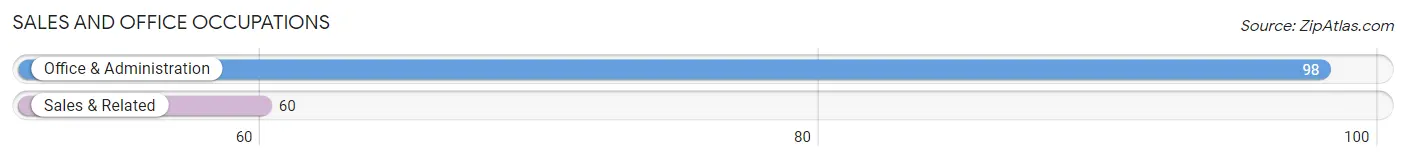
Sales and Office Occupations
The most common Sales and Office occupations in Carpendale are Office & Administration (98 | 16.3%), and Sales & Related (60 | 10.0%).
Sales and Office Occupations by Sex
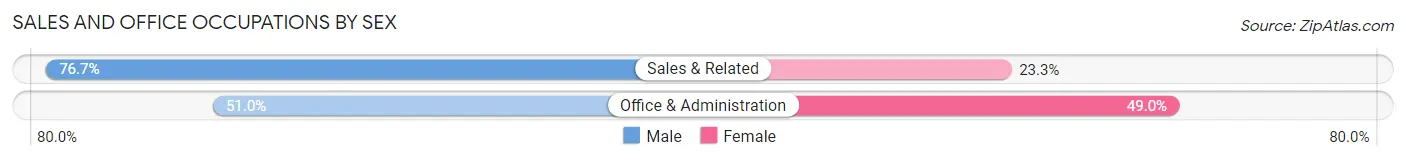
| Occupation | Male | Female |
| Sales & Related | 46 (76.7%) | 14 (23.3%) |
| Office & Administration | 50 (51.0%) | 48 (49.0%) |
| Total (Category) | 96 (60.8%) | 62 (39.2%) |
| Total (Overall) | 365 (60.6%) | 237 (39.4%) |
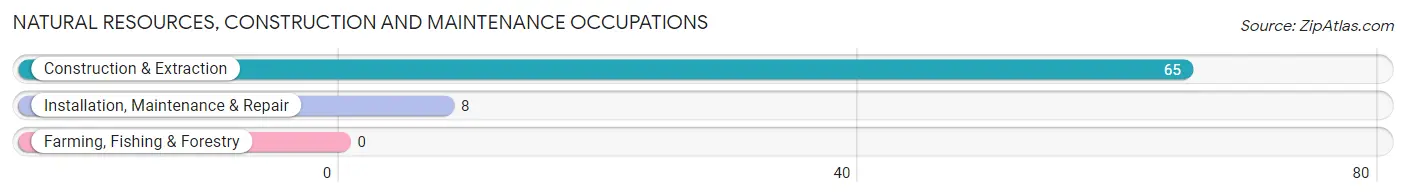
Natural Resources, Construction and Maintenance Occupations
The most common Natural Resources, Construction and Maintenance occupations in Carpendale are Construction & Extraction (65 | 10.8%), and Installation, Maintenance & Repair (8 | 1.3%).
Natural Resources, Construction and Maintenance Occupations by Sex
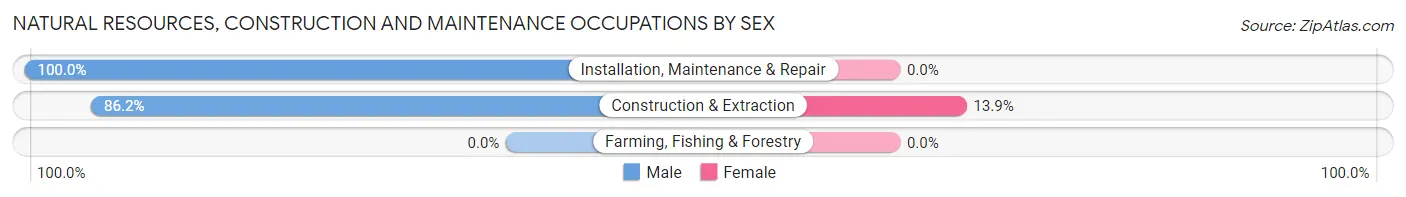
| Occupation | Male | Female |
| Farming, Fishing & Forestry | 0 (0.0%) | 0 (0.0%) |
| Construction & Extraction | 56 (86.2%) | 9 (13.9%) |
| Installation, Maintenance & Repair | 8 (100.0%) | 0 (0.0%) |
| Total (Category) | 64 (87.7%) | 9 (12.3%) |
| Total (Overall) | 365 (60.6%) | 237 (39.4%) |
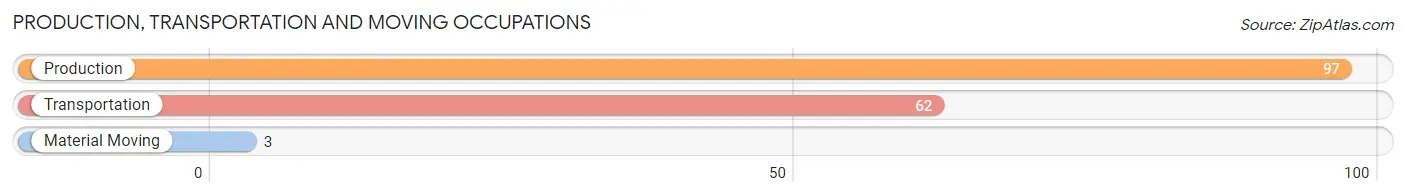
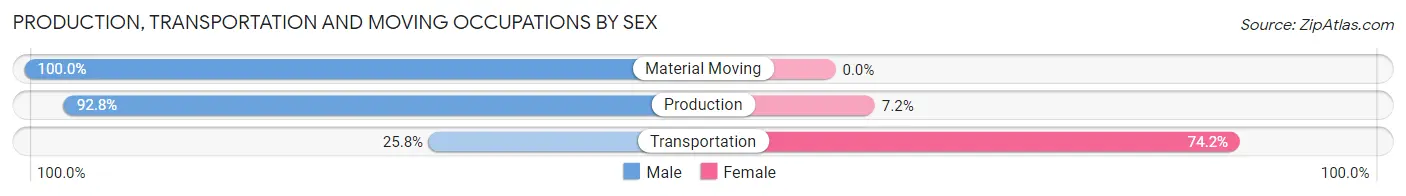
Production, Transportation and Moving Occupations
The most common Production, Transportation and Moving occupations in Carpendale are Production (97 | 16.1%), Transportation (62 | 10.3%), and Material Moving (3 | 0.5%).
Production, Transportation and Moving Occupations by Sex
| Occupation | Male | Female |
| Production | 90 (92.8%) | 7 (7.2%) |
| Transportation | 16 (25.8%) | 46 (74.2%) |
| Material Moving | 3 (100.0%) | 0 (0.0%) |
| Total (Category) | 109 (67.3%) | 53 (32.7%) |
| Total (Overall) | 365 (60.6%) | 237 (39.4%) |
Employment Industries by Sex in Carpendale
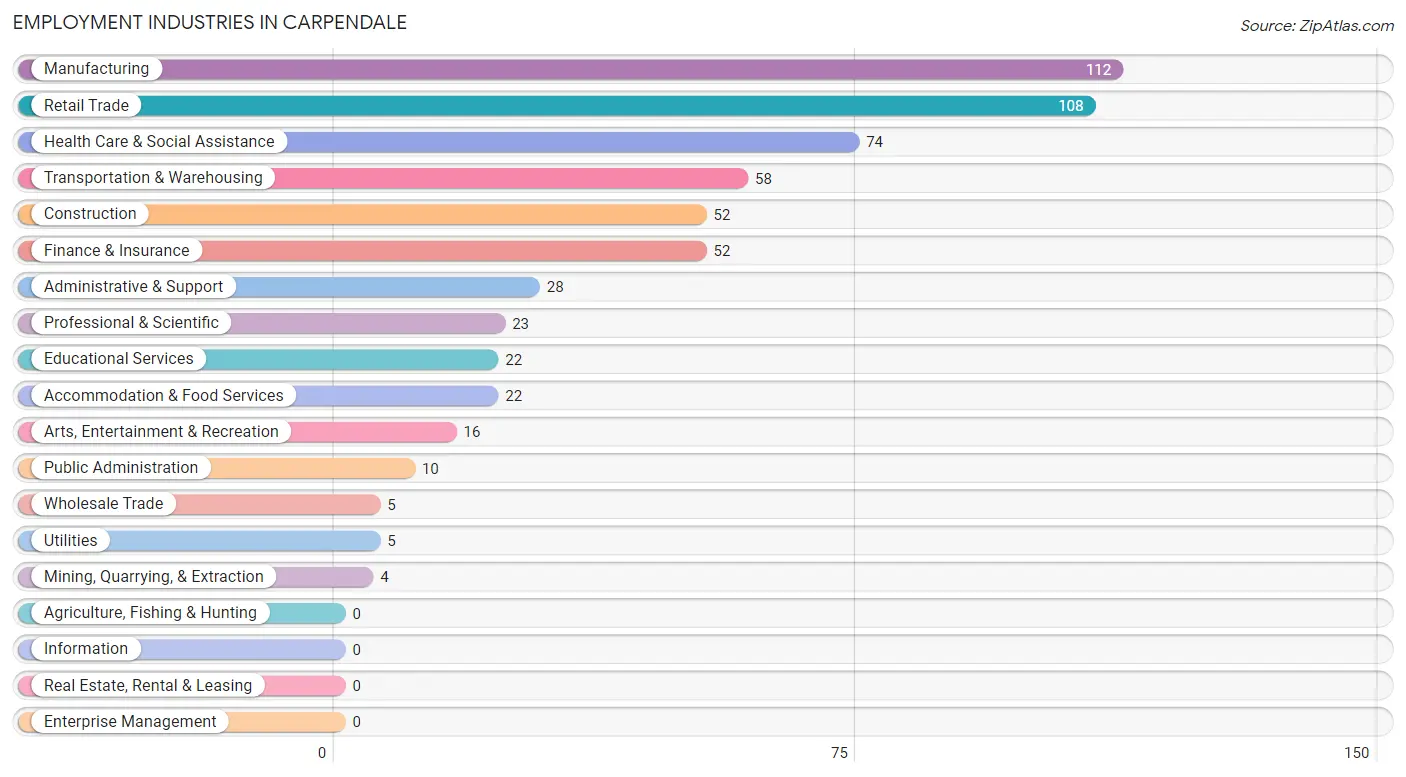
Employment Industries in Carpendale
The major employment industries in Carpendale include Manufacturing (112 | 18.6%), Retail Trade (108 | 17.9%), Health Care & Social Assistance (74 | 12.3%), Transportation & Warehousing (58 | 9.6%), and Construction (52 | 8.6%).
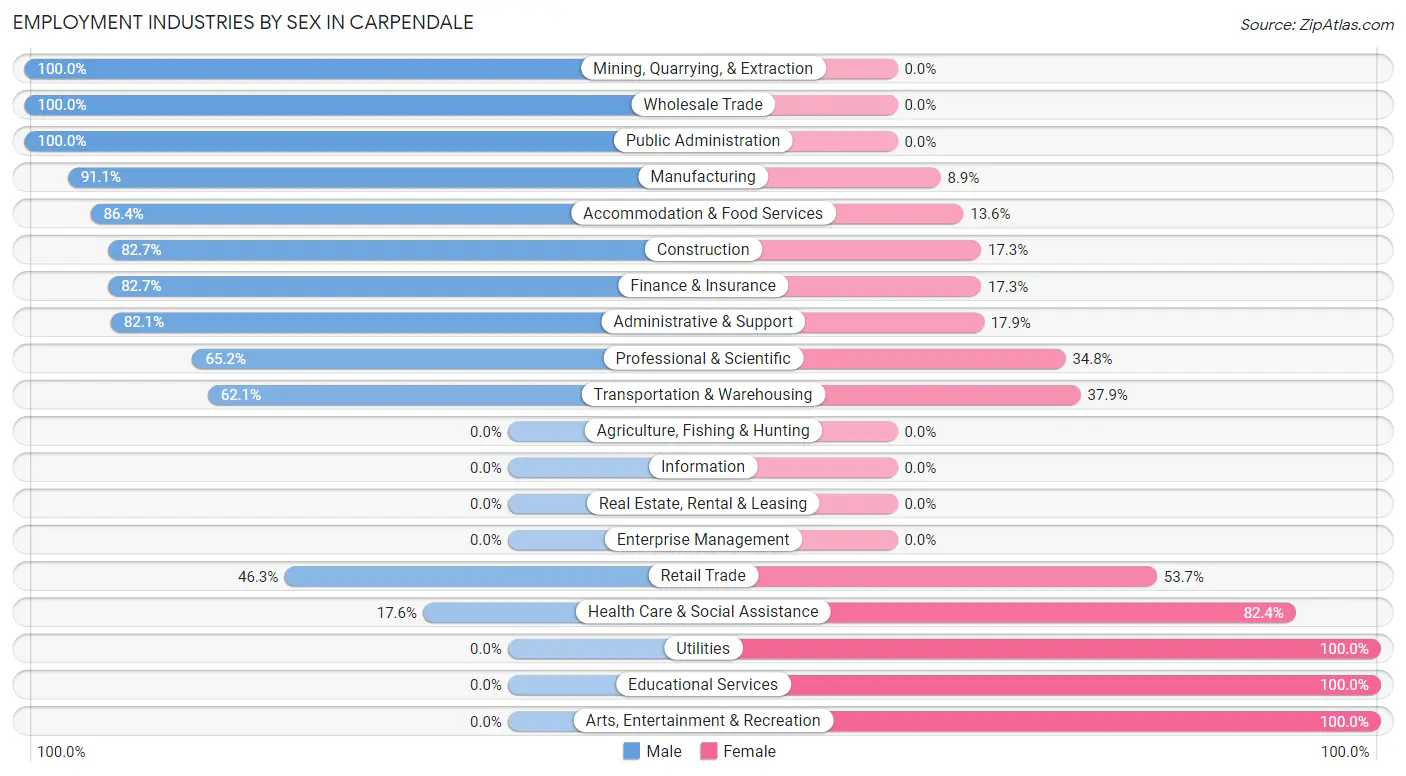
Employment Industries by Sex in Carpendale
The Carpendale industries that see more men than women are Mining, Quarrying, & Extraction (100.0%), Wholesale Trade (100.0%), and Public Administration (100.0%), whereas the industries that tend to have a higher number of women are Utilities (100.0%), Educational Services (100.0%), and Arts, Entertainment & Recreation (100.0%).
| Industry | Male | Female |
| Agriculture, Fishing & Hunting | 0 (0.0%) | 0 (0.0%) |
| Mining, Quarrying, & Extraction | 4 (100.0%) | 0 (0.0%) |
| Construction | 43 (82.7%) | 9 (17.3%) |
| Manufacturing | 102 (91.1%) | 10 (8.9%) |
| Wholesale Trade | 5 (100.0%) | 0 (0.0%) |
| Retail Trade | 50 (46.3%) | 58 (53.7%) |
| Transportation & Warehousing | 36 (62.1%) | 22 (37.9%) |
| Utilities | 0 (0.0%) | 5 (100.0%) |
| Information | 0 (0.0%) | 0 (0.0%) |
| Finance & Insurance | 43 (82.7%) | 9 (17.3%) |
| Real Estate, Rental & Leasing | 0 (0.0%) | 0 (0.0%) |
| Professional & Scientific | 15 (65.2%) | 8 (34.8%) |
| Enterprise Management | 0 (0.0%) | 0 (0.0%) |
| Administrative & Support | 23 (82.1%) | 5 (17.9%) |
| Educational Services | 0 (0.0%) | 22 (100.0%) |
| Health Care & Social Assistance | 13 (17.6%) | 61 (82.4%) |
| Arts, Entertainment & Recreation | 0 (0.0%) | 16 (100.0%) |
| Accommodation & Food Services | 19 (86.4%) | 3 (13.6%) |
| Public Administration | 10 (100.0%) | 0 (0.0%) |
| Total | 365 (60.6%) | 237 (39.4%) |
Education in Carpendale
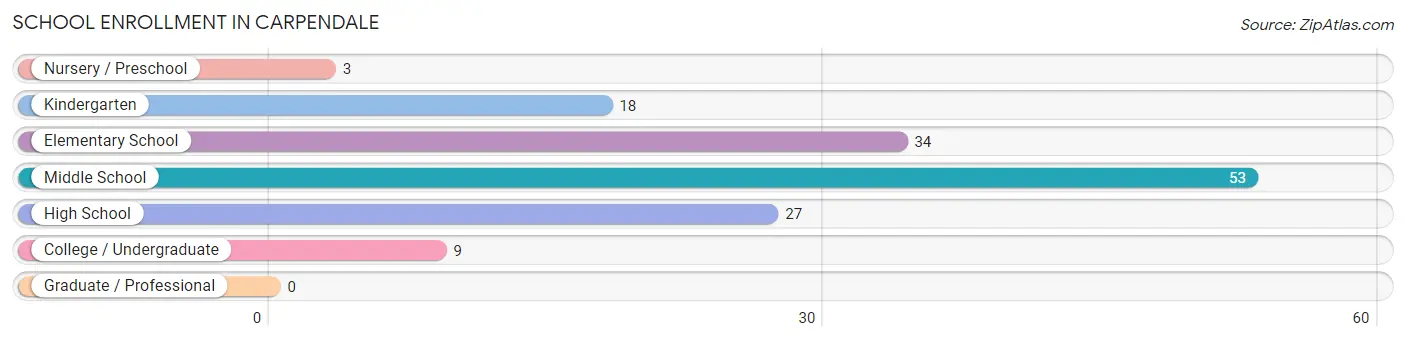
School Enrollment in Carpendale
The most common levels of schooling among the 144 students in Carpendale are middle school (53 | 36.8%), elementary school (34 | 23.6%), and high school (27 | 18.8%).
| School Level | # Students | % Students |
| Nursery / Preschool | 3 | 2.1% |
| Kindergarten | 18 | 12.5% |
| Elementary School | 34 | 23.6% |
| Middle School | 53 | 36.8% |
| High School | 27 | 18.8% |
| College / Undergraduate | 9 | 6.2% |
| Graduate / Professional | 0 | 0.0% |
| Total | 144 | 100.0% |
School Enrollment by Age by Funding Source in Carpendale
Out of a total of 144 students who are enrolled in schools in Carpendale, 6 (4.2%) attend a private institution, while the remaining 138 (95.8%) are enrolled in public schools. The age group of 10 to 14 year olds has the highest likelihood of being enrolled in private schools, with 6 (9.4% in the age bracket) enrolled. Conversely, the age group of 5 to 9 year old has the lowest likelihood of being enrolled in a private school, with 44 (100.0% in the age bracket) attending a public institution.
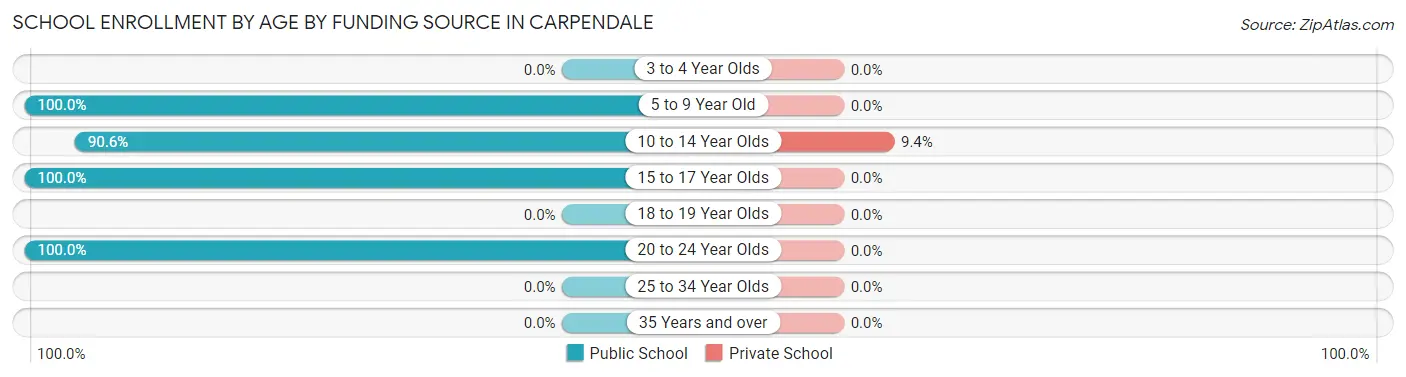
| Age Bracket | Public School | Private School |
| 3 to 4 Year Olds | 0 (0.0%) | 0 (0.0%) |
| 5 to 9 Year Old | 44 (100.0%) | 0 (0.0%) |
| 10 to 14 Year Olds | 58 (90.6%) | 6 (9.4%) |
| 15 to 17 Year Olds | 27 (100.0%) | 0 (0.0%) |
| 18 to 19 Year Olds | 0 (0.0%) | 0 (0.0%) |
| 20 to 24 Year Olds | 9 (100.0%) | 0 (0.0%) |
| 25 to 34 Year Olds | 0 (0.0%) | 0 (0.0%) |
| 35 Years and over | 0 (0.0%) | 0 (0.0%) |
| Total | 138 (95.8%) | 6 (4.2%) |
Educational Attainment by Field of Study in Carpendale
Education (27 | 34.6%), literature & languages (13 | 16.7%), social sciences (9 | 11.5%), business (7 | 9.0%), and computers & mathematics (5 | 6.4%) are the most common fields of study among 78 individuals in Carpendale who have obtained a bachelor's degree or higher.
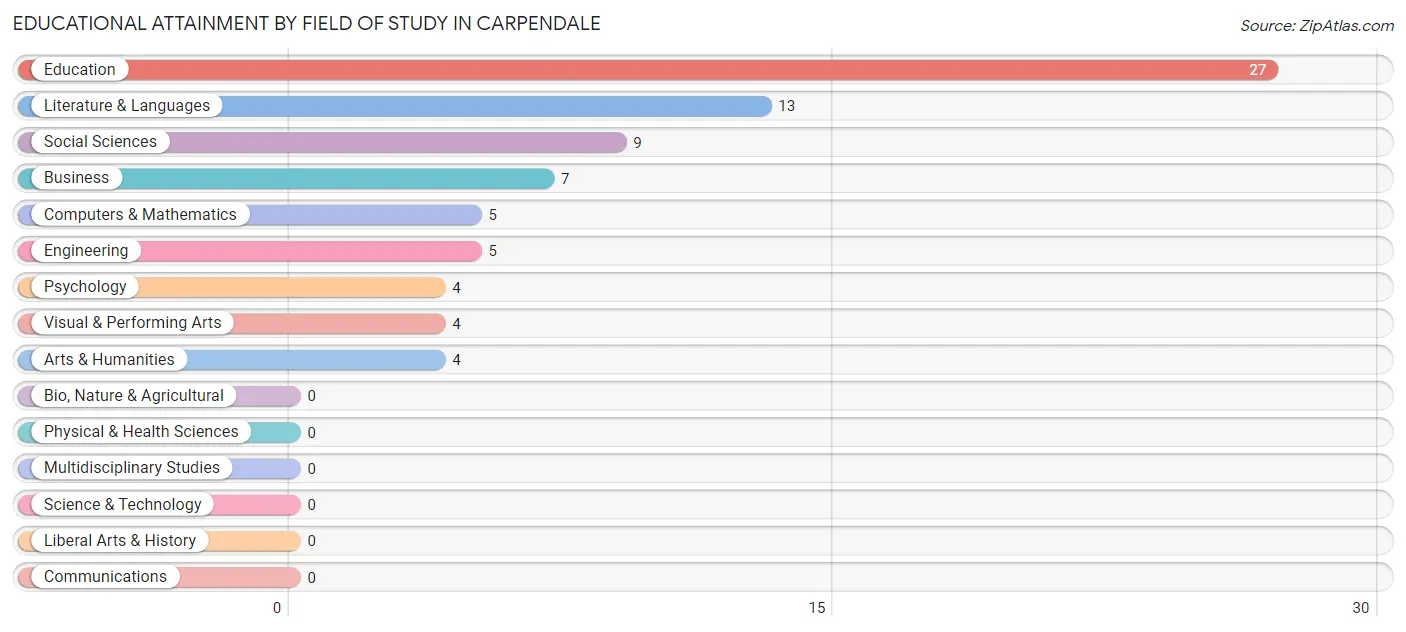
| Field of Study | # Graduates | % Graduates |
| Computers & Mathematics | 5 | 6.4% |
| Bio, Nature & Agricultural | 0 | 0.0% |
| Physical & Health Sciences | 0 | 0.0% |
| Psychology | 4 | 5.1% |
| Social Sciences | 9 | 11.5% |
| Engineering | 5 | 6.4% |
| Multidisciplinary Studies | 0 | 0.0% |
| Science & Technology | 0 | 0.0% |
| Business | 7 | 9.0% |
| Education | 27 | 34.6% |
| Literature & Languages | 13 | 16.7% |
| Liberal Arts & History | 0 | 0.0% |
| Visual & Performing Arts | 4 | 5.1% |
| Communications | 0 | 0.0% |
| Arts & Humanities | 4 | 5.1% |
| Total | 78 | 100.0% |
Transportation & Commute in Carpendale
Vehicle Availability by Sex in Carpendale
The most prevalent vehicle ownership categories in Carpendale are males with 3 vehicles (194, accounting for 53.1%) and females with 3 vehicles (74, making up 81.9%).
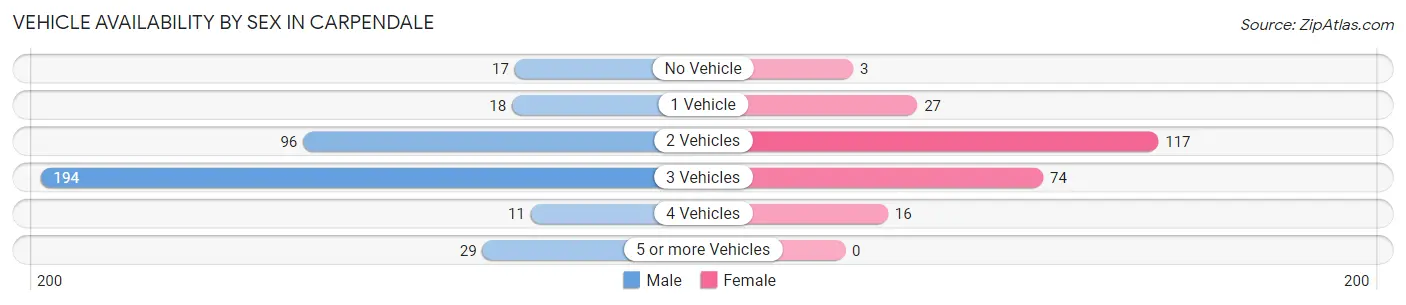
| Vehicles Available | Male | Female |
| No Vehicle | 17 (4.7%) | 3 (1.3%) |
| 1 Vehicle | 18 (4.9%) | 27 (11.4%) |
| 2 Vehicles | 96 (26.3%) | 117 (49.4%) |
| 3 Vehicles | 194 (53.1%) | 74 (31.2%) |
| 4 Vehicles | 11 (3.0%) | 16 (6.8%) |
| 5 or more Vehicles | 29 (8.0%) | 0 (0.0%) |
| Total | 365 (100.0%) | 237 (100.0%) |
Commute Time in Carpendale
The most frequently occuring commute durations in Carpendale are 15 to 19 minutes (148 commuters, 27.2%), 10 to 14 minutes (123 commuters, 22.6%), and 20 to 24 minutes (122 commuters, 22.4%).
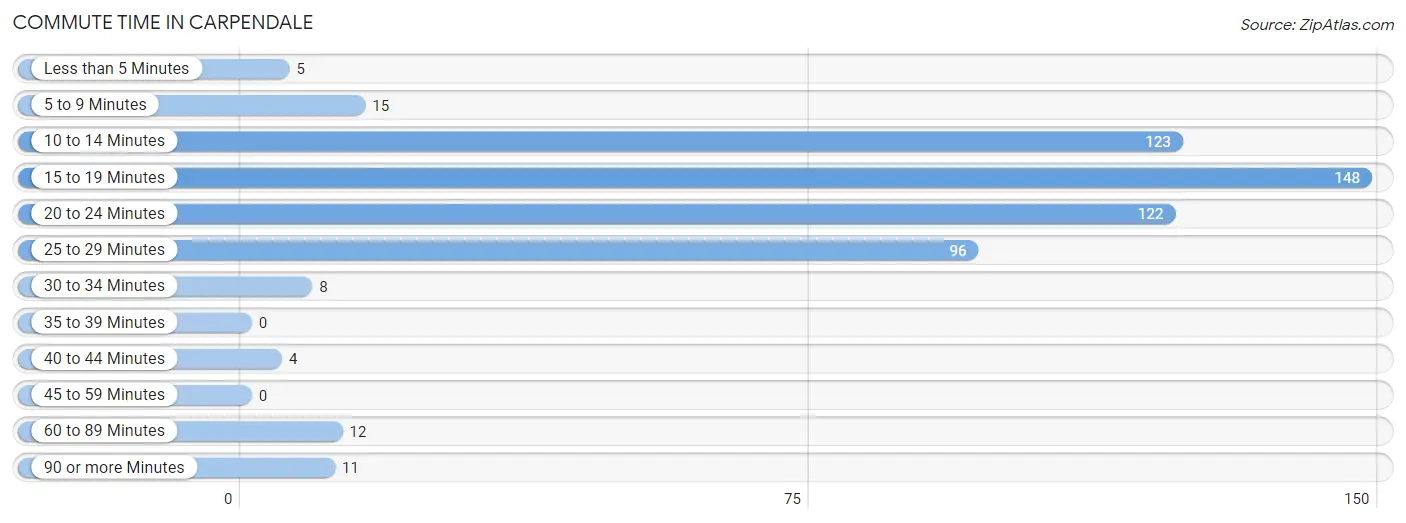
| Commute Time | # Commuters | % Commuters |
| Less than 5 Minutes | 5 | 0.9% |
| 5 to 9 Minutes | 15 | 2.8% |
| 10 to 14 Minutes | 123 | 22.6% |
| 15 to 19 Minutes | 148 | 27.2% |
| 20 to 24 Minutes | 122 | 22.4% |
| 25 to 29 Minutes | 96 | 17.6% |
| 30 to 34 Minutes | 8 | 1.5% |
| 35 to 39 Minutes | 0 | 0.0% |
| 40 to 44 Minutes | 4 | 0.7% |
| 45 to 59 Minutes | 0 | 0.0% |
| 60 to 89 Minutes | 12 | 2.2% |
| 90 or more Minutes | 11 | 2.0% |
Commute Time by Sex in Carpendale
The most common commute times in Carpendale are 20 to 24 minutes (91 commuters, 29.0%) for males and 10 to 14 minutes (81 commuters, 35.2%) for females.
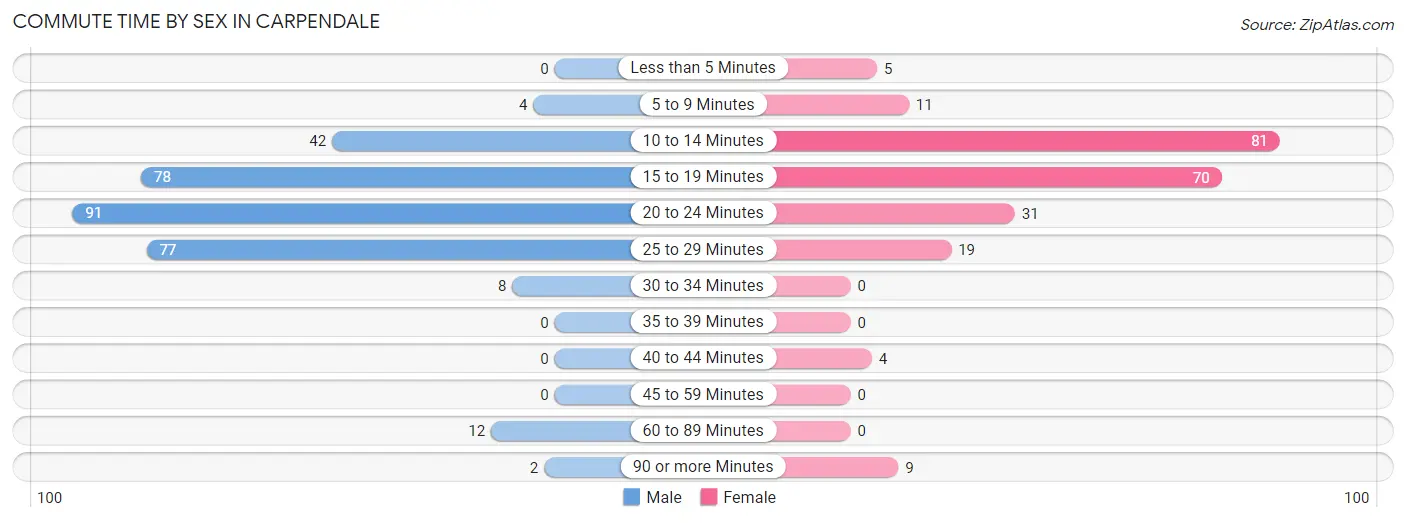
| Commute Time | Male | Female |
| Less than 5 Minutes | 0 (0.0%) | 5 (2.2%) |
| 5 to 9 Minutes | 4 (1.3%) | 11 (4.8%) |
| 10 to 14 Minutes | 42 (13.4%) | 81 (35.2%) |
| 15 to 19 Minutes | 78 (24.8%) | 70 (30.4%) |
| 20 to 24 Minutes | 91 (29.0%) | 31 (13.5%) |
| 25 to 29 Minutes | 77 (24.5%) | 19 (8.3%) |
| 30 to 34 Minutes | 8 (2.5%) | 0 (0.0%) |
| 35 to 39 Minutes | 0 (0.0%) | 0 (0.0%) |
| 40 to 44 Minutes | 0 (0.0%) | 4 (1.7%) |
| 45 to 59 Minutes | 0 (0.0%) | 0 (0.0%) |
| 60 to 89 Minutes | 12 (3.8%) | 0 (0.0%) |
| 90 or more Minutes | 2 (0.6%) | 9 (3.9%) |
Time of Departure to Work by Sex in Carpendale
The most frequent times of departure to work in Carpendale are 12:00 PM to 3:59 PM (71, 22.6%) for males and 4:00 PM to 11:59 PM (42, 18.3%) for females.
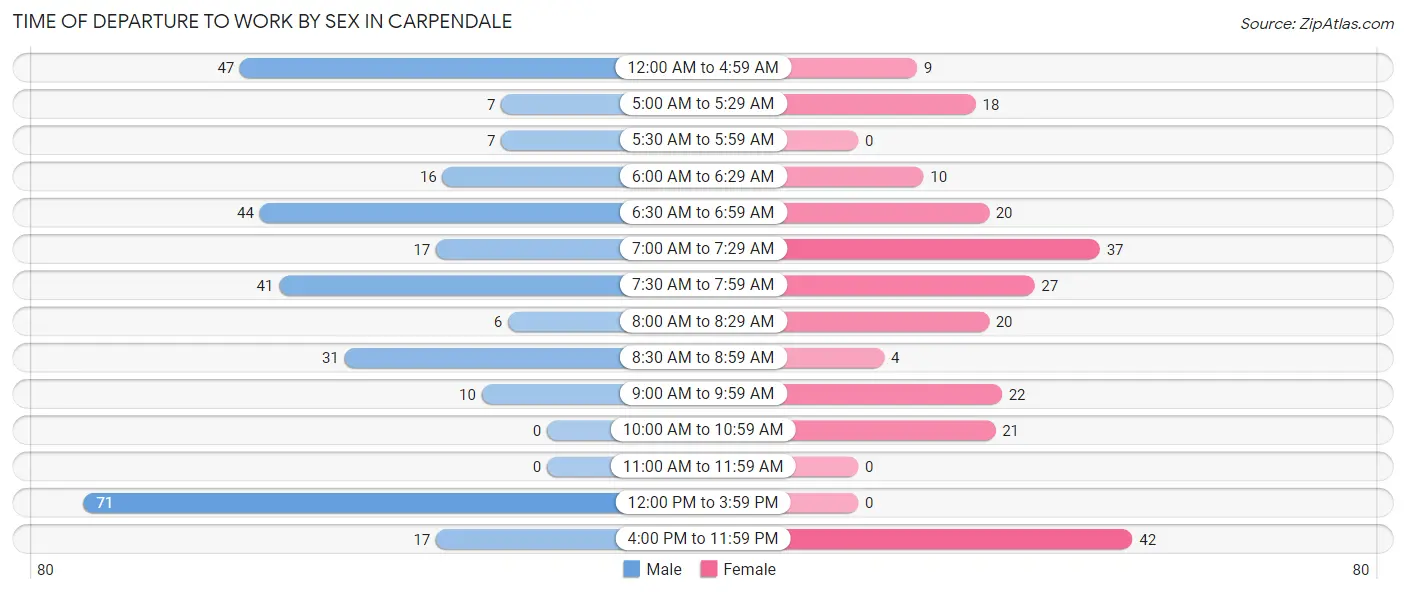
| Time of Departure | Male | Female |
| 12:00 AM to 4:59 AM | 47 (15.0%) | 9 (3.9%) |
| 5:00 AM to 5:29 AM | 7 (2.2%) | 18 (7.8%) |
| 5:30 AM to 5:59 AM | 7 (2.2%) | 0 (0.0%) |
| 6:00 AM to 6:29 AM | 16 (5.1%) | 10 (4.3%) |
| 6:30 AM to 6:59 AM | 44 (14.0%) | 20 (8.7%) |
| 7:00 AM to 7:29 AM | 17 (5.4%) | 37 (16.1%) |
| 7:30 AM to 7:59 AM | 41 (13.1%) | 27 (11.7%) |
| 8:00 AM to 8:29 AM | 6 (1.9%) | 20 (8.7%) |
| 8:30 AM to 8:59 AM | 31 (9.9%) | 4 (1.7%) |
| 9:00 AM to 9:59 AM | 10 (3.2%) | 22 (9.6%) |
| 10:00 AM to 10:59 AM | 0 (0.0%) | 21 (9.1%) |
| 11:00 AM to 11:59 AM | 0 (0.0%) | 0 (0.0%) |
| 12:00 PM to 3:59 PM | 71 (22.6%) | 0 (0.0%) |
| 4:00 PM to 11:59 PM | 17 (5.4%) | 42 (18.3%) |
| Total | 314 (100.0%) | 230 (100.0%) |
Housing Occupancy in Carpendale
Occupancy by Ownership in Carpendale
Of the total 468 dwellings in Carpendale, owner-occupied units account for 406 (86.8%), while renter-occupied units make up 62 (13.3%).
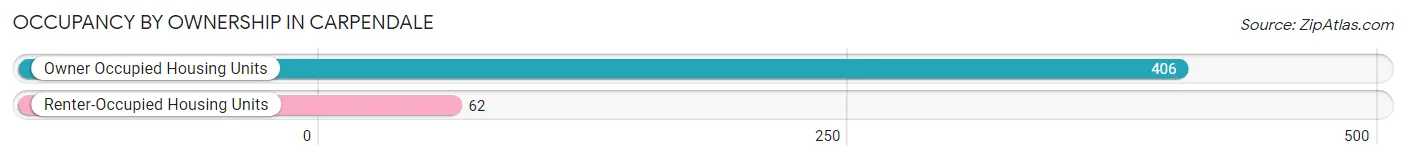
| Occupancy | # Housing Units | % Housing Units |
| Owner Occupied Housing Units | 406 | 86.8% |
| Renter-Occupied Housing Units | 62 | 13.3% |
| Total Occupied Housing Units | 468 | 100.0% |
Occupancy by Household Size in Carpendale
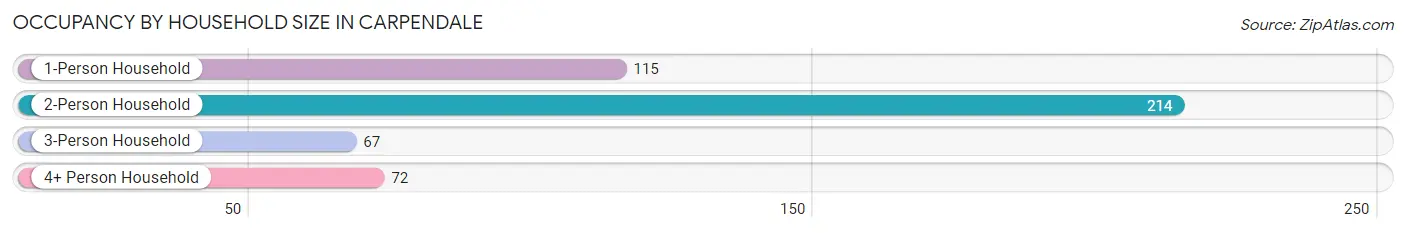
| Household Size | # Housing Units | % Housing Units |
| 1-Person Household | 115 | 24.6% |
| 2-Person Household | 214 | 45.7% |
| 3-Person Household | 67 | 14.3% |
| 4+ Person Household | 72 | 15.4% |
| Total Housing Units | 468 | 100.0% |
Occupancy by Ownership by Household Size in Carpendale
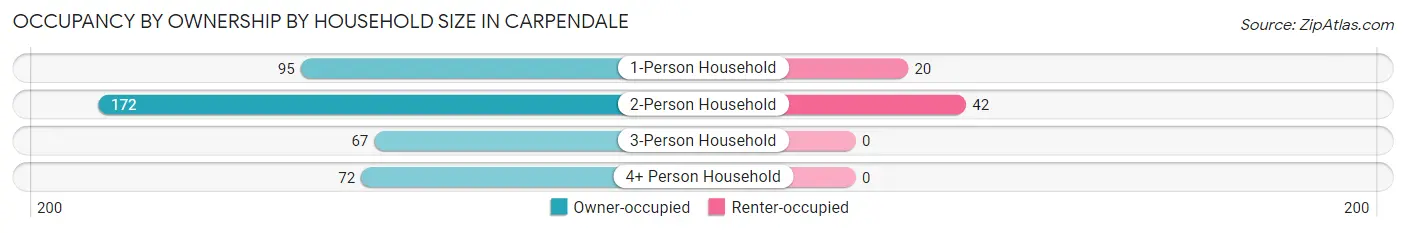
| Household Size | Owner-occupied | Renter-occupied |
| 1-Person Household | 95 (82.6%) | 20 (17.4%) |
| 2-Person Household | 172 (80.4%) | 42 (19.6%) |
| 3-Person Household | 67 (100.0%) | 0 (0.0%) |
| 4+ Person Household | 72 (100.0%) | 0 (0.0%) |
| Total Housing Units | 406 (86.8%) | 62 (13.3%) |
Occupancy by Educational Attainment in Carpendale
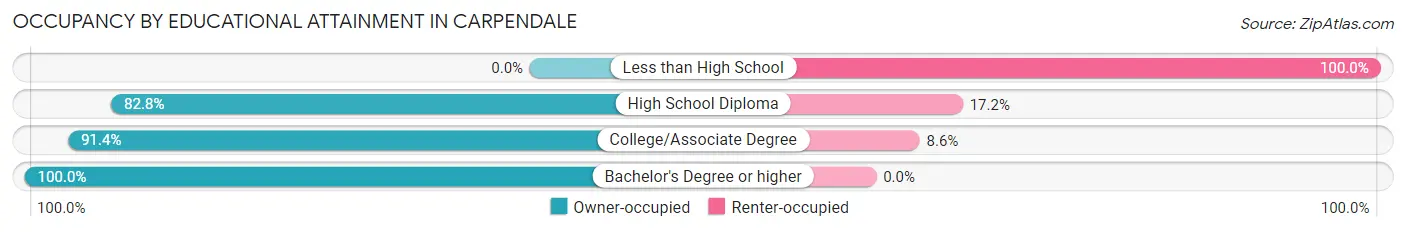
| Household Size | Owner-occupied | Renter-occupied |
| Less than High School | 0 (0.0%) | 3 (100.0%) |
| High School Diploma | 222 (82.8%) | 46 (17.2%) |
| College/Associate Degree | 138 (91.4%) | 13 (8.6%) |
| Bachelor's Degree or higher | 46 (100.0%) | 0 (0.0%) |
Occupancy by Age of Householder in Carpendale
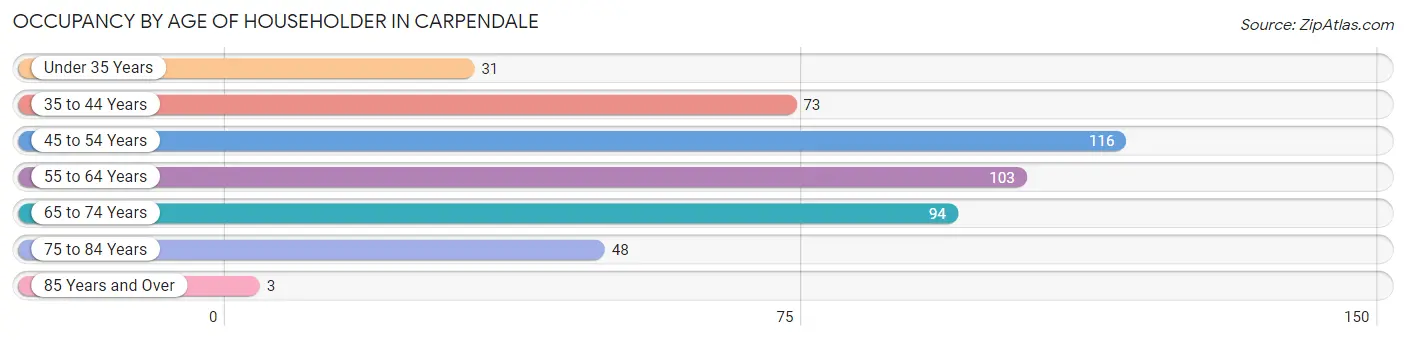
| Age Bracket | # Households | % Households |
| Under 35 Years | 31 | 6.6% |
| 35 to 44 Years | 73 | 15.6% |
| 45 to 54 Years | 116 | 24.8% |
| 55 to 64 Years | 103 | 22.0% |
| 65 to 74 Years | 94 | 20.1% |
| 75 to 84 Years | 48 | 10.3% |
| 85 Years and Over | 3 | 0.6% |
| Total | 468 | 100.0% |
Housing Finances in Carpendale
Median Income by Occupancy in Carpendale
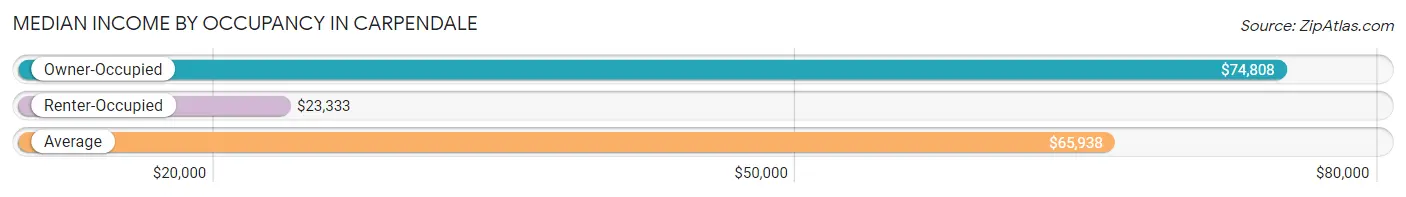
| Occupancy Type | # Households | Median Income |
| Owner-Occupied | 406 (86.8%) | $74,808 |
| Renter-Occupied | 62 (13.3%) | $23,333 |
| Average | 468 (100.0%) | $65,938 |
Occupancy by Householder Income Bracket in Carpendale
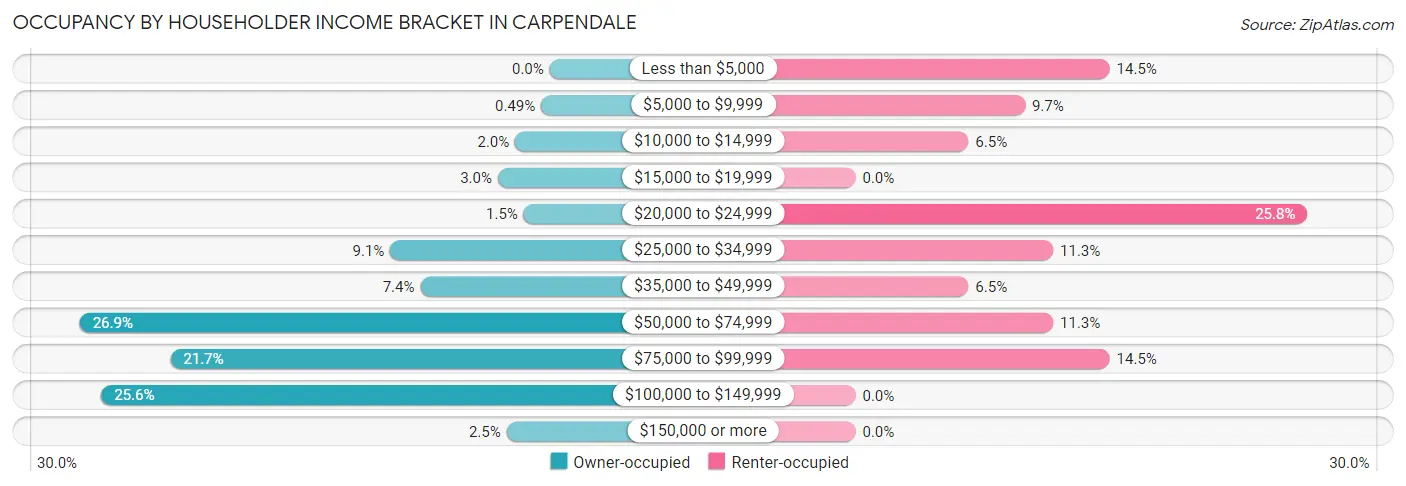
| Income Bracket | Owner-occupied | Renter-occupied |
| Less than $5,000 | 0 (0.0%) | 9 (14.5%) |
| $5,000 to $9,999 | 2 (0.5%) | 6 (9.7%) |
| $10,000 to $14,999 | 8 (2.0%) | 4 (6.5%) |
| $15,000 to $19,999 | 12 (3.0%) | 0 (0.0%) |
| $20,000 to $24,999 | 6 (1.5%) | 16 (25.8%) |
| $25,000 to $34,999 | 37 (9.1%) | 7 (11.3%) |
| $35,000 to $49,999 | 30 (7.4%) | 4 (6.5%) |
| $50,000 to $74,999 | 109 (26.9%) | 7 (11.3%) |
| $75,000 to $99,999 | 88 (21.7%) | 9 (14.5%) |
| $100,000 to $149,999 | 104 (25.6%) | 0 (0.0%) |
| $150,000 or more | 10 (2.5%) | 0 (0.0%) |
| Total | 406 (100.0%) | 62 (100.0%) |
Monthly Housing Cost Tiers in Carpendale
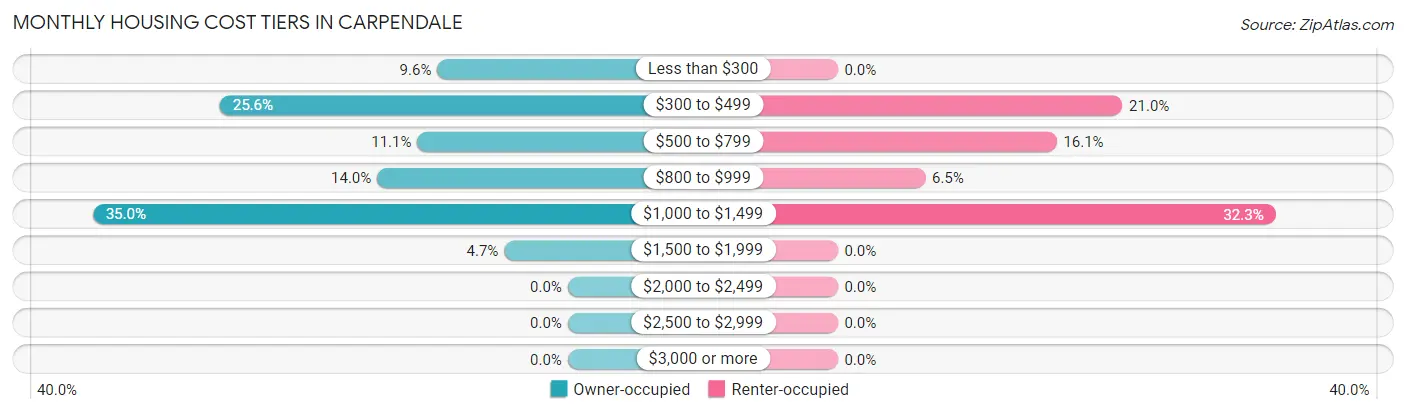
| Monthly Cost | Owner-occupied | Renter-occupied |
| Less than $300 | 39 (9.6%) | 0 (0.0%) |
| $300 to $499 | 104 (25.6%) | 13 (21.0%) |
| $500 to $799 | 45 (11.1%) | 10 (16.1%) |
| $800 to $999 | 57 (14.0%) | 4 (6.5%) |
| $1,000 to $1,499 | 142 (35.0%) | 20 (32.3%) |
| $1,500 to $1,999 | 19 (4.7%) | 0 (0.0%) |
| $2,000 to $2,499 | 0 (0.0%) | 0 (0.0%) |
| $2,500 to $2,999 | 0 (0.0%) | 0 (0.0%) |
| $3,000 or more | 0 (0.0%) | 0 (0.0%) |
| Total | 406 (100.0%) | 62 (100.0%) |
Physical Housing Characteristics in Carpendale
Housing Structures in Carpendale
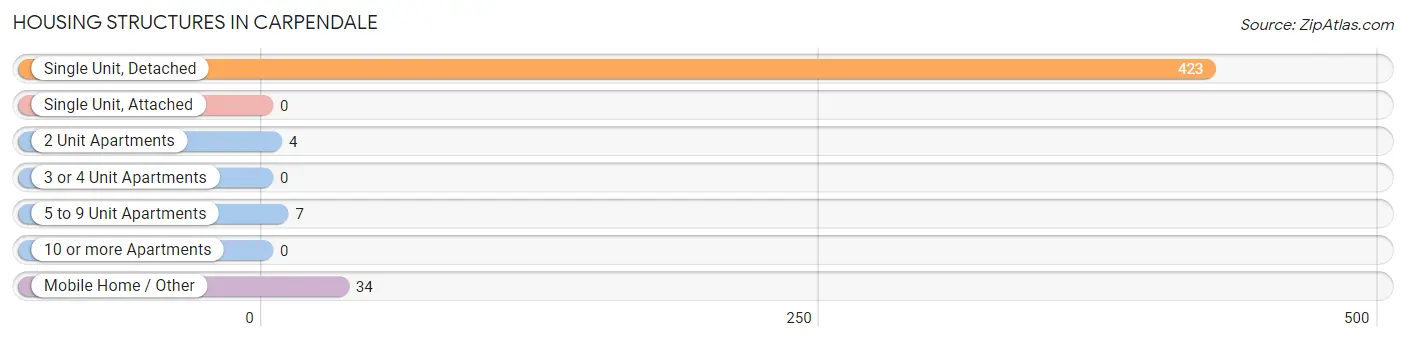
| Structure Type | # Housing Units | % Housing Units |
| Single Unit, Detached | 423 | 90.4% |
| Single Unit, Attached | 0 | 0.0% |
| 2 Unit Apartments | 4 | 0.9% |
| 3 or 4 Unit Apartments | 0 | 0.0% |
| 5 to 9 Unit Apartments | 7 | 1.5% |
| 10 or more Apartments | 0 | 0.0% |
| Mobile Home / Other | 34 | 7.3% |
| Total | 468 | 100.0% |
Housing Structures by Occupancy in Carpendale
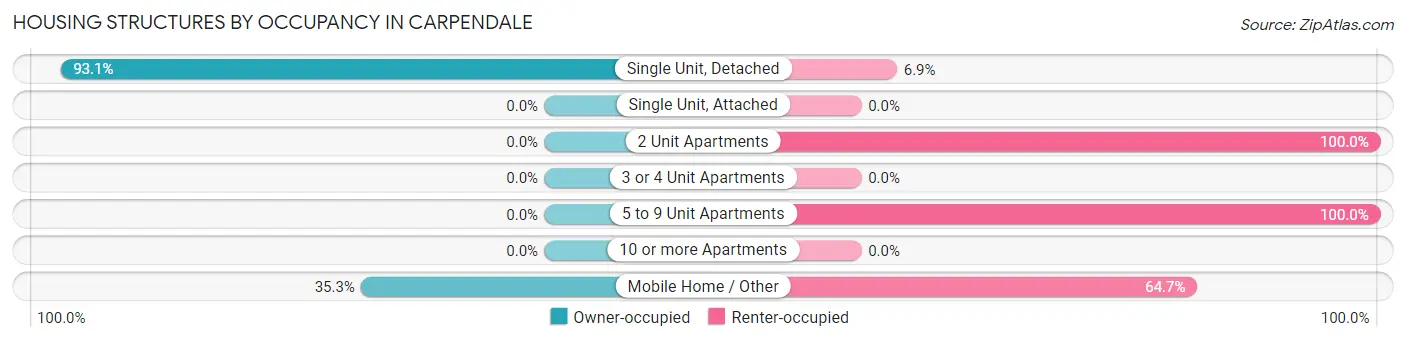
| Structure Type | Owner-occupied | Renter-occupied |
| Single Unit, Detached | 394 (93.1%) | 29 (6.9%) |
| Single Unit, Attached | 0 (0.0%) | 0 (0.0%) |
| 2 Unit Apartments | 0 (0.0%) | 4 (100.0%) |
| 3 or 4 Unit Apartments | 0 (0.0%) | 0 (0.0%) |
| 5 to 9 Unit Apartments | 0 (0.0%) | 7 (100.0%) |
| 10 or more Apartments | 0 (0.0%) | 0 (0.0%) |
| Mobile Home / Other | 12 (35.3%) | 22 (64.7%) |
| Total | 406 (86.8%) | 62 (13.3%) |
Housing Structures by Number of Rooms in Carpendale
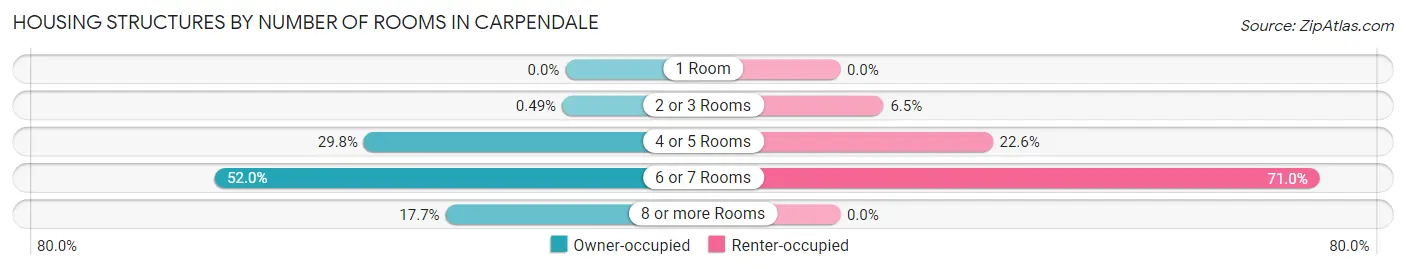
| Number of Rooms | Owner-occupied | Renter-occupied |
| 1 Room | 0 (0.0%) | 0 (0.0%) |
| 2 or 3 Rooms | 2 (0.5%) | 4 (6.5%) |
| 4 or 5 Rooms | 121 (29.8%) | 14 (22.6%) |
| 6 or 7 Rooms | 211 (52.0%) | 44 (71.0%) |
| 8 or more Rooms | 72 (17.7%) | 0 (0.0%) |
| Total | 406 (100.0%) | 62 (100.0%) |
Housing Structure by Heating Type in Carpendale
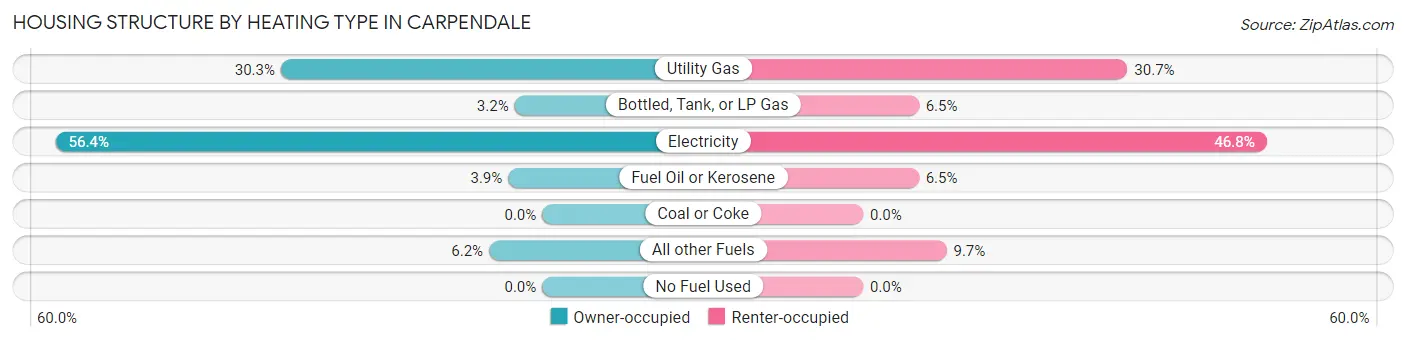
| Heating Type | Owner-occupied | Renter-occupied |
| Utility Gas | 123 (30.3%) | 19 (30.6%) |
| Bottled, Tank, or LP Gas | 13 (3.2%) | 4 (6.5%) |
| Electricity | 229 (56.4%) | 29 (46.8%) |
| Fuel Oil or Kerosene | 16 (3.9%) | 4 (6.5%) |
| Coal or Coke | 0 (0.0%) | 0 (0.0%) |
| All other Fuels | 25 (6.2%) | 6 (9.7%) |
| No Fuel Used | 0 (0.0%) | 0 (0.0%) |
| Total | 406 (100.0%) | 62 (100.0%) |
Household Vehicle Usage in Carpendale
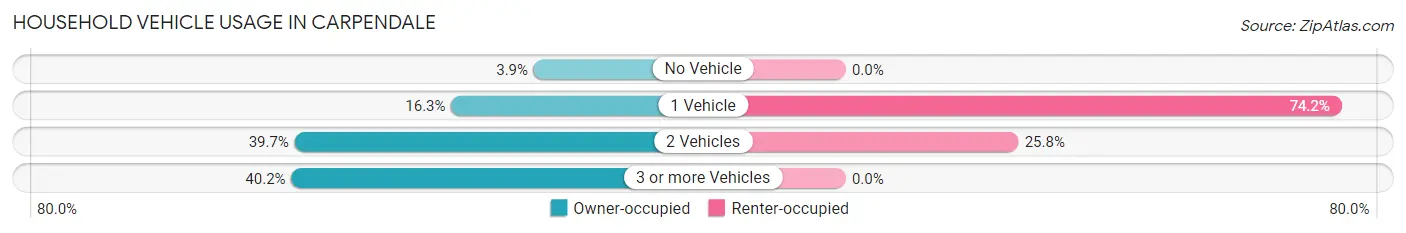
| Vehicles per Household | Owner-occupied | Renter-occupied |
| No Vehicle | 16 (3.9%) | 0 (0.0%) |
| 1 Vehicle | 66 (16.3%) | 46 (74.2%) |
| 2 Vehicles | 161 (39.7%) | 16 (25.8%) |
| 3 or more Vehicles | 163 (40.2%) | 0 (0.0%) |
| Total | 406 (100.0%) | 62 (100.0%) |
Real Estate & Mortgages in Carpendale
Real Estate and Mortgage Overview in Carpendale
| Characteristic | Without Mortgage | With Mortgage |
| Housing Units | 141 | 265 |
| Median Property Value | $121,700 | $171,900 |
| Median Household Income | $55,545 | $8 |
| Monthly Housing Costs | $360 | $0 |
| Real Estate Taxes | $508 | $0 |
Property Value by Mortgage Status in Carpendale
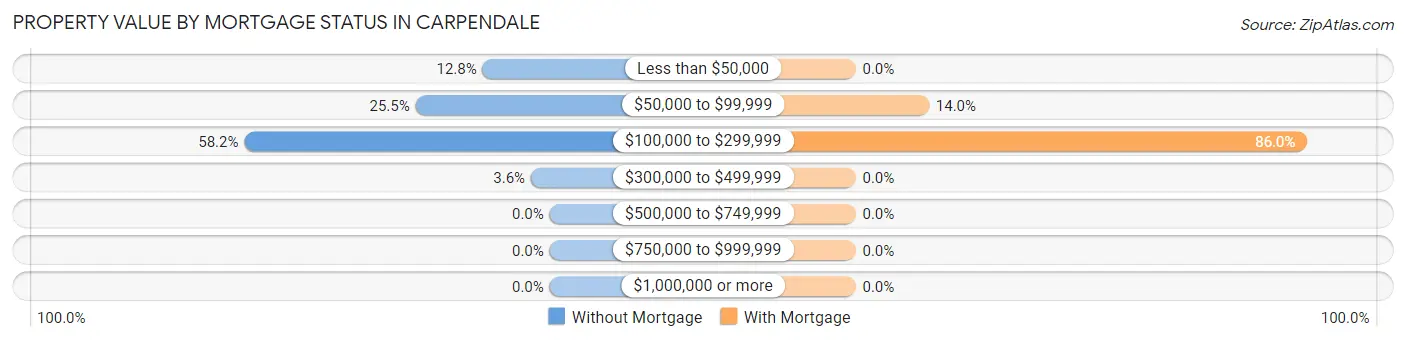
| Property Value | Without Mortgage | With Mortgage |
| Less than $50,000 | 18 (12.8%) | 0 (0.0%) |
| $50,000 to $99,999 | 36 (25.5%) | 37 (14.0%) |
| $100,000 to $299,999 | 82 (58.2%) | 228 (86.0%) |
| $300,000 to $499,999 | 5 (3.5%) | 0 (0.0%) |
| $500,000 to $749,999 | 0 (0.0%) | 0 (0.0%) |
| $750,000 to $999,999 | 0 (0.0%) | 0 (0.0%) |
| $1,000,000 or more | 0 (0.0%) | 0 (0.0%) |
| Total | 141 (100.0%) | 265 (100.0%) |
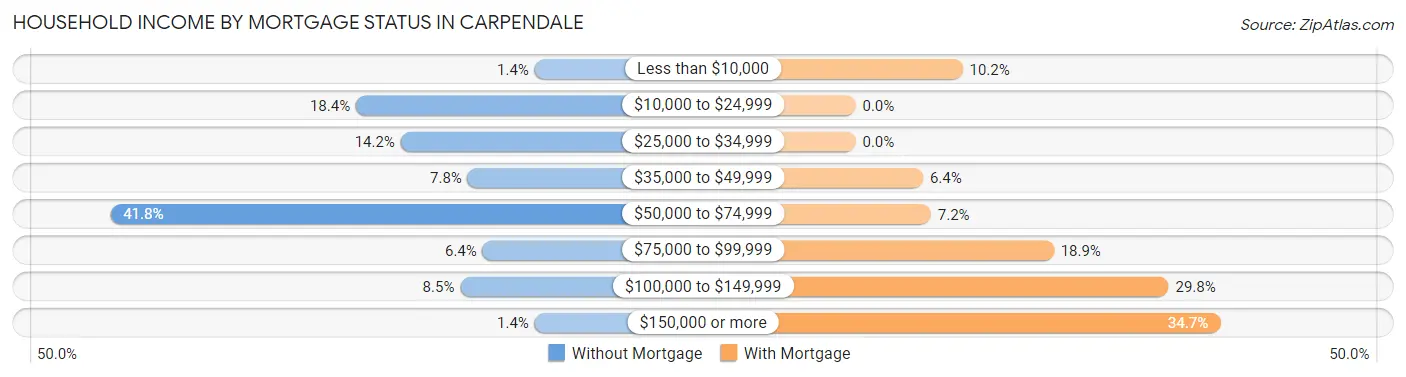
Household Income by Mortgage Status in Carpendale
| Household Income | Without Mortgage | With Mortgage |
| Less than $10,000 | 2 (1.4%) | 27 (10.2%) |
| $10,000 to $24,999 | 26 (18.4%) | 0 (0.0%) |
| $25,000 to $34,999 | 20 (14.2%) | 0 (0.0%) |
| $35,000 to $49,999 | 11 (7.8%) | 17 (6.4%) |
| $50,000 to $74,999 | 59 (41.8%) | 19 (7.2%) |
| $75,000 to $99,999 | 9 (6.4%) | 50 (18.9%) |
| $100,000 to $149,999 | 12 (8.5%) | 79 (29.8%) |
| $150,000 or more | 2 (1.4%) | 92 (34.7%) |
| Total | 141 (100.0%) | 265 (100.0%) |
Property Value to Household Income Ratio in Carpendale
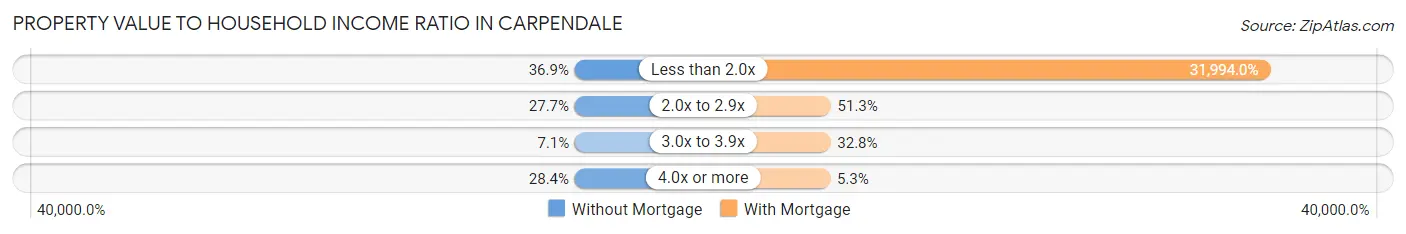
| Value-to-Income Ratio | Without Mortgage | With Mortgage |
| Less than 2.0x | 52 (36.9%) | 84,784 (31,994.0%) |
| 2.0x to 2.9x | 39 (27.7%) | 136 (51.3%) |
| 3.0x to 3.9x | 10 (7.1%) | 87 (32.8%) |
| 4.0x or more | 40 (28.4%) | 14 (5.3%) |
| Total | 141 (100.0%) | 265 (100.0%) |
Real Estate Taxes by Mortgage Status in Carpendale
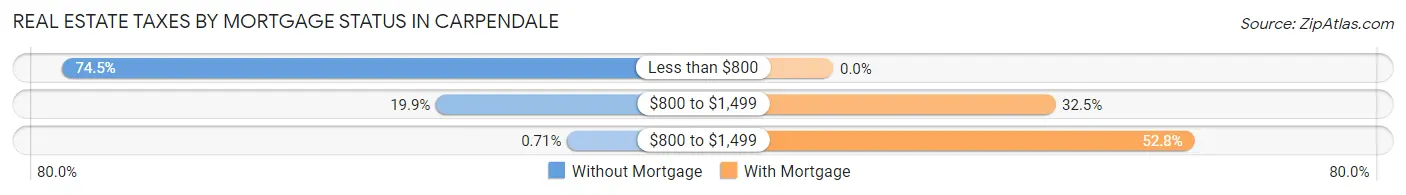
| Property Taxes | Without Mortgage | With Mortgage |
| Less than $800 | 105 (74.5%) | 0 (0.0%) |
| $800 to $1,499 | 28 (19.9%) | 86 (32.5%) |
| $800 to $1,499 | 1 (0.7%) | 140 (52.8%) |
| Total | 141 (100.0%) | 265 (100.0%) |
Health & Disability in Carpendale
Health Insurance Coverage by Age in Carpendale
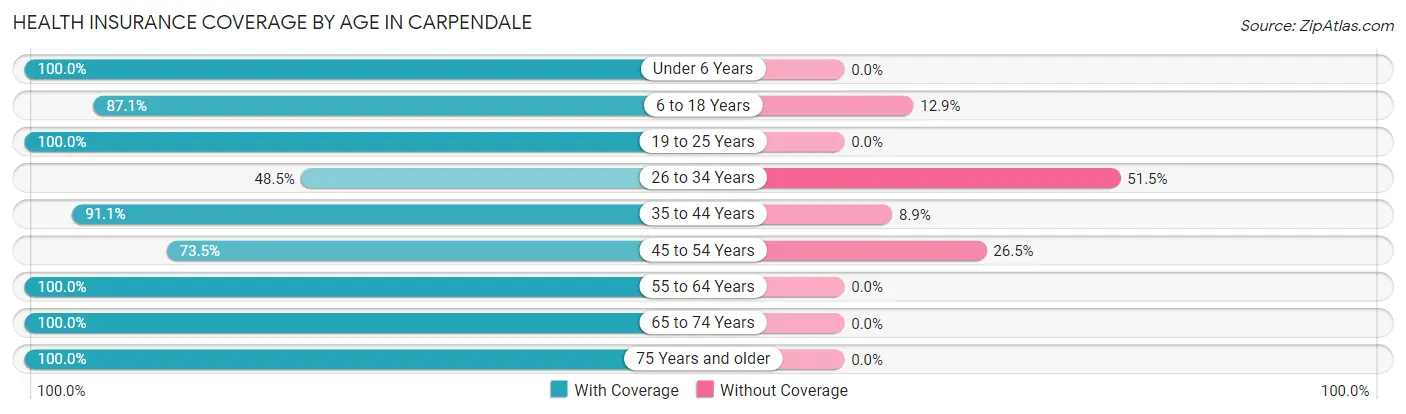
| Age Bracket | With Coverage | Without Coverage |
| Under 6 Years | 55 (100.0%) | 0 (0.0%) |
| 6 to 18 Years | 115 (87.1%) | 17 (12.9%) |
| 19 to 25 Years | 68 (100.0%) | 0 (0.0%) |
| 26 to 34 Years | 82 (48.5%) | 87 (51.5%) |
| 35 to 44 Years | 174 (91.1%) | 17 (8.9%) |
| 45 to 54 Years | 172 (73.5%) | 62 (26.5%) |
| 55 to 64 Years | 196 (100.0%) | 0 (0.0%) |
| 65 to 74 Years | 122 (100.0%) | 0 (0.0%) |
| 75 Years and older | 89 (100.0%) | 0 (0.0%) |
| Total | 1,073 (85.4%) | 183 (14.6%) |
Health Insurance Coverage by Citizenship Status in Carpendale
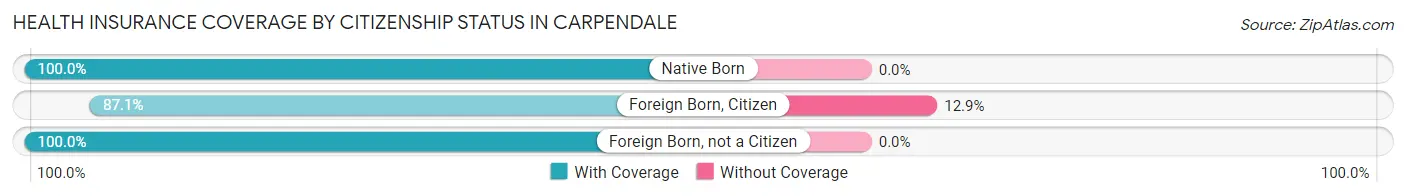
| Citizenship Status | With Coverage | Without Coverage |
| Native Born | 55 (100.0%) | 0 (0.0%) |
| Foreign Born, Citizen | 115 (87.1%) | 17 (12.9%) |
| Foreign Born, not a Citizen | 68 (100.0%) | 0 (0.0%) |
Health Insurance Coverage by Household Income in Carpendale
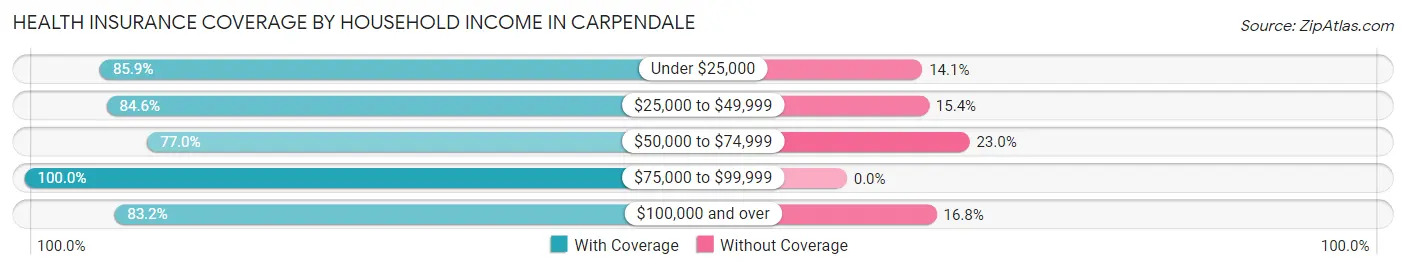
| Household Income | With Coverage | Without Coverage |
| Under $25,000 | 79 (85.9%) | 13 (14.1%) |
| $25,000 to $49,999 | 154 (84.6%) | 28 (15.4%) |
| $50,000 to $74,999 | 211 (77.0%) | 63 (23.0%) |
| $75,000 to $99,999 | 238 (100.0%) | 0 (0.0%) |
| $100,000 and over | 391 (83.2%) | 79 (16.8%) |
Public vs Private Health Insurance Coverage by Age in Carpendale
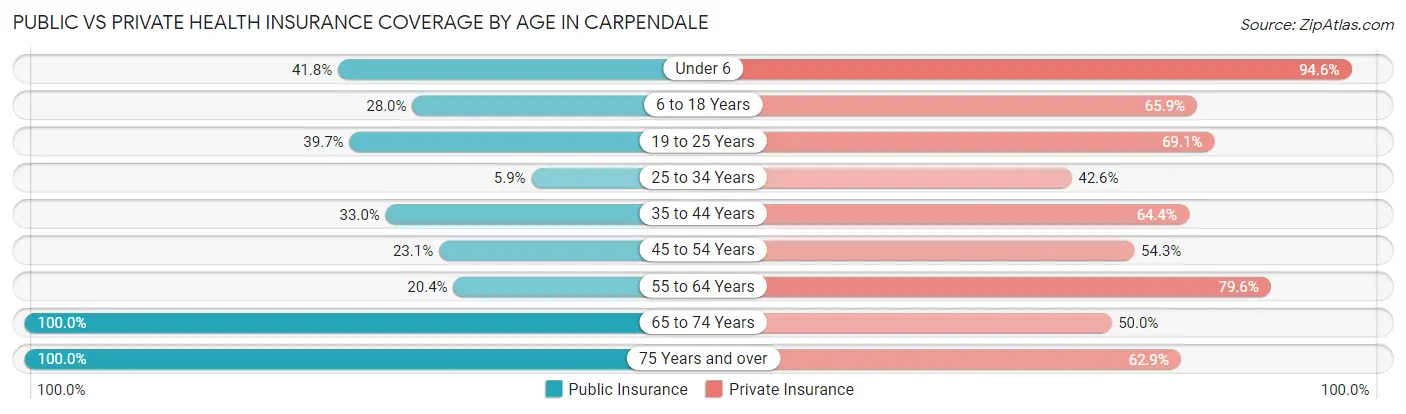
| Age Bracket | Public Insurance | Private Insurance |
| Under 6 | 23 (41.8%) | 52 (94.6%) |
| 6 to 18 Years | 37 (28.0%) | 87 (65.9%) |
| 19 to 25 Years | 27 (39.7%) | 47 (69.1%) |
| 25 to 34 Years | 10 (5.9%) | 72 (42.6%) |
| 35 to 44 Years | 63 (33.0%) | 123 (64.4%) |
| 45 to 54 Years | 54 (23.1%) | 127 (54.3%) |
| 55 to 64 Years | 40 (20.4%) | 156 (79.6%) |
| 65 to 74 Years | 122 (100.0%) | 61 (50.0%) |
| 75 Years and over | 89 (100.0%) | 56 (62.9%) |
| Total | 465 (37.0%) | 781 (62.2%) |
Disability Status by Sex by Age in Carpendale
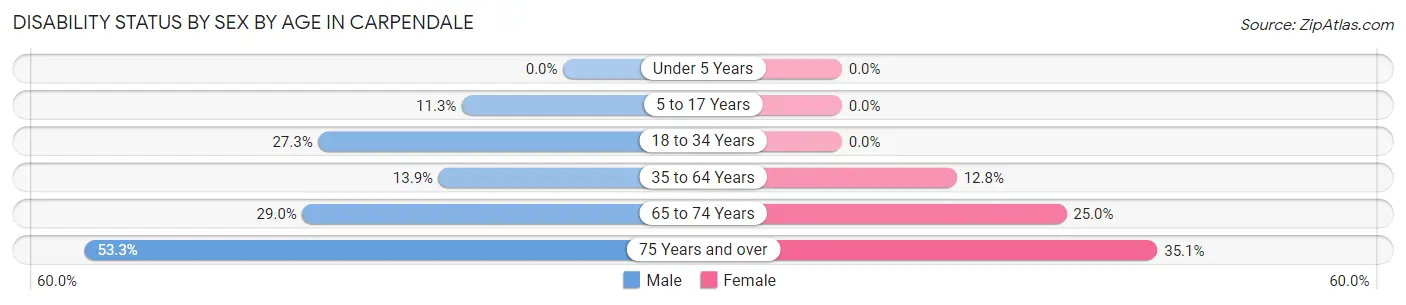
| Age Bracket | Male | Female |
| Under 5 Years | 0 (0.0%) | 0 (0.0%) |
| 5 to 17 Years | 8 (11.3%) | 0 (0.0%) |
| 18 to 34 Years | 48 (27.3%) | 0 (0.0%) |
| 35 to 64 Years | 46 (13.9%) | 37 (12.8%) |
| 65 to 74 Years | 18 (29.0%) | 15 (25.0%) |
| 75 Years and over | 8 (53.3%) | 26 (35.1%) |
Disability Class by Sex by Age in Carpendale
Disability Class: Hearing Difficulty
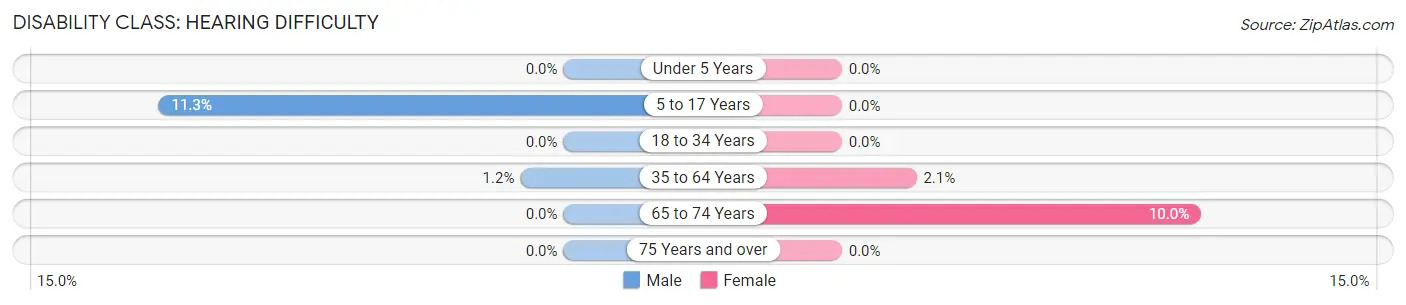
| Age Bracket | Male | Female |
| Under 5 Years | 0 (0.0%) | 0 (0.0%) |
| 5 to 17 Years | 8 (11.3%) | 0 (0.0%) |
| 18 to 34 Years | 0 (0.0%) | 0 (0.0%) |
| 35 to 64 Years | 4 (1.2%) | 6 (2.1%) |
| 65 to 74 Years | 0 (0.0%) | 6 (10.0%) |
| 75 Years and over | 0 (0.0%) | 0 (0.0%) |
Disability Class: Vision Difficulty
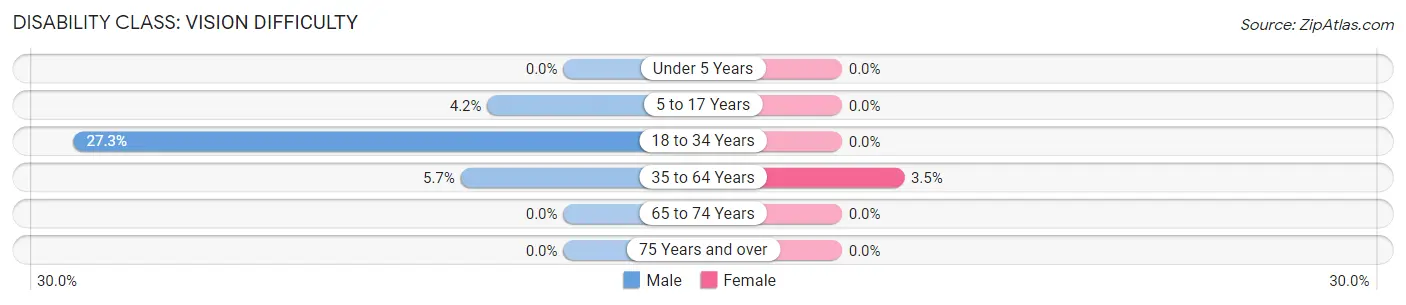
| Age Bracket | Male | Female |
| Under 5 Years | 0 (0.0%) | 0 (0.0%) |
| 5 to 17 Years | 3 (4.2%) | 0 (0.0%) |
| 18 to 34 Years | 48 (27.3%) | 0 (0.0%) |
| 35 to 64 Years | 19 (5.7%) | 10 (3.5%) |
| 65 to 74 Years | 0 (0.0%) | 0 (0.0%) |
| 75 Years and over | 0 (0.0%) | 0 (0.0%) |
Disability Class: Cognitive Difficulty
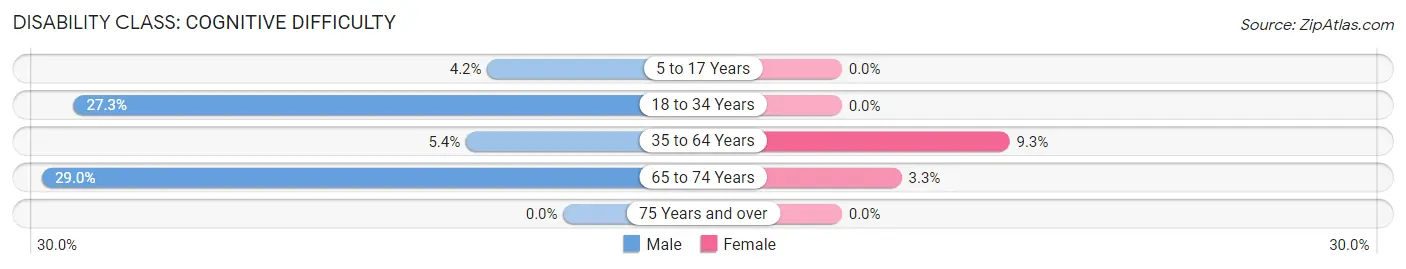
| Age Bracket | Male | Female |
| 5 to 17 Years | 3 (4.2%) | 0 (0.0%) |
| 18 to 34 Years | 48 (27.3%) | 0 (0.0%) |
| 35 to 64 Years | 18 (5.4%) | 27 (9.3%) |
| 65 to 74 Years | 18 (29.0%) | 2 (3.3%) |
| 75 Years and over | 0 (0.0%) | 0 (0.0%) |
Disability Class: Ambulatory Difficulty
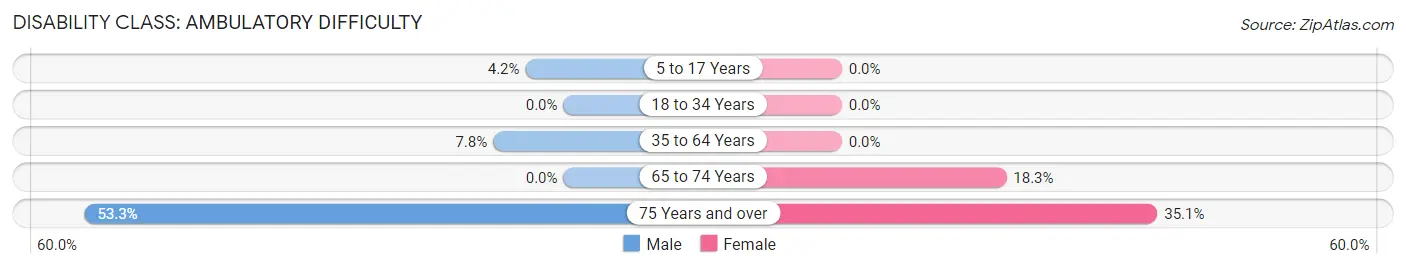
| Age Bracket | Male | Female |
| 5 to 17 Years | 3 (4.2%) | 0 (0.0%) |
| 18 to 34 Years | 0 (0.0%) | 0 (0.0%) |
| 35 to 64 Years | 26 (7.8%) | 0 (0.0%) |
| 65 to 74 Years | 0 (0.0%) | 11 (18.3%) |
| 75 Years and over | 8 (53.3%) | 26 (35.1%) |
Disability Class: Self-Care Difficulty
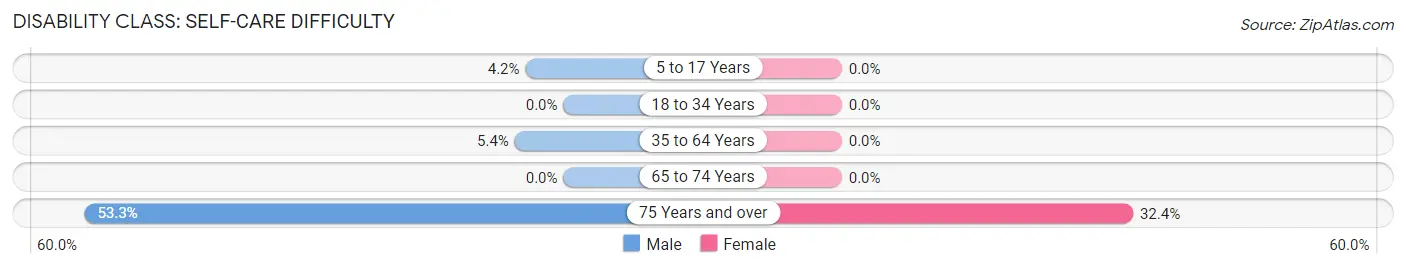
| Age Bracket | Male | Female |
| 5 to 17 Years | 3 (4.2%) | 0 (0.0%) |
| 18 to 34 Years | 0 (0.0%) | 0 (0.0%) |
| 35 to 64 Years | 18 (5.4%) | 0 (0.0%) |
| 65 to 74 Years | 0 (0.0%) | 0 (0.0%) |
| 75 Years and over | 8 (53.3%) | 24 (32.4%) |
Technology Access in Carpendale
Computing Device Access in Carpendale
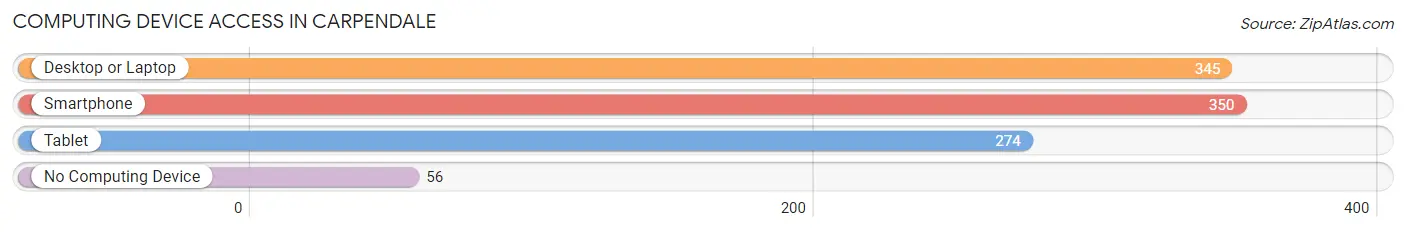
| Device Type | # Households | % Households |
| Desktop or Laptop | 345 | 73.7% |
| Smartphone | 350 | 74.8% |
| Tablet | 274 | 58.6% |
| No Computing Device | 56 | 12.0% |
| Total | 468 | 100.0% |
Internet Access in Carpendale
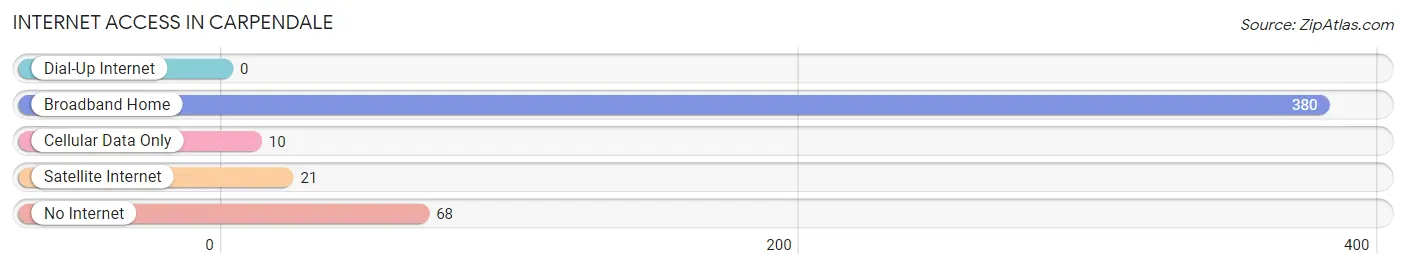
| Internet Type | # Households | % Households |
| Dial-Up Internet | 0 | 0.0% |
| Broadband Home | 380 | 81.2% |
| Cellular Data Only | 10 | 2.1% |
| Satellite Internet | 21 | 4.5% |
| No Internet | 68 | 14.5% |
| Total | 468 | 100.0% |
Carpendale Summary
Carpendale is a small town located in the eastern part of West Virginia, in the United States. It is situated in the Appalachian Mountains, and is part of the larger region known as the Potomac Highlands. The town has a population of just over 1,000 people, and is located in Grant County.
History
Carpendale was founded in 1820 by a group of settlers from Pennsylvania. The town was named after the Carpendale family, who were among the first settlers. The town was originally a farming community, and the Carpendale family owned a large amount of land in the area. The town grew slowly over the years, and by the early 1900s, it had become a small but thriving community.
In the 1950s, the town began to experience a decline in population as many of its residents moved away in search of better economic opportunities. This trend continued until the late 1980s, when the town began to experience a resurgence in population growth. This was due in part to the development of the nearby ski resort, which brought in a large number of tourists and new residents.
Geography
Carpendale is located in the Appalachian Mountains, in the eastern part of West Virginia. The town is situated in a valley, surrounded by mountains on all sides. The town is located near the Potomac River, and is close to the border with Maryland. The town is located at an elevation of 1,400 feet, and has a total area of 1.2 square miles.
The climate in Carpendale is humid continental, with hot summers and cold winters. The average annual temperature is around 50 degrees Fahrenheit, and the average annual precipitation is around 40 inches.
Economy
The economy of Carpendale is largely based on tourism. The town is home to a ski resort, which attracts a large number of visitors each year. The resort also provides jobs for many of the town’s residents. In addition, the town is home to a number of small businesses, including restaurants, shops, and other services.
Demographics
As of the 2010 census, the population of Carpendale was 1,072. The racial makeup of the town was 97.3% White, 0.9% African American, 0.2% Native American, 0.2% Asian, and 1.4% from other races. The median household income was $35,625, and the median family income was $41,250. The per capita income was $17,845.
Conclusion
Carpendale is a small town located in the eastern part of West Virginia. It has a population of just over 1,000 people, and is situated in the Appalachian Mountains. The town’s economy is largely based on tourism, and it is home to a ski resort which attracts a large number of visitors each year. The town has a diverse population, with a median household income of $35,625.
Common Questions
What is the Total Population of Carpendale?
Total Population of Carpendale is 1,256.
What is the Total Male Population of Carpendale?
Total Male Population of Carpendale is 702.
What is the Total Female Population of Carpendale?
Total Female Population of Carpendale is 554.
What is the Ratio of Males per 100 Females in Carpendale?
There are 126.71 Males per 100 Females in Carpendale.
What is the Ratio of Females per 100 Males in Carpendale?
There are 78.92 Females per 100 Males in Carpendale.
What is the Median Population Age in Carpendale?
Median Population Age in Carpendale is 45.4 Years.
What is the Average Family Size in Carpendale
Average Family Size in Carpendale is 3.1 People.
What is the Average Household Size in Carpendale
Average Household Size in Carpendale is 2.7 People.
What is Per Capita Income in Carpendale?
Per Capita income in Carpendale is $29,478.
What is the Median Family Income in Carpendale?
Median Family Income in Carpendale is $74,886.
What is the Median Household income in Carpendale?
Median Household Income in Carpendale is $65,938.
What is Income or Wage Gap in Carpendale?
Income or Wage Gap in Carpendale is 38.7%.
Women in Carpendale earn 61.3 cents for every dollar earned by a man.
What is Inequality or Gini Index in Carpendale?
Inequality or Gini Index in Carpendale is 0.32.
How Large is the Labor Force in Carpendale?
There are 661 People in the Labor Forcein in Carpendale.
What is the Percentage of People in the Labor Force in Carpendale?
60.3% of People are in the Labor Force in Carpendale.
What is the Unemployment Rate in Carpendale?
Unemployment Rate in Carpendale is 8.9%.