Franklin, WV
Franklin Map
Franklin Overview
342
TOTAL POPULATION
154
MALE POPULATION
188
FEMALE POPULATION
81.91
MALES / 100 FEMALES
122.08
FEMALES / 100 MALES
53.4
MEDIAN AGE
3.0
AVG FAMILY SIZE
2.1
AVG HOUSEHOLD SIZE
$34,863
PER CAPITA INCOME
$93,036
AVG FAMILY INCOME
$78,125
AVG HOUSEHOLD INCOME
19.8%
WAGE / INCOME GAP [ % ]
80.2¢/ $1
WAGE / INCOME GAP [ $ ]
0.34
INEQUALITY / GINI INDEX
133
LABOR FORCE [ PEOPLE ]
44.9%
PERCENT IN LABOR FORCE
Franklin Zip Codes
Franklin Area Codes
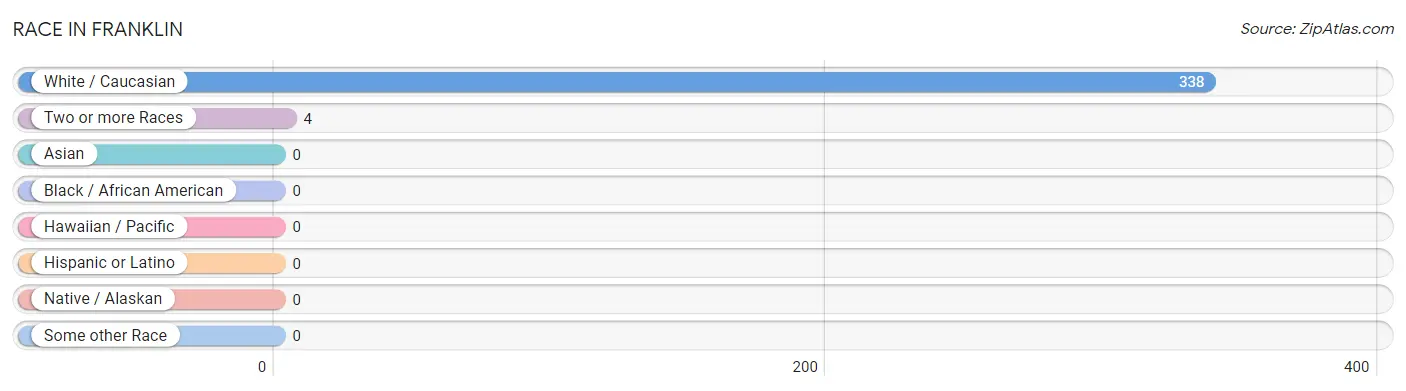
Race in Franklin
The most populous races in Franklin are White / Caucasian (338 | 98.8%), and Two or more Races (4 | 1.2%).
| Race | # Population | % Population |
| Asian | 0 | 0.0% |
| Black / African American | 0 | 0.0% |
| Hawaiian / Pacific | 0 | 0.0% |
| Hispanic or Latino | 0 | 0.0% |
| Native / Alaskan | 0 | 0.0% |
| White / Caucasian | 338 | 98.8% |
| Two or more Races | 4 | 1.2% |
| Some other Race | 0 | 0.0% |
| Total | 342 | 100.0% |
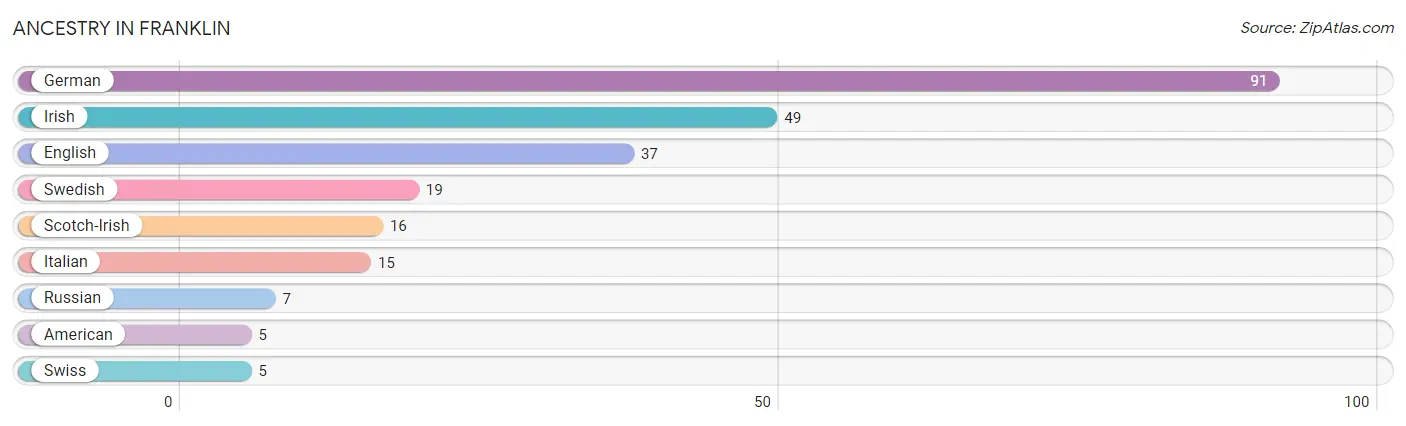
Ancestry in Franklin
The most populous ancestries reported in Franklin are German (91 | 26.6%), Irish (49 | 14.3%), English (37 | 10.8%), Swedish (19 | 5.6%), and Scotch-Irish (16 | 4.7%), together accounting for 62.0% of all Franklin residents.
| Ancestry | # Population | % Population |
| American | 5 | 1.5% |
| English | 37 | 10.8% |
| German | 91 | 26.6% |
| Irish | 49 | 14.3% |
| Italian | 15 | 4.4% |
| Russian | 7 | 2.1% |
| Scotch-Irish | 16 | 4.7% |
| Swedish | 19 | 5.6% |
| Swiss | 5 | 1.5% | View All 9 Rows |
Immigrants in Franklin

| Immigration Origin | # Population | % Population | View All 0 Rows |
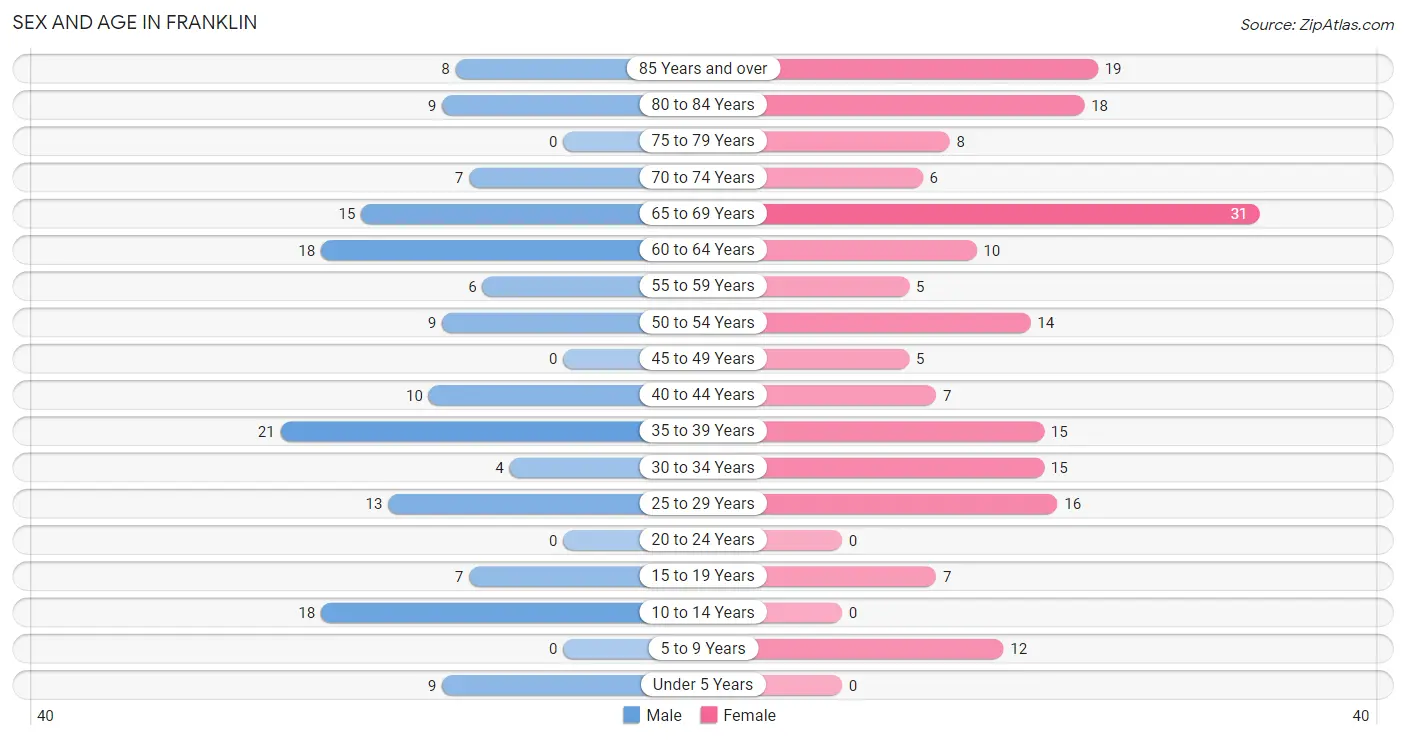
Sex and Age in Franklin
Sex and Age in Franklin
The most populous age groups in Franklin are 35 to 39 Years (21 | 13.6%) for men and 65 to 69 Years (31 | 16.5%) for women.
| Age Bracket | Male | Female |
| Under 5 Years | 9 (5.8%) | 0 (0.0%) |
| 5 to 9 Years | 0 (0.0%) | 12 (6.4%) |
| 10 to 14 Years | 18 (11.7%) | 0 (0.0%) |
| 15 to 19 Years | 7 (4.5%) | 7 (3.7%) |
| 20 to 24 Years | 0 (0.0%) | 0 (0.0%) |
| 25 to 29 Years | 13 (8.4%) | 16 (8.5%) |
| 30 to 34 Years | 4 (2.6%) | 15 (8.0%) |
| 35 to 39 Years | 21 (13.6%) | 15 (8.0%) |
| 40 to 44 Years | 10 (6.5%) | 7 (3.7%) |
| 45 to 49 Years | 0 (0.0%) | 5 (2.7%) |
| 50 to 54 Years | 9 (5.8%) | 14 (7.4%) |
| 55 to 59 Years | 6 (3.9%) | 5 (2.7%) |
| 60 to 64 Years | 18 (11.7%) | 10 (5.3%) |
| 65 to 69 Years | 15 (9.7%) | 31 (16.5%) |
| 70 to 74 Years | 7 (4.5%) | 6 (3.2%) |
| 75 to 79 Years | 0 (0.0%) | 8 (4.3%) |
| 80 to 84 Years | 9 (5.8%) | 18 (9.6%) |
| 85 Years and over | 8 (5.2%) | 19 (10.1%) |
| Total | 154 (100.0%) | 188 (100.0%) |
Families and Households in Franklin
Median Family Size in Franklin
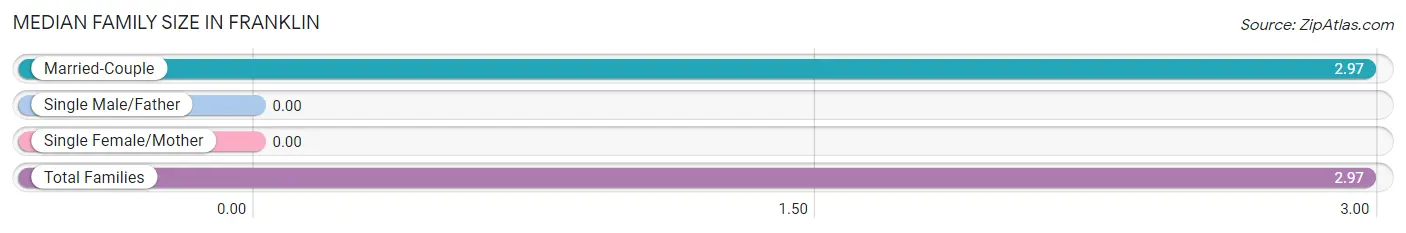
| Family Type | # Families | Family Size |
| Married-Couple | 67 (100.0%) | 2.97 |
| Single Male/Father | 0 (0.0%) | - |
| Single Female/Mother | 0 (0.0%) | - |
| Total Families | 67 (100.0%) | 2.97 |
Median Household Size in Franklin
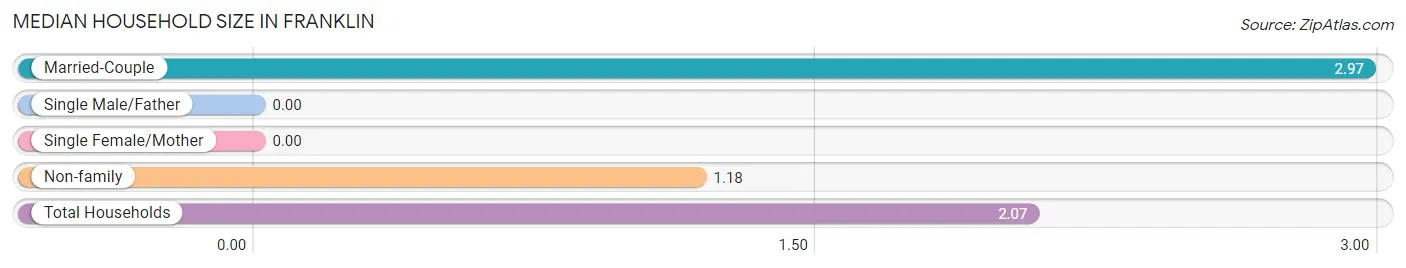
| Household Type | # Households | Household Size |
| Married-Couple | 67 (50.0%) | 2.97 |
| Single Male/Father | 0 (0.0%) | - |
| Single Female/Mother | 0 (0.0%) | - |
| Non-family | 67 (50.0%) | 1.18 |
| Total Households | 134 (100.0%) | 2.07 |
Household Size by Marriage Status in Franklin
Out of a total of 134 households in Franklin, 67 (50.0%) are family households, while 67 (50.0%) are nonfamily households. The most numerous type of family households are 2-person households, comprising 34, and the most common type of nonfamily households are 1-person households, comprising 56.
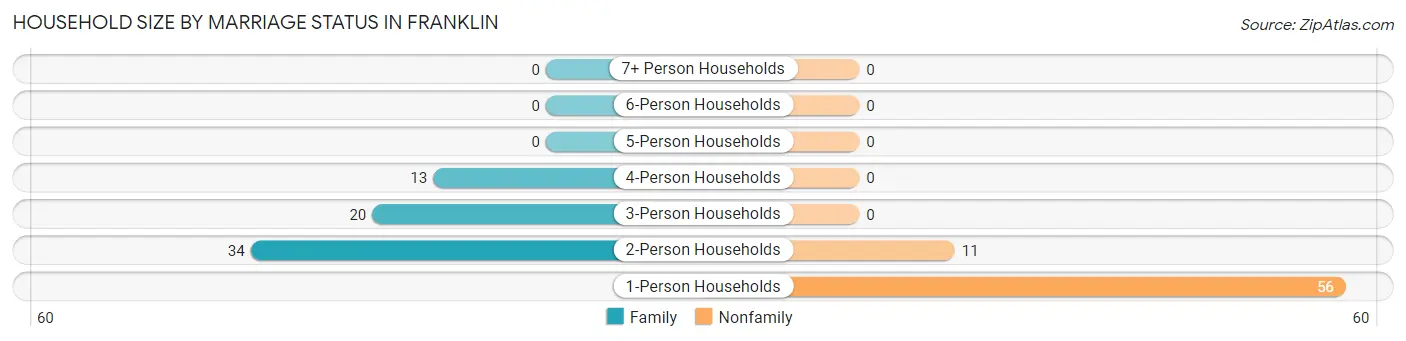
| Household Size | Family Households | Nonfamily Households |
| 1-Person Households | - | 56 (41.8%) |
| 2-Person Households | 34 (25.4%) | 11 (8.2%) |
| 3-Person Households | 20 (14.9%) | 0 (0.0%) |
| 4-Person Households | 13 (9.7%) | 0 (0.0%) |
| 5-Person Households | 0 (0.0%) | 0 (0.0%) |
| 6-Person Households | 0 (0.0%) | 0 (0.0%) |
| 7+ Person Households | 0 (0.0%) | 0 (0.0%) |
| Total | 67 (50.0%) | 67 (50.0%) |
Female Fertility in Franklin
Fertility by Age in Franklin
Average fertility rate in Franklin is 123.0 births per 1,000 women. Women in the age bracket of 35 to 50 years have the highest fertility rate with 296.0 births per 1,000 women. Women in the age bracket of 35 to 50 years acount for 100.0% of all women with births.
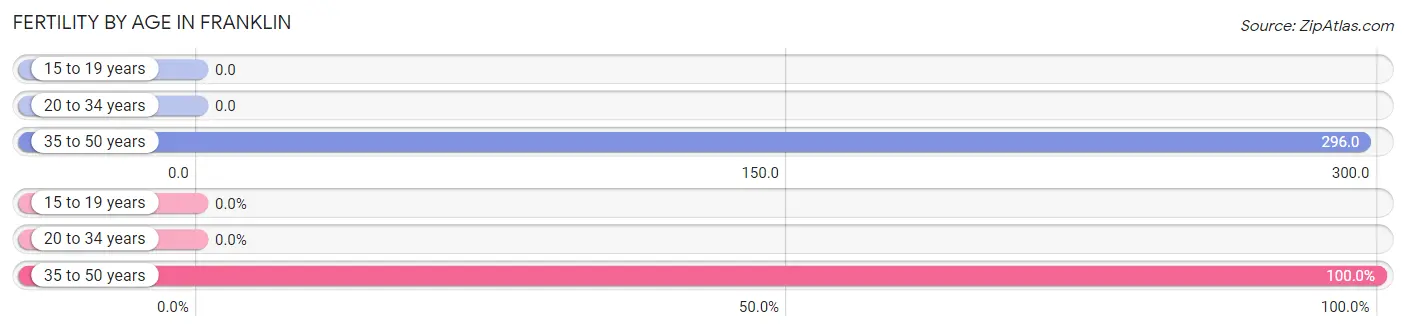
| Age Bracket | Women with Births | Births / 1,000 Women |
| 15 to 19 years | 0 (0.0%) | 0.0 |
| 20 to 34 years | 0 (0.0%) | 0.0 |
| 35 to 50 years | 8 (100.0%) | 296.0 |
| Total | 8 (100.0%) | 123.0 |
Fertility by Age by Marriage Status in Franklin
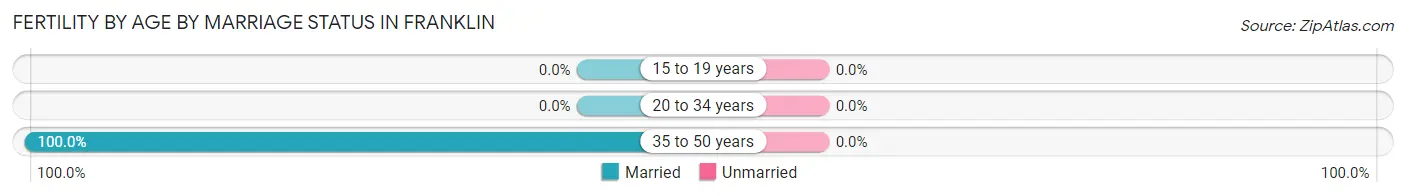
| Age Bracket | Married | Unmarried |
| 15 to 19 years | 0 (0.0%) | 0 (0.0%) |
| 20 to 34 years | 0 (0.0%) | 0 (0.0%) |
| 35 to 50 years | 8 (100.0%) | 0 (0.0%) |
| Total | 8 (100.0%) | 0 (0.0%) |
Fertility by Education in Franklin
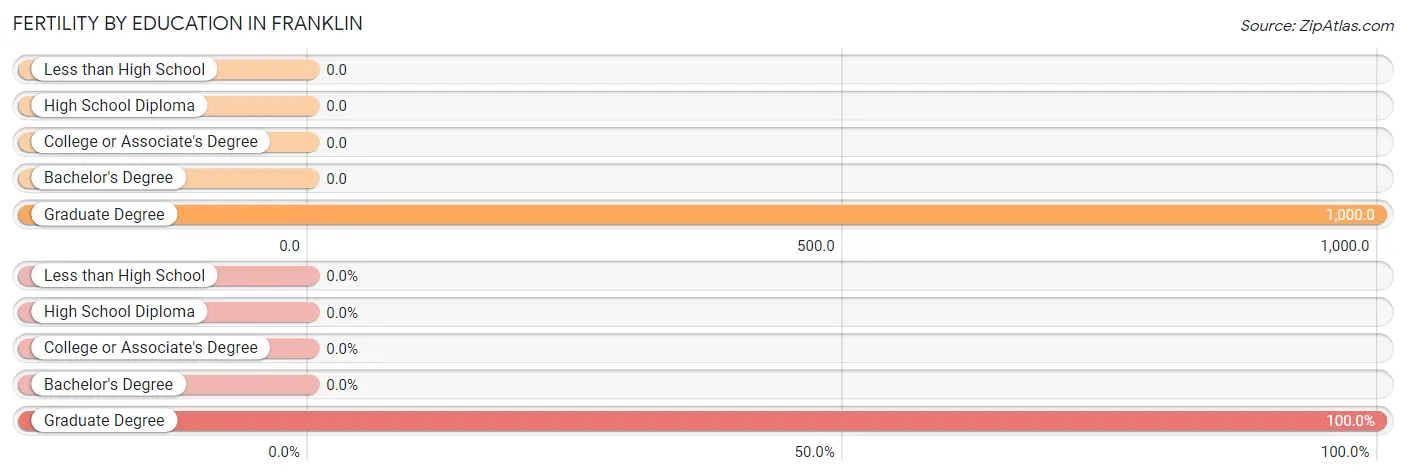
| Educational Attainment | Women with Births | Births / 1,000 Women |
| Less than High School | 0 (0.0%) | 0.0 |
| High School Diploma | 0 (0.0%) | 0.0 |
| College or Associate's Degree | 0 (0.0%) | 0.0 |
| Bachelor's Degree | 0 (0.0%) | 0.0 |
| Graduate Degree | 8 (100.0%) | 1,000.0 |
| Total | 8 (100.0%) | 123.0 |
Fertility by Education by Marriage Status in Franklin
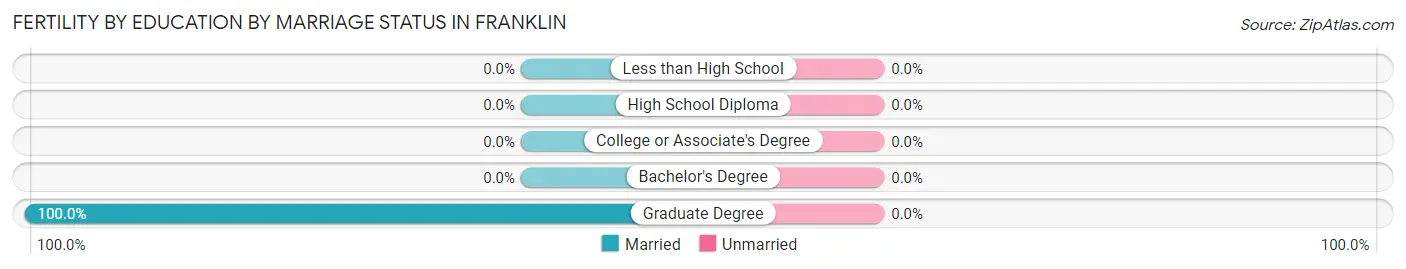
| Educational Attainment | Married | Unmarried |
| Less than High School | 0 (0.0%) | 0 (0.0%) |
| High School Diploma | 0 (0.0%) | 0 (0.0%) |
| College or Associate's Degree | 0 (0.0%) | 0 (0.0%) |
| Bachelor's Degree | 0 (0.0%) | 0 (0.0%) |
| Graduate Degree | 8 (100.0%) | 0 (0.0%) |
| Total | 8 (100.0%) | 0 (0.0%) |
Income in Franklin
Income Overview in Franklin
Per Capita Income in Franklin is $34,863, while median incomes of families and households are $93,036 and $78,125 respectively.
| Characteristic | Number | Measure |
| Per Capita Income | 342 | $34,863 |
| Median Family Income | 67 | $93,036 |
| Mean Family Income | 67 | $91,981 |
| Median Household Income | 134 | $78,125 |
| Mean Household Income | 134 | $72,943 |
| Income Deficit | 67 | $0 |
| Wage / Income Gap (%) | 342 | 19.78% |
| Wage / Income Gap ($) | 342 | 80.22¢ per $1 |
| Gini / Inequality Index | 342 | 0.34 |
Earnings by Sex in Franklin
Average Earnings in Franklin are $43,750, $48,929 for men and $39,250 for women, a difference of 19.8%.
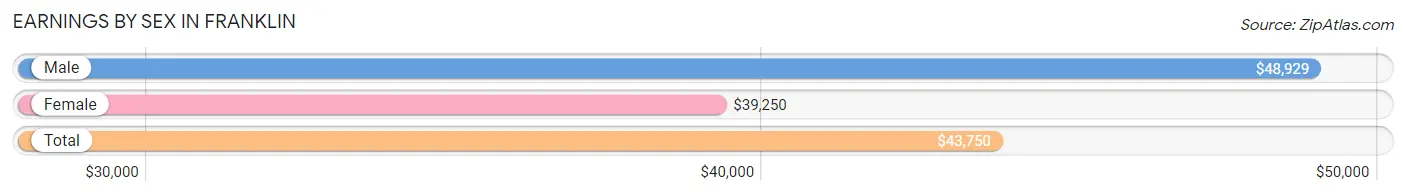
| Sex | Number | Average Earnings |
| Male | 64 (48.1%) | $48,929 |
| Female | 69 (51.9%) | $39,250 |
| Total | 133 (100.0%) | $43,750 |
Earnings by Sex by Income Bracket in Franklin
The most common earnings brackets in Franklin are $65,000 to $74,999 for men (18 | 28.1%) and $10,000 to $12,499 for women (16 | 23.2%).
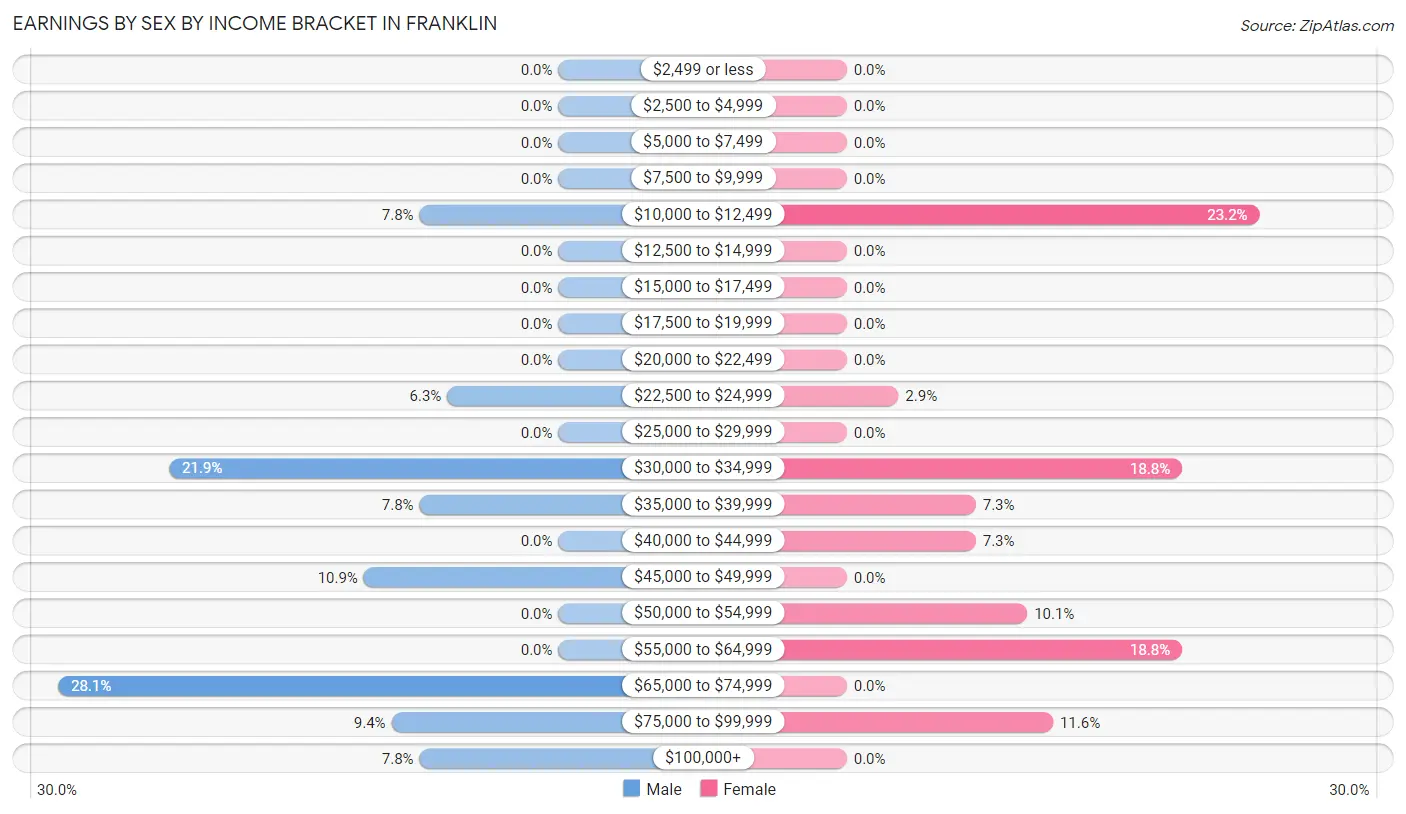
| Income | Male | Female |
| $2,499 or less | 0 (0.0%) | 0 (0.0%) |
| $2,500 to $4,999 | 0 (0.0%) | 0 (0.0%) |
| $5,000 to $7,499 | 0 (0.0%) | 0 (0.0%) |
| $7,500 to $9,999 | 0 (0.0%) | 0 (0.0%) |
| $10,000 to $12,499 | 5 (7.8%) | 16 (23.2%) |
| $12,500 to $14,999 | 0 (0.0%) | 0 (0.0%) |
| $15,000 to $17,499 | 0 (0.0%) | 0 (0.0%) |
| $17,500 to $19,999 | 0 (0.0%) | 0 (0.0%) |
| $20,000 to $22,499 | 0 (0.0%) | 0 (0.0%) |
| $22,500 to $24,999 | 4 (6.2%) | 2 (2.9%) |
| $25,000 to $29,999 | 0 (0.0%) | 0 (0.0%) |
| $30,000 to $34,999 | 14 (21.9%) | 13 (18.8%) |
| $35,000 to $39,999 | 5 (7.8%) | 5 (7.2%) |
| $40,000 to $44,999 | 0 (0.0%) | 5 (7.2%) |
| $45,000 to $49,999 | 7 (10.9%) | 0 (0.0%) |
| $50,000 to $54,999 | 0 (0.0%) | 7 (10.1%) |
| $55,000 to $64,999 | 0 (0.0%) | 13 (18.8%) |
| $65,000 to $74,999 | 18 (28.1%) | 0 (0.0%) |
| $75,000 to $99,999 | 6 (9.4%) | 8 (11.6%) |
| $100,000+ | 5 (7.8%) | 0 (0.0%) |
| Total | 64 (100.0%) | 69 (100.0%) |
Earnings by Sex by Educational Attainment in Franklin
Average earnings in Franklin are $48,929 for men and $39,250 for women, a difference of 19.8%. Men with an educational attainment of bachelor's degree enjoy the highest average annual earnings of $65,577, while those with bachelor's degree education earn the least with $65,577. Women with an educational attainment of bachelor's degree earn the most with the average annual earnings of $33,750, while those with bachelor's degree education have the smallest earnings of $33,750.
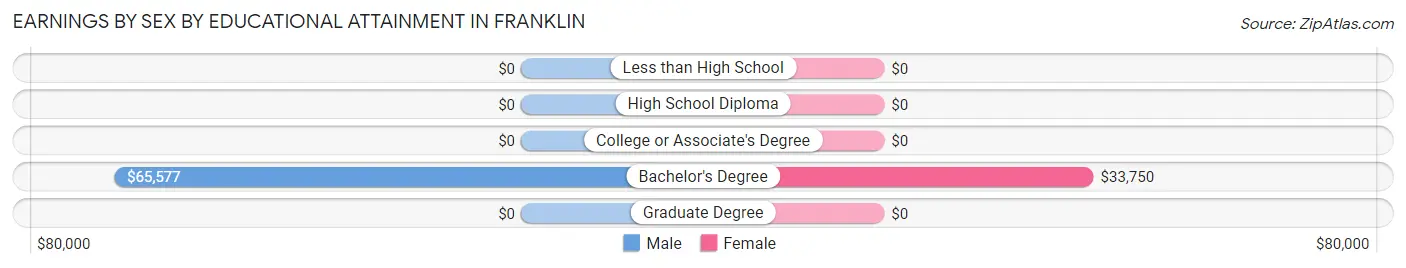
| Educational Attainment | Male Income | Female Income |
| Less than High School | - | - |
| High School Diploma | - | - |
| College or Associate's Degree | - | - |
| Bachelor's Degree | $65,577 | $33,750 |
| Graduate Degree | - | - |
| Total | $48,929 | $39,250 |
Family Income in Franklin
Family Income Brackets in Franklin
According to the Franklin family income data, there are 33 families falling into the $75,000 to $99,999 income range, which is the most common income bracket and makes up 49.2% of all families.
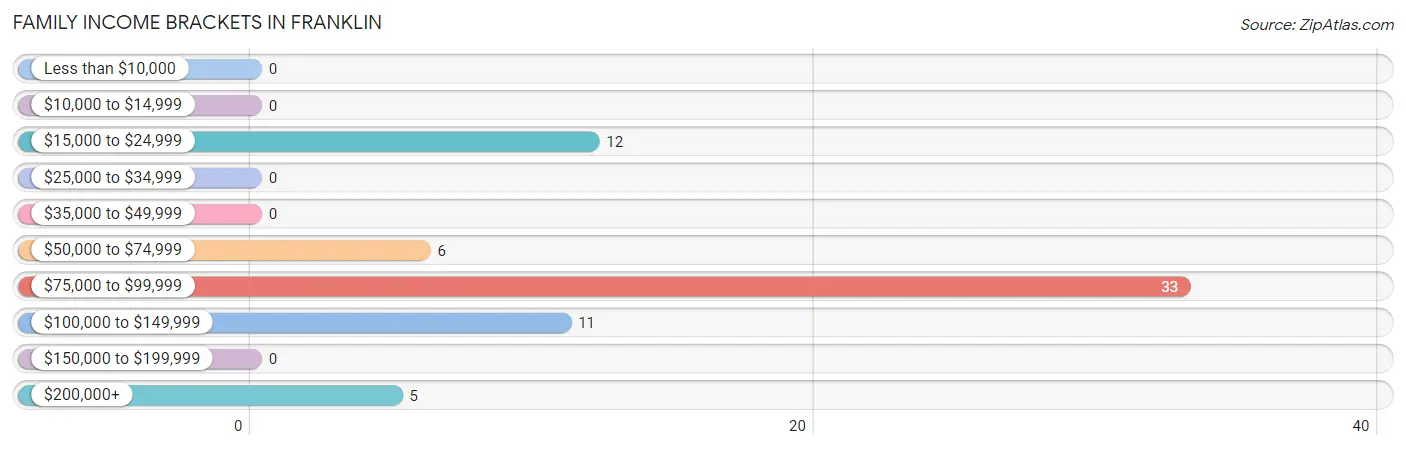
| Income Bracket | # Families | % Families |
| Less than $10,000 | 0 | 0.0% |
| $10,000 to $14,999 | 0 | 0.0% |
| $15,000 to $24,999 | 12 | 17.9% |
| $25,000 to $34,999 | 0 | 0.0% |
| $35,000 to $49,999 | 0 | 0.0% |
| $50,000 to $74,999 | 6 | 9.0% |
| $75,000 to $99,999 | 33 | 49.3% |
| $100,000 to $149,999 | 11 | 16.4% |
| $150,000 to $199,999 | 0 | 0.0% |
| $200,000+ | 5 | 7.5% |
Family Income by Famaliy Size in Franklin
2-person families (34 | 50.7%) account for the highest median family income in Franklin with $93,214 per family, while 2-person families (34 | 50.7%) have the highest median income of $46,607 per family member.
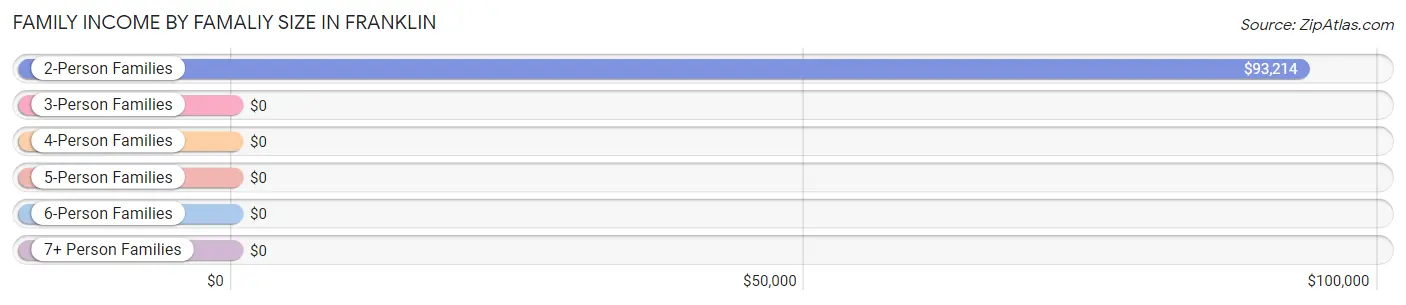
| Income Bracket | # Families | Median Income |
| 2-Person Families | 34 (50.7%) | $93,214 |
| 3-Person Families | 20 (29.8%) | $0 |
| 4-Person Families | 13 (19.4%) | $0 |
| 5-Person Families | 0 (0.0%) | $0 |
| 6-Person Families | 0 (0.0%) | $0 |
| 7+ Person Families | 0 (0.0%) | $0 |
| Total | 67 (100.0%) | $93,036 |
Family Income by Number of Earners in Franklin
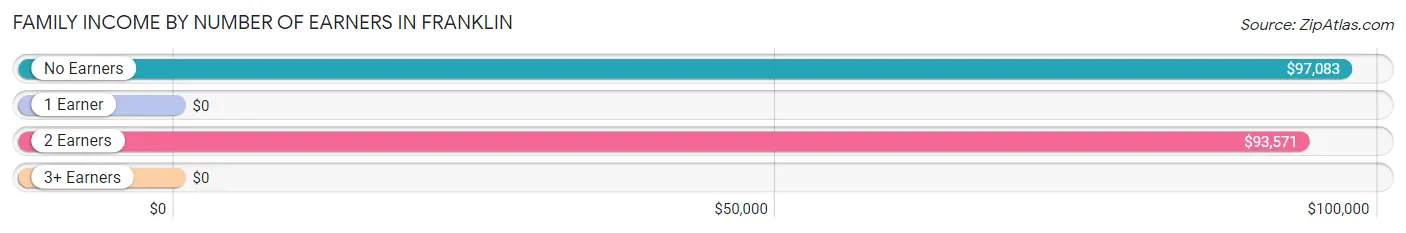
| Number of Earners | # Families | Median Income |
| No Earners | 14 (20.9%) | $97,083 |
| 1 Earner | 23 (34.3%) | $0 |
| 2 Earners | 30 (44.8%) | $93,571 |
| 3+ Earners | 0 (0.0%) | $0 |
| Total | 67 (100.0%) | $93,036 |
Household Income in Franklin
Household Income Brackets in Franklin
With 46 households falling in the category, the $75,000 to $99,999 income range is the most frequent in Franklin, accounting for 34.3% of all households.
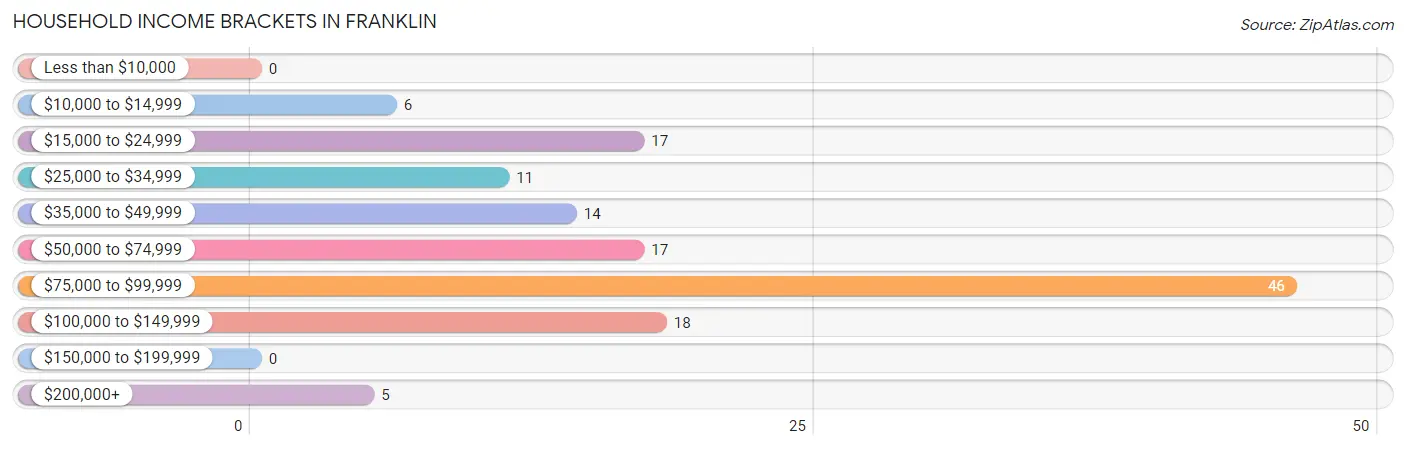
| Income Bracket | # Households | % Households |
| Less than $10,000 | 0 | 0.0% |
| $10,000 to $14,999 | 6 | 4.5% |
| $15,000 to $24,999 | 17 | 12.7% |
| $25,000 to $34,999 | 11 | 8.2% |
| $35,000 to $49,999 | 14 | 10.4% |
| $50,000 to $74,999 | 17 | 12.7% |
| $75,000 to $99,999 | 46 | 34.3% |
| $100,000 to $149,999 | 18 | 13.4% |
| $150,000 to $199,999 | 0 | 0.0% |
| $200,000+ | 5 | 3.7% |
Household Income by Householder Age in Franklin
The median household income in Franklin is $78,125, with the highest median household income of $93,036 found in the 45 to 64 years age bracket for the primary householder. A total of 41 households (30.6%) fall into this category.
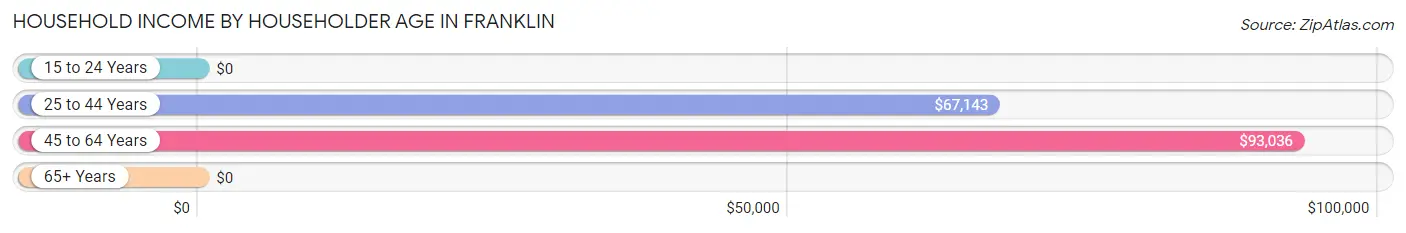
| Income Bracket | # Households | Median Income |
| 15 to 24 Years | 0 (0.0%) | $0 |
| 25 to 44 Years | 48 (35.8%) | $67,143 |
| 45 to 64 Years | 41 (30.6%) | $93,036 |
| 65+ Years | 45 (33.6%) | $0 |
| Total | 134 (100.0%) | $78,125 |
Poverty in Franklin
Income Below Poverty by Sex and Age in Franklin
With 12.1% poverty level for males and 16.8% for females among the residents of Franklin, 35 to 44 year old males and 6 to 11 year old females are the most vulnerable to poverty, with 9 males (29.0%) and 12 females (100.0%) in their respective age groups living below the poverty level.
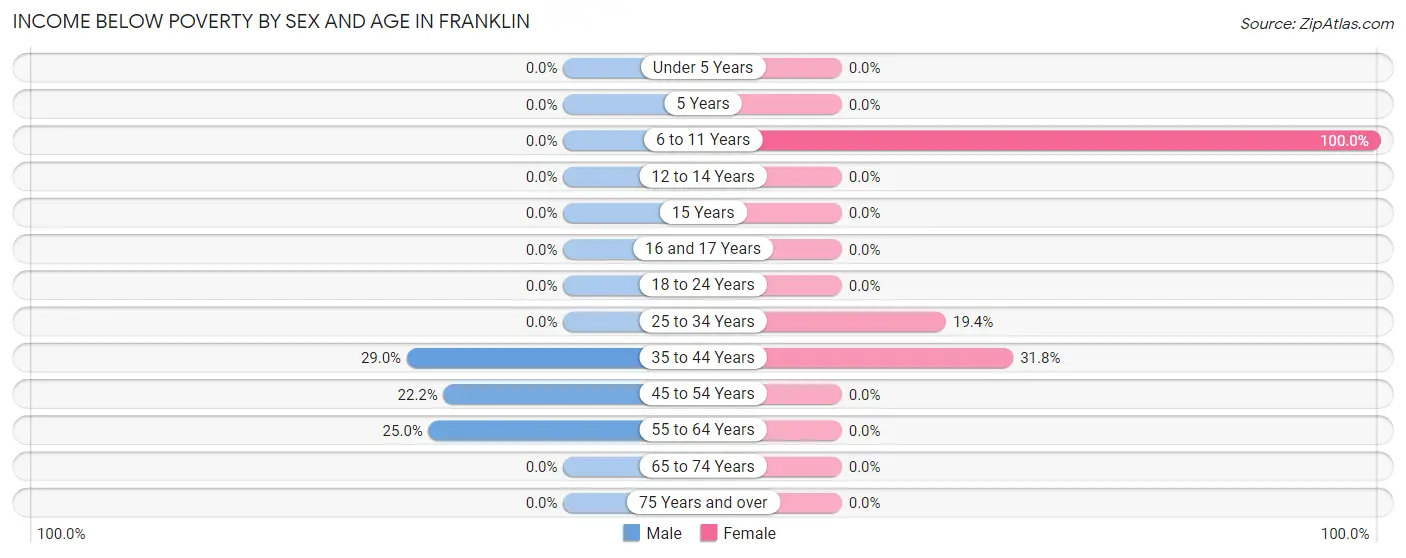
| Age Bracket | Male | Female |
| Under 5 Years | 0 (0.0%) | 0 (0.0%) |
| 5 Years | 0 (0.0%) | 0 (0.0%) |
| 6 to 11 Years | 0 (0.0%) | 12 (100.0%) |
| 12 to 14 Years | 0 (0.0%) | 0 (0.0%) |
| 15 Years | 0 (0.0%) | 0 (0.0%) |
| 16 and 17 Years | 0 (0.0%) | 0 (0.0%) |
| 18 to 24 Years | 0 (0.0%) | 0 (0.0%) |
| 25 to 34 Years | 0 (0.0%) | 6 (19.4%) |
| 35 to 44 Years | 9 (29.0%) | 7 (31.8%) |
| 45 to 54 Years | 2 (22.2%) | 0 (0.0%) |
| 55 to 64 Years | 6 (25.0%) | 0 (0.0%) |
| 65 to 74 Years | 0 (0.0%) | 0 (0.0%) |
| 75 Years and over | 0 (0.0%) | 0 (0.0%) |
| Total | 17 (12.1%) | 25 (16.8%) |
Income Above Poverty by Sex and Age in Franklin
According to the poverty statistics in Franklin, males aged under 5 years and females aged 16 and 17 years are the age groups that are most secure financially, with 100.0% of males and 100.0% of females in these age groups living above the poverty line.
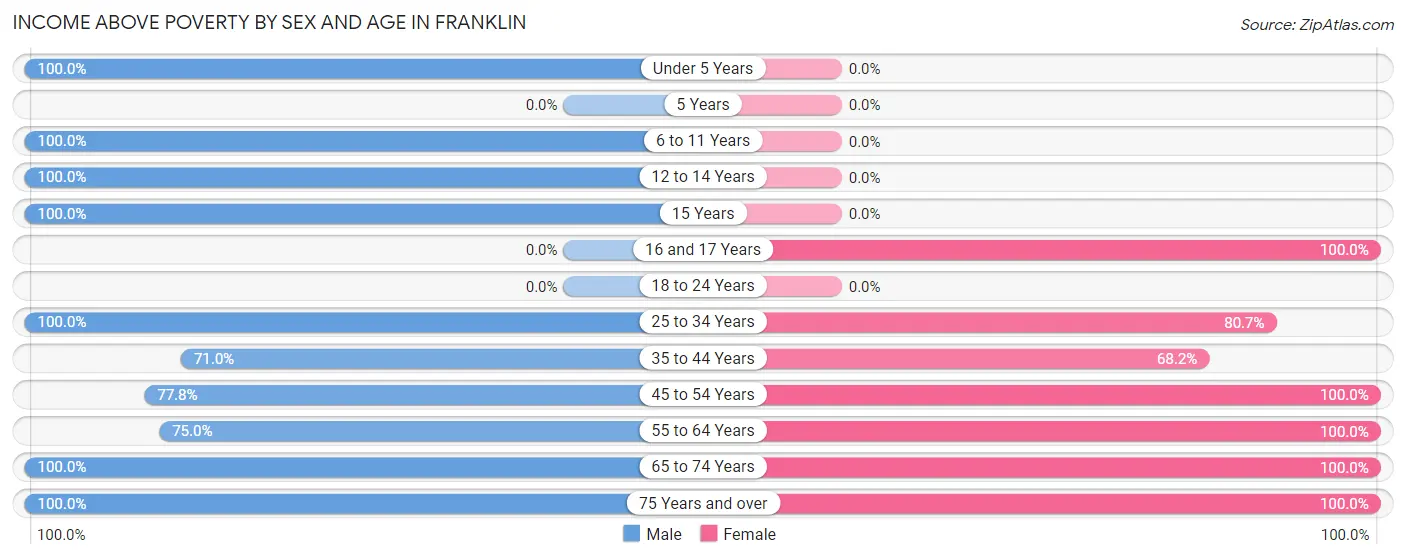
| Age Bracket | Male | Female |
| Under 5 Years | 9 (100.0%) | 0 (0.0%) |
| 5 Years | 0 (0.0%) | 0 (0.0%) |
| 6 to 11 Years | 12 (100.0%) | 0 (0.0%) |
| 12 to 14 Years | 6 (100.0%) | 0 (0.0%) |
| 15 Years | 7 (100.0%) | 0 (0.0%) |
| 16 and 17 Years | 0 (0.0%) | 7 (100.0%) |
| 18 to 24 Years | 0 (0.0%) | 0 (0.0%) |
| 25 to 34 Years | 17 (100.0%) | 25 (80.6%) |
| 35 to 44 Years | 22 (71.0%) | 15 (68.2%) |
| 45 to 54 Years | 7 (77.8%) | 19 (100.0%) |
| 55 to 64 Years | 18 (75.0%) | 9 (100.0%) |
| 65 to 74 Years | 16 (100.0%) | 37 (100.0%) |
| 75 Years and over | 9 (100.0%) | 12 (100.0%) |
| Total | 123 (87.9%) | 124 (83.2%) |
Income Below Poverty Among Married-Couple Families in Franklin
The poverty statistics for married-couple families in Franklin show that 10.4% or 7 of the total 67 families live below the poverty line. Families with 1 or 2 children have the highest poverty rate of 25.0%, comprising of 7 families. On the other hand, families with no children have the lowest poverty rate of 0.0%, which includes 0 families.
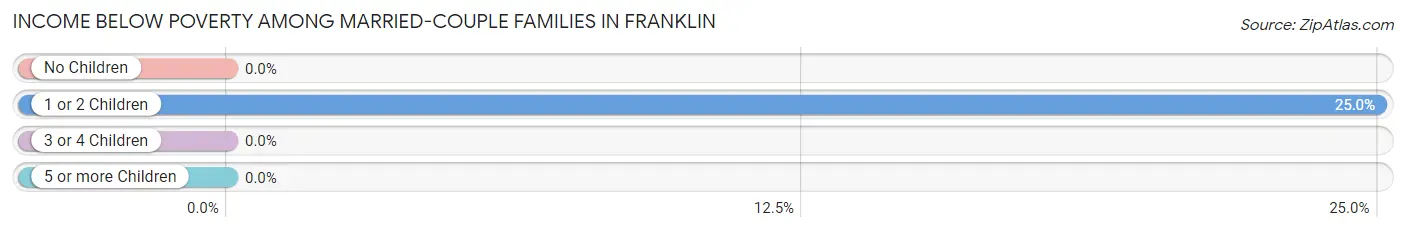
| Children | Above Poverty | Below Poverty |
| No Children | 39 (100.0%) | 0 (0.0%) |
| 1 or 2 Children | 21 (75.0%) | 7 (25.0%) |
| 3 or 4 Children | 0 (0.0%) | 0 (0.0%) |
| 5 or more Children | 0 (0.0%) | 0 (0.0%) |
| Total | 60 (89.5%) | 7 (10.4%) |
Income Below Poverty Among Single-Parent Households in Franklin
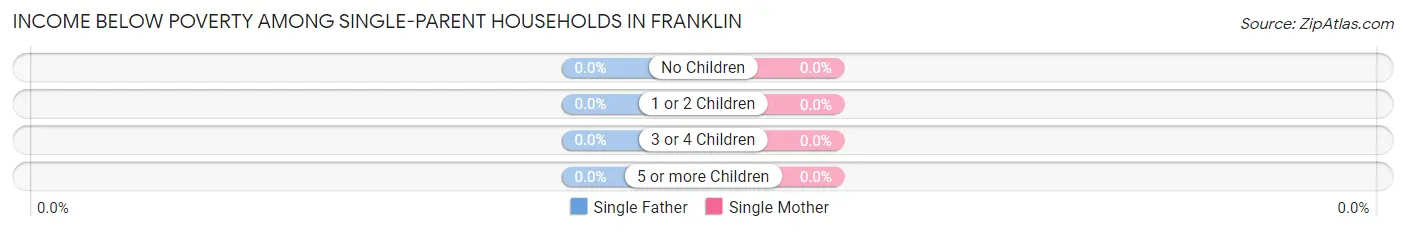
| Children | Single Father | Single Mother |
| No Children | 0 (0.0%) | 0 (0.0%) |
| 1 or 2 Children | 0 (0.0%) | 0 (0.0%) |
| 3 or 4 Children | 0 (0.0%) | 0 (0.0%) |
| 5 or more Children | 0 (0.0%) | 0 (0.0%) |
| Total | 0 (0.0%) | 0 (0.0%) |
Income Below Poverty Among Married-Couple vs Single-Parent Households in Franklin
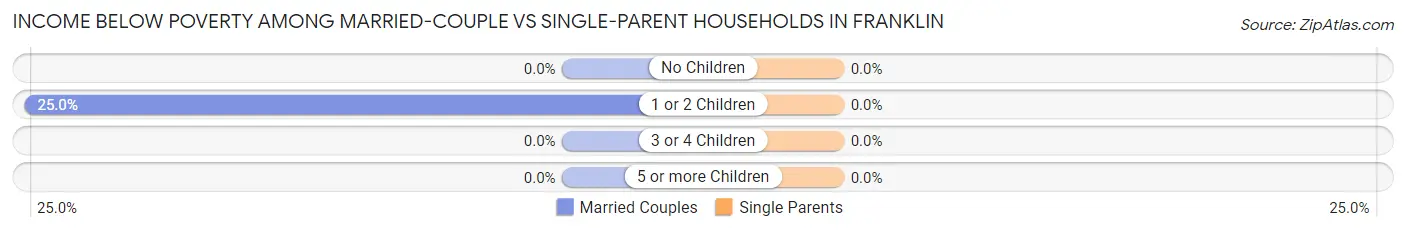
| Children | Married-Couple Families | Single-Parent Households |
| No Children | 0 (0.0%) | 0 (0.0%) |
| 1 or 2 Children | 7 (25.0%) | 0 (0.0%) |
| 3 or 4 Children | 0 (0.0%) | 0 (0.0%) |
| 5 or more Children | 0 (0.0%) | 0 (0.0%) |
| Total | 7 (10.4%) | 0 (0.0%) |
Employment Characteristics in Franklin
Employment by Class of Employer in Franklin
Among the 133 employed individuals in Franklin, private company employees (67 | 50.4%), state government employees (23 | 17.3%), and not-for-profit organizations (22 | 16.5%) make up the most common classes of employment.
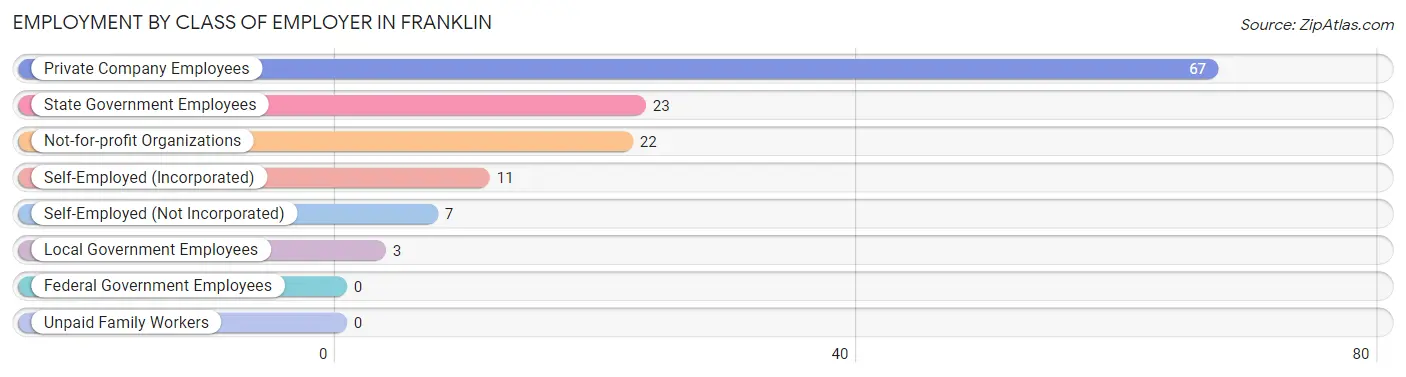
| Employer Class | # Employees | % Employees |
| Private Company Employees | 67 | 50.4% |
| Self-Employed (Incorporated) | 11 | 8.3% |
| Self-Employed (Not Incorporated) | 7 | 5.3% |
| Not-for-profit Organizations | 22 | 16.5% |
| Local Government Employees | 3 | 2.3% |
| State Government Employees | 23 | 17.3% |
| Federal Government Employees | 0 | 0.0% |
| Unpaid Family Workers | 0 | 0.0% |
| Total | 133 | 100.0% |
Employment Status by Age in Franklin
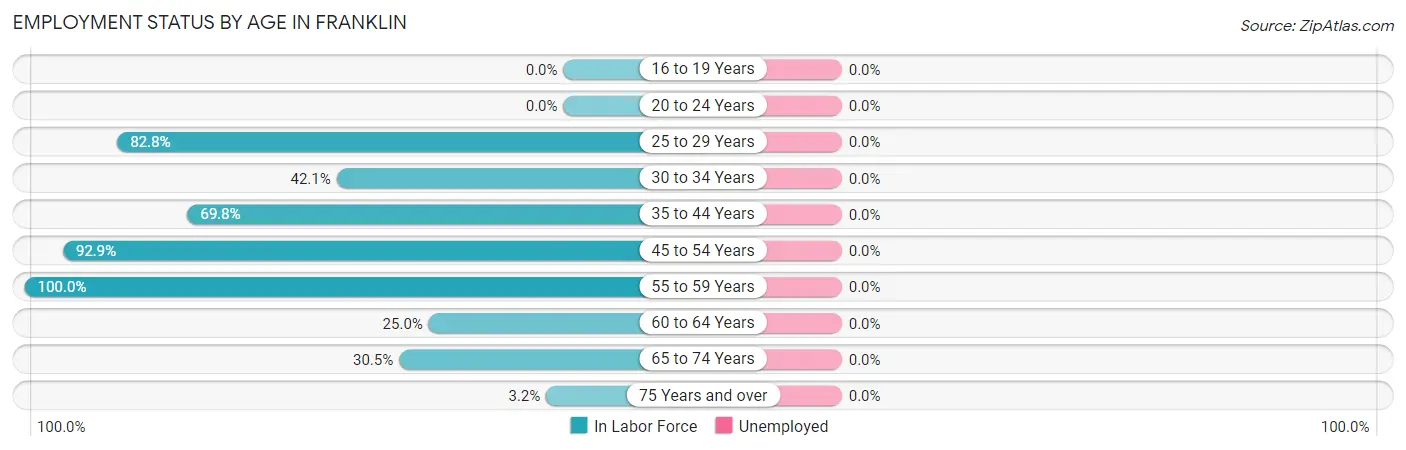
| Age Bracket | In Labor Force | Unemployed |
| 16 to 19 Years | 0 (0.0%) | 0 (0.0%) |
| 20 to 24 Years | 0 (0.0%) | 0 (0.0%) |
| 25 to 29 Years | 24 (82.8%) | 0 (0.0%) |
| 30 to 34 Years | 8 (42.1%) | 0 (0.0%) |
| 35 to 44 Years | 37 (69.8%) | 0 (0.0%) |
| 45 to 54 Years | 26 (92.9%) | 0 (0.0%) |
| 55 to 59 Years | 11 (100.0%) | 0 (0.0%) |
| 60 to 64 Years | 7 (25.0%) | 0 (0.0%) |
| 65 to 74 Years | 18 (30.5%) | 0 (0.0%) |
| 75 Years and over | 2 (3.2%) | 0 (0.0%) |
| Total | 133 (44.9%) | 0 (0.0%) |
Employment Status by Educational Attainment in Franklin
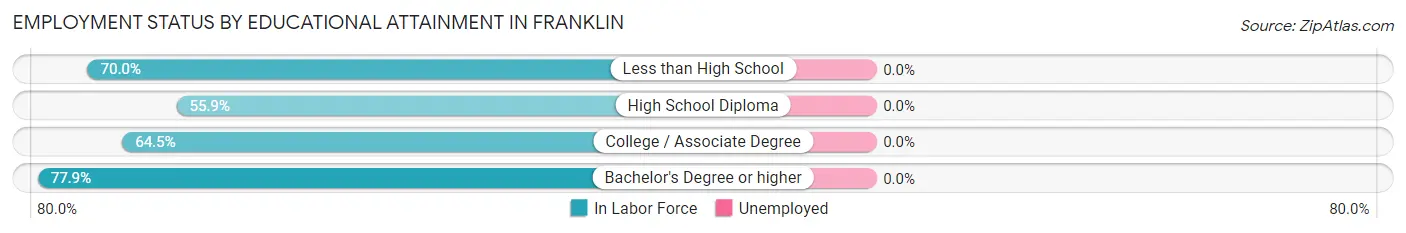
| Educational Attainment | In Labor Force | Unemployed |
| Less than High School | 7 (70.0%) | 0 (0.0%) |
| High School Diploma | 33 (55.9%) | 0 (0.0%) |
| College / Associate Degree | 20 (64.5%) | 0 (0.0%) |
| Bachelor's Degree or higher | 53 (77.9%) | 0 (0.0%) |
| Total | 113 (67.3%) | 0 (0.0%) |
Employment Occupations by Sex in Franklin
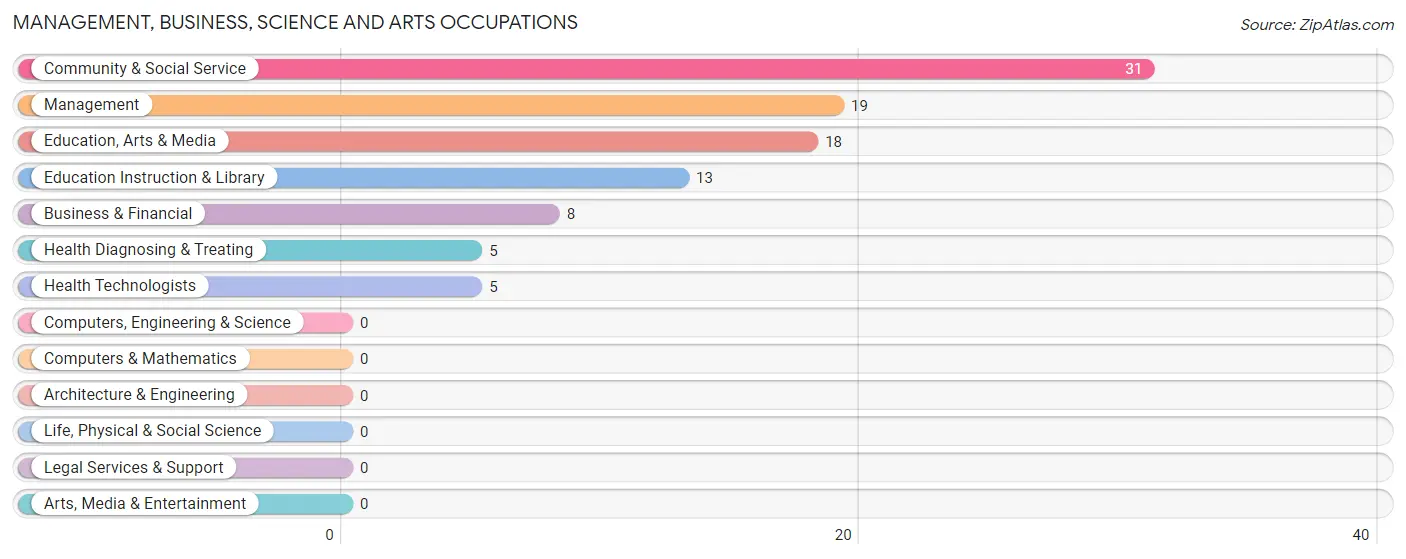
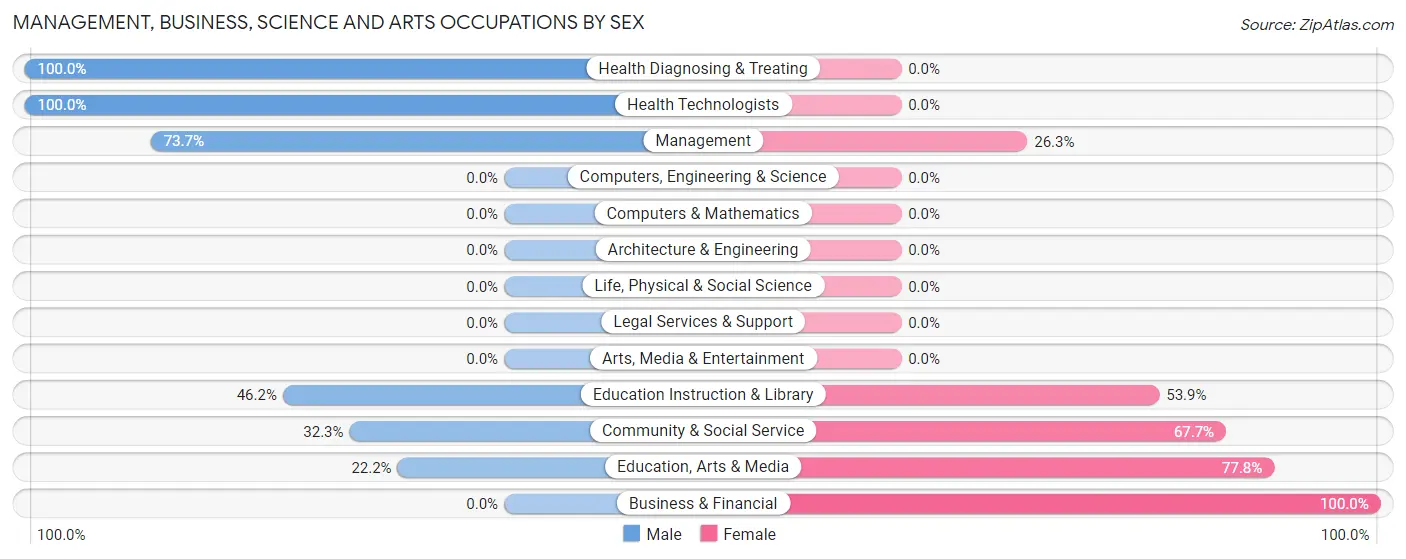
Management, Business, Science and Arts Occupations
The most common Management, Business, Science and Arts occupations in Franklin are Community & Social Service (31 | 23.3%), Management (19 | 14.3%), Education, Arts & Media (18 | 13.5%), Education Instruction & Library (13 | 9.8%), and Business & Financial (8 | 6.0%).
Management, Business, Science and Arts Occupations by Sex
Within the Management, Business, Science and Arts occupations in Franklin, the most male-oriented occupations are Health Diagnosing & Treating (100.0%), Health Technologists (100.0%), and Management (73.7%), while the most female-oriented occupations are Business & Financial (100.0%), Education, Arts & Media (77.8%), and Community & Social Service (67.7%).
| Occupation | Male | Female |
| Management | 14 (73.7%) | 5 (26.3%) |
| Business & Financial | 0 (0.0%) | 8 (100.0%) |
| Computers, Engineering & Science | 0 (0.0%) | 0 (0.0%) |
| Computers & Mathematics | 0 (0.0%) | 0 (0.0%) |
| Architecture & Engineering | 0 (0.0%) | 0 (0.0%) |
| Life, Physical & Social Science | 0 (0.0%) | 0 (0.0%) |
| Community & Social Service | 10 (32.3%) | 21 (67.7%) |
| Education, Arts & Media | 4 (22.2%) | 14 (77.8%) |
| Legal Services & Support | 0 (0.0%) | 0 (0.0%) |
| Education Instruction & Library | 6 (46.2%) | 7 (53.8%) |
| Arts, Media & Entertainment | 0 (0.0%) | 0 (0.0%) |
| Health Diagnosing & Treating | 5 (100.0%) | 0 (0.0%) |
| Health Technologists | 5 (100.0%) | 0 (0.0%) |
| Total (Category) | 29 (46.0%) | 34 (54.0%) |
| Total (Overall) | 64 (48.1%) | 69 (51.9%) |
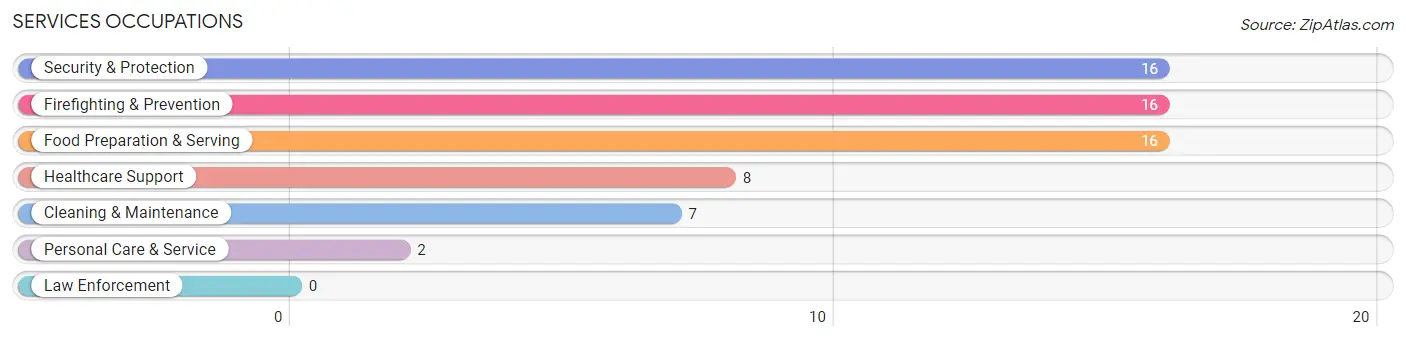
Services Occupations
The most common Services occupations in Franklin are Security & Protection (16 | 12.0%), Firefighting & Prevention (16 | 12.0%), Food Preparation & Serving (16 | 12.0%), Healthcare Support (8 | 6.0%), and Cleaning & Maintenance (7 | 5.3%).
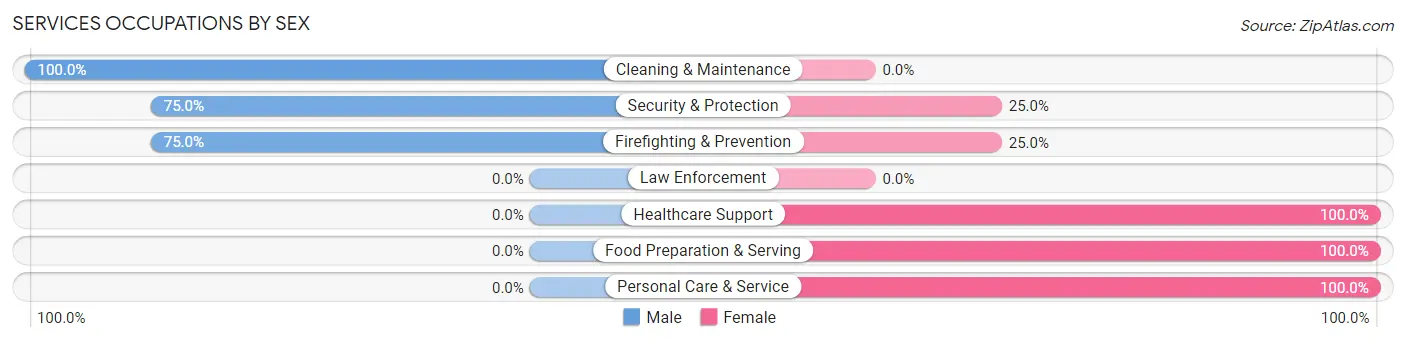
Services Occupations by Sex
Within the Services occupations in Franklin, the most male-oriented occupations are Cleaning & Maintenance (100.0%), Security & Protection (75.0%), and Firefighting & Prevention (75.0%), while the most female-oriented occupations are Healthcare Support (100.0%), Food Preparation & Serving (100.0%), and Personal Care & Service (100.0%).
| Occupation | Male | Female |
| Healthcare Support | 0 (0.0%) | 8 (100.0%) |
| Security & Protection | 12 (75.0%) | 4 (25.0%) |
| Firefighting & Prevention | 12 (75.0%) | 4 (25.0%) |
| Law Enforcement | 0 (0.0%) | 0 (0.0%) |
| Food Preparation & Serving | 0 (0.0%) | 16 (100.0%) |
| Cleaning & Maintenance | 7 (100.0%) | 0 (0.0%) |
| Personal Care & Service | 0 (0.0%) | 2 (100.0%) |
| Total (Category) | 19 (38.8%) | 30 (61.2%) |
| Total (Overall) | 64 (48.1%) | 69 (51.9%) |
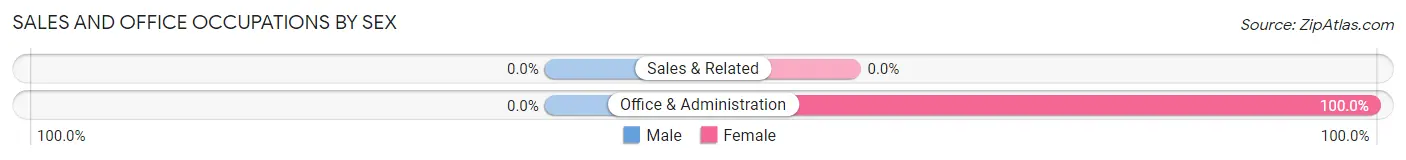
Sales and Office Occupations
The most common Sales and Office occupations in Franklin are , and Office & Administration (5 | 3.8%).
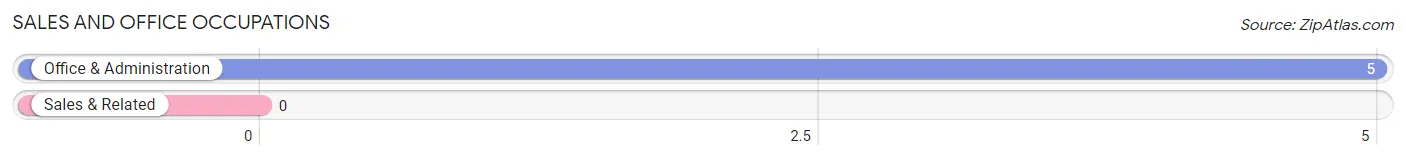
Sales and Office Occupations by Sex
| Occupation | Male | Female |
| Sales & Related | 0 (0.0%) | 0 (0.0%) |
| Office & Administration | 0 (0.0%) | 5 (100.0%) |
| Total (Category) | 0 (0.0%) | 5 (100.0%) |
| Total (Overall) | 64 (48.1%) | 69 (51.9%) |
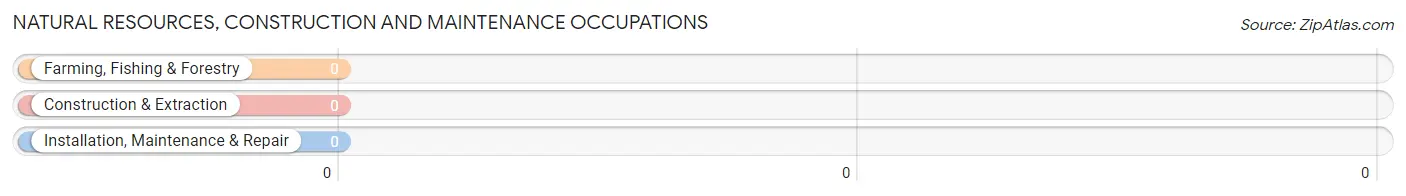
Natural Resources, Construction and Maintenance Occupations
Natural Resources, Construction and Maintenance Occupations by Sex
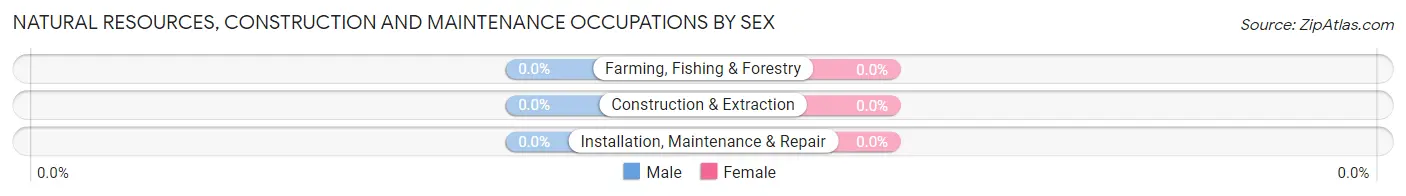
| Occupation | Male | Female |
| Farming, Fishing & Forestry | 0 (0.0%) | 0 (0.0%) |
| Construction & Extraction | 0 (0.0%) | 0 (0.0%) |
| Installation, Maintenance & Repair | 0 (0.0%) | 0 (0.0%) |
| Total (Category) | 0 (0.0%) | 0 (0.0%) |
| Total (Overall) | 64 (48.1%) | 69 (51.9%) |
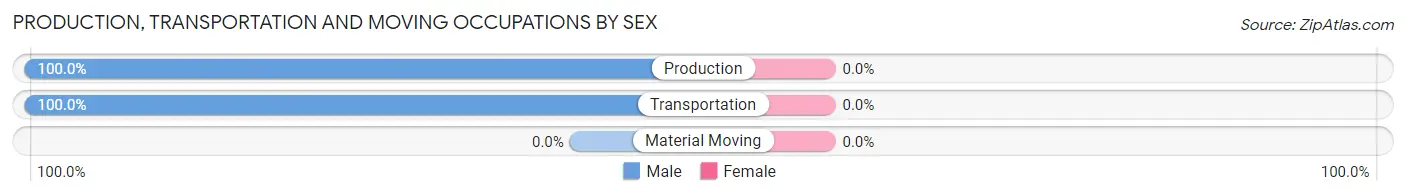
Production, Transportation and Moving Occupations
The most common Production, Transportation and Moving occupations in Franklin are Transportation (10 | 7.5%), and Production (6 | 4.5%).
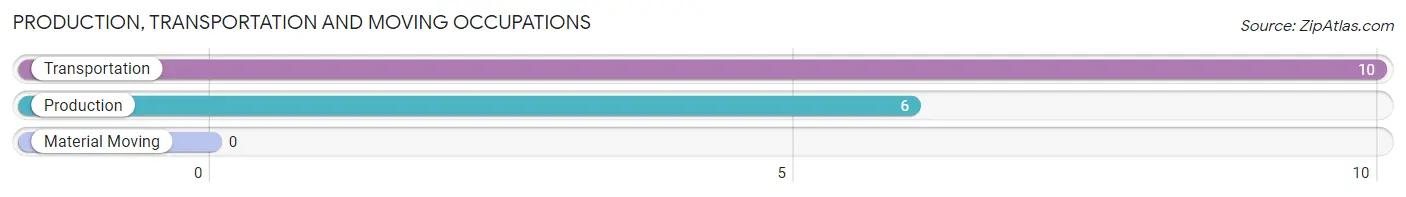
Production, Transportation and Moving Occupations by Sex
| Occupation | Male | Female |
| Production | 6 (100.0%) | 0 (0.0%) |
| Transportation | 10 (100.0%) | 0 (0.0%) |
| Material Moving | 0 (0.0%) | 0 (0.0%) |
| Total (Category) | 16 (100.0%) | 0 (0.0%) |
| Total (Overall) | 64 (48.1%) | 69 (51.9%) |
Employment Industries by Sex in Franklin
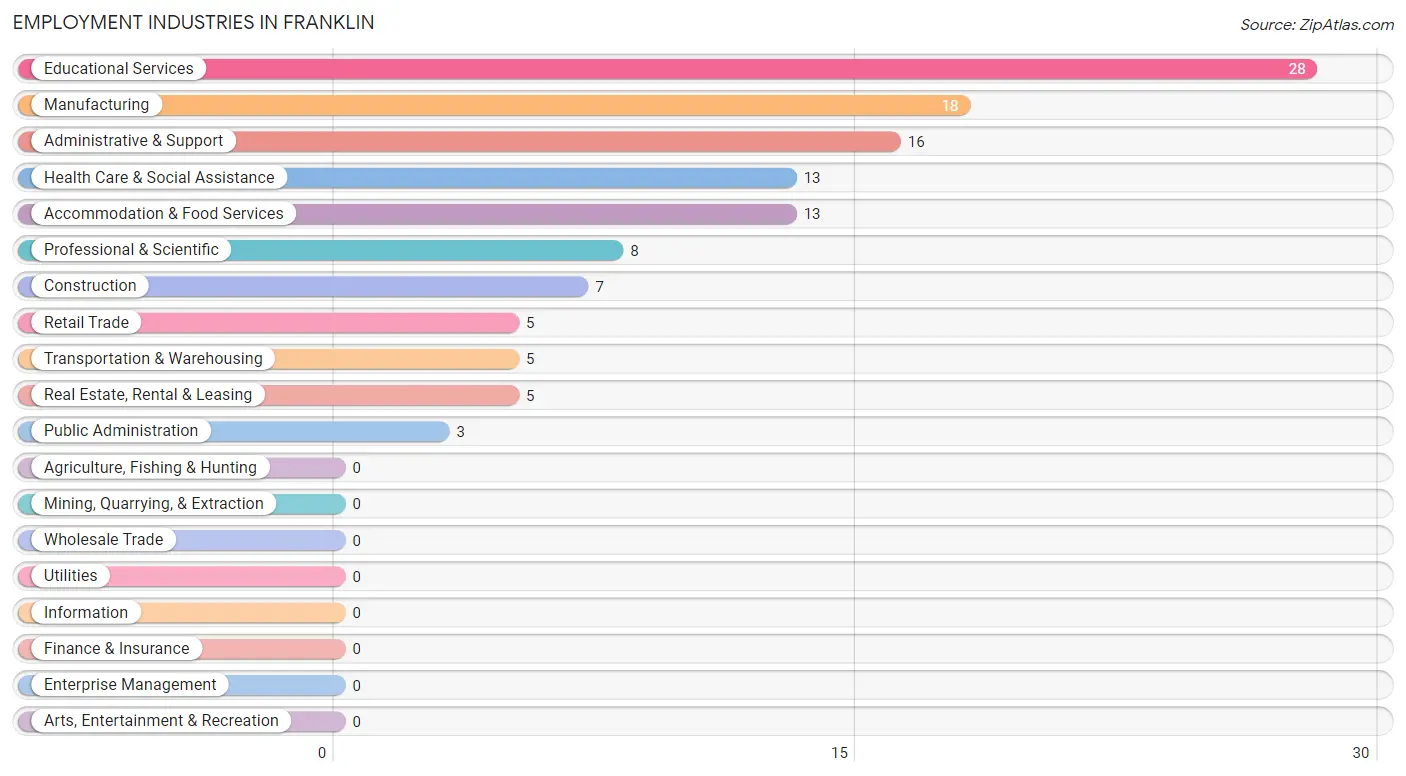
Employment Industries in Franklin
The major employment industries in Franklin include Educational Services (28 | 21.0%), Manufacturing (18 | 13.5%), Administrative & Support (16 | 12.0%), Health Care & Social Assistance (13 | 9.8%), and Accommodation & Food Services (13 | 9.8%).
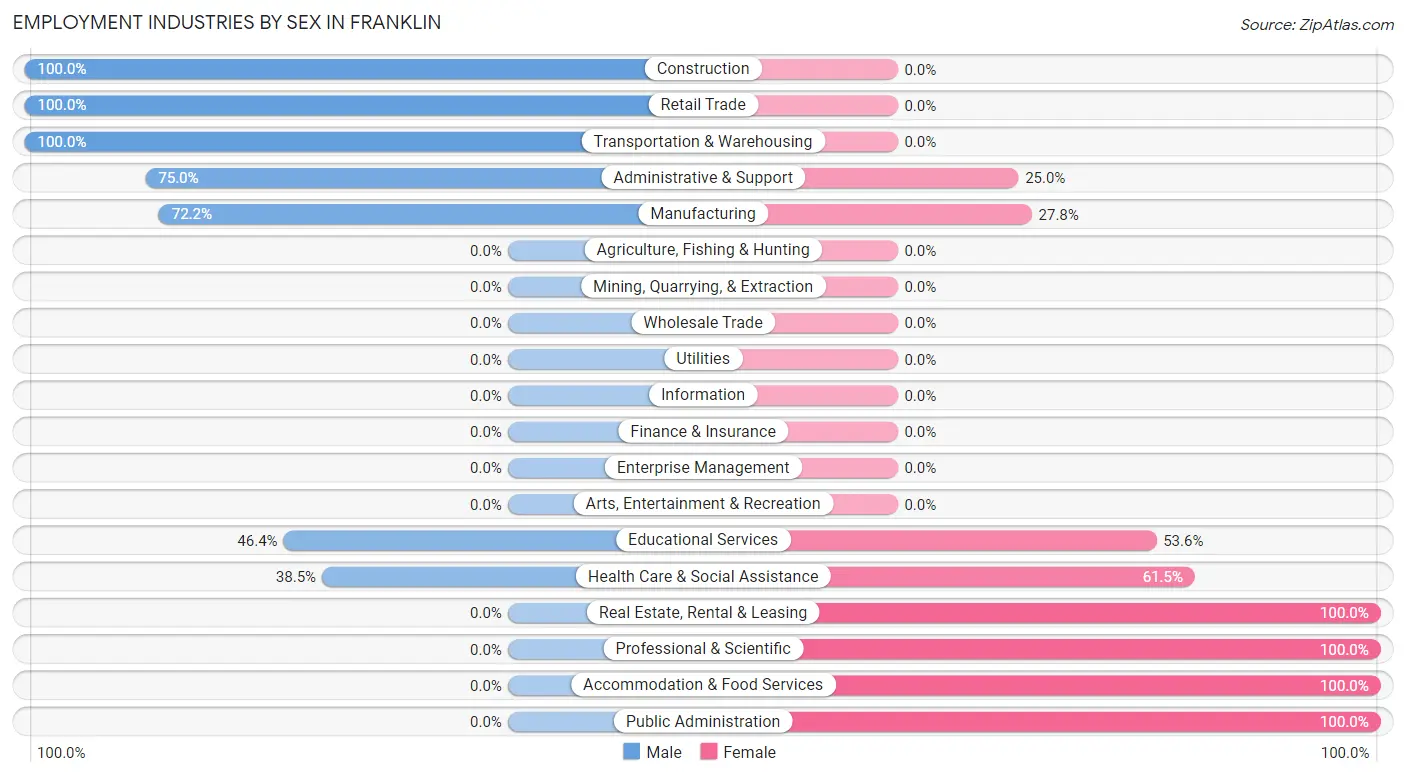
Employment Industries by Sex in Franklin
The Franklin industries that see more men than women are Construction (100.0%), Retail Trade (100.0%), and Transportation & Warehousing (100.0%), whereas the industries that tend to have a higher number of women are Real Estate, Rental & Leasing (100.0%), Professional & Scientific (100.0%), and Accommodation & Food Services (100.0%).
| Industry | Male | Female |
| Agriculture, Fishing & Hunting | 0 (0.0%) | 0 (0.0%) |
| Mining, Quarrying, & Extraction | 0 (0.0%) | 0 (0.0%) |
| Construction | 7 (100.0%) | 0 (0.0%) |
| Manufacturing | 13 (72.2%) | 5 (27.8%) |
| Wholesale Trade | 0 (0.0%) | 0 (0.0%) |
| Retail Trade | 5 (100.0%) | 0 (0.0%) |
| Transportation & Warehousing | 5 (100.0%) | 0 (0.0%) |
| Utilities | 0 (0.0%) | 0 (0.0%) |
| Information | 0 (0.0%) | 0 (0.0%) |
| Finance & Insurance | 0 (0.0%) | 0 (0.0%) |
| Real Estate, Rental & Leasing | 0 (0.0%) | 5 (100.0%) |
| Professional & Scientific | 0 (0.0%) | 8 (100.0%) |
| Enterprise Management | 0 (0.0%) | 0 (0.0%) |
| Administrative & Support | 12 (75.0%) | 4 (25.0%) |
| Educational Services | 13 (46.4%) | 15 (53.6%) |
| Health Care & Social Assistance | 5 (38.5%) | 8 (61.5%) |
| Arts, Entertainment & Recreation | 0 (0.0%) | 0 (0.0%) |
| Accommodation & Food Services | 0 (0.0%) | 13 (100.0%) |
| Public Administration | 0 (0.0%) | 3 (100.0%) |
| Total | 64 (48.1%) | 69 (51.9%) |
Education in Franklin
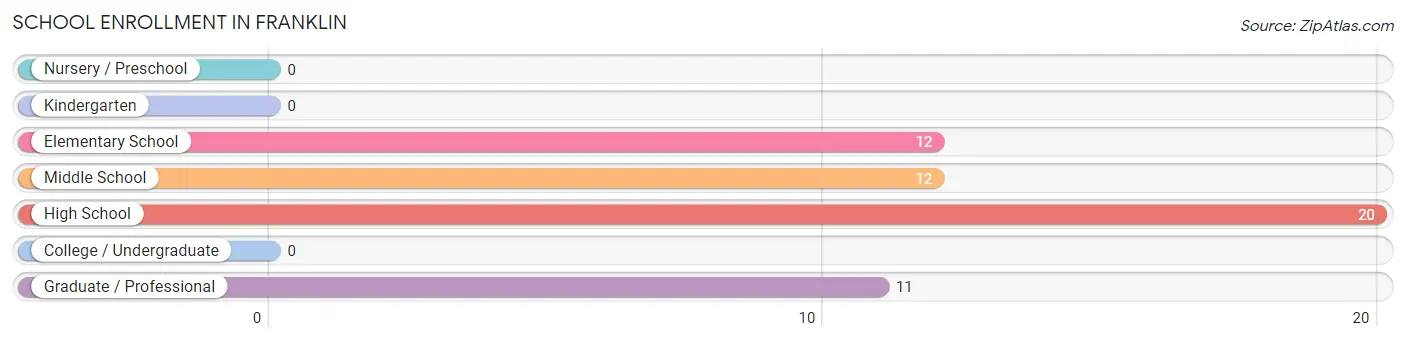
School Enrollment in Franklin
The most common levels of schooling among the 55 students in Franklin are high school (20 | 36.4%), elementary school (12 | 21.8%), and middle school (12 | 21.8%).
| School Level | # Students | % Students |
| Nursery / Preschool | 0 | 0.0% |
| Kindergarten | 0 | 0.0% |
| Elementary School | 12 | 21.8% |
| Middle School | 12 | 21.8% |
| High School | 20 | 36.4% |
| College / Undergraduate | 0 | 0.0% |
| Graduate / Professional | 11 | 20.0% |
| Total | 55 | 100.0% |
School Enrollment by Age by Funding Source in Franklin
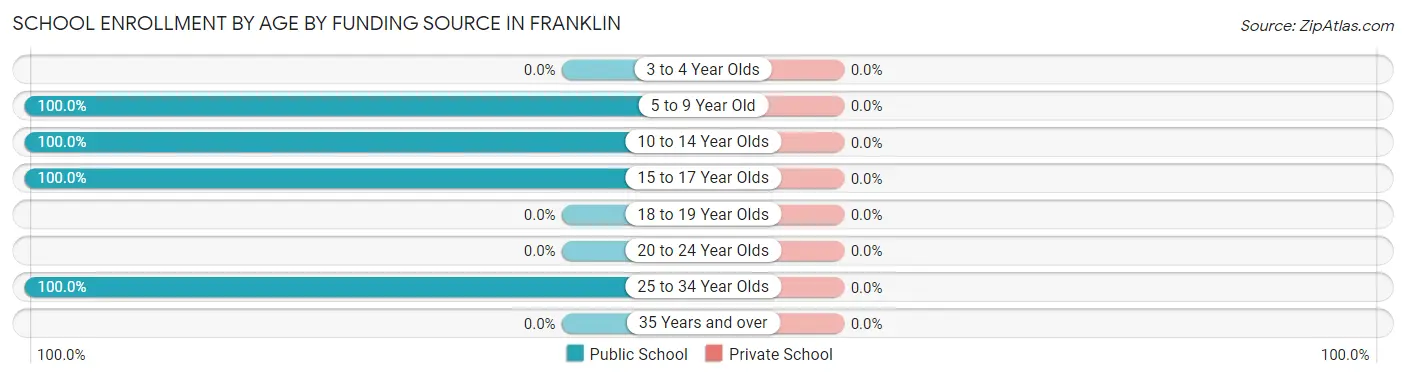
| Age Bracket | Public School | Private School |
| 3 to 4 Year Olds | 0 (0.0%) | 0 (0.0%) |
| 5 to 9 Year Old | 12 (100.0%) | 0 (0.0%) |
| 10 to 14 Year Olds | 18 (100.0%) | 0 (0.0%) |
| 15 to 17 Year Olds | 14 (100.0%) | 0 (0.0%) |
| 18 to 19 Year Olds | 0 (0.0%) | 0 (0.0%) |
| 20 to 24 Year Olds | 0 (0.0%) | 0 (0.0%) |
| 25 to 34 Year Olds | 11 (100.0%) | 0 (0.0%) |
| 35 Years and over | 0 (0.0%) | 0 (0.0%) |
| Total | 55 (100.0%) | 0 (0.0%) |
Educational Attainment by Field of Study in Franklin
Education (34 | 26.8%), science & technology (20 | 15.8%), psychology (16 | 12.6%), literature & languages (11 | 8.7%), and liberal arts & history (10 | 7.9%) are the most common fields of study among 127 individuals in Franklin who have obtained a bachelor's degree or higher.
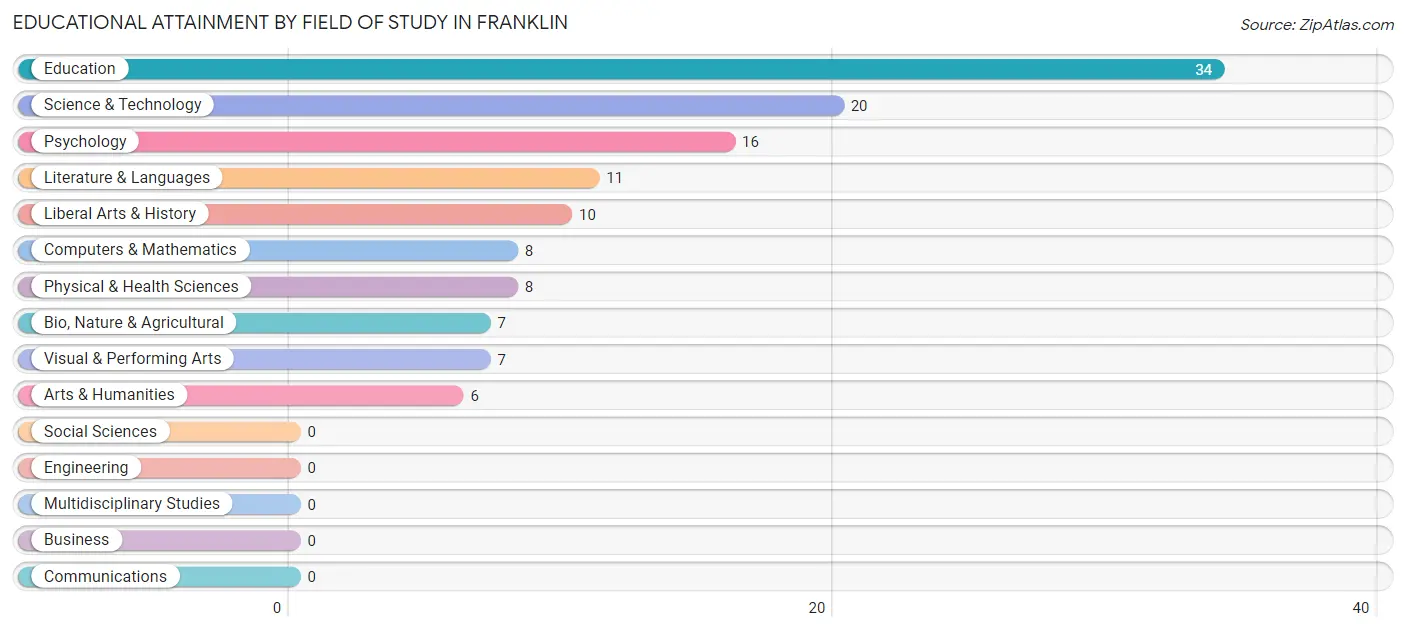
| Field of Study | # Graduates | % Graduates |
| Computers & Mathematics | 8 | 6.3% |
| Bio, Nature & Agricultural | 7 | 5.5% |
| Physical & Health Sciences | 8 | 6.3% |
| Psychology | 16 | 12.6% |
| Social Sciences | 0 | 0.0% |
| Engineering | 0 | 0.0% |
| Multidisciplinary Studies | 0 | 0.0% |
| Science & Technology | 20 | 15.8% |
| Business | 0 | 0.0% |
| Education | 34 | 26.8% |
| Literature & Languages | 11 | 8.7% |
| Liberal Arts & History | 10 | 7.9% |
| Visual & Performing Arts | 7 | 5.5% |
| Communications | 0 | 0.0% |
| Arts & Humanities | 6 | 4.7% |
| Total | 127 | 100.0% |
Transportation & Commute in Franklin
Vehicle Availability by Sex in Franklin
The most prevalent vehicle ownership categories in Franklin are males with 2 vehicles (31, accounting for 48.4%) and females with 2 vehicles (46, making up 44.9%).
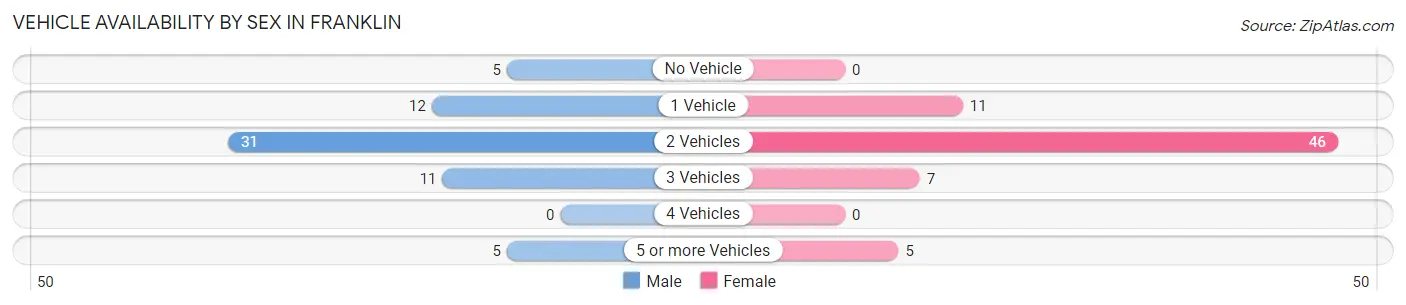
| Vehicles Available | Male | Female |
| No Vehicle | 5 (7.8%) | 0 (0.0%) |
| 1 Vehicle | 12 (18.8%) | 11 (15.9%) |
| 2 Vehicles | 31 (48.4%) | 46 (66.7%) |
| 3 Vehicles | 11 (17.2%) | 7 (10.1%) |
| 4 Vehicles | 0 (0.0%) | 0 (0.0%) |
| 5 or more Vehicles | 5 (7.8%) | 5 (7.2%) |
| Total | 64 (100.0%) | 69 (100.0%) |
Commute Time in Franklin
The most frequently occuring commute durations in Franklin are less than 5 minutes (45 commuters, 40.2%), 5 to 9 minutes (23 commuters, 20.5%), and 60 to 89 minutes (22 commuters, 19.6%).
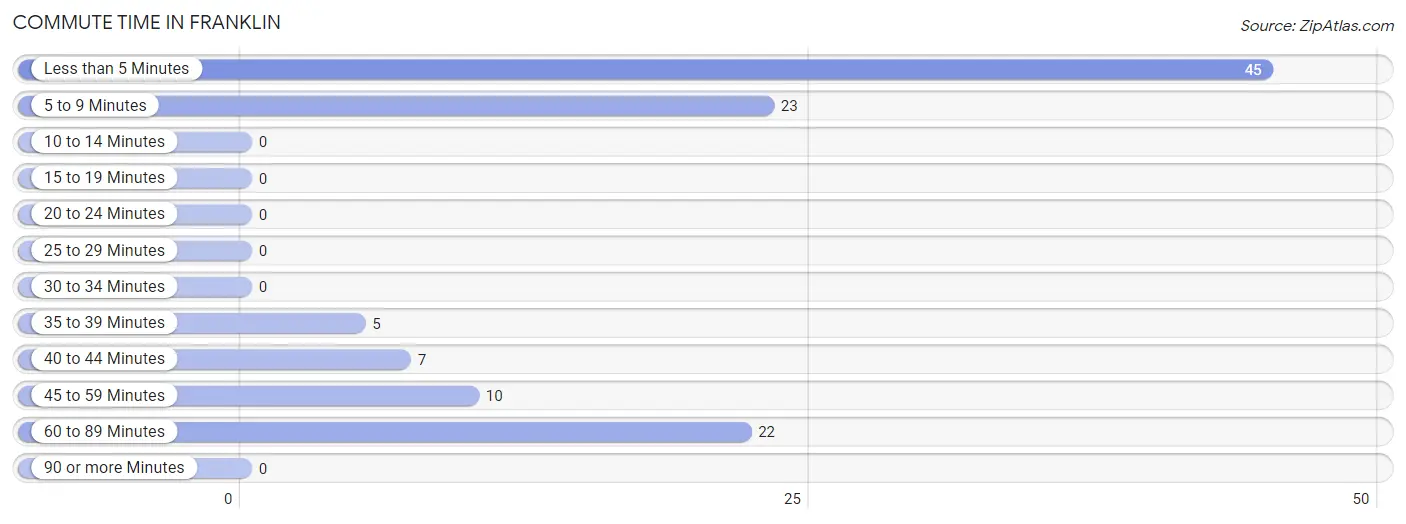
| Commute Time | # Commuters | % Commuters |
| Less than 5 Minutes | 45 | 40.2% |
| 5 to 9 Minutes | 23 | 20.5% |
| 10 to 14 Minutes | 0 | 0.0% |
| 15 to 19 Minutes | 0 | 0.0% |
| 20 to 24 Minutes | 0 | 0.0% |
| 25 to 29 Minutes | 0 | 0.0% |
| 30 to 34 Minutes | 0 | 0.0% |
| 35 to 39 Minutes | 5 | 4.5% |
| 40 to 44 Minutes | 7 | 6.2% |
| 45 to 59 Minutes | 10 | 8.9% |
| 60 to 89 Minutes | 22 | 19.6% |
| 90 or more Minutes | 0 | 0.0% |
Commute Time by Sex in Franklin
The most common commute times in Franklin are 60 to 89 minutes (18 commuters, 35.3%) for males and less than 5 minutes (34 commuters, 55.7%) for females.
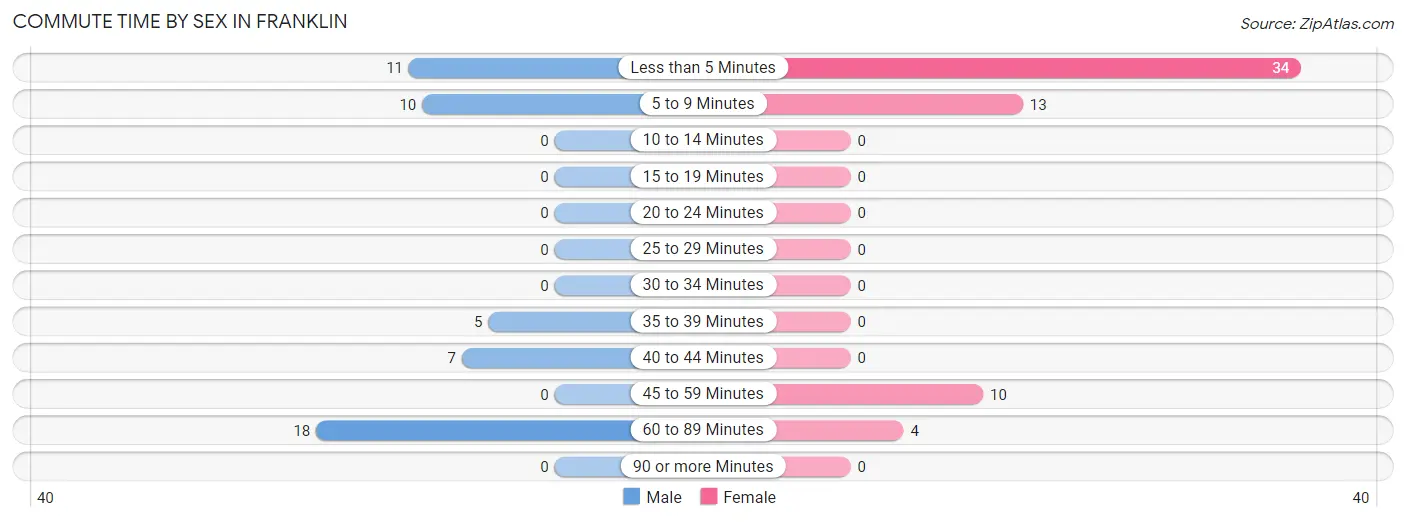
| Commute Time | Male | Female |
| Less than 5 Minutes | 11 (21.6%) | 34 (55.7%) |
| 5 to 9 Minutes | 10 (19.6%) | 13 (21.3%) |
| 10 to 14 Minutes | 0 (0.0%) | 0 (0.0%) |
| 15 to 19 Minutes | 0 (0.0%) | 0 (0.0%) |
| 20 to 24 Minutes | 0 (0.0%) | 0 (0.0%) |
| 25 to 29 Minutes | 0 (0.0%) | 0 (0.0%) |
| 30 to 34 Minutes | 0 (0.0%) | 0 (0.0%) |
| 35 to 39 Minutes | 5 (9.8%) | 0 (0.0%) |
| 40 to 44 Minutes | 7 (13.7%) | 0 (0.0%) |
| 45 to 59 Minutes | 0 (0.0%) | 10 (16.4%) |
| 60 to 89 Minutes | 18 (35.3%) | 4 (6.6%) |
| 90 or more Minutes | 0 (0.0%) | 0 (0.0%) |
Time of Departure to Work by Sex in Franklin
The most frequent times of departure to work in Franklin are 12:00 AM to 4:59 AM (12, 23.5%) for males and 7:00 AM to 7:29 AM (13, 21.3%) for females.
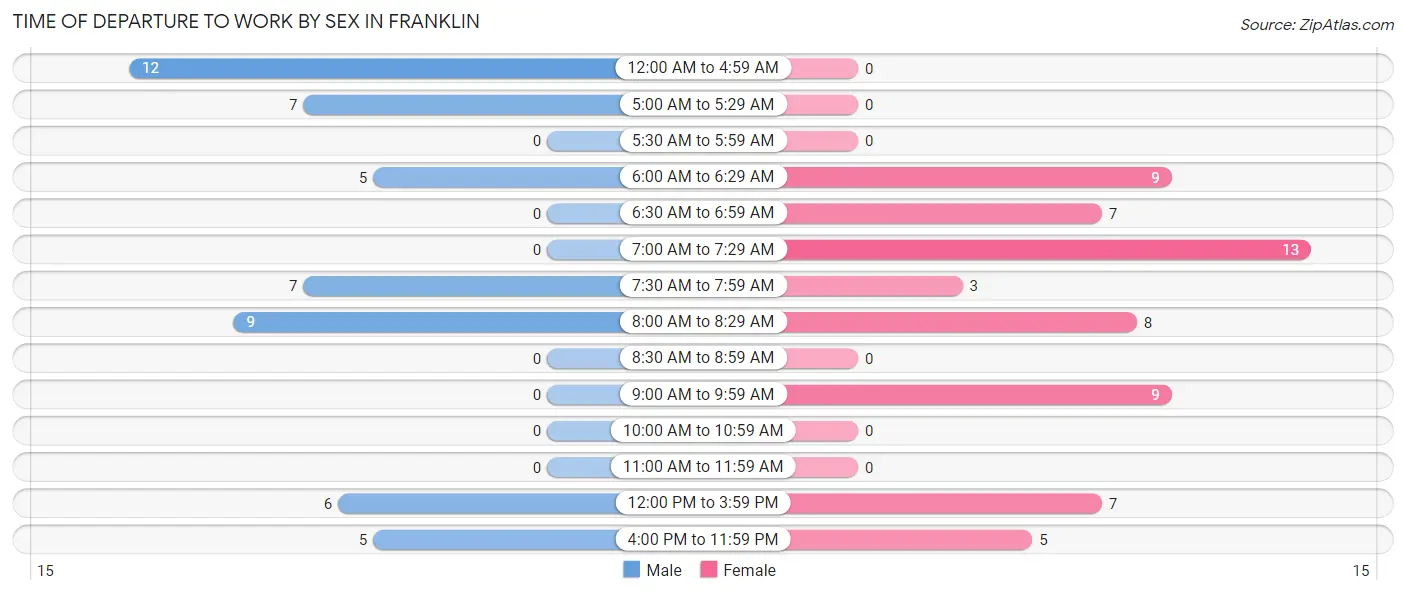
| Time of Departure | Male | Female |
| 12:00 AM to 4:59 AM | 12 (23.5%) | 0 (0.0%) |
| 5:00 AM to 5:29 AM | 7 (13.7%) | 0 (0.0%) |
| 5:30 AM to 5:59 AM | 0 (0.0%) | 0 (0.0%) |
| 6:00 AM to 6:29 AM | 5 (9.8%) | 9 (14.7%) |
| 6:30 AM to 6:59 AM | 0 (0.0%) | 7 (11.5%) |
| 7:00 AM to 7:29 AM | 0 (0.0%) | 13 (21.3%) |
| 7:30 AM to 7:59 AM | 7 (13.7%) | 3 (4.9%) |
| 8:00 AM to 8:29 AM | 9 (17.6%) | 8 (13.1%) |
| 8:30 AM to 8:59 AM | 0 (0.0%) | 0 (0.0%) |
| 9:00 AM to 9:59 AM | 0 (0.0%) | 9 (14.7%) |
| 10:00 AM to 10:59 AM | 0 (0.0%) | 0 (0.0%) |
| 11:00 AM to 11:59 AM | 0 (0.0%) | 0 (0.0%) |
| 12:00 PM to 3:59 PM | 6 (11.8%) | 7 (11.5%) |
| 4:00 PM to 11:59 PM | 5 (9.8%) | 5 (8.2%) |
| Total | 51 (100.0%) | 61 (100.0%) |
Housing Occupancy in Franklin
Occupancy by Ownership in Franklin
Of the total 134 dwellings in Franklin, owner-occupied units account for 72 (53.7%), while renter-occupied units make up 62 (46.3%).
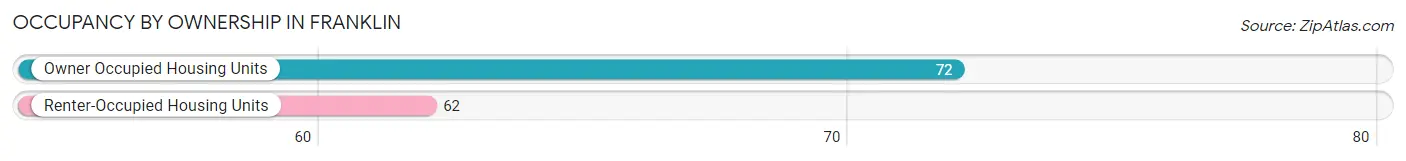
| Occupancy | # Housing Units | % Housing Units |
| Owner Occupied Housing Units | 72 | 53.7% |
| Renter-Occupied Housing Units | 62 | 46.3% |
| Total Occupied Housing Units | 134 | 100.0% |
Occupancy by Household Size in Franklin
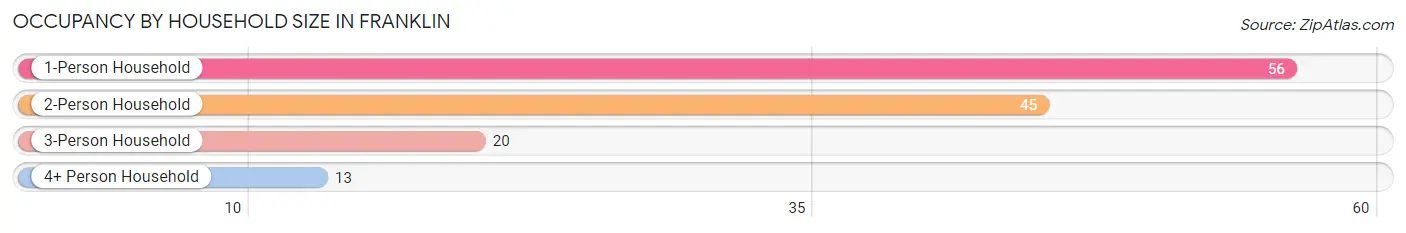
| Household Size | # Housing Units | % Housing Units |
| 1-Person Household | 56 | 41.8% |
| 2-Person Household | 45 | 33.6% |
| 3-Person Household | 20 | 14.9% |
| 4+ Person Household | 13 | 9.7% |
| Total Housing Units | 134 | 100.0% |
Occupancy by Ownership by Household Size in Franklin
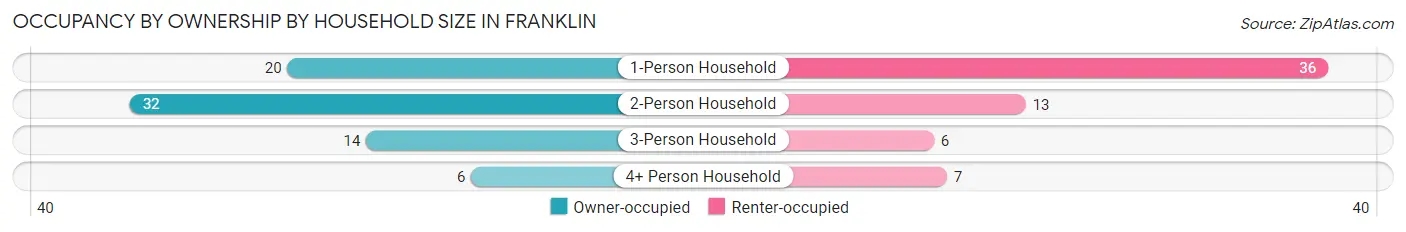
| Household Size | Owner-occupied | Renter-occupied |
| 1-Person Household | 20 (35.7%) | 36 (64.3%) |
| 2-Person Household | 32 (71.1%) | 13 (28.9%) |
| 3-Person Household | 14 (70.0%) | 6 (30.0%) |
| 4+ Person Household | 6 (46.2%) | 7 (53.8%) |
| Total Housing Units | 72 (53.7%) | 62 (46.3%) |
Occupancy by Educational Attainment in Franklin
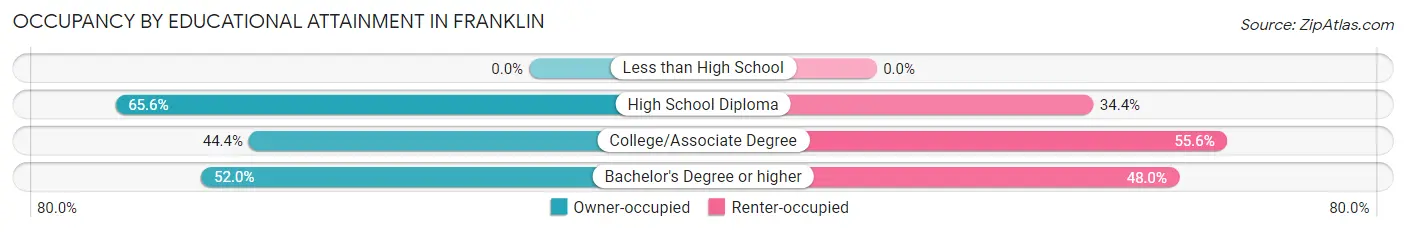
| Household Size | Owner-occupied | Renter-occupied |
| Less than High School | 0 (0.0%) | 0 (0.0%) |
| High School Diploma | 21 (65.6%) | 11 (34.4%) |
| College/Associate Degree | 12 (44.4%) | 15 (55.6%) |
| Bachelor's Degree or higher | 39 (52.0%) | 36 (48.0%) |
Occupancy by Age of Householder in Franklin
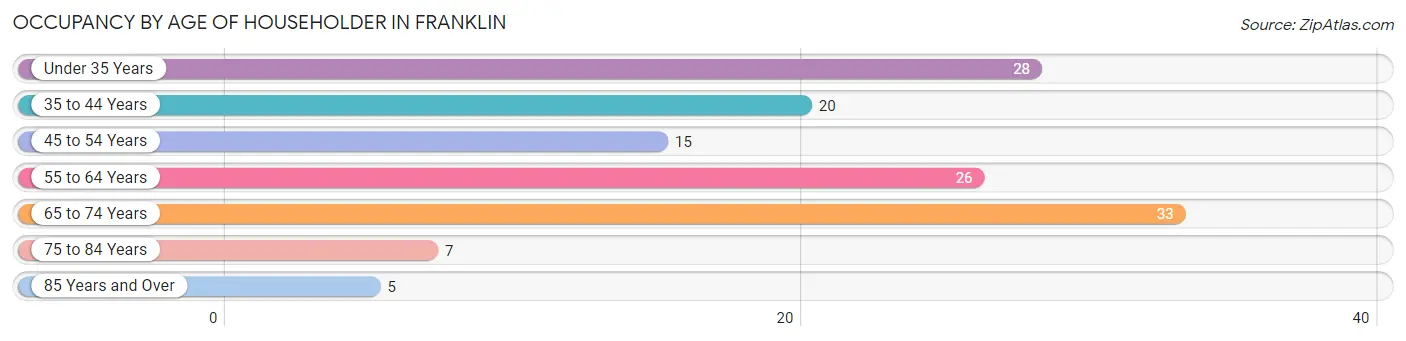
| Age Bracket | # Households | % Households |
| Under 35 Years | 28 | 20.9% |
| 35 to 44 Years | 20 | 14.9% |
| 45 to 54 Years | 15 | 11.2% |
| 55 to 64 Years | 26 | 19.4% |
| 65 to 74 Years | 33 | 24.6% |
| 75 to 84 Years | 7 | 5.2% |
| 85 Years and Over | 5 | 3.7% |
| Total | 134 | 100.0% |
Housing Finances in Franklin
Median Income by Occupancy in Franklin
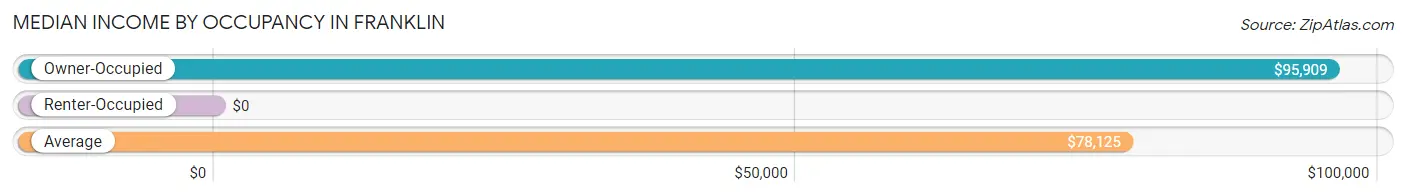
| Occupancy Type | # Households | Median Income |
| Owner-Occupied | 72 (53.7%) | $95,909 |
| Renter-Occupied | 62 (46.3%) | $0 |
| Average | 134 (100.0%) | $78,125 |
Occupancy by Householder Income Bracket in Franklin
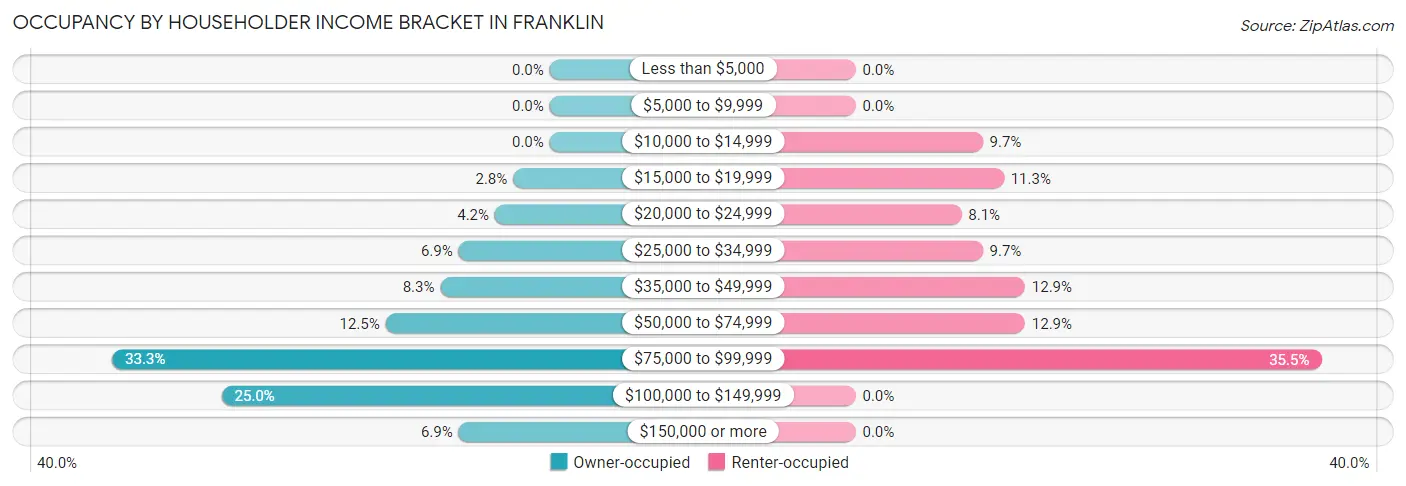
| Income Bracket | Owner-occupied | Renter-occupied |
| Less than $5,000 | 0 (0.0%) | 0 (0.0%) |
| $5,000 to $9,999 | 0 (0.0%) | 0 (0.0%) |
| $10,000 to $14,999 | 0 (0.0%) | 6 (9.7%) |
| $15,000 to $19,999 | 2 (2.8%) | 7 (11.3%) |
| $20,000 to $24,999 | 3 (4.2%) | 5 (8.1%) |
| $25,000 to $34,999 | 5 (6.9%) | 6 (9.7%) |
| $35,000 to $49,999 | 6 (8.3%) | 8 (12.9%) |
| $50,000 to $74,999 | 9 (12.5%) | 8 (12.9%) |
| $75,000 to $99,999 | 24 (33.3%) | 22 (35.5%) |
| $100,000 to $149,999 | 18 (25.0%) | 0 (0.0%) |
| $150,000 or more | 5 (6.9%) | 0 (0.0%) |
| Total | 72 (100.0%) | 62 (100.0%) |
Monthly Housing Cost Tiers in Franklin
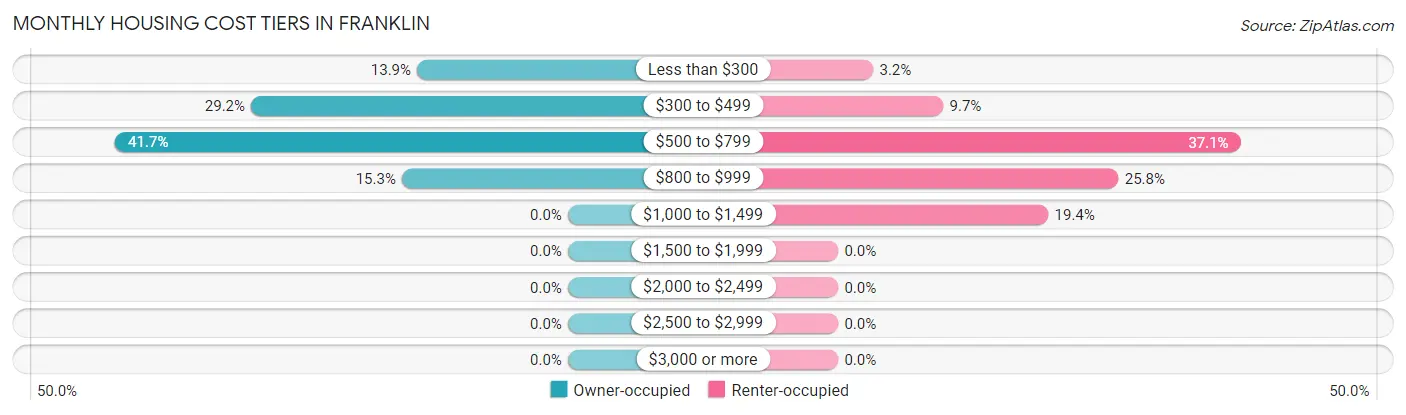
| Monthly Cost | Owner-occupied | Renter-occupied |
| Less than $300 | 10 (13.9%) | 2 (3.2%) |
| $300 to $499 | 21 (29.2%) | 6 (9.7%) |
| $500 to $799 | 30 (41.7%) | 23 (37.1%) |
| $800 to $999 | 11 (15.3%) | 16 (25.8%) |
| $1,000 to $1,499 | 0 (0.0%) | 12 (19.4%) |
| $1,500 to $1,999 | 0 (0.0%) | 0 (0.0%) |
| $2,000 to $2,499 | 0 (0.0%) | 0 (0.0%) |
| $2,500 to $2,999 | 0 (0.0%) | 0 (0.0%) |
| $3,000 or more | 0 (0.0%) | 0 (0.0%) |
| Total | 72 (100.0%) | 62 (100.0%) |
Physical Housing Characteristics in Franklin
Housing Structures in Franklin
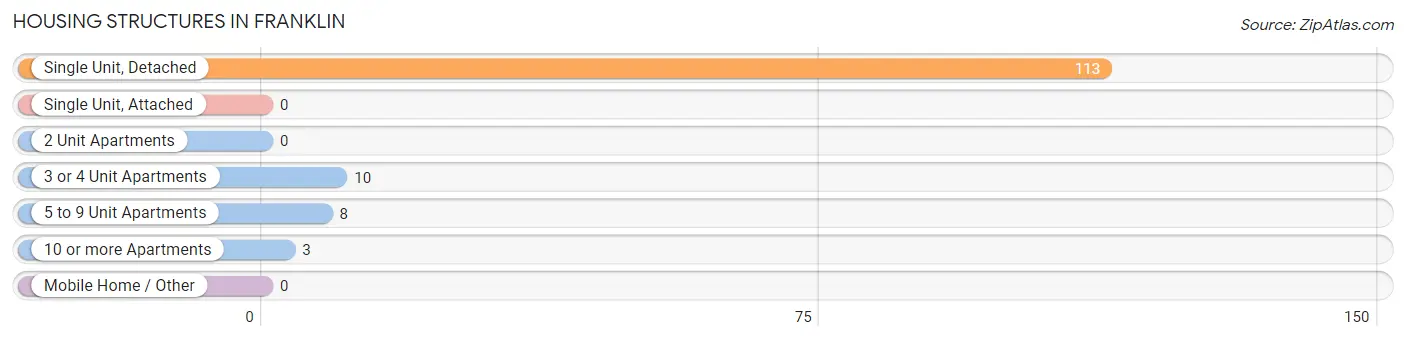
| Structure Type | # Housing Units | % Housing Units |
| Single Unit, Detached | 113 | 84.3% |
| Single Unit, Attached | 0 | 0.0% |
| 2 Unit Apartments | 0 | 0.0% |
| 3 or 4 Unit Apartments | 10 | 7.5% |
| 5 to 9 Unit Apartments | 8 | 6.0% |
| 10 or more Apartments | 3 | 2.2% |
| Mobile Home / Other | 0 | 0.0% |
| Total | 134 | 100.0% |
Housing Structures by Occupancy in Franklin
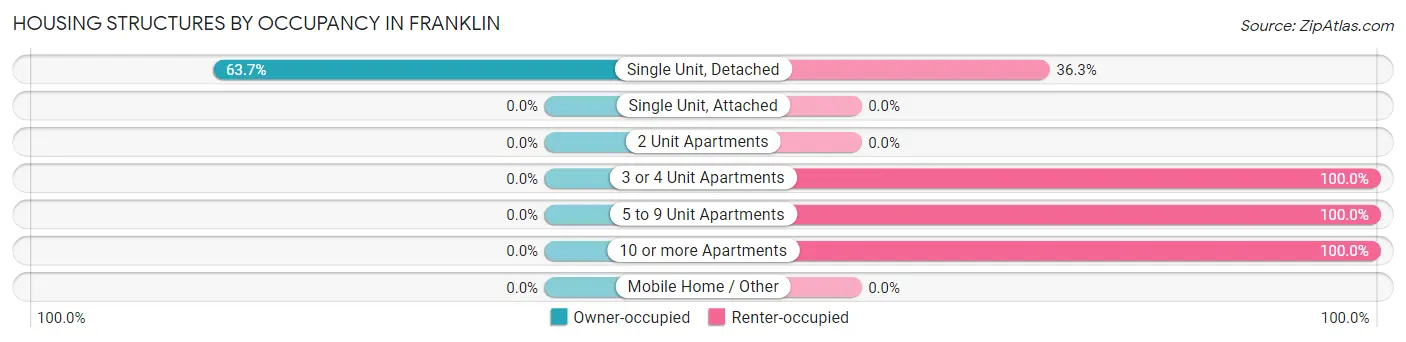
| Structure Type | Owner-occupied | Renter-occupied |
| Single Unit, Detached | 72 (63.7%) | 41 (36.3%) |
| Single Unit, Attached | 0 (0.0%) | 0 (0.0%) |
| 2 Unit Apartments | 0 (0.0%) | 0 (0.0%) |
| 3 or 4 Unit Apartments | 0 (0.0%) | 10 (100.0%) |
| 5 to 9 Unit Apartments | 0 (0.0%) | 8 (100.0%) |
| 10 or more Apartments | 0 (0.0%) | 3 (100.0%) |
| Mobile Home / Other | 0 (0.0%) | 0 (0.0%) |
| Total | 72 (53.7%) | 62 (46.3%) |
Housing Structures by Number of Rooms in Franklin
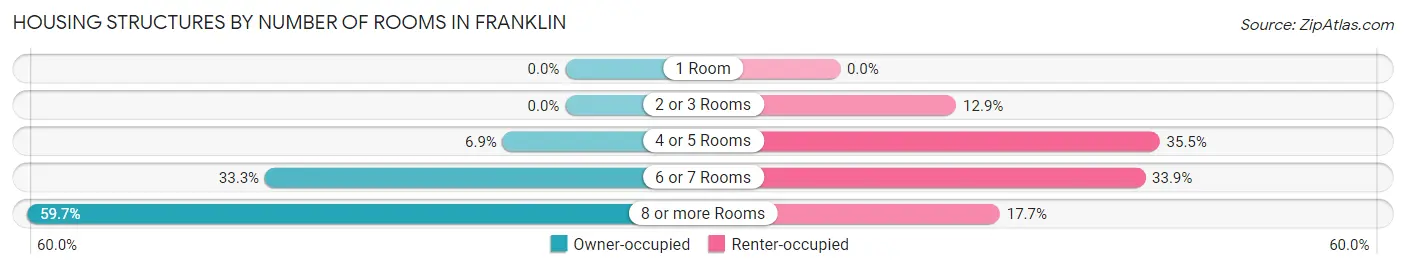
| Number of Rooms | Owner-occupied | Renter-occupied |
| 1 Room | 0 (0.0%) | 0 (0.0%) |
| 2 or 3 Rooms | 0 (0.0%) | 8 (12.9%) |
| 4 or 5 Rooms | 5 (6.9%) | 22 (35.5%) |
| 6 or 7 Rooms | 24 (33.3%) | 21 (33.9%) |
| 8 or more Rooms | 43 (59.7%) | 11 (17.7%) |
| Total | 72 (100.0%) | 62 (100.0%) |
Housing Structure by Heating Type in Franklin
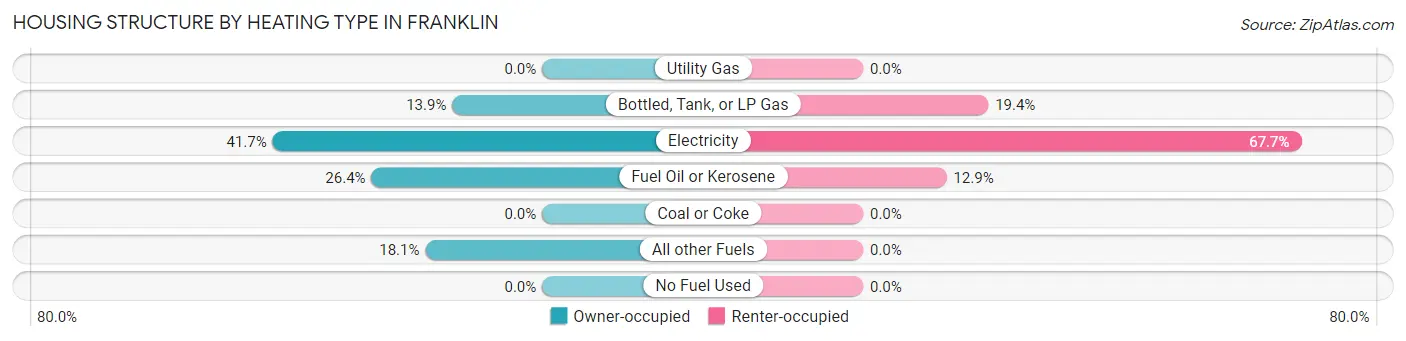
| Heating Type | Owner-occupied | Renter-occupied |
| Utility Gas | 0 (0.0%) | 0 (0.0%) |
| Bottled, Tank, or LP Gas | 10 (13.9%) | 12 (19.4%) |
| Electricity | 30 (41.7%) | 42 (67.7%) |
| Fuel Oil or Kerosene | 19 (26.4%) | 8 (12.9%) |
| Coal or Coke | 0 (0.0%) | 0 (0.0%) |
| All other Fuels | 13 (18.1%) | 0 (0.0%) |
| No Fuel Used | 0 (0.0%) | 0 (0.0%) |
| Total | 72 (100.0%) | 62 (100.0%) |
Household Vehicle Usage in Franklin
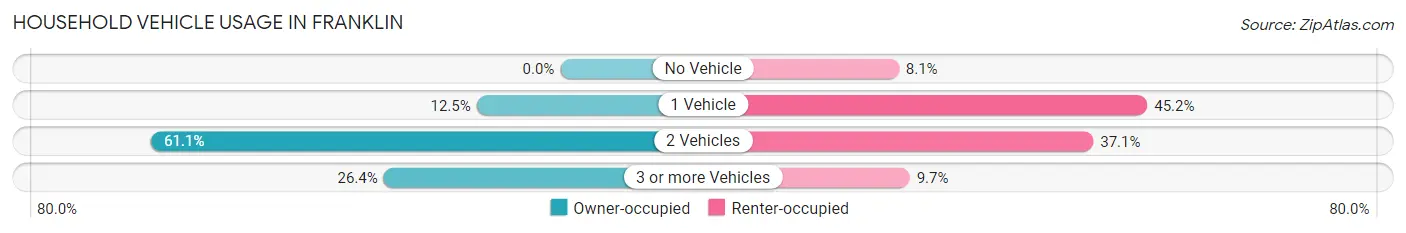
| Vehicles per Household | Owner-occupied | Renter-occupied |
| No Vehicle | 0 (0.0%) | 5 (8.1%) |
| 1 Vehicle | 9 (12.5%) | 28 (45.2%) |
| 2 Vehicles | 44 (61.1%) | 23 (37.1%) |
| 3 or more Vehicles | 19 (26.4%) | 6 (9.7%) |
| Total | 72 (100.0%) | 62 (100.0%) |
Real Estate & Mortgages in Franklin
Real Estate and Mortgage Overview in Franklin
| Characteristic | Without Mortgage | With Mortgage |
| Housing Units | 46 | 26 |
| Median Property Value | $215,200 | $125,000 |
| Median Household Income | $96,364 | $0 |
| Monthly Housing Costs | $420 | $0 |
| Real Estate Taxes | $900 | $6 |
Property Value by Mortgage Status in Franklin
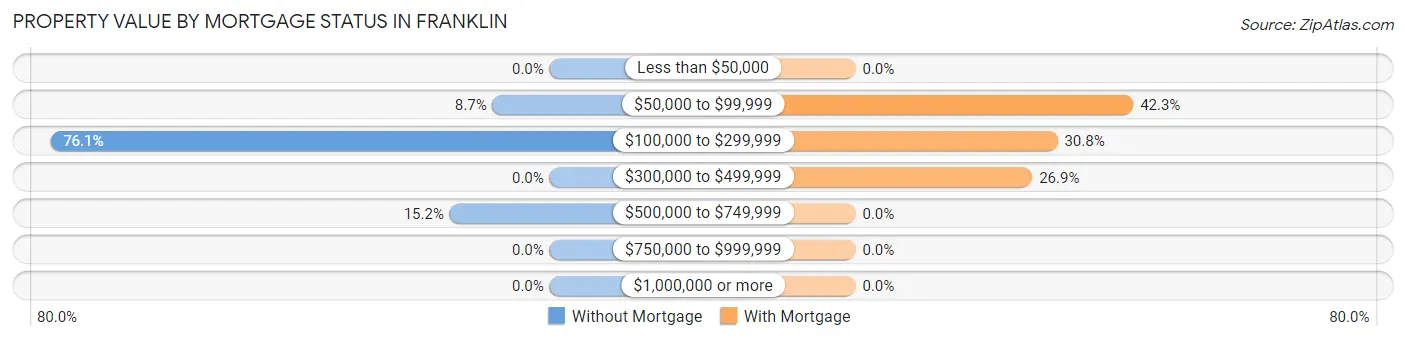
| Property Value | Without Mortgage | With Mortgage |
| Less than $50,000 | 0 (0.0%) | 0 (0.0%) |
| $50,000 to $99,999 | 4 (8.7%) | 11 (42.3%) |
| $100,000 to $299,999 | 35 (76.1%) | 8 (30.8%) |
| $300,000 to $499,999 | 0 (0.0%) | 7 (26.9%) |
| $500,000 to $749,999 | 7 (15.2%) | 0 (0.0%) |
| $750,000 to $999,999 | 0 (0.0%) | 0 (0.0%) |
| $1,000,000 or more | 0 (0.0%) | 0 (0.0%) |
| Total | 46 (100.0%) | 26 (100.0%) |
Household Income by Mortgage Status in Franklin
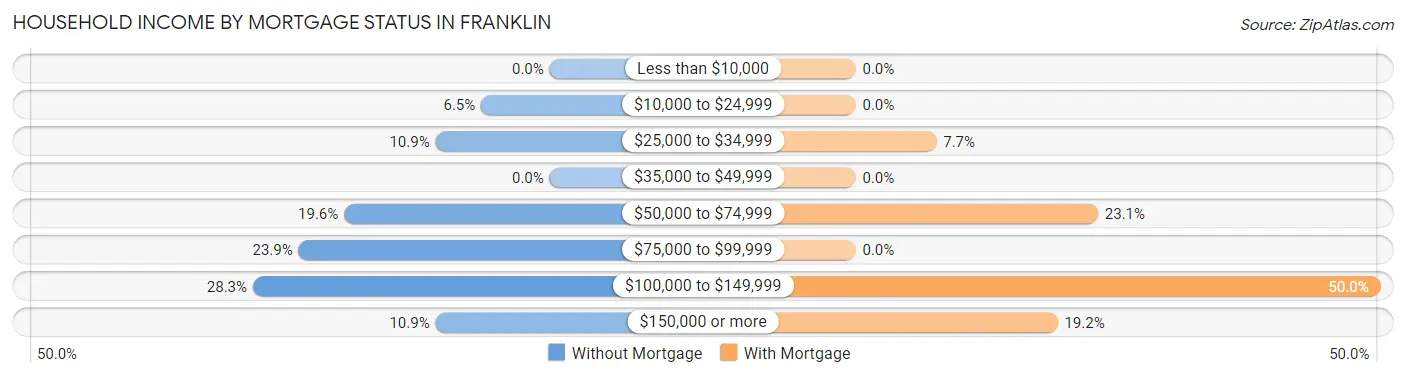
| Household Income | Without Mortgage | With Mortgage |
| Less than $10,000 | 0 (0.0%) | 0 (0.0%) |
| $10,000 to $24,999 | 3 (6.5%) | 0 (0.0%) |
| $25,000 to $34,999 | 5 (10.9%) | 2 (7.7%) |
| $35,000 to $49,999 | 0 (0.0%) | 0 (0.0%) |
| $50,000 to $74,999 | 9 (19.6%) | 6 (23.1%) |
| $75,000 to $99,999 | 11 (23.9%) | 0 (0.0%) |
| $100,000 to $149,999 | 13 (28.3%) | 13 (50.0%) |
| $150,000 or more | 5 (10.9%) | 5 (19.2%) |
| Total | 46 (100.0%) | 26 (100.0%) |
Property Value to Household Income Ratio in Franklin
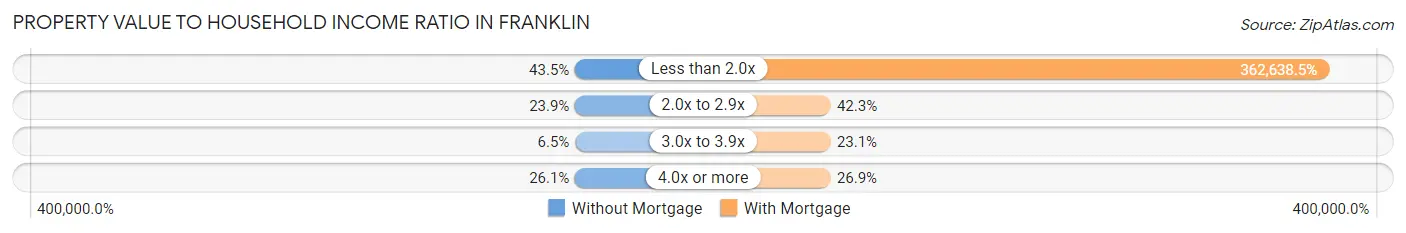
| Value-to-Income Ratio | Without Mortgage | With Mortgage |
| Less than 2.0x | 20 (43.5%) | 94,286 (362,638.5%) |
| 2.0x to 2.9x | 11 (23.9%) | 11 (42.3%) |
| 3.0x to 3.9x | 3 (6.5%) | 6 (23.1%) |
| 4.0x or more | 12 (26.1%) | 7 (26.9%) |
| Total | 46 (100.0%) | 26 (100.0%) |
Real Estate Taxes by Mortgage Status in Franklin
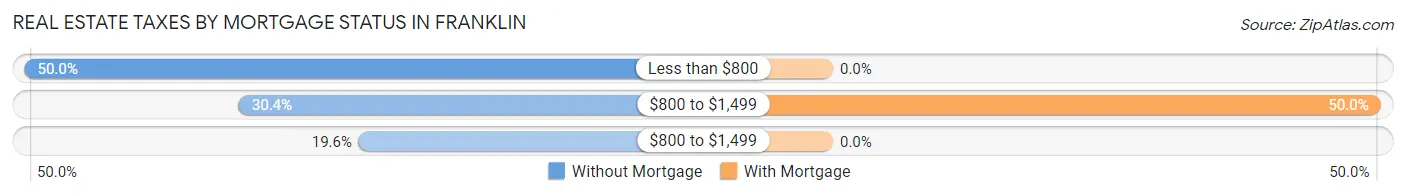
| Property Taxes | Without Mortgage | With Mortgage |
| Less than $800 | 23 (50.0%) | 0 (0.0%) |
| $800 to $1,499 | 14 (30.4%) | 13 (50.0%) |
| $800 to $1,499 | 9 (19.6%) | 0 (0.0%) |
| Total | 46 (100.0%) | 26 (100.0%) |
Health & Disability in Franklin
Health Insurance Coverage by Age in Franklin
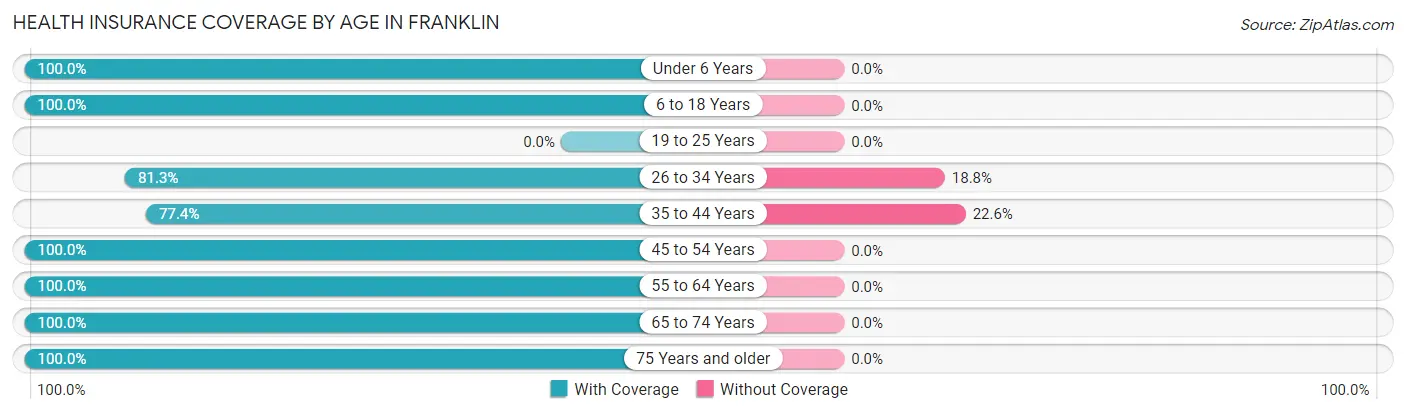
| Age Bracket | With Coverage | Without Coverage |
| Under 6 Years | 9 (100.0%) | 0 (0.0%) |
| 6 to 18 Years | 44 (100.0%) | 0 (0.0%) |
| 19 to 25 Years | 0 (0.0%) | 0 (0.0%) |
| 26 to 34 Years | 39 (81.2%) | 9 (18.8%) |
| 35 to 44 Years | 41 (77.4%) | 12 (22.6%) |
| 45 to 54 Years | 28 (100.0%) | 0 (0.0%) |
| 55 to 64 Years | 33 (100.0%) | 0 (0.0%) |
| 65 to 74 Years | 53 (100.0%) | 0 (0.0%) |
| 75 Years and older | 21 (100.0%) | 0 (0.0%) |
| Total | 268 (92.7%) | 21 (7.3%) |
Health Insurance Coverage by Citizenship Status in Franklin
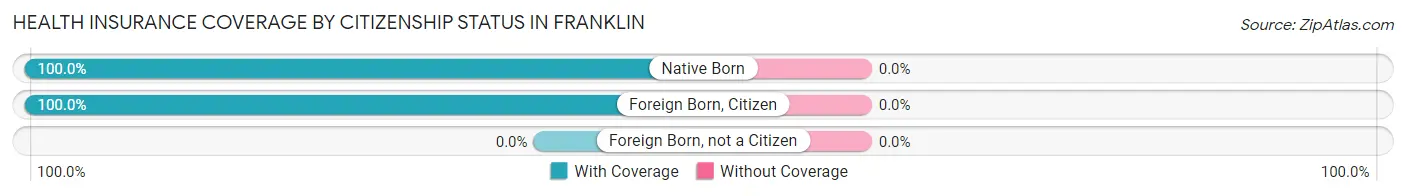
| Citizenship Status | With Coverage | Without Coverage |
| Native Born | 9 (100.0%) | 0 (0.0%) |
| Foreign Born, Citizen | 44 (100.0%) | 0 (0.0%) |
| Foreign Born, not a Citizen | 0 (0.0%) | 0 (0.0%) |
Health Insurance Coverage by Household Income in Franklin
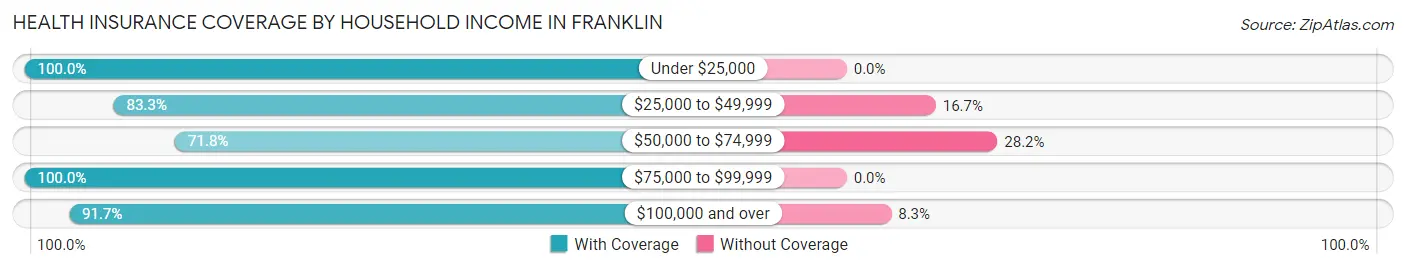
| Household Income | With Coverage | Without Coverage |
| Under $25,000 | 48 (100.0%) | 0 (0.0%) |
| $25,000 to $49,999 | 25 (83.3%) | 5 (16.7%) |
| $50,000 to $74,999 | 28 (71.8%) | 11 (28.2%) |
| $75,000 to $99,999 | 101 (100.0%) | 0 (0.0%) |
| $100,000 and over | 55 (91.7%) | 5 (8.3%) |
Public vs Private Health Insurance Coverage by Age in Franklin
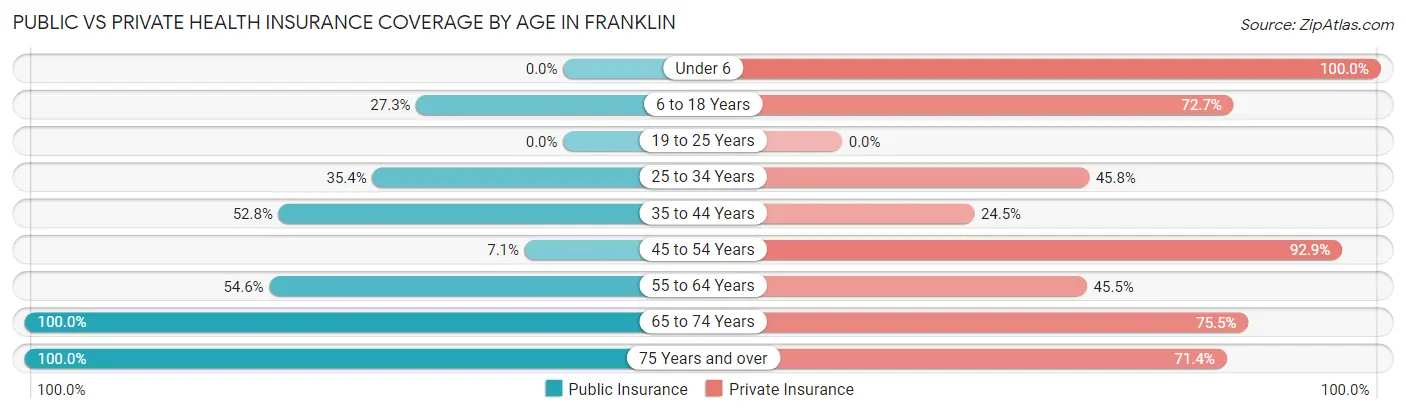
| Age Bracket | Public Insurance | Private Insurance |
| Under 6 | 0 (0.0%) | 9 (100.0%) |
| 6 to 18 Years | 12 (27.3%) | 32 (72.7%) |
| 19 to 25 Years | 0 (0.0%) | 0 (0.0%) |
| 25 to 34 Years | 17 (35.4%) | 22 (45.8%) |
| 35 to 44 Years | 28 (52.8%) | 13 (24.5%) |
| 45 to 54 Years | 2 (7.1%) | 26 (92.9%) |
| 55 to 64 Years | 18 (54.5%) | 15 (45.5%) |
| 65 to 74 Years | 53 (100.0%) | 40 (75.5%) |
| 75 Years and over | 21 (100.0%) | 15 (71.4%) |
| Total | 151 (52.2%) | 172 (59.5%) |
Disability Status by Sex by Age in Franklin
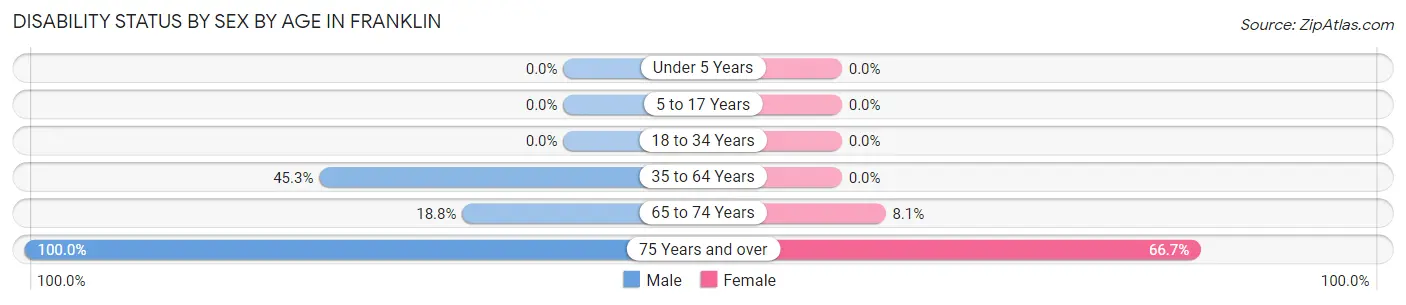
| Age Bracket | Male | Female |
| Under 5 Years | 0 (0.0%) | 0 (0.0%) |
| 5 to 17 Years | 0 (0.0%) | 0 (0.0%) |
| 18 to 34 Years | 0 (0.0%) | 0 (0.0%) |
| 35 to 64 Years | 29 (45.3%) | 0 (0.0%) |
| 65 to 74 Years | 3 (18.8%) | 3 (8.1%) |
| 75 Years and over | 9 (100.0%) | 8 (66.7%) |
Disability Class by Sex by Age in Franklin
Disability Class: Hearing Difficulty
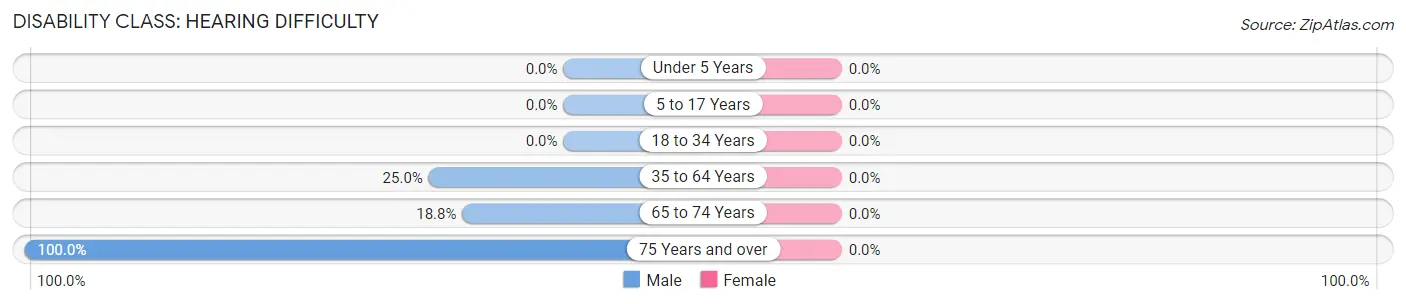
| Age Bracket | Male | Female |
| Under 5 Years | 0 (0.0%) | 0 (0.0%) |
| 5 to 17 Years | 0 (0.0%) | 0 (0.0%) |
| 18 to 34 Years | 0 (0.0%) | 0 (0.0%) |
| 35 to 64 Years | 16 (25.0%) | 0 (0.0%) |
| 65 to 74 Years | 3 (18.8%) | 0 (0.0%) |
| 75 Years and over | 9 (100.0%) | 0 (0.0%) |
Disability Class: Vision Difficulty
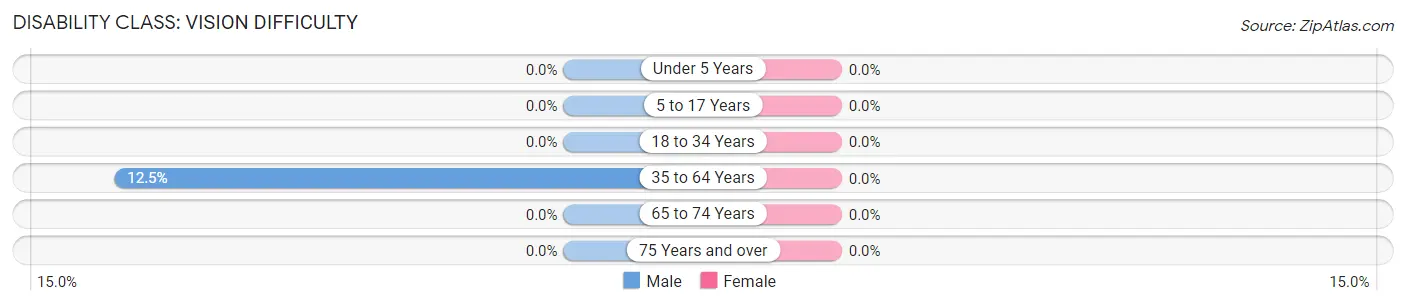
| Age Bracket | Male | Female |
| Under 5 Years | 0 (0.0%) | 0 (0.0%) |
| 5 to 17 Years | 0 (0.0%) | 0 (0.0%) |
| 18 to 34 Years | 0 (0.0%) | 0 (0.0%) |
| 35 to 64 Years | 8 (12.5%) | 0 (0.0%) |
| 65 to 74 Years | 0 (0.0%) | 0 (0.0%) |
| 75 Years and over | 0 (0.0%) | 0 (0.0%) |
Disability Class: Cognitive Difficulty
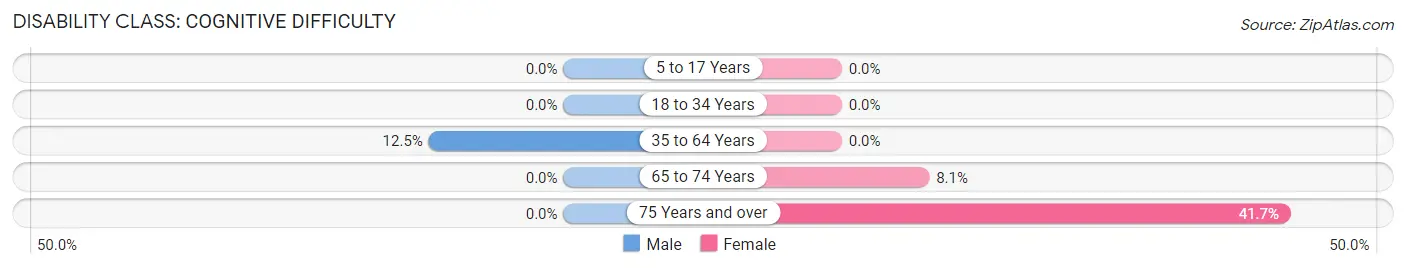
| Age Bracket | Male | Female |
| 5 to 17 Years | 0 (0.0%) | 0 (0.0%) |
| 18 to 34 Years | 0 (0.0%) | 0 (0.0%) |
| 35 to 64 Years | 8 (12.5%) | 0 (0.0%) |
| 65 to 74 Years | 0 (0.0%) | 3 (8.1%) |
| 75 Years and over | 0 (0.0%) | 5 (41.7%) |
Disability Class: Ambulatory Difficulty
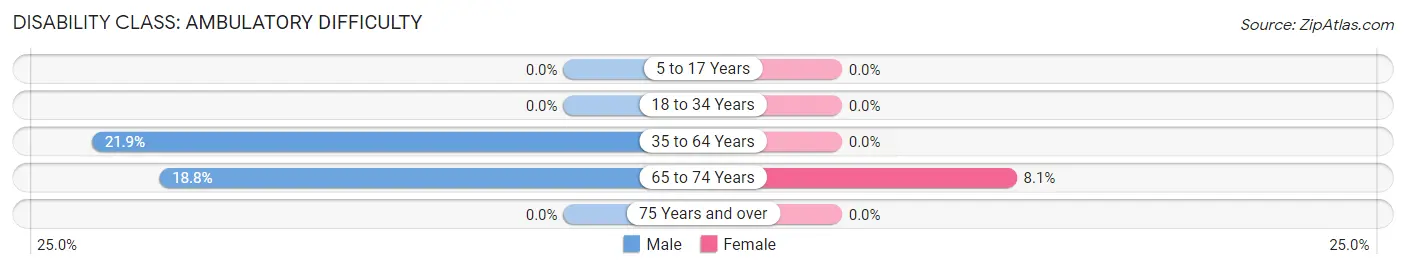
| Age Bracket | Male | Female |
| 5 to 17 Years | 0 (0.0%) | 0 (0.0%) |
| 18 to 34 Years | 0 (0.0%) | 0 (0.0%) |
| 35 to 64 Years | 14 (21.9%) | 0 (0.0%) |
| 65 to 74 Years | 3 (18.8%) | 3 (8.1%) |
| 75 Years and over | 0 (0.0%) | 0 (0.0%) |
Disability Class: Self-Care Difficulty

| Age Bracket | Male | Female |
| 5 to 17 Years | 0 (0.0%) | 0 (0.0%) |
| 18 to 34 Years | 0 (0.0%) | 0 (0.0%) |
| 35 to 64 Years | 15 (23.4%) | 0 (0.0%) |
| 65 to 74 Years | 0 (0.0%) | 3 (8.1%) |
| 75 Years and over | 0 (0.0%) | 0 (0.0%) |
Technology Access in Franklin
Computing Device Access in Franklin
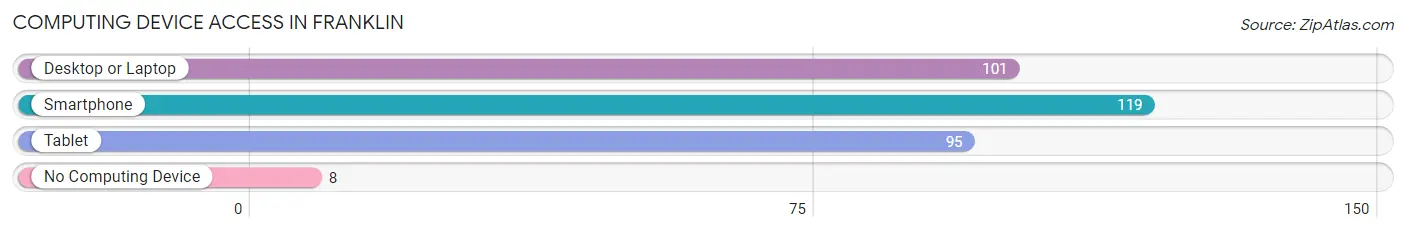
| Device Type | # Households | % Households |
| Desktop or Laptop | 101 | 75.4% |
| Smartphone | 119 | 88.8% |
| Tablet | 95 | 70.9% |
| No Computing Device | 8 | 6.0% |
| Total | 134 | 100.0% |
Internet Access in Franklin
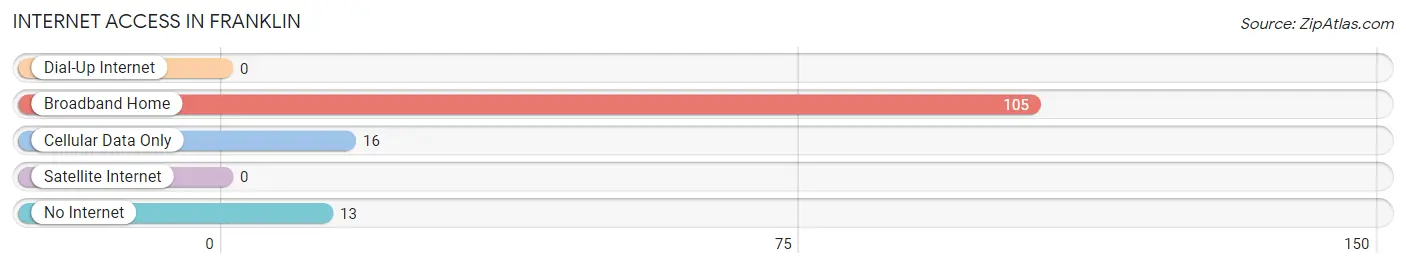
| Internet Type | # Households | % Households |
| Dial-Up Internet | 0 | 0.0% |
| Broadband Home | 105 | 78.4% |
| Cellular Data Only | 16 | 11.9% |
| Satellite Internet | 0 | 0.0% |
| No Internet | 13 | 9.7% |
| Total | 134 | 100.0% |
Franklin Summary
Franklin, West Virginia is a small town located in Pendleton County in the eastern part of the state. It is situated in the Appalachian Mountains and is part of the Potomac Highlands region. The town was founded in 1820 and is the county seat of Pendleton County. The population of Franklin was 1,845 at the 2010 census.
History
Franklin was founded in 1820 by a group of settlers from Pennsylvania. The town was named after Benjamin Franklin, one of the Founding Fathers of the United States. The town was incorporated in 1832 and was the county seat of Pendleton County.
In the late 19th century, Franklin was a major center for the timber industry. The town was also home to several coal mines, which provided employment for many of the town’s residents.
In the early 20th century, Franklin was a popular tourist destination. The town was home to several resorts, including the Franklin Hotel, which was built in 1910. The hotel was a popular destination for wealthy tourists from the East Coast.
In the late 20th century, Franklin experienced a decline in population as many of its residents moved away in search of better economic opportunities. The town’s economy has since shifted to focus on tourism and outdoor recreation.
Geography
Franklin is located in Pendleton County in the eastern part of West Virginia. The town is situated in the Appalachian Mountains and is part of the Potomac Highlands region. The town is located at the confluence of the North Fork of the South Branch of the Potomac River and the South Fork of the South Branch of the Potomac River.
The town is surrounded by the George Washington National Forest and is located near the Monongahela National Forest. The town is also located near the Shenandoah National Park and the Appalachian Trail.
Economy
The economy of Franklin is largely based on tourism and outdoor recreation. The town is home to several resorts, including the Franklin Hotel, which was built in 1910. The hotel is a popular destination for tourists from the East Coast.
The town is also home to several outdoor recreation businesses, including fishing and hunting guides, whitewater rafting companies, and mountain biking and hiking outfitters. The town is also home to several wineries and craft breweries.
The town is also home to several manufacturing companies, including a furniture manufacturer and a woodworking company. The town is also home to several retail stores, including a grocery store, a hardware store, and a pharmacy.
Demographics
As of the 2010 census, the population of Franklin was 1,845. The racial makeup of the town was 97.3% White, 0.7% African American, 0.2% Native American, 0.2% Asian, 0.1% Pacific Islander, 0.2% from other races, and 1.3% from two or more races. Hispanic or Latino of any race were 0.7% of the population.
The median income for a household in the town was $30,938, and the median income for a family was $37,500. The per capita income for the town was $17,845. About 15.2% of families and 18.2% of the population were below the poverty line, including 25.2% of those under age 18 and 11.2% of those age 65 or over.
Common Questions
What is the Total Population of Franklin?
Total Population of Franklin is 342.
What is the Total Male Population of Franklin?
Total Male Population of Franklin is 154.
What is the Total Female Population of Franklin?
Total Female Population of Franklin is 188.
What is the Ratio of Males per 100 Females in Franklin?
There are 81.91 Males per 100 Females in Franklin.
What is the Ratio of Females per 100 Males in Franklin?
There are 122.08 Females per 100 Males in Franklin.
What is the Median Population Age in Franklin?
Median Population Age in Franklin is 53.4 Years.
What is the Average Family Size in Franklin
Average Family Size in Franklin is 3.0 People.
What is the Average Household Size in Franklin
Average Household Size in Franklin is 2.1 People.
What is Per Capita Income in Franklin?
Per Capita income in Franklin is $34,863.
What is the Median Family Income in Franklin?
Median Family Income in Franklin is $93,036.
What is the Median Household income in Franklin?
Median Household Income in Franklin is $78,125.
What is Income or Wage Gap in Franklin?
Income or Wage Gap in Franklin is 19.8%.
Women in Franklin earn 80.2 cents for every dollar earned by a man.
What is Inequality or Gini Index in Franklin?
Inequality or Gini Index in Franklin is 0.34.
How Large is the Labor Force in Franklin?
There are 133 People in the Labor Forcein in Franklin.
What is the Percentage of People in the Labor Force in Franklin?
44.9% of People are in the Labor Force in Franklin.