Glendale, WI
Glendale Map
Glendale Overview
13,227
TOTAL POPULATION
5,984
MALE POPULATION
7,243
FEMALE POPULATION
82.62
MALES / 100 FEMALES
121.04
FEMALES / 100 MALES
45.4
MEDIAN AGE
2.9
AVG FAMILY SIZE
2.2
AVG HOUSEHOLD SIZE
$45,577
PER CAPITA INCOME
$113,835
AVG FAMILY INCOME
$79,861
AVG HOUSEHOLD INCOME
23.9%
WAGE / INCOME GAP [ % ]
76.1¢/ $1
WAGE / INCOME GAP [ $ ]
$8,654
FAMILY INCOME DEFICIT
0.45
INEQUALITY / GINI INDEX
6,611
LABOR FORCE [ PEOPLE ]
59.8%
PERCENT IN LABOR FORCE
4.1%
UNEMPLOYMENT RATE
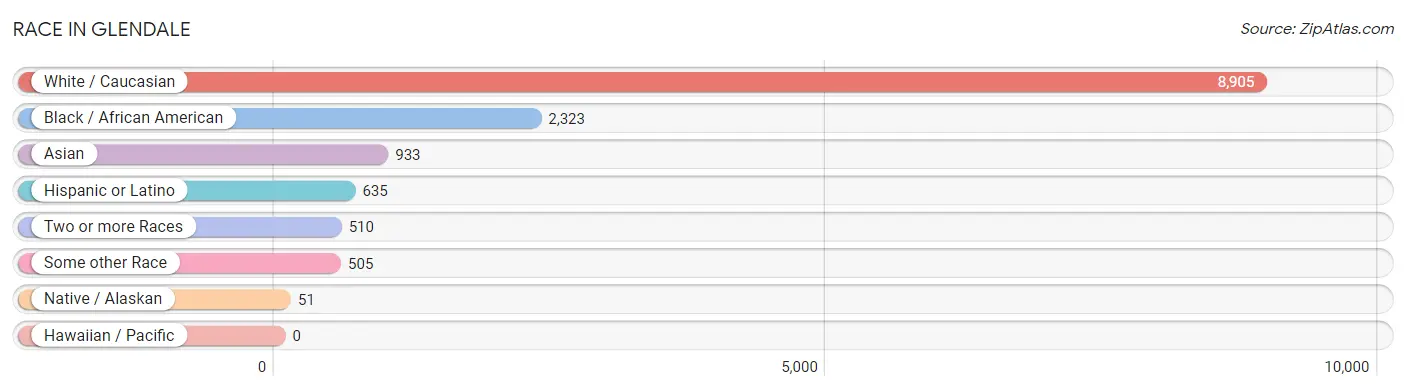
Race in Glendale
The most populous races in Glendale are White / Caucasian (8,905 | 67.3%), Black / African American (2,323 | 17.6%), and Asian (933 | 7.0%).
| Race | # Population | % Population |
| Asian | 933 | 7.0% |
| Black / African American | 2,323 | 17.6% |
| Hawaiian / Pacific | 0 | 0.0% |
| Hispanic or Latino | 635 | 4.8% |
| Native / Alaskan | 51 | 0.4% |
| White / Caucasian | 8,905 | 67.3% |
| Two or more Races | 510 | 3.9% |
| Some other Race | 505 | 3.8% |
| Total | 13,227 | 100.0% |
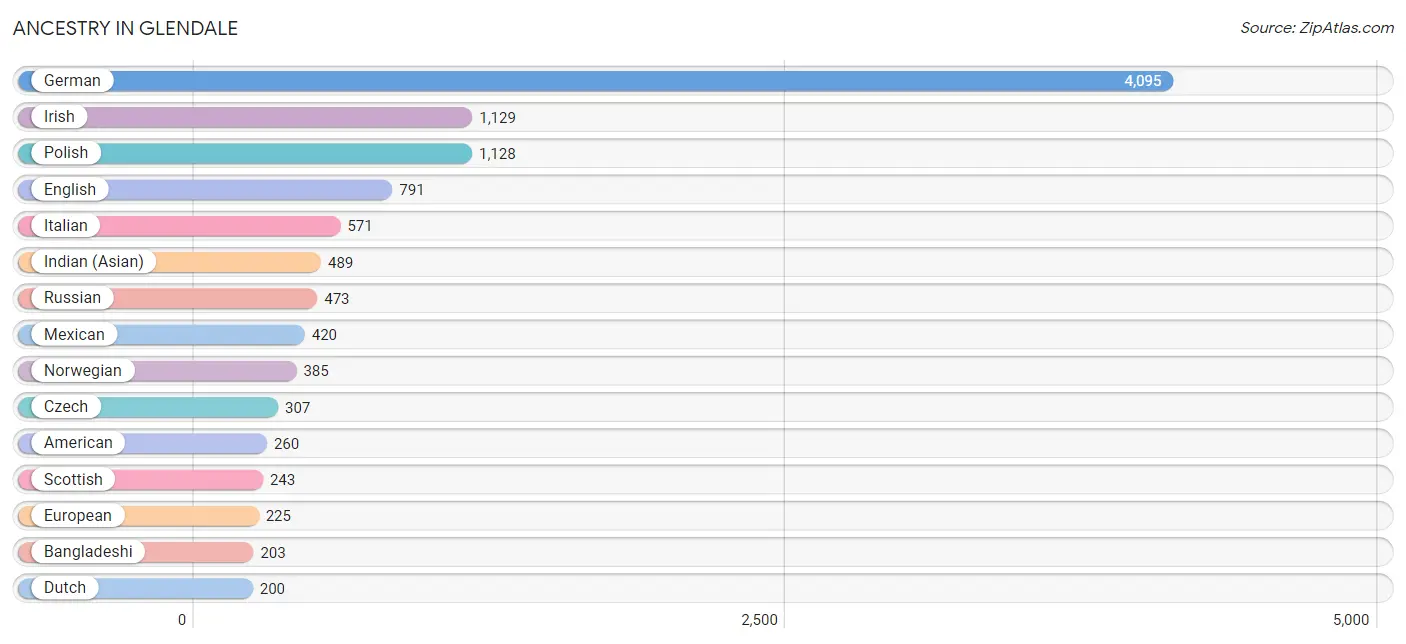
Ancestry in Glendale
The most populous ancestries reported in Glendale are German (4,095 | 31.0%), Irish (1,129 | 8.5%), Polish (1,128 | 8.5%), English (791 | 6.0%), and Italian (571 | 4.3%), together accounting for 58.3% of all Glendale residents.
| Ancestry | # Population | % Population |
| African | 24 | 0.2% |
| Alsatian | 6 | 0.1% |
| American | 260 | 2.0% |
| Arab | 169 | 1.3% |
| Argentinean | 18 | 0.1% |
| Australian | 8 | 0.1% |
| Austrian | 139 | 1.1% |
| Bangladeshi | 203 | 1.5% |
| Belgian | 24 | 0.2% |
| Bhutanese | 58 | 0.4% |
| Blackfeet | 58 | 0.4% |
| British | 49 | 0.4% |
| Burmese | 54 | 0.4% |
| Cherokee | 44 | 0.3% |
| Colombian | 38 | 0.3% |
| Croatian | 66 | 0.5% |
| Cuban | 23 | 0.2% |
| Czech | 307 | 2.3% |
| Czechoslovakian | 12 | 0.1% |
| Danish | 34 | 0.3% |
| Dutch | 200 | 1.5% |
| Eastern European | 61 | 0.5% |
| English | 791 | 6.0% |
| European | 225 | 1.7% |
| Finnish | 52 | 0.4% |
| French | 197 | 1.5% |
| French American Indian | 11 | 0.1% |
| French Canadian | 87 | 0.7% |
| German | 4,095 | 31.0% |
| Greek | 7 | 0.1% |
| Hungarian | 31 | 0.2% |
| Indian (Asian) | 489 | 3.7% |
| Iraqi | 14 | 0.1% |
| Irish | 1,129 | 8.5% |
| Iroquois | 35 | 0.3% |
| Israeli | 118 | 0.9% |
| Italian | 571 | 4.3% |
| Jamaican | 38 | 0.3% |
| Korean | 50 | 0.4% |
| Latvian | 41 | 0.3% |
| Lithuanian | 60 | 0.4% |
| Luxembourger | 6 | 0.1% |
| Menominee | 16 | 0.1% |
| Mexican | 420 | 3.2% |
| Nigerian | 3 | 0.0% |
| Northern European | 8 | 0.1% |
| Norwegian | 385 | 2.9% |
| Peruvian | 10 | 0.1% |
| Polish | 1,128 | 8.5% |
| Puerto Rican | 125 | 0.9% |
| Romanian | 21 | 0.2% |
| Russian | 473 | 3.6% |
| Scandinavian | 4 | 0.0% |
| Scotch-Irish | 36 | 0.3% |
| Scottish | 243 | 1.8% |
| Serbian | 19 | 0.1% |
| Slovak | 29 | 0.2% |
| Slovene | 6 | 0.1% |
| Somali | 10 | 0.1% |
| South American | 66 | 0.5% |
| Spaniard | 1 | 0.0% |
| Sri Lankan | 28 | 0.2% |
| Subsaharan African | 37 | 0.3% |
| Swedish | 182 | 1.4% |
| Swiss | 44 | 0.3% |
| Thai | 98 | 0.7% |
| Ukrainian | 141 | 1.1% |
| Welsh | 99 | 0.7% | View All 68 Rows |
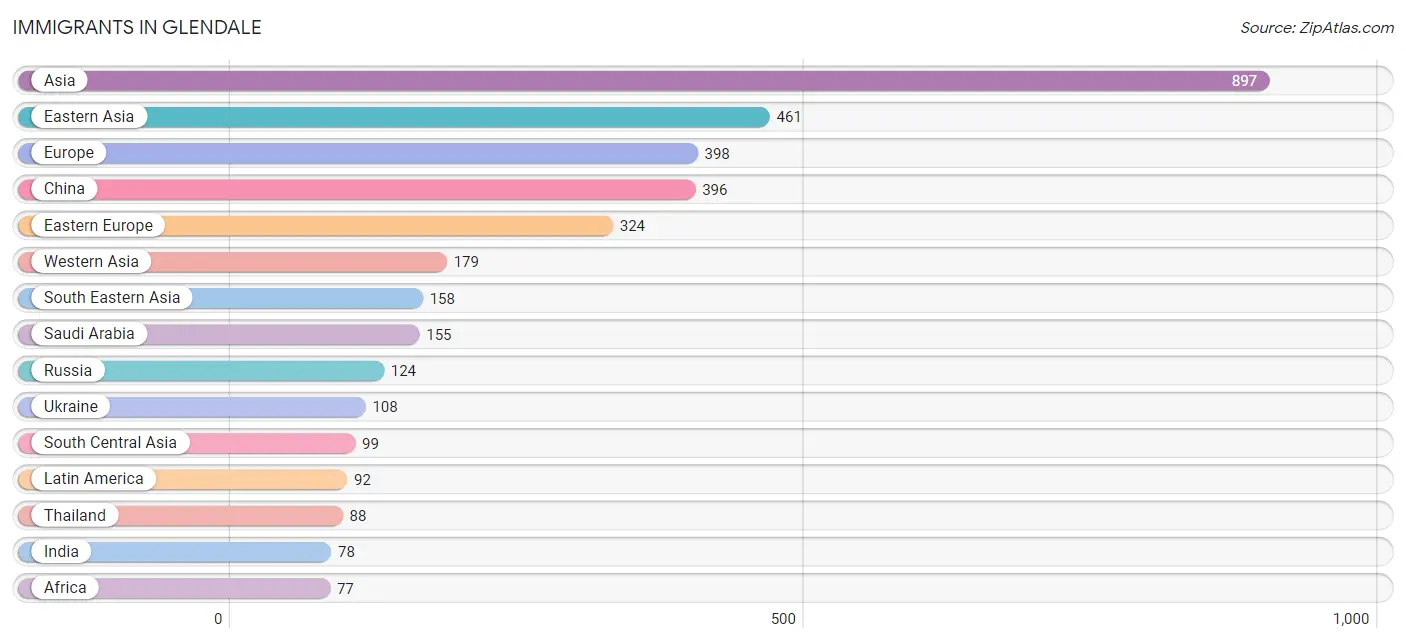
Immigrants in Glendale
The most numerous immigrant groups reported in Glendale came from Asia (897 | 6.8%), Eastern Asia (461 | 3.5%), Europe (398 | 3.0%), China (396 | 3.0%), and Eastern Europe (324 | 2.5%), together accounting for 18.7% of all Glendale residents.
| Immigration Origin | # Population | % Population |
| Africa | 77 | 0.6% |
| Argentina | 6 | 0.1% |
| Asia | 897 | 6.8% |
| Austria | 6 | 0.1% |
| Belarus | 32 | 0.2% |
| Canada | 34 | 0.3% |
| Central America | 38 | 0.3% |
| China | 396 | 3.0% |
| Colombia | 38 | 0.3% |
| Croatia | 6 | 0.1% |
| Czechoslovakia | 41 | 0.3% |
| Eastern Asia | 461 | 3.5% |
| Eastern Europe | 324 | 2.5% |
| El Salvador | 31 | 0.2% |
| England | 6 | 0.1% |
| Europe | 398 | 3.0% |
| Germany | 59 | 0.4% |
| Hungary | 8 | 0.1% |
| India | 78 | 0.6% |
| Israel | 24 | 0.2% |
| Japan | 17 | 0.1% |
| Korea | 48 | 0.4% |
| Latin America | 92 | 0.7% |
| Latvia | 5 | 0.0% |
| Nigeria | 3 | 0.0% |
| Northern Europe | 9 | 0.1% |
| Pakistan | 3 | 0.0% |
| Panama | 7 | 0.1% |
| Peru | 10 | 0.1% |
| Philippines | 50 | 0.4% |
| Russia | 124 | 0.9% |
| Saudi Arabia | 155 | 1.2% |
| Senegal | 65 | 0.5% |
| South Africa | 9 | 0.1% |
| South America | 54 | 0.4% |
| South Central Asia | 99 | 0.7% |
| South Eastern Asia | 158 | 1.2% |
| Sweden | 3 | 0.0% |
| Taiwan | 33 | 0.3% |
| Thailand | 88 | 0.7% |
| Ukraine | 108 | 0.8% |
| Uzbekistan | 18 | 0.1% |
| Vietnam | 20 | 0.2% |
| Western Africa | 68 | 0.5% |
| Western Asia | 179 | 1.3% |
| Western Europe | 65 | 0.5% | View All 46 Rows |
Sex and Age in Glendale
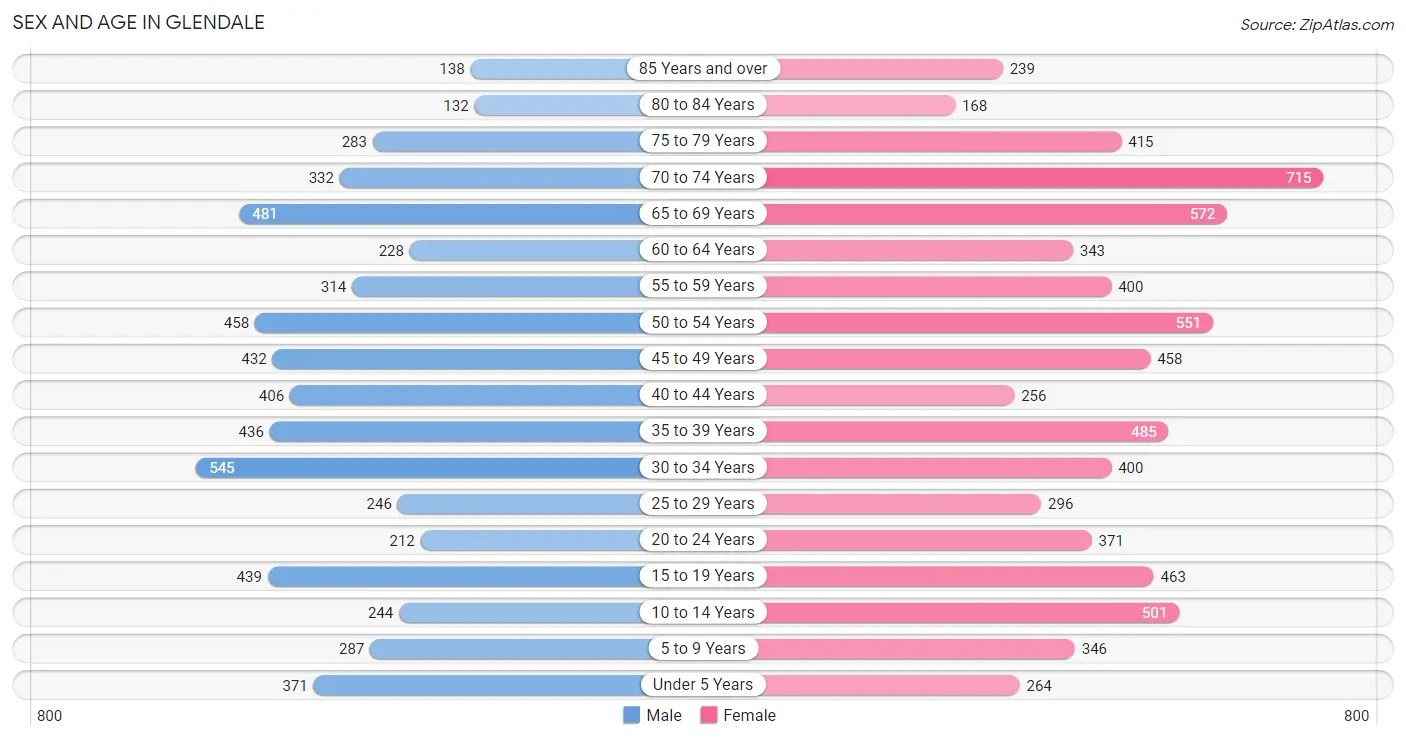
Sex and Age in Glendale
The most populous age groups in Glendale are 30 to 34 Years (545 | 9.1%) for men and 70 to 74 Years (715 | 9.9%) for women.
| Age Bracket | Male | Female |
| Under 5 Years | 371 (6.2%) | 264 (3.6%) |
| 5 to 9 Years | 287 (4.8%) | 346 (4.8%) |
| 10 to 14 Years | 244 (4.1%) | 501 (6.9%) |
| 15 to 19 Years | 439 (7.3%) | 463 (6.4%) |
| 20 to 24 Years | 212 (3.5%) | 371 (5.1%) |
| 25 to 29 Years | 246 (4.1%) | 296 (4.1%) |
| 30 to 34 Years | 545 (9.1%) | 400 (5.5%) |
| 35 to 39 Years | 436 (7.3%) | 485 (6.7%) |
| 40 to 44 Years | 406 (6.8%) | 256 (3.5%) |
| 45 to 49 Years | 432 (7.2%) | 458 (6.3%) |
| 50 to 54 Years | 458 (7.6%) | 551 (7.6%) |
| 55 to 59 Years | 314 (5.2%) | 400 (5.5%) |
| 60 to 64 Years | 228 (3.8%) | 343 (4.7%) |
| 65 to 69 Years | 481 (8.0%) | 572 (7.9%) |
| 70 to 74 Years | 332 (5.6%) | 715 (9.9%) |
| 75 to 79 Years | 283 (4.7%) | 415 (5.7%) |
| 80 to 84 Years | 132 (2.2%) | 168 (2.3%) |
| 85 Years and over | 138 (2.3%) | 239 (3.3%) |
| Total | 5,984 (100.0%) | 7,243 (100.0%) |
Families and Households in Glendale
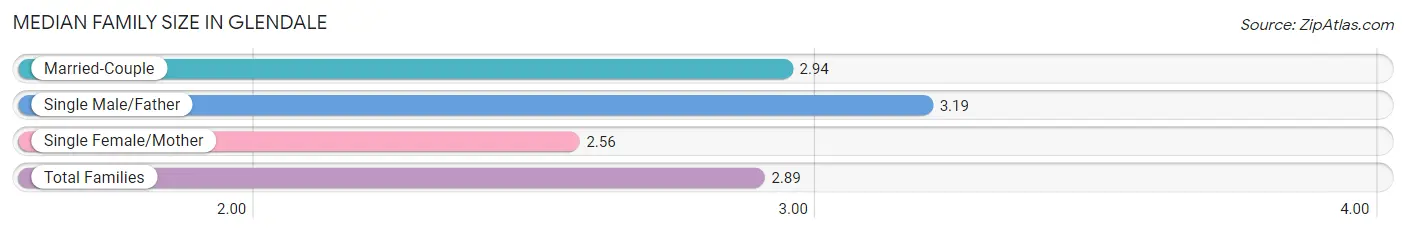
Median Family Size in Glendale
The median family size in Glendale is 2.89 persons per family, with single male/father families (223 | 6.9%) accounting for the largest median family size of 3.19 persons per family. On the other hand, single female/mother families (575 | 17.7%) represent the smallest median family size with 2.56 persons per family.
| Family Type | # Families | Family Size |
| Married-Couple | 2,457 (75.5%) | 2.94 |
| Single Male/Father | 223 (6.9%) | 3.19 |
| Single Female/Mother | 575 (17.7%) | 2.56 |
| Total Families | 3,255 (100.0%) | 2.89 |
Median Household Size in Glendale
The median household size in Glendale is 2.21 persons per household, with single male/father households (223 | 3.8%) accounting for the largest median household size of 3.4 persons per household. non-family households (2,560 | 44.0%) represent the smallest median household size with 1.25 persons per household.

| Household Type | # Households | Household Size |
| Married-Couple | 2,457 (42.2%) | 2.97 |
| Single Male/Father | 223 (3.8%) | 3.40 |
| Single Female/Mother | 575 (9.9%) | 2.74 |
| Non-family | 2,560 (44.0%) | 1.25 |
| Total Households | 5,815 (100.0%) | 2.21 |
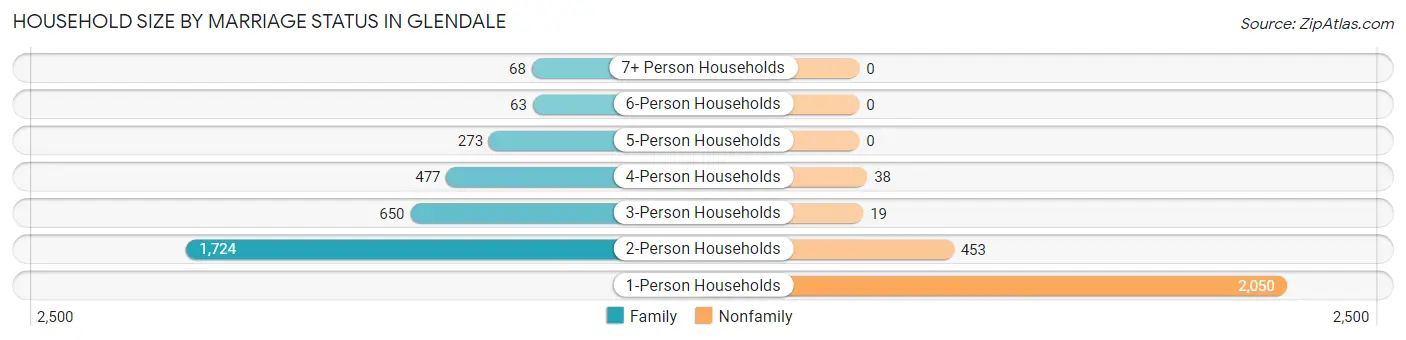
Household Size by Marriage Status in Glendale
Out of a total of 5,815 households in Glendale, 3,255 (56.0%) are family households, while 2,560 (44.0%) are nonfamily households. The most numerous type of family households are 2-person households, comprising 1,724, and the most common type of nonfamily households are 1-person households, comprising 2,050.
| Household Size | Family Households | Nonfamily Households |
| 1-Person Households | - | 2,050 (35.2%) |
| 2-Person Households | 1,724 (29.6%) | 453 (7.8%) |
| 3-Person Households | 650 (11.2%) | 19 (0.3%) |
| 4-Person Households | 477 (8.2%) | 38 (0.6%) |
| 5-Person Households | 273 (4.7%) | 0 (0.0%) |
| 6-Person Households | 63 (1.1%) | 0 (0.0%) |
| 7+ Person Households | 68 (1.2%) | 0 (0.0%) |
| Total | 3,255 (56.0%) | 2,560 (44.0%) |
Female Fertility in Glendale
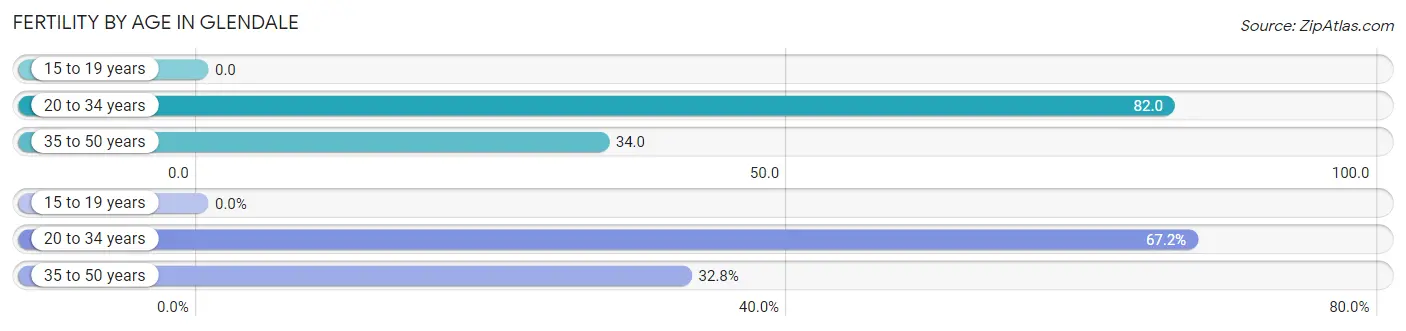
Fertility by Age in Glendale
Average fertility rate in Glendale is 47.0 births per 1,000 women. Women in the age bracket of 20 to 34 years have the highest fertility rate with 82.0 births per 1,000 women. Women in the age bracket of 20 to 34 years acount for 67.2% of all women with births.
| Age Bracket | Women with Births | Births / 1,000 Women |
| 15 to 19 years | 0 (0.0%) | 0.0 |
| 20 to 34 years | 88 (67.2%) | 82.0 |
| 35 to 50 years | 43 (32.8%) | 34.0 |
| Total | 131 (100.0%) | 47.0 |
Fertility by Age by Marriage Status in Glendale
90.8% of women with births (131) in Glendale are married. The highest percentage of unmarried women with births falls into 35 to 50 years age bracket with 27.9% of them unmarried at the time of birth, while the lowest percentage of unmarried women with births belong to 20 to 34 years age bracket with 0.0% of them unmarried.
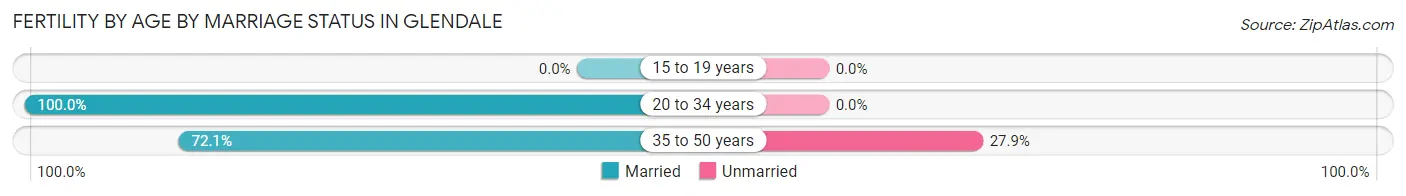
| Age Bracket | Married | Unmarried |
| 15 to 19 years | 0 (0.0%) | 0 (0.0%) |
| 20 to 34 years | 88 (100.0%) | 0 (0.0%) |
| 35 to 50 years | 31 (72.1%) | 12 (27.9%) |
| Total | 119 (90.8%) | 12 (9.2%) |
Fertility by Education in Glendale
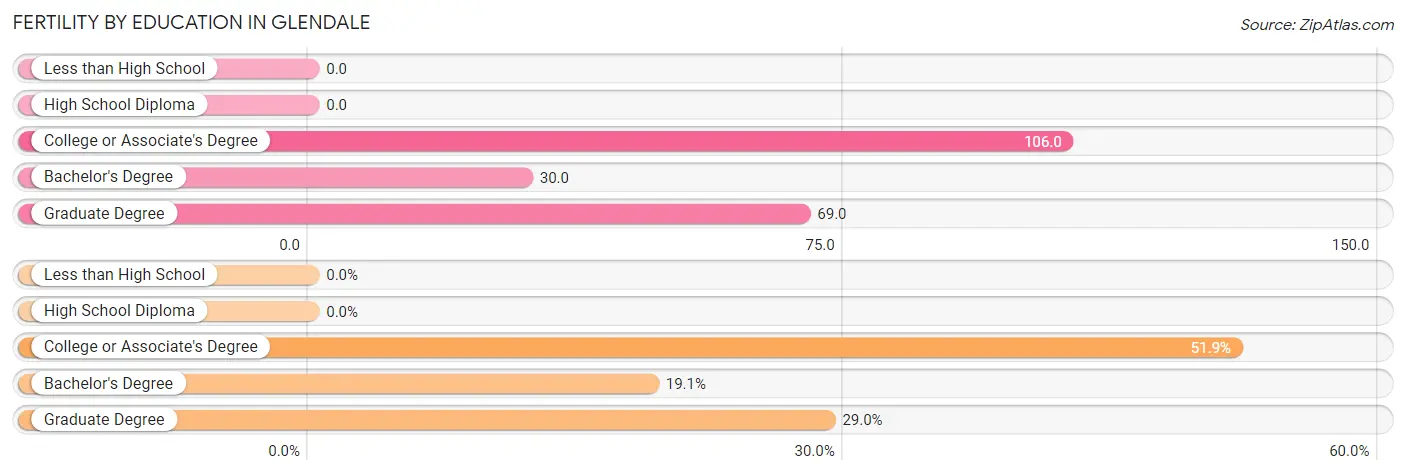
| Educational Attainment | Women with Births | Births / 1,000 Women |
| Less than High School | 0 (0.0%) | 0.0 |
| High School Diploma | 0 (0.0%) | 0.0 |
| College or Associate's Degree | 68 (51.9%) | 106.0 |
| Bachelor's Degree | 25 (19.1%) | 30.0 |
| Graduate Degree | 38 (29.0%) | 69.0 |
| Total | 131 (100.0%) | 47.0 |
Fertility by Education by Marriage Status in Glendale
9.2% of women with births in Glendale are unmarried. Women with the educational attainment of college or associate's degree are most likely to be married with 100.0% of them married at childbirth, while women with the educational attainment of graduate degree are least likely to be married with 31.6% of them unmarried at childbirth.
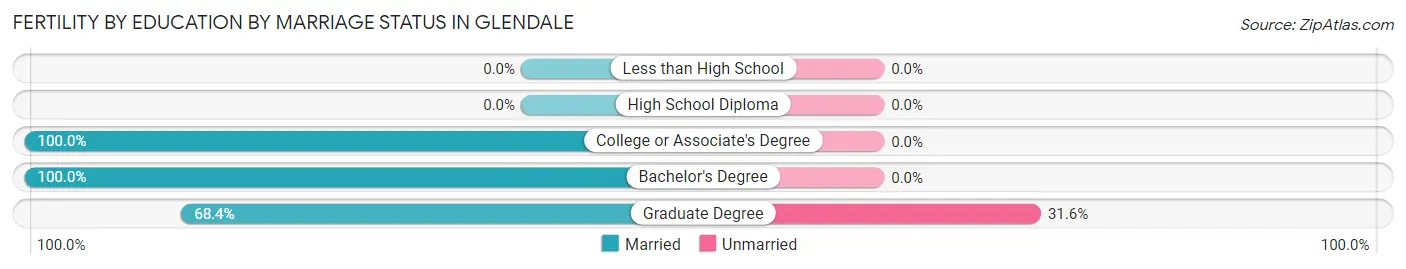
| Educational Attainment | Married | Unmarried |
| Less than High School | 0 (0.0%) | 0 (0.0%) |
| High School Diploma | 0 (0.0%) | 0 (0.0%) |
| College or Associate's Degree | 68 (100.0%) | 0 (0.0%) |
| Bachelor's Degree | 25 (100.0%) | 0 (0.0%) |
| Graduate Degree | 26 (68.4%) | 12 (31.6%) |
| Total | 119 (90.8%) | 12 (9.2%) |
Income in Glendale
Income Overview in Glendale
Per Capita Income in Glendale is $45,577, while median incomes of families and households are $113,835 and $79,861 respectively.
| Characteristic | Number | Measure |
| Per Capita Income | 13,227 | $45,577 |
| Median Family Income | 3,255 | $113,835 |
| Mean Family Income | 3,255 | $129,328 |
| Median Household Income | 5,815 | $79,861 |
| Mean Household Income | 5,815 | $102,038 |
| Income Deficit | 3,255 | $8,654 |
| Wage / Income Gap (%) | 13,227 | 23.89% |
| Wage / Income Gap ($) | 13,227 | 76.11¢ per $1 |
| Gini / Inequality Index | 13,227 | 0.45 |
Earnings by Sex in Glendale
Average Earnings in Glendale are $51,692, $59,647 for men and $45,395 for women, a difference of 23.9%.
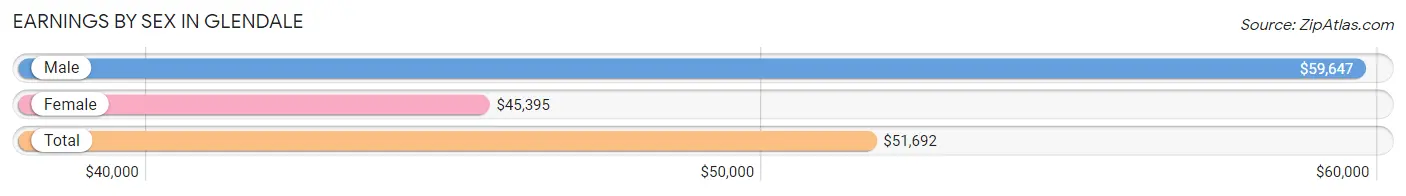
| Sex | Number | Average Earnings |
| Male | 3,463 (50.2%) | $59,647 |
| Female | 3,438 (49.8%) | $45,395 |
| Total | 6,901 (100.0%) | $51,692 |
Earnings by Sex by Income Bracket in Glendale
The most common earnings brackets in Glendale are $100,000+ for men (649 | 18.7%) and $100,000+ for women (406 | 11.8%).
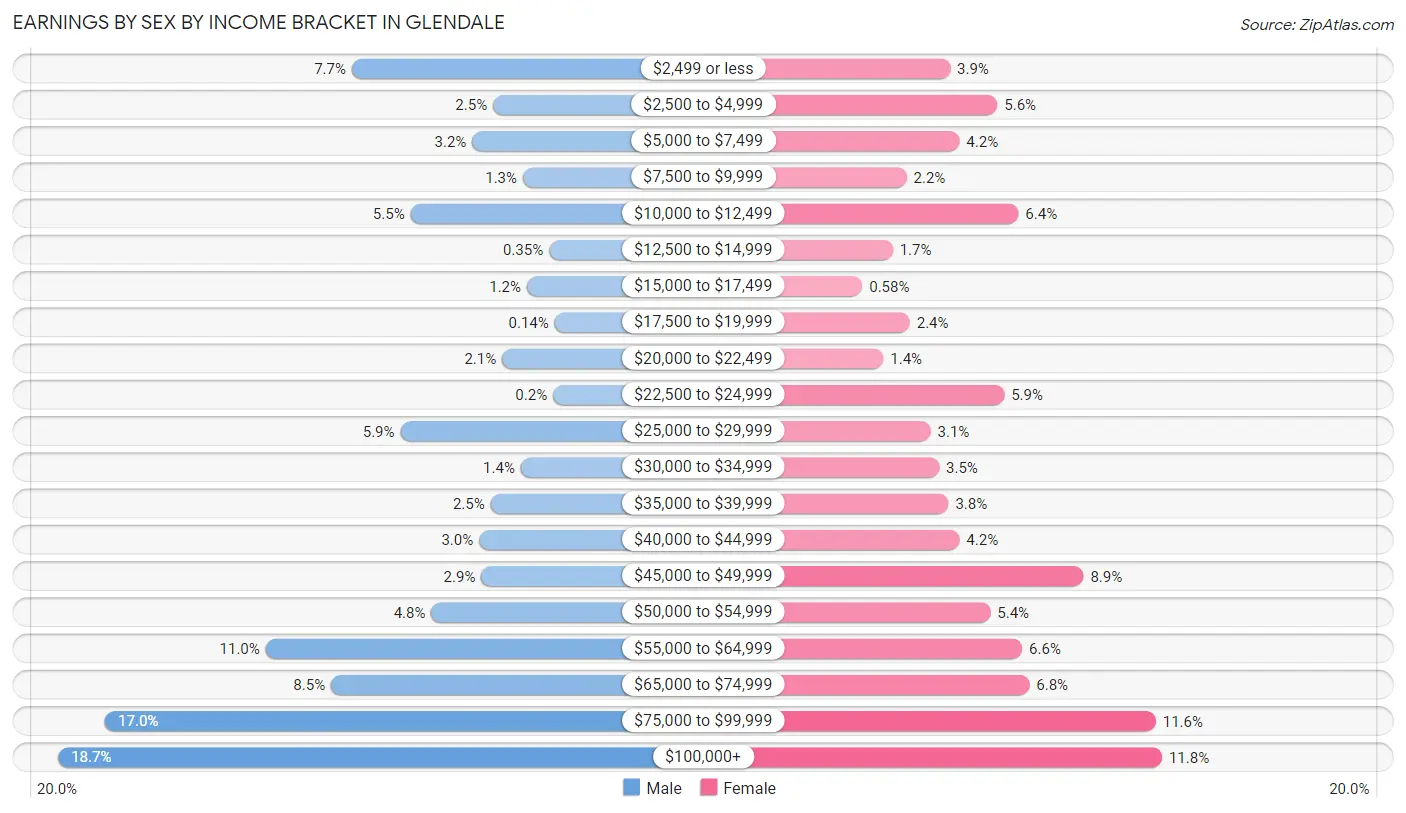
| Income | Male | Female |
| $2,499 or less | 268 (7.7%) | 133 (3.9%) |
| $2,500 to $4,999 | 85 (2.5%) | 194 (5.6%) |
| $5,000 to $7,499 | 112 (3.2%) | 145 (4.2%) |
| $7,500 to $9,999 | 46 (1.3%) | 77 (2.2%) |
| $10,000 to $12,499 | 192 (5.5%) | 221 (6.4%) |
| $12,500 to $14,999 | 12 (0.4%) | 59 (1.7%) |
| $15,000 to $17,499 | 41 (1.2%) | 20 (0.6%) |
| $17,500 to $19,999 | 5 (0.1%) | 81 (2.4%) |
| $20,000 to $22,499 | 73 (2.1%) | 47 (1.4%) |
| $22,500 to $24,999 | 7 (0.2%) | 203 (5.9%) |
| $25,000 to $29,999 | 205 (5.9%) | 108 (3.1%) |
| $30,000 to $34,999 | 49 (1.4%) | 119 (3.5%) |
| $35,000 to $39,999 | 88 (2.5%) | 131 (3.8%) |
| $40,000 to $44,999 | 103 (3.0%) | 145 (4.2%) |
| $45,000 to $49,999 | 100 (2.9%) | 305 (8.9%) |
| $50,000 to $54,999 | 165 (4.8%) | 185 (5.4%) |
| $55,000 to $64,999 | 380 (11.0%) | 226 (6.6%) |
| $65,000 to $74,999 | 295 (8.5%) | 235 (6.8%) |
| $75,000 to $99,999 | 588 (17.0%) | 398 (11.6%) |
| $100,000+ | 649 (18.7%) | 406 (11.8%) |
| Total | 3,463 (100.0%) | 3,438 (100.0%) |
Earnings by Sex by Educational Attainment in Glendale
Average earnings in Glendale are $65,753 for men and $50,132 for women, a difference of 23.8%. Men with an educational attainment of graduate degree enjoy the highest average annual earnings of $89,381, while those with college or associate's degree education earn the least with $48,611. Women with an educational attainment of graduate degree earn the most with the average annual earnings of $75,735, while those with less than high school education have the smallest earnings of $23,654.
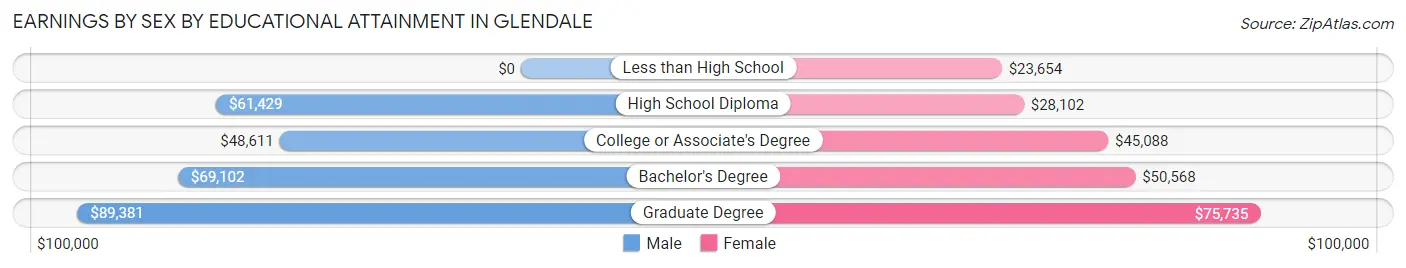
| Educational Attainment | Male Income | Female Income |
| Less than High School | - | - |
| High School Diploma | $61,429 | $28,102 |
| College or Associate's Degree | $48,611 | $45,088 |
| Bachelor's Degree | $69,102 | $50,568 |
| Graduate Degree | $89,381 | $75,735 |
| Total | $65,753 | $50,132 |
Family Income in Glendale
Family Income Brackets in Glendale
According to the Glendale family income data, there are 937 families falling into the $100,000 to $149,999 income range, which is the most common income bracket and makes up 28.8% of all families. Conversely, the less than $10,000 income bracket is the least frequent group with only 42 families (1.3%) belonging to this category.
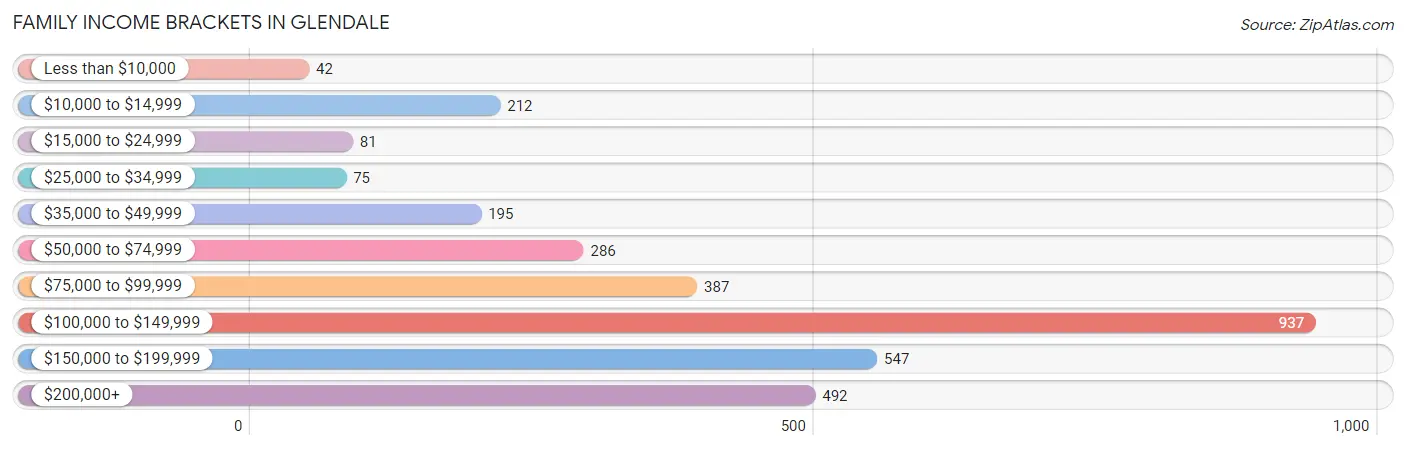
| Income Bracket | # Families | % Families |
| Less than $10,000 | 42 | 1.3% |
| $10,000 to $14,999 | 212 | 6.5% |
| $15,000 to $24,999 | 81 | 2.5% |
| $25,000 to $34,999 | 75 | 2.3% |
| $35,000 to $49,999 | 195 | 6.0% |
| $50,000 to $74,999 | 286 | 8.8% |
| $75,000 to $99,999 | 387 | 11.9% |
| $100,000 to $149,999 | 937 | 28.8% |
| $150,000 to $199,999 | 547 | 16.8% |
| $200,000+ | 492 | 15.1% |
Family Income by Famaliy Size in Glendale
5-person families (277 | 8.5%) account for the highest median family income in Glendale with $150,917 per family, while 2-person families (1,803 | 55.4%) have the highest median income of $52,713 per family member.
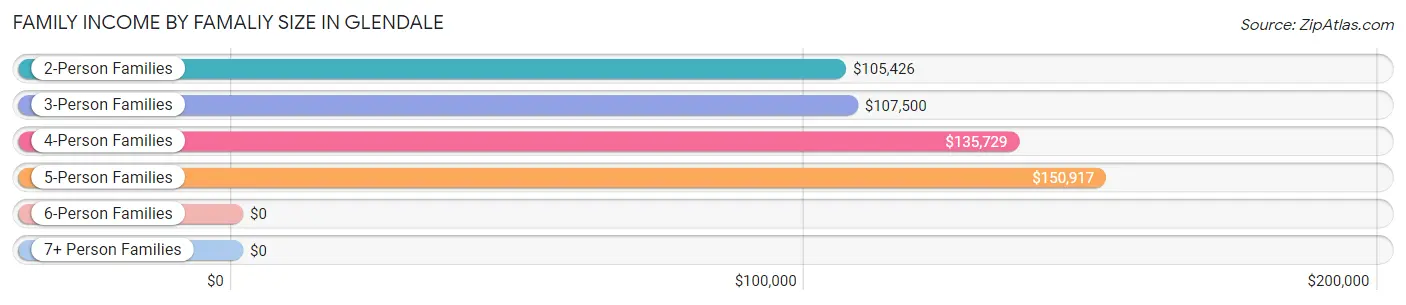
| Income Bracket | # Families | Median Income |
| 2-Person Families | 1,803 (55.4%) | $105,426 |
| 3-Person Families | 652 (20.0%) | $107,500 |
| 4-Person Families | 424 (13.0%) | $135,729 |
| 5-Person Families | 277 (8.5%) | $150,917 |
| 6-Person Families | 51 (1.6%) | $0 |
| 7+ Person Families | 48 (1.5%) | $0 |
| Total | 3,255 (100.0%) | $113,835 |
Family Income by Number of Earners in Glendale
The median family income in Glendale is $113,835, with families comprising 3+ earners (270) having the highest median family income of $209,250, while families with no earners (413) have the lowest median family income of $61,650, accounting for 8.3% and 12.7% of families, respectively.
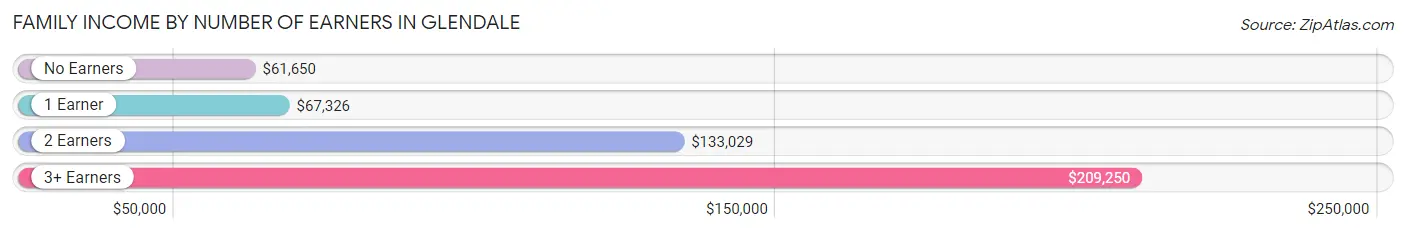
| Number of Earners | # Families | Median Income |
| No Earners | 413 (12.7%) | $61,650 |
| 1 Earner | 840 (25.8%) | $67,326 |
| 2 Earners | 1,732 (53.2%) | $133,029 |
| 3+ Earners | 270 (8.3%) | $209,250 |
| Total | 3,255 (100.0%) | $113,835 |
Household Income in Glendale
Household Income Brackets in Glendale
With 1,175 households falling in the category, the $100,000 to $149,999 income range is the most frequent in Glendale, accounting for 20.2% of all households. In contrast, only 163 households (2.8%) fall into the less than $10,000 income bracket, making it the least populous group.
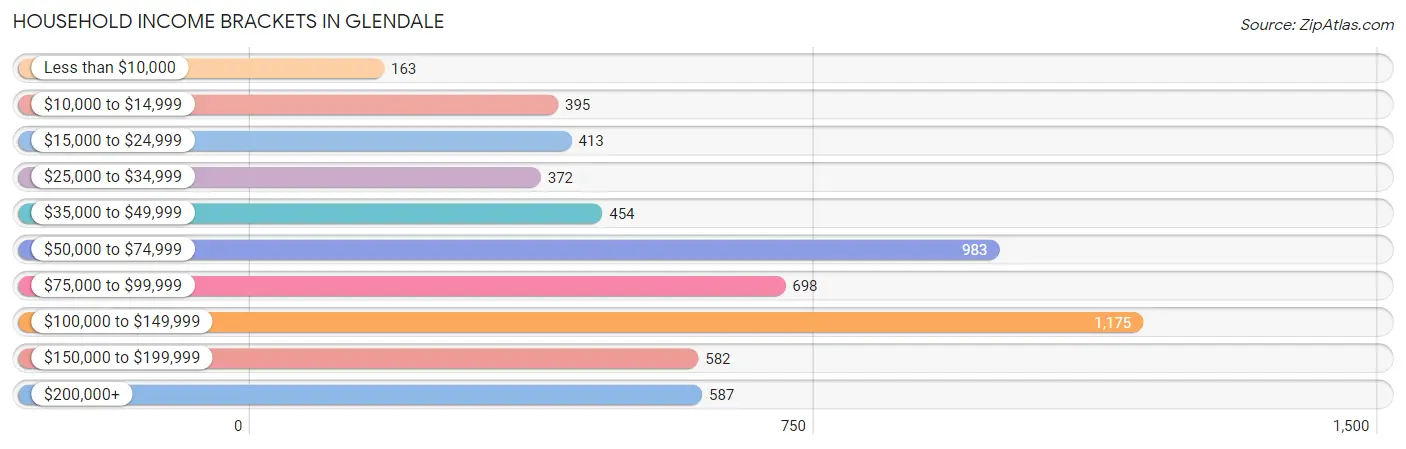
| Income Bracket | # Households | % Households |
| Less than $10,000 | 163 | 2.8% |
| $10,000 to $14,999 | 395 | 6.8% |
| $15,000 to $24,999 | 413 | 7.1% |
| $25,000 to $34,999 | 372 | 6.4% |
| $35,000 to $49,999 | 454 | 7.8% |
| $50,000 to $74,999 | 983 | 16.9% |
| $75,000 to $99,999 | 698 | 12.0% |
| $100,000 to $149,999 | 1,175 | 20.2% |
| $150,000 to $199,999 | 582 | 10.0% |
| $200,000+ | 587 | 10.1% |
Household Income by Householder Age in Glendale
The median household income in Glendale is $79,861, with the highest median household income of $102,196 found in the 45 to 64 years age bracket for the primary householder. A total of 1,857 households (31.9%) fall into this category. Meanwhile, the 15 to 24 years age bracket for the primary householder has the lowest median household income of $18,833, with 230 households (4.0%) in this group.
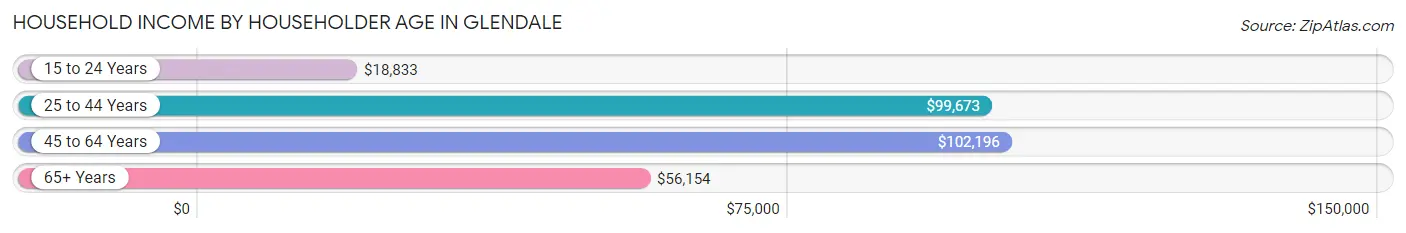
| Income Bracket | # Households | Median Income |
| 15 to 24 Years | 230 (4.0%) | $18,833 |
| 25 to 44 Years | 1,560 (26.8%) | $99,673 |
| 45 to 64 Years | 1,857 (31.9%) | $102,196 |
| 65+ Years | 2,168 (37.3%) | $56,154 |
| Total | 5,815 (100.0%) | $79,861 |
Poverty in Glendale
Income Below Poverty by Sex and Age in Glendale
With 10.4% poverty level for males and 14.8% for females among the residents of Glendale, under 5 year old males and under 5 year old females are the most vulnerable to poverty, with 150 males (40.4%) and 71 females (26.9%) in their respective age groups living below the poverty level.
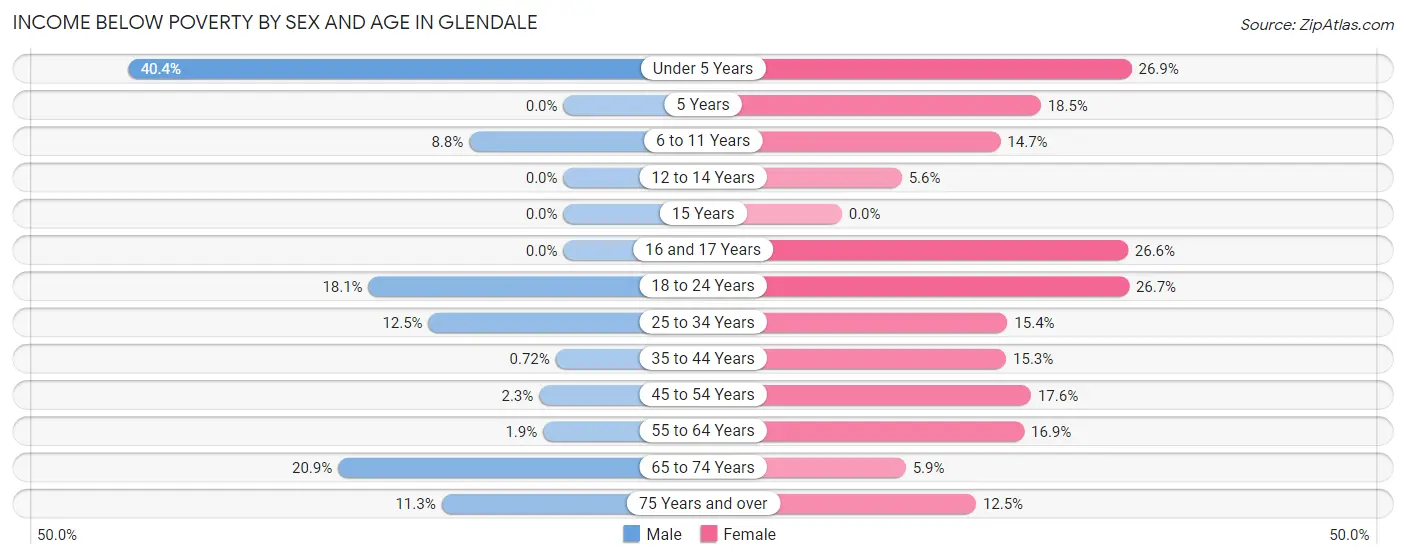
| Age Bracket | Male | Female |
| Under 5 Years | 150 (40.4%) | 71 (26.9%) |
| 5 Years | 0 (0.0%) | 12 (18.5%) |
| 6 to 11 Years | 28 (8.7%) | 82 (14.7%) |
| 12 to 14 Years | 0 (0.0%) | 12 (5.6%) |
| 15 Years | 0 (0.0%) | 0 (0.0%) |
| 16 and 17 Years | 0 (0.0%) | 73 (26.6%) |
| 18 to 24 Years | 72 (18.1%) | 109 (26.7%) |
| 25 to 34 Years | 99 (12.5%) | 107 (15.4%) |
| 35 to 44 Years | 6 (0.7%) | 113 (15.2%) |
| 45 to 54 Years | 20 (2.2%) | 177 (17.6%) |
| 55 to 64 Years | 10 (1.9%) | 121 (16.9%) |
| 65 to 74 Years | 161 (20.9%) | 72 (5.9%) |
| 75 Years and over | 58 (11.3%) | 95 (12.4%) |
| Total | 604 (10.4%) | 1,044 (14.8%) |
Income Above Poverty by Sex and Age in Glendale
According to the poverty statistics in Glendale, males aged 5 years and females aged 15 years are the age groups that are most secure financially, with 100.0% of males and 100.0% of females in these age groups living above the poverty line.
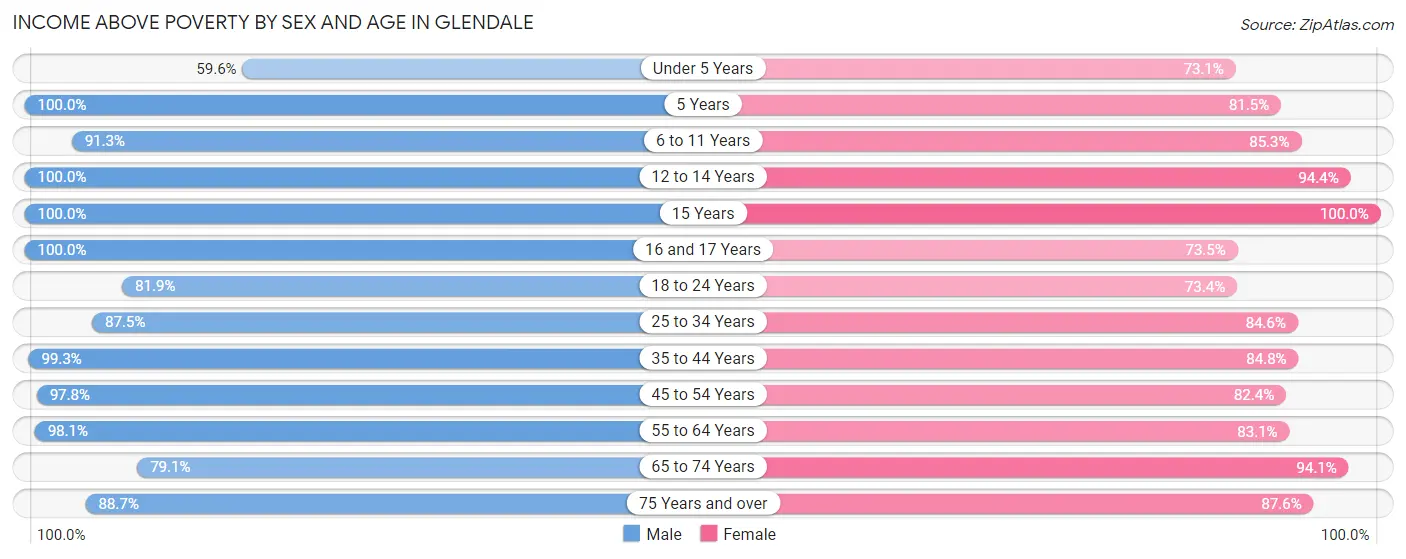
| Age Bracket | Male | Female |
| Under 5 Years | 221 (59.6%) | 193 (73.1%) |
| 5 Years | 11 (100.0%) | 53 (81.5%) |
| 6 to 11 Years | 292 (91.2%) | 475 (85.3%) |
| 12 to 14 Years | 161 (100.0%) | 204 (94.4%) |
| 15 Years | 44 (100.0%) | 115 (100.0%) |
| 16 and 17 Years | 172 (100.0%) | 202 (73.5%) |
| 18 to 24 Years | 326 (81.9%) | 300 (73.4%) |
| 25 to 34 Years | 692 (87.5%) | 589 (84.6%) |
| 35 to 44 Years | 828 (99.3%) | 628 (84.8%) |
| 45 to 54 Years | 870 (97.8%) | 831 (82.4%) |
| 55 to 64 Years | 521 (98.1%) | 594 (83.1%) |
| 65 to 74 Years | 609 (79.1%) | 1,142 (94.1%) |
| 75 Years and over | 455 (88.7%) | 668 (87.5%) |
| Total | 5,202 (89.6%) | 5,994 (85.2%) |
Income Below Poverty Among Married-Couple Families in Glendale
The poverty statistics for married-couple families in Glendale show that 5.0% or 122 of the total 2,457 families live below the poverty line. Families with 3 or 4 children have the highest poverty rate of 30.0%, comprising of 30 families. On the other hand, families with 5 or more children have the lowest poverty rate of 0.0%, which includes 0 families.
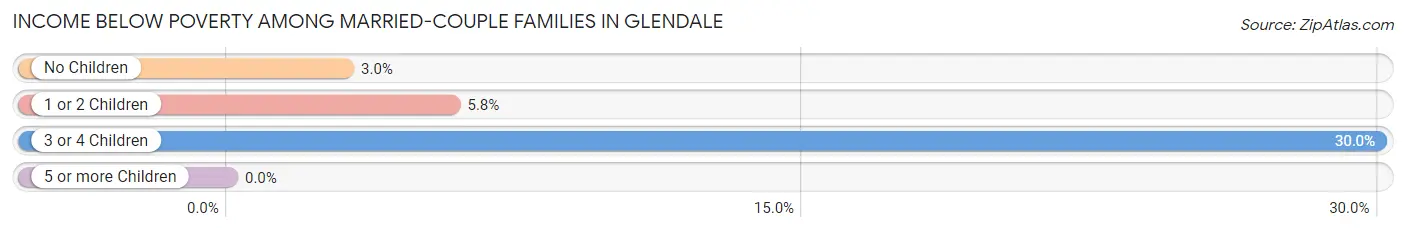
| Children | Above Poverty | Below Poverty |
| No Children | 1,471 (97.0%) | 46 (3.0%) |
| 1 or 2 Children | 746 (94.2%) | 46 (5.8%) |
| 3 or 4 Children | 70 (70.0%) | 30 (30.0%) |
| 5 or more Children | 48 (100.0%) | 0 (0.0%) |
| Total | 2,335 (95.0%) | 122 (5.0%) |
Income Below Poverty Among Single-Parent Households in Glendale
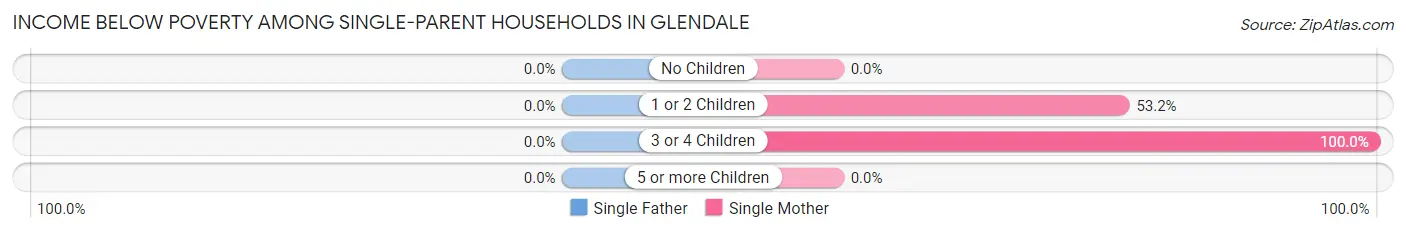
| Children | Single Father | Single Mother |
| No Children | 0 (0.0%) | 0 (0.0%) |
| 1 or 2 Children | 0 (0.0%) | 173 (53.2%) |
| 3 or 4 Children | 0 (0.0%) | 12 (100.0%) |
| 5 or more Children | 0 (0.0%) | 0 (0.0%) |
| Total | 0 (0.0%) | 185 (32.2%) |
Income Below Poverty Among Married-Couple vs Single-Parent Households in Glendale
The poverty data for Glendale shows that 122 of the married-couple family households (5.0%) and 185 of the single-parent households (23.2%) are living below the poverty level. Within the married-couple family households, those with 3 or 4 children have the highest poverty rate, with 30 households (30.0%) falling below the poverty line. Among the single-parent households, those with 3 or 4 children have the highest poverty rate, with 12 household (100.0%) living below poverty.
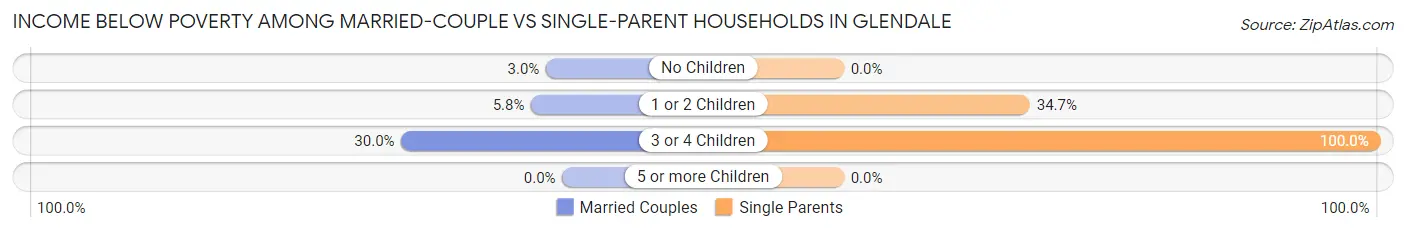
| Children | Married-Couple Families | Single-Parent Households |
| No Children | 46 (3.0%) | 0 (0.0%) |
| 1 or 2 Children | 46 (5.8%) | 173 (34.7%) |
| 3 or 4 Children | 30 (30.0%) | 12 (100.0%) |
| 5 or more Children | 0 (0.0%) | 0 (0.0%) |
| Total | 122 (5.0%) | 185 (23.2%) |
Employment Characteristics in Glendale
Employment by Class of Employer in Glendale
Among the 6,261 employed individuals in Glendale, private company employees (3,986 | 63.7%), not-for-profit organizations (1,053 | 16.8%), and local government employees (361 | 5.8%) make up the most common classes of employment.
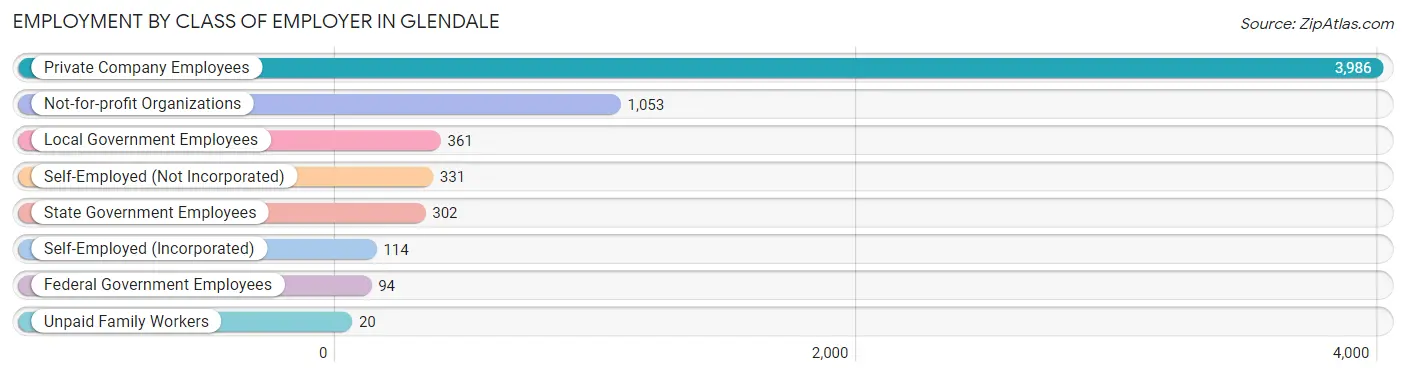
| Employer Class | # Employees | % Employees |
| Private Company Employees | 3,986 | 63.7% |
| Self-Employed (Incorporated) | 114 | 1.8% |
| Self-Employed (Not Incorporated) | 331 | 5.3% |
| Not-for-profit Organizations | 1,053 | 16.8% |
| Local Government Employees | 361 | 5.8% |
| State Government Employees | 302 | 4.8% |
| Federal Government Employees | 94 | 1.5% |
| Unpaid Family Workers | 20 | 0.3% |
| Total | 6,261 | 100.0% |
Employment Status by Age in Glendale
According to the labor force statistics for Glendale, out of the total population over 16 years of age (11,055), 59.8% or 6,611 individuals are in the labor force, with 4.1% or 271 of them unemployed. The age group with the highest labor force participation rate is 25 to 29 years, with 91.1% or 494 individuals in the labor force. Within the labor force, the 25 to 29 years age range has the highest percentage of unemployed individuals, with 9.1% or 45 of them being unemployed.
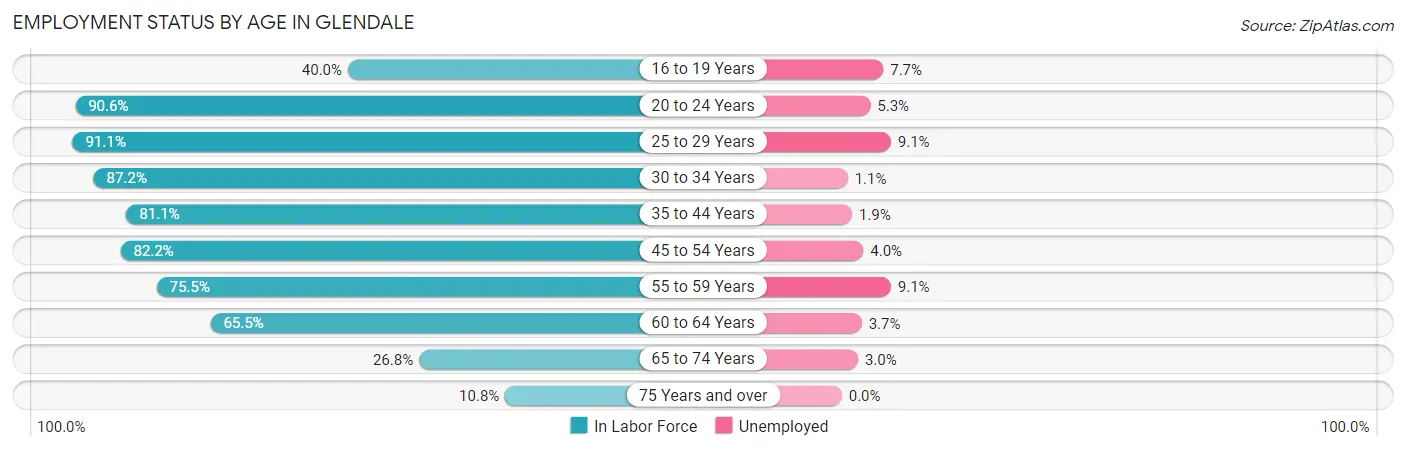
| Age Bracket | In Labor Force | Unemployed |
| 16 to 19 Years | 297 (40.0%) | 23 (7.7%) |
| 20 to 24 Years | 528 (90.6%) | 28 (5.3%) |
| 25 to 29 Years | 494 (91.1%) | 45 (9.1%) |
| 30 to 34 Years | 824 (87.2%) | 9 (1.1%) |
| 35 to 44 Years | 1,284 (81.1%) | 24 (1.9%) |
| 45 to 54 Years | 1,561 (82.2%) | 62 (4.0%) |
| 55 to 59 Years | 539 (75.5%) | 49 (9.1%) |
| 60 to 64 Years | 374 (65.5%) | 14 (3.7%) |
| 65 to 74 Years | 563 (26.8%) | 17 (3.0%) |
| 75 Years and over | 149 (10.8%) | 0 (0.0%) |
| Total | 6,611 (59.8%) | 271 (4.1%) |
Employment Status by Educational Attainment in Glendale
According to labor force statistics for Glendale, 81.2% of individuals (5,078) out of the total population between 25 and 64 years of age (6,254) are in the labor force, with 4.0% or 203 of them being unemployed. The group with the highest labor force participation rate are those with the educational attainment of bachelor's degree or higher, with 88.1% or 3,417 individuals in the labor force. Within the labor force, individuals with high school diploma education have the highest percentage of unemployment, with 15.9% or 72 of them being unemployed.
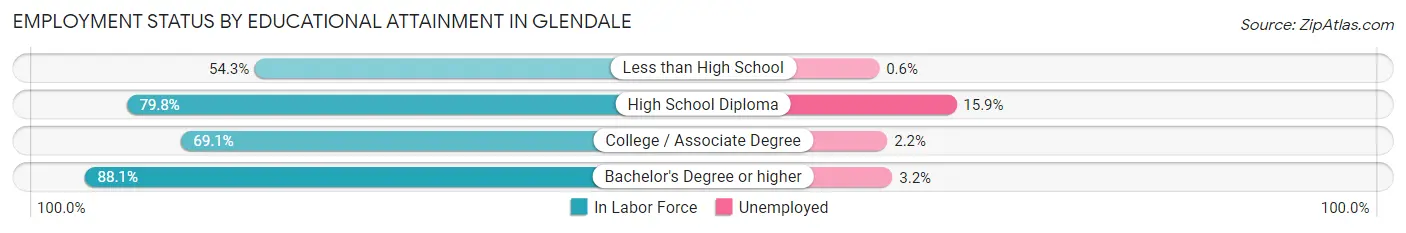
| Educational Attainment | In Labor Force | Unemployed |
| Less than High School | 165 (54.3%) | 2 (0.6%) |
| High School Diploma | 453 (79.8%) | 90 (15.9%) |
| College / Associate Degree | 1,039 (69.1%) | 33 (2.2%) |
| Bachelor's Degree or higher | 3,417 (88.1%) | 124 (3.2%) |
| Total | 5,078 (81.2%) | 250 (4.0%) |
Employment Occupations by Sex in Glendale
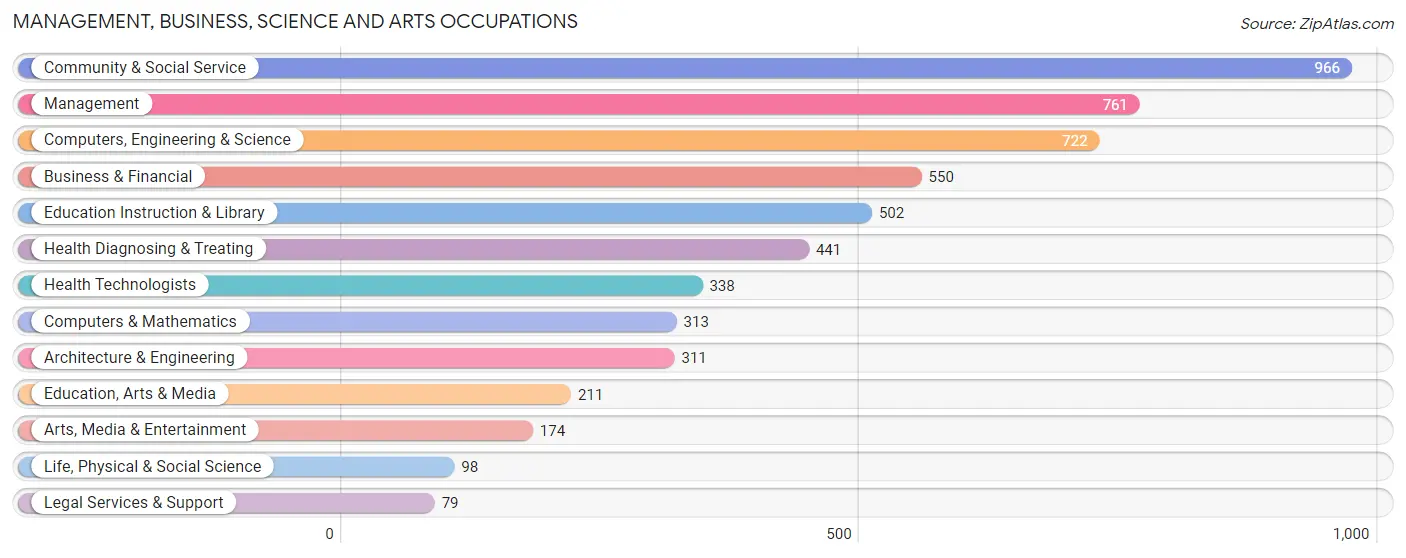
Management, Business, Science and Arts Occupations
The most common Management, Business, Science and Arts occupations in Glendale are Community & Social Service (966 | 15.3%), Management (761 | 12.0%), Computers, Engineering & Science (722 | 11.4%), Business & Financial (550 | 8.7%), and Education Instruction & Library (502 | 8.0%).
Management, Business, Science and Arts Occupations by Sex
Within the Management, Business, Science and Arts occupations in Glendale, the most male-oriented occupations are Architecture & Engineering (81.0%), Arts, Media & Entertainment (76.4%), and Life, Physical & Social Science (74.5%), while the most female-oriented occupations are Health Technologists (77.8%), Health Diagnosing & Treating (74.4%), and Education Instruction & Library (65.7%).
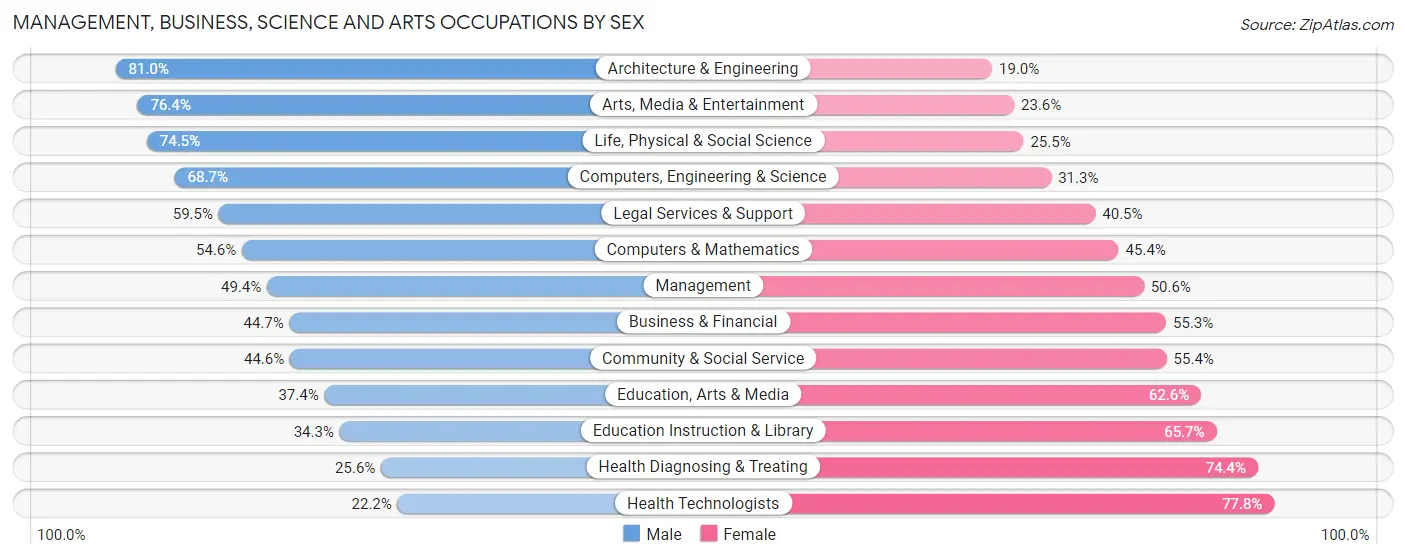
| Occupation | Male | Female |
| Management | 376 (49.4%) | 385 (50.6%) |
| Business & Financial | 246 (44.7%) | 304 (55.3%) |
| Computers, Engineering & Science | 496 (68.7%) | 226 (31.3%) |
| Computers & Mathematics | 171 (54.6%) | 142 (45.4%) |
| Architecture & Engineering | 252 (81.0%) | 59 (19.0%) |
| Life, Physical & Social Science | 73 (74.5%) | 25 (25.5%) |
| Community & Social Service | 431 (44.6%) | 535 (55.4%) |
| Education, Arts & Media | 79 (37.4%) | 132 (62.6%) |
| Legal Services & Support | 47 (59.5%) | 32 (40.5%) |
| Education Instruction & Library | 172 (34.3%) | 330 (65.7%) |
| Arts, Media & Entertainment | 133 (76.4%) | 41 (23.6%) |
| Health Diagnosing & Treating | 113 (25.6%) | 328 (74.4%) |
| Health Technologists | 75 (22.2%) | 263 (77.8%) |
| Total (Category) | 1,662 (48.3%) | 1,778 (51.7%) |
| Total (Overall) | 3,120 (49.4%) | 3,197 (50.6%) |
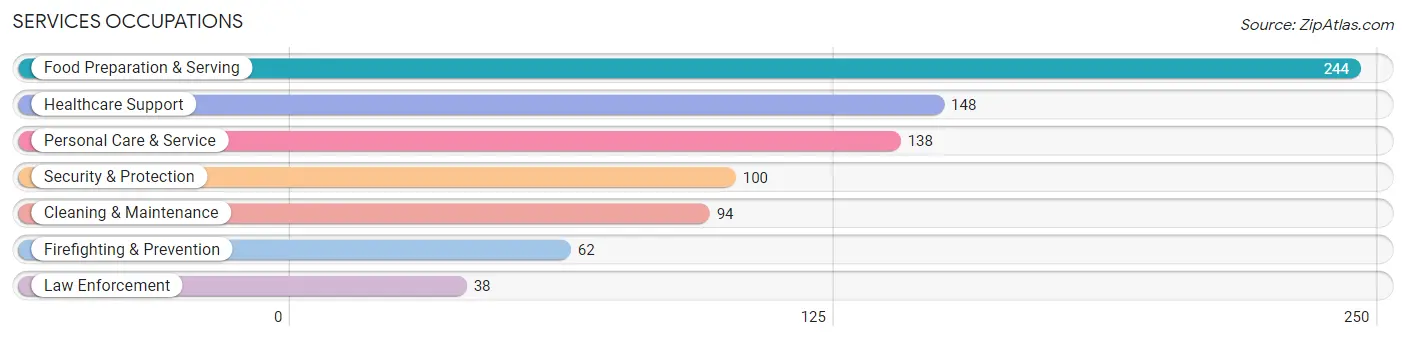
Services Occupations
The most common Services occupations in Glendale are Food Preparation & Serving (244 | 3.9%), Healthcare Support (148 | 2.3%), Personal Care & Service (138 | 2.2%), Security & Protection (100 | 1.6%), and Cleaning & Maintenance (94 | 1.5%).
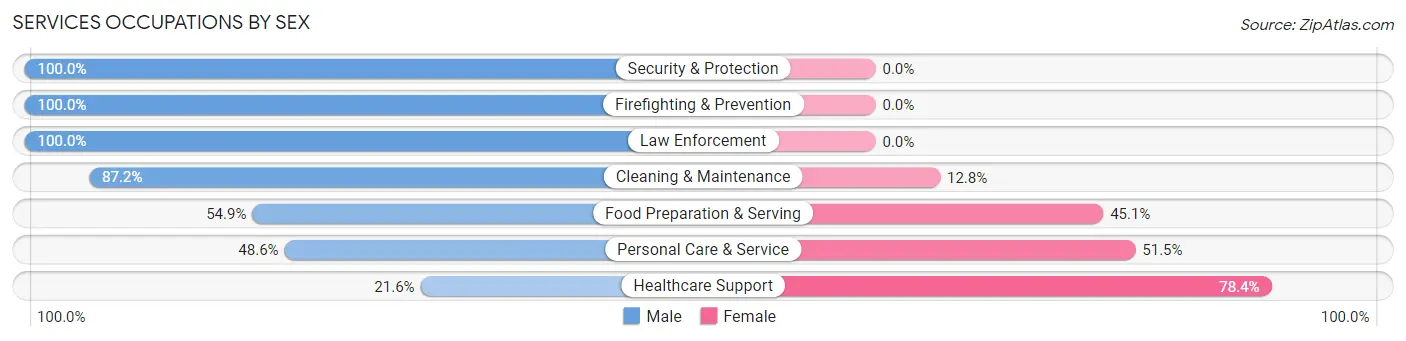
Services Occupations by Sex
Within the Services occupations in Glendale, the most male-oriented occupations are Security & Protection (100.0%), Firefighting & Prevention (100.0%), and Law Enforcement (100.0%), while the most female-oriented occupations are Healthcare Support (78.4%), Personal Care & Service (51.4%), and Food Preparation & Serving (45.1%).
| Occupation | Male | Female |
| Healthcare Support | 32 (21.6%) | 116 (78.4%) |
| Security & Protection | 100 (100.0%) | 0 (0.0%) |
| Firefighting & Prevention | 62 (100.0%) | 0 (0.0%) |
| Law Enforcement | 38 (100.0%) | 0 (0.0%) |
| Food Preparation & Serving | 134 (54.9%) | 110 (45.1%) |
| Cleaning & Maintenance | 82 (87.2%) | 12 (12.8%) |
| Personal Care & Service | 67 (48.5%) | 71 (51.4%) |
| Total (Category) | 415 (57.3%) | 309 (42.7%) |
| Total (Overall) | 3,120 (49.4%) | 3,197 (50.6%) |
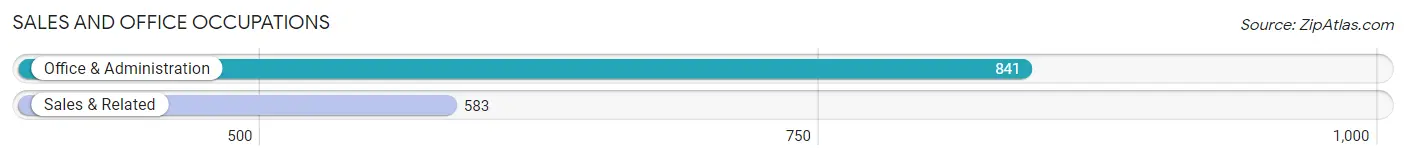
Sales and Office Occupations
The most common Sales and Office occupations in Glendale are Office & Administration (841 | 13.3%), and Sales & Related (583 | 9.2%).
Sales and Office Occupations by Sex
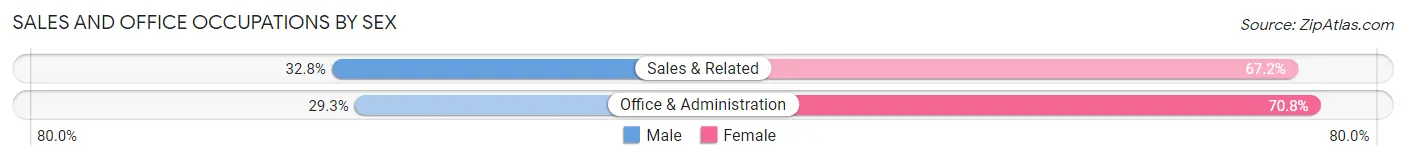
| Occupation | Male | Female |
| Sales & Related | 191 (32.8%) | 392 (67.2%) |
| Office & Administration | 246 (29.2%) | 595 (70.8%) |
| Total (Category) | 437 (30.7%) | 987 (69.3%) |
| Total (Overall) | 3,120 (49.4%) | 3,197 (50.6%) |
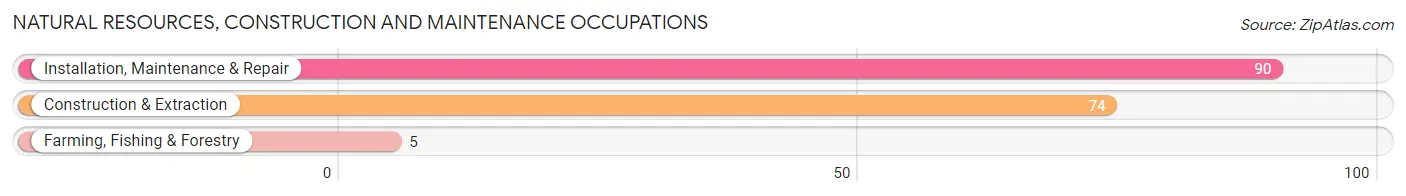
Natural Resources, Construction and Maintenance Occupations
The most common Natural Resources, Construction and Maintenance occupations in Glendale are Installation, Maintenance & Repair (90 | 1.4%), Construction & Extraction (74 | 1.2%), and Farming, Fishing & Forestry (5 | 0.1%).
Natural Resources, Construction and Maintenance Occupations by Sex
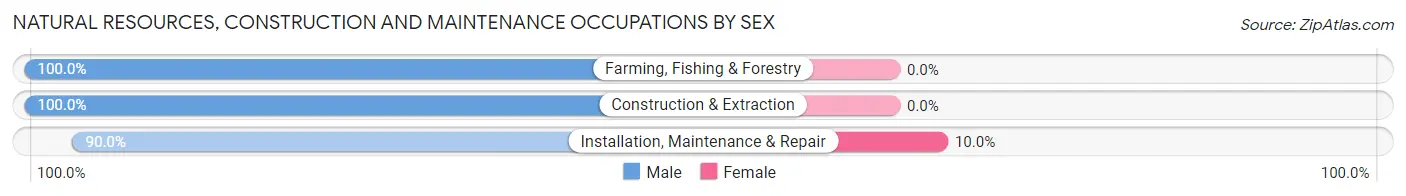
| Occupation | Male | Female |
| Farming, Fishing & Forestry | 5 (100.0%) | 0 (0.0%) |
| Construction & Extraction | 74 (100.0%) | 0 (0.0%) |
| Installation, Maintenance & Repair | 81 (90.0%) | 9 (10.0%) |
| Total (Category) | 160 (94.7%) | 9 (5.3%) |
| Total (Overall) | 3,120 (49.4%) | 3,197 (50.6%) |
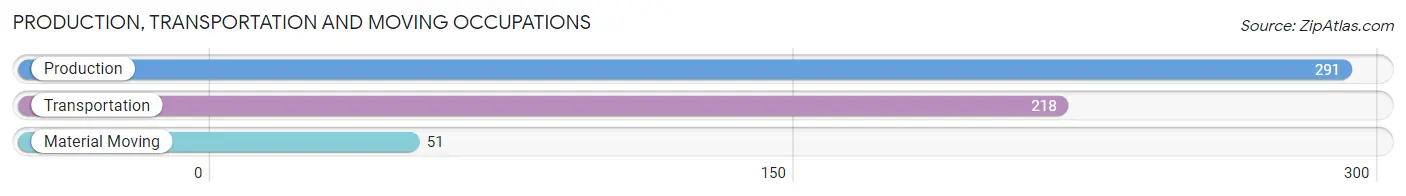
Production, Transportation and Moving Occupations
The most common Production, Transportation and Moving occupations in Glendale are Production (291 | 4.6%), Transportation (218 | 3.5%), and Material Moving (51 | 0.8%).
Production, Transportation and Moving Occupations by Sex
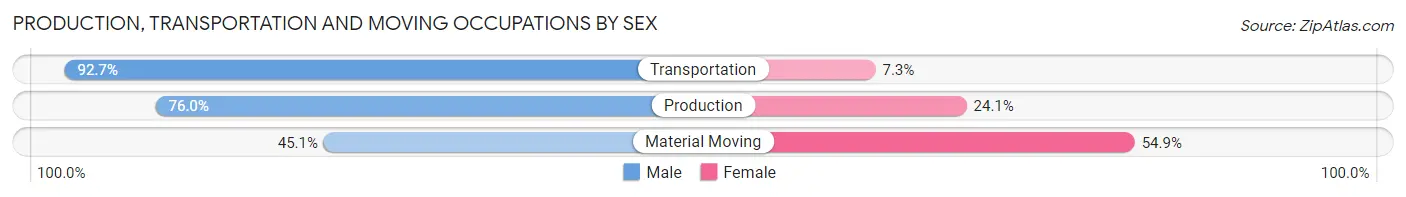
| Occupation | Male | Female |
| Production | 221 (75.9%) | 70 (24.0%) |
| Transportation | 202 (92.7%) | 16 (7.3%) |
| Material Moving | 23 (45.1%) | 28 (54.9%) |
| Total (Category) | 446 (79.6%) | 114 (20.4%) |
| Total (Overall) | 3,120 (49.4%) | 3,197 (50.6%) |
Employment Industries by Sex in Glendale
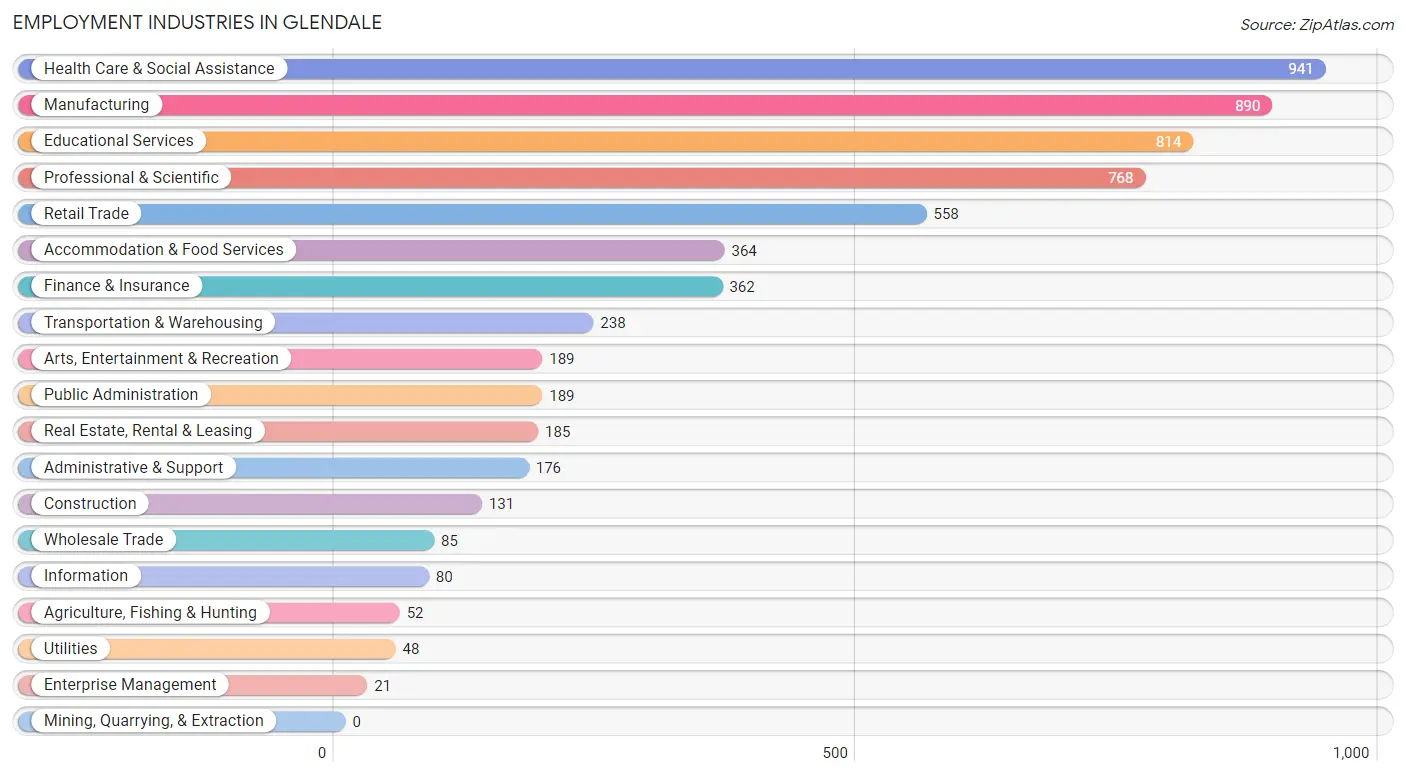
Employment Industries in Glendale
The major employment industries in Glendale include Health Care & Social Assistance (941 | 14.9%), Manufacturing (890 | 14.1%), Educational Services (814 | 12.9%), Professional & Scientific (768 | 12.2%), and Retail Trade (558 | 8.8%).
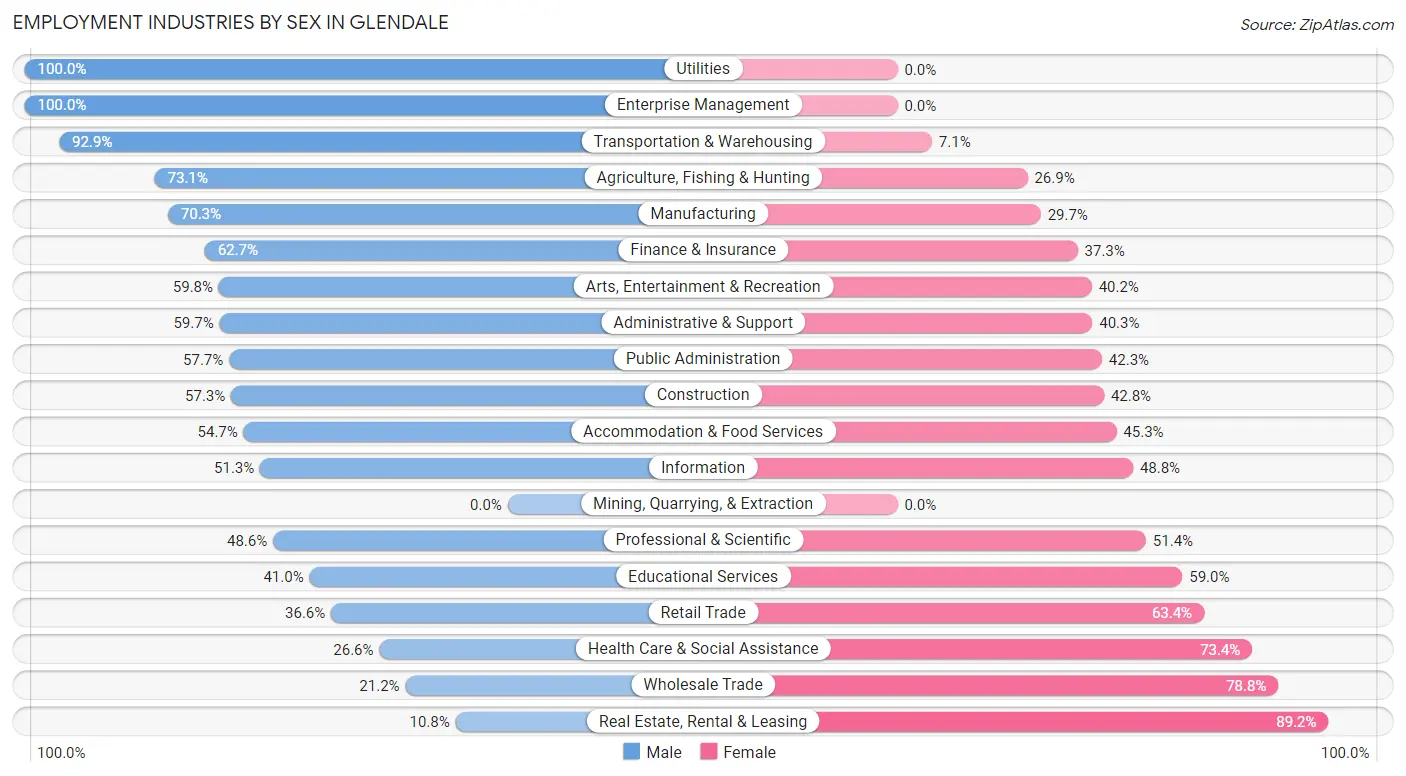
Employment Industries by Sex in Glendale
The Glendale industries that see more men than women are Utilities (100.0%), Enterprise Management (100.0%), and Transportation & Warehousing (92.9%), whereas the industries that tend to have a higher number of women are Real Estate, Rental & Leasing (89.2%), Wholesale Trade (78.8%), and Health Care & Social Assistance (73.4%).
| Industry | Male | Female |
| Agriculture, Fishing & Hunting | 38 (73.1%) | 14 (26.9%) |
| Mining, Quarrying, & Extraction | 0 (0.0%) | 0 (0.0%) |
| Construction | 75 (57.3%) | 56 (42.7%) |
| Manufacturing | 626 (70.3%) | 264 (29.7%) |
| Wholesale Trade | 18 (21.2%) | 67 (78.8%) |
| Retail Trade | 204 (36.6%) | 354 (63.4%) |
| Transportation & Warehousing | 221 (92.9%) | 17 (7.1%) |
| Utilities | 48 (100.0%) | 0 (0.0%) |
| Information | 41 (51.2%) | 39 (48.7%) |
| Finance & Insurance | 227 (62.7%) | 135 (37.3%) |
| Real Estate, Rental & Leasing | 20 (10.8%) | 165 (89.2%) |
| Professional & Scientific | 373 (48.6%) | 395 (51.4%) |
| Enterprise Management | 21 (100.0%) | 0 (0.0%) |
| Administrative & Support | 105 (59.7%) | 71 (40.3%) |
| Educational Services | 334 (41.0%) | 480 (59.0%) |
| Health Care & Social Assistance | 250 (26.6%) | 691 (73.4%) |
| Arts, Entertainment & Recreation | 113 (59.8%) | 76 (40.2%) |
| Accommodation & Food Services | 199 (54.7%) | 165 (45.3%) |
| Public Administration | 109 (57.7%) | 80 (42.3%) |
| Total | 3,120 (49.4%) | 3,197 (50.6%) |
Education in Glendale
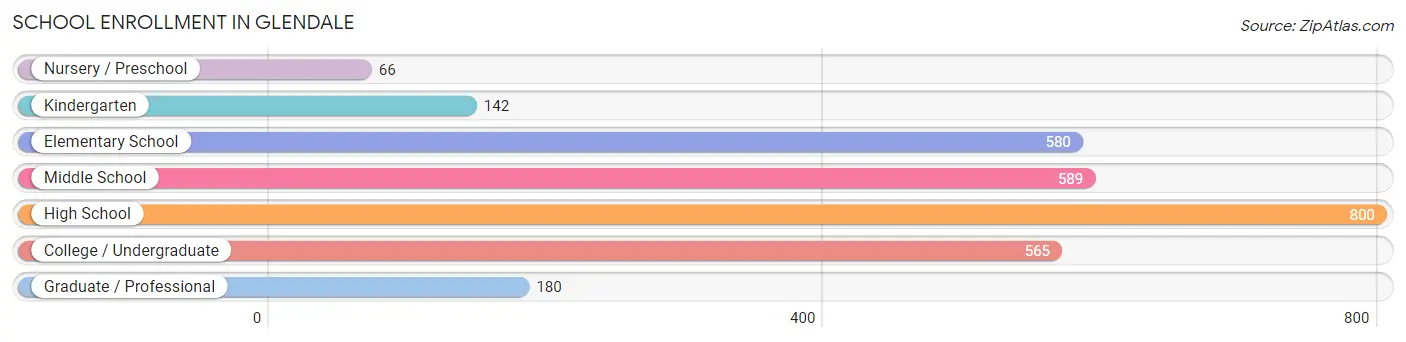
School Enrollment in Glendale
The most common levels of schooling among the 2,922 students in Glendale are high school (800 | 27.4%), middle school (589 | 20.2%), and elementary school (580 | 19.9%).
| School Level | # Students | % Students |
| Nursery / Preschool | 66 | 2.3% |
| Kindergarten | 142 | 4.9% |
| Elementary School | 580 | 19.9% |
| Middle School | 589 | 20.2% |
| High School | 800 | 27.4% |
| College / Undergraduate | 565 | 19.3% |
| Graduate / Professional | 180 | 6.2% |
| Total | 2,922 | 100.0% |
School Enrollment by Age by Funding Source in Glendale
Out of a total of 2,922 students who are enrolled in schools in Glendale, 827 (28.3%) attend a private institution, while the remaining 2,095 (71.7%) are enrolled in public schools. The age group of 20 to 24 year olds has the highest likelihood of being enrolled in private schools, with 110 (53.4% in the age bracket) enrolled. Conversely, the age group of 25 to 34 year olds has the lowest likelihood of being enrolled in a private school, with 191 (86.8% in the age bracket) attending a public institution.
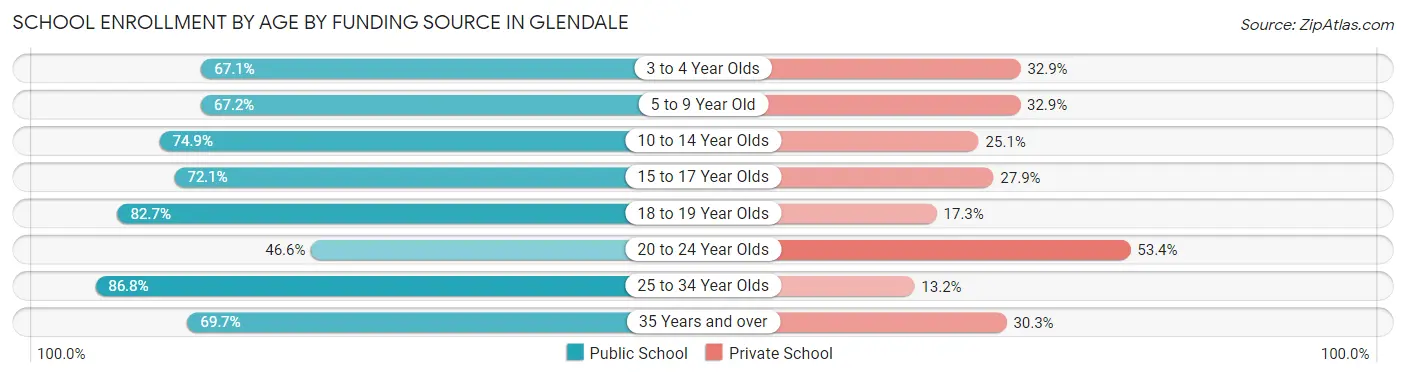
| Age Bracket | Public School | Private School |
| 3 to 4 Year Olds | 55 (67.1%) | 27 (32.9%) |
| 5 to 9 Year Old | 419 (67.1%) | 205 (32.9%) |
| 10 to 14 Year Olds | 551 (74.9%) | 185 (25.1%) |
| 15 to 17 Year Olds | 437 (72.1%) | 169 (27.9%) |
| 18 to 19 Year Olds | 215 (82.7%) | 45 (17.3%) |
| 20 to 24 Year Olds | 96 (46.6%) | 110 (53.4%) |
| 25 to 34 Year Olds | 191 (86.8%) | 29 (13.2%) |
| 35 Years and over | 131 (69.7%) | 57 (30.3%) |
| Total | 2,095 (71.7%) | 827 (28.3%) |
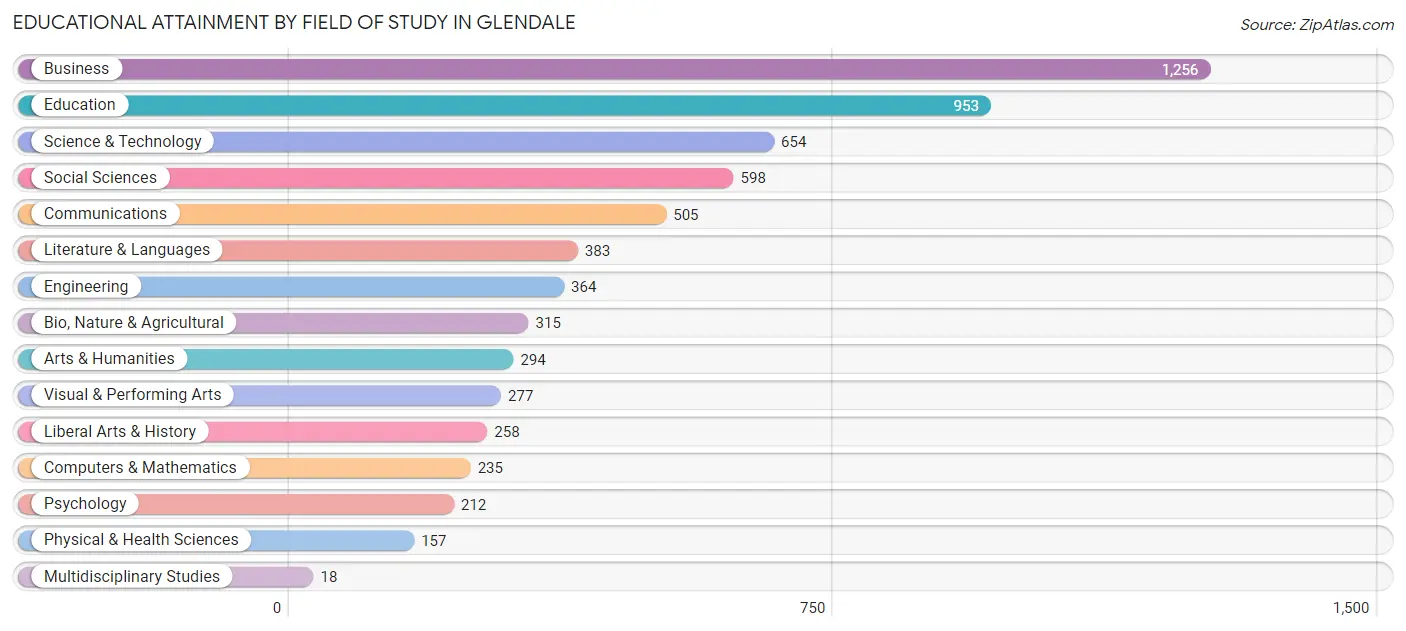
Educational Attainment by Field of Study in Glendale
Business (1,256 | 19.4%), education (953 | 14.7%), science & technology (654 | 10.1%), social sciences (598 | 9.2%), and communications (505 | 7.8%) are the most common fields of study among 6,479 individuals in Glendale who have obtained a bachelor's degree or higher.
| Field of Study | # Graduates | % Graduates |
| Computers & Mathematics | 235 | 3.6% |
| Bio, Nature & Agricultural | 315 | 4.9% |
| Physical & Health Sciences | 157 | 2.4% |
| Psychology | 212 | 3.3% |
| Social Sciences | 598 | 9.2% |
| Engineering | 364 | 5.6% |
| Multidisciplinary Studies | 18 | 0.3% |
| Science & Technology | 654 | 10.1% |
| Business | 1,256 | 19.4% |
| Education | 953 | 14.7% |
| Literature & Languages | 383 | 5.9% |
| Liberal Arts & History | 258 | 4.0% |
| Visual & Performing Arts | 277 | 4.3% |
| Communications | 505 | 7.8% |
| Arts & Humanities | 294 | 4.5% |
| Total | 6,479 | 100.0% |
Transportation & Commute in Glendale
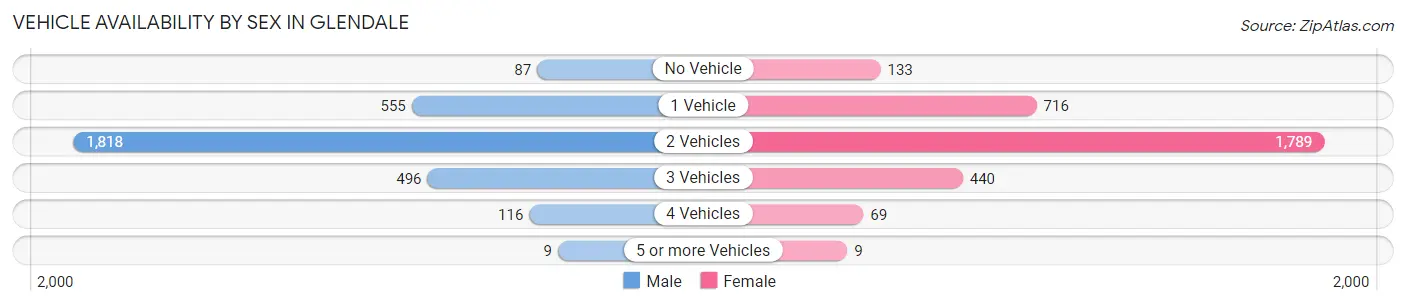
Vehicle Availability by Sex in Glendale
The most prevalent vehicle ownership categories in Glendale are males with 2 vehicles (1,818, accounting for 59.0%) and females with 2 vehicles (1,789, making up 57.6%).
| Vehicles Available | Male | Female |
| No Vehicle | 87 (2.8%) | 133 (4.2%) |
| 1 Vehicle | 555 (18.0%) | 716 (22.7%) |
| 2 Vehicles | 1,818 (59.0%) | 1,789 (56.7%) |
| 3 Vehicles | 496 (16.1%) | 440 (13.9%) |
| 4 Vehicles | 116 (3.8%) | 69 (2.2%) |
| 5 or more Vehicles | 9 (0.3%) | 9 (0.3%) |
| Total | 3,081 (100.0%) | 3,156 (100.0%) |
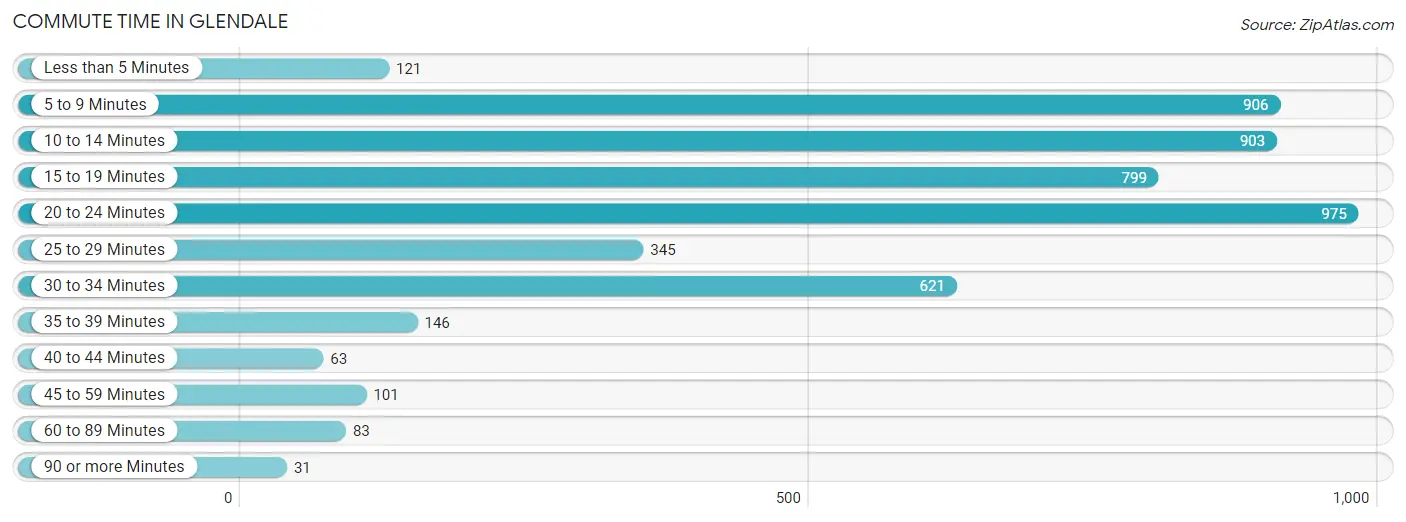
Commute Time in Glendale
The most frequently occuring commute durations in Glendale are 20 to 24 minutes (975 commuters, 19.1%), 5 to 9 minutes (906 commuters, 17.8%), and 10 to 14 minutes (903 commuters, 17.7%).
| Commute Time | # Commuters | % Commuters |
| Less than 5 Minutes | 121 | 2.4% |
| 5 to 9 Minutes | 906 | 17.8% |
| 10 to 14 Minutes | 903 | 17.7% |
| 15 to 19 Minutes | 799 | 15.7% |
| 20 to 24 Minutes | 975 | 19.1% |
| 25 to 29 Minutes | 345 | 6.8% |
| 30 to 34 Minutes | 621 | 12.2% |
| 35 to 39 Minutes | 146 | 2.9% |
| 40 to 44 Minutes | 63 | 1.2% |
| 45 to 59 Minutes | 101 | 2.0% |
| 60 to 89 Minutes | 83 | 1.6% |
| 90 or more Minutes | 31 | 0.6% |
Commute Time by Sex in Glendale
The most common commute times in Glendale are 20 to 24 minutes (580 commuters, 23.0%) for males and 5 to 9 minutes (522 commuters, 20.3%) for females.
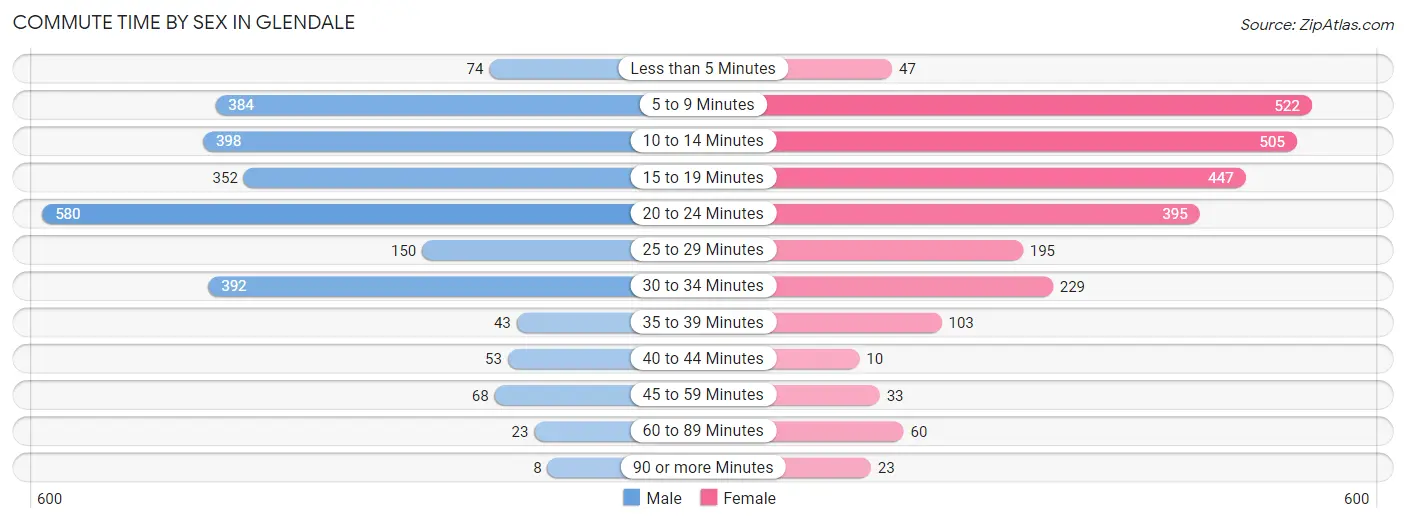
| Commute Time | Male | Female |
| Less than 5 Minutes | 74 (2.9%) | 47 (1.8%) |
| 5 to 9 Minutes | 384 (15.2%) | 522 (20.3%) |
| 10 to 14 Minutes | 398 (15.8%) | 505 (19.7%) |
| 15 to 19 Minutes | 352 (13.9%) | 447 (17.4%) |
| 20 to 24 Minutes | 580 (23.0%) | 395 (15.4%) |
| 25 to 29 Minutes | 150 (5.9%) | 195 (7.6%) |
| 30 to 34 Minutes | 392 (15.5%) | 229 (8.9%) |
| 35 to 39 Minutes | 43 (1.7%) | 103 (4.0%) |
| 40 to 44 Minutes | 53 (2.1%) | 10 (0.4%) |
| 45 to 59 Minutes | 68 (2.7%) | 33 (1.3%) |
| 60 to 89 Minutes | 23 (0.9%) | 60 (2.3%) |
| 90 or more Minutes | 8 (0.3%) | 23 (0.9%) |
Time of Departure to Work by Sex in Glendale
The most frequent times of departure to work in Glendale are 7:00 AM to 7:29 AM (469, 18.6%) for males and 7:30 AM to 7:59 AM (614, 23.9%) for females.
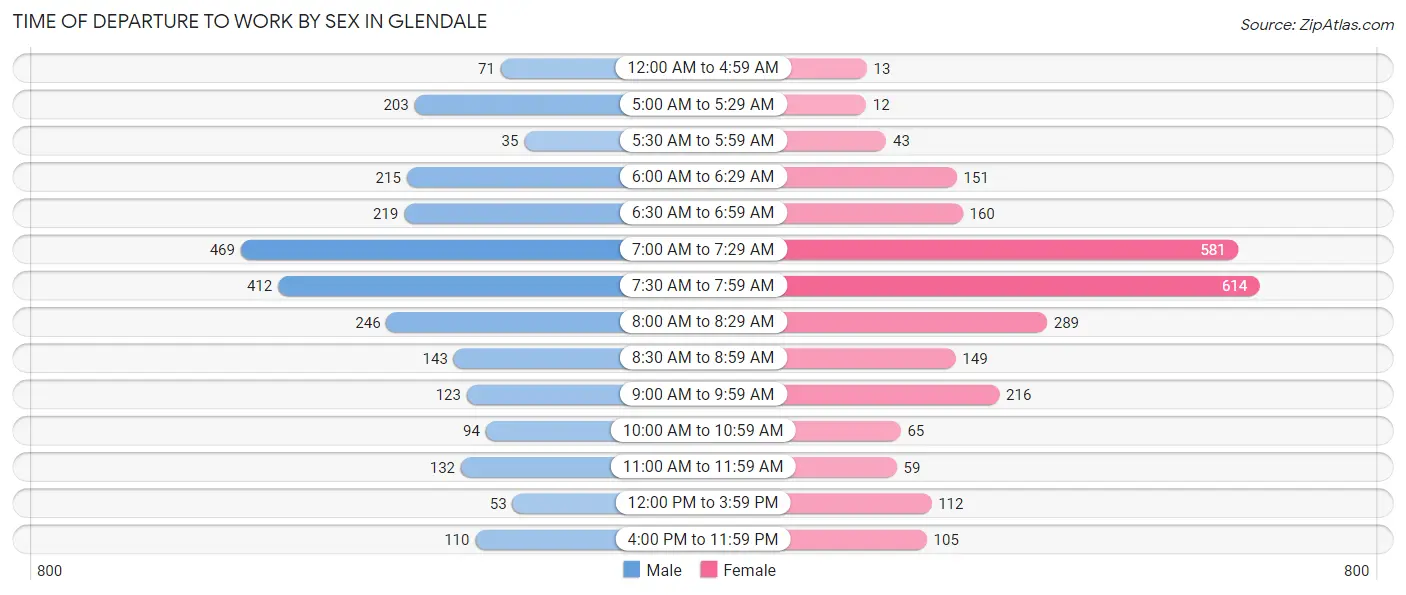
| Time of Departure | Male | Female |
| 12:00 AM to 4:59 AM | 71 (2.8%) | 13 (0.5%) |
| 5:00 AM to 5:29 AM | 203 (8.0%) | 12 (0.5%) |
| 5:30 AM to 5:59 AM | 35 (1.4%) | 43 (1.7%) |
| 6:00 AM to 6:29 AM | 215 (8.5%) | 151 (5.9%) |
| 6:30 AM to 6:59 AM | 219 (8.7%) | 160 (6.2%) |
| 7:00 AM to 7:29 AM | 469 (18.6%) | 581 (22.6%) |
| 7:30 AM to 7:59 AM | 412 (16.3%) | 614 (23.9%) |
| 8:00 AM to 8:29 AM | 246 (9.7%) | 289 (11.3%) |
| 8:30 AM to 8:59 AM | 143 (5.7%) | 149 (5.8%) |
| 9:00 AM to 9:59 AM | 123 (4.9%) | 216 (8.4%) |
| 10:00 AM to 10:59 AM | 94 (3.7%) | 65 (2.5%) |
| 11:00 AM to 11:59 AM | 132 (5.2%) | 59 (2.3%) |
| 12:00 PM to 3:59 PM | 53 (2.1%) | 112 (4.4%) |
| 4:00 PM to 11:59 PM | 110 (4.4%) | 105 (4.1%) |
| Total | 2,525 (100.0%) | 2,569 (100.0%) |
Housing Occupancy in Glendale
Occupancy by Ownership in Glendale
Of the total 5,815 dwellings in Glendale, owner-occupied units account for 3,956 (68.0%), while renter-occupied units make up 1,859 (32.0%).
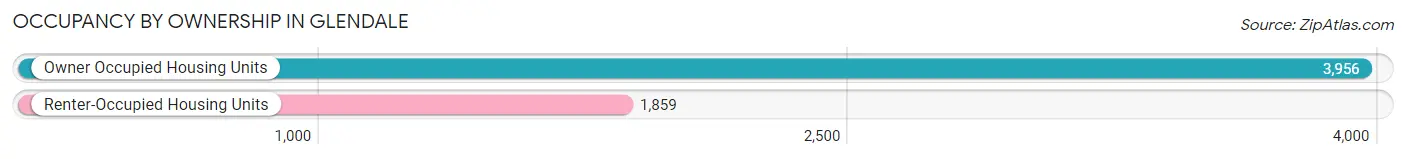
| Occupancy | # Housing Units | % Housing Units |
| Owner Occupied Housing Units | 3,956 | 68.0% |
| Renter-Occupied Housing Units | 1,859 | 32.0% |
| Total Occupied Housing Units | 5,815 | 100.0% |
Occupancy by Household Size in Glendale
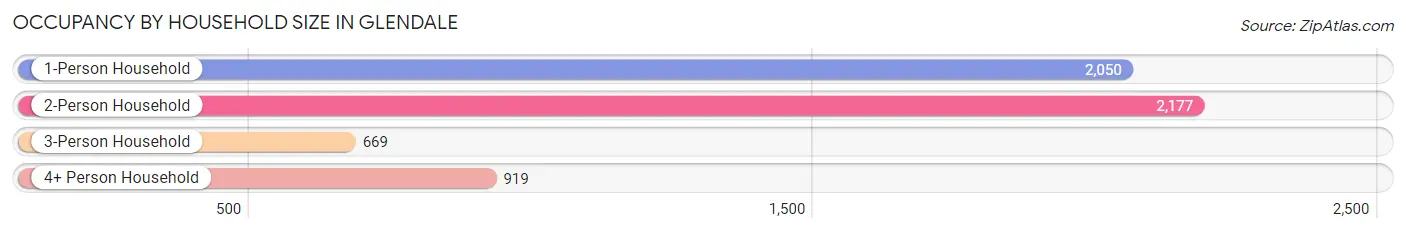
| Household Size | # Housing Units | % Housing Units |
| 1-Person Household | 2,050 | 35.2% |
| 2-Person Household | 2,177 | 37.4% |
| 3-Person Household | 669 | 11.5% |
| 4+ Person Household | 919 | 15.8% |
| Total Housing Units | 5,815 | 100.0% |
Occupancy by Ownership by Household Size in Glendale
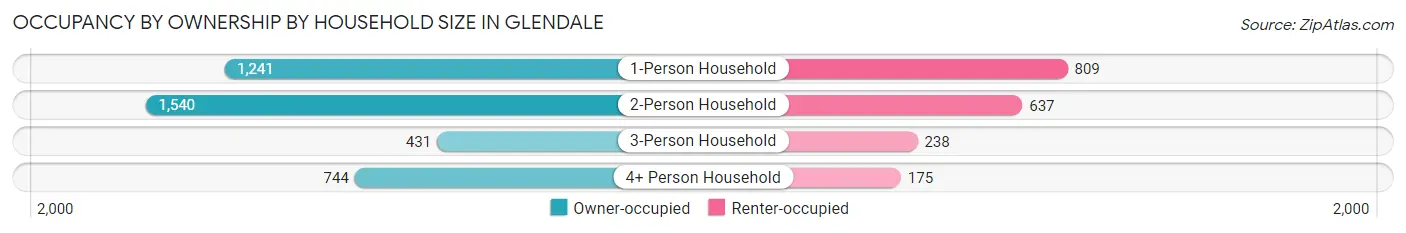
| Household Size | Owner-occupied | Renter-occupied |
| 1-Person Household | 1,241 (60.5%) | 809 (39.5%) |
| 2-Person Household | 1,540 (70.7%) | 637 (29.3%) |
| 3-Person Household | 431 (64.4%) | 238 (35.6%) |
| 4+ Person Household | 744 (81.0%) | 175 (19.0%) |
| Total Housing Units | 3,956 (68.0%) | 1,859 (32.0%) |
Occupancy by Educational Attainment in Glendale
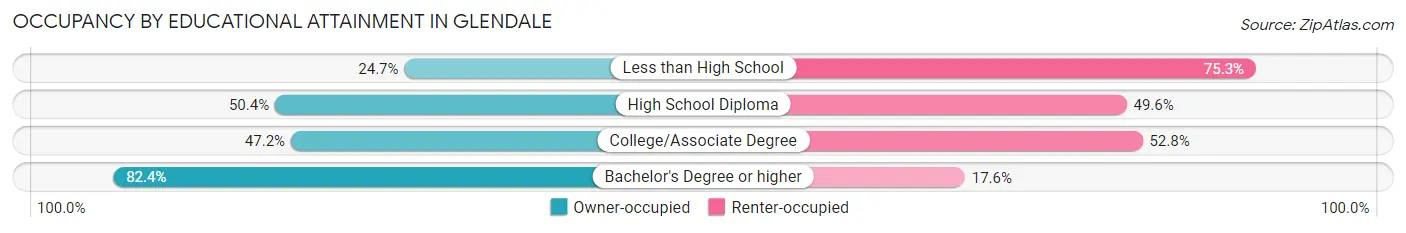
| Household Size | Owner-occupied | Renter-occupied |
| Less than High School | 42 (24.7%) | 128 (75.3%) |
| High School Diploma | 350 (50.4%) | 345 (49.6%) |
| College/Associate Degree | 692 (47.2%) | 774 (52.8%) |
| Bachelor's Degree or higher | 2,872 (82.4%) | 612 (17.6%) |
Occupancy by Age of Householder in Glendale
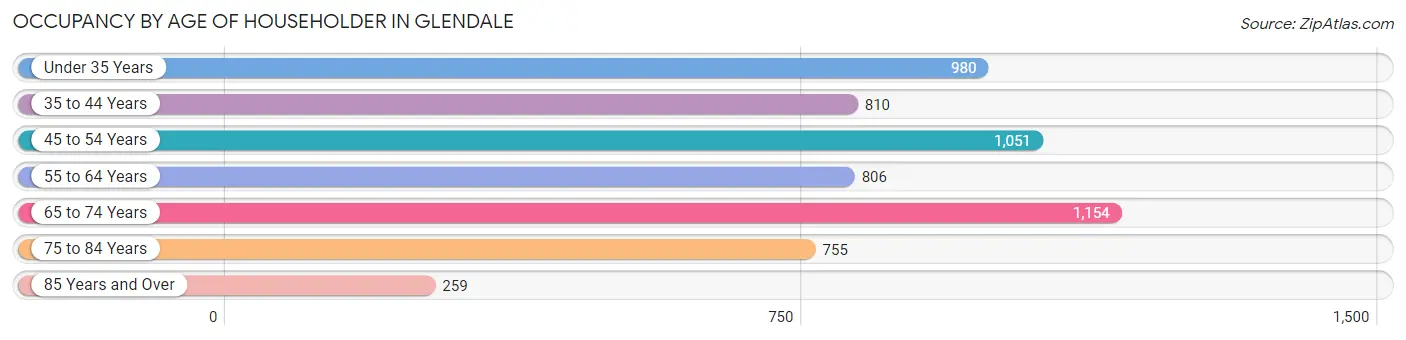
| Age Bracket | # Households | % Households |
| Under 35 Years | 980 | 16.9% |
| 35 to 44 Years | 810 | 13.9% |
| 45 to 54 Years | 1,051 | 18.1% |
| 55 to 64 Years | 806 | 13.9% |
| 65 to 74 Years | 1,154 | 19.9% |
| 75 to 84 Years | 755 | 13.0% |
| 85 Years and Over | 259 | 4.4% |
| Total | 5,815 | 100.0% |
Housing Finances in Glendale
Median Income by Occupancy in Glendale
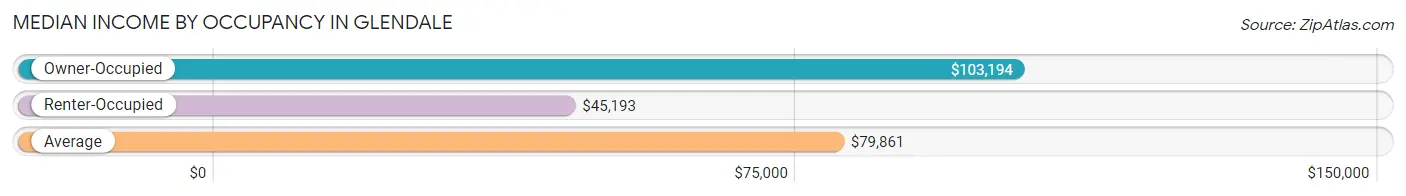
| Occupancy Type | # Households | Median Income |
| Owner-Occupied | 3,956 (68.0%) | $103,194 |
| Renter-Occupied | 1,859 (32.0%) | $45,193 |
| Average | 5,815 (100.0%) | $79,861 |
Occupancy by Householder Income Bracket in Glendale
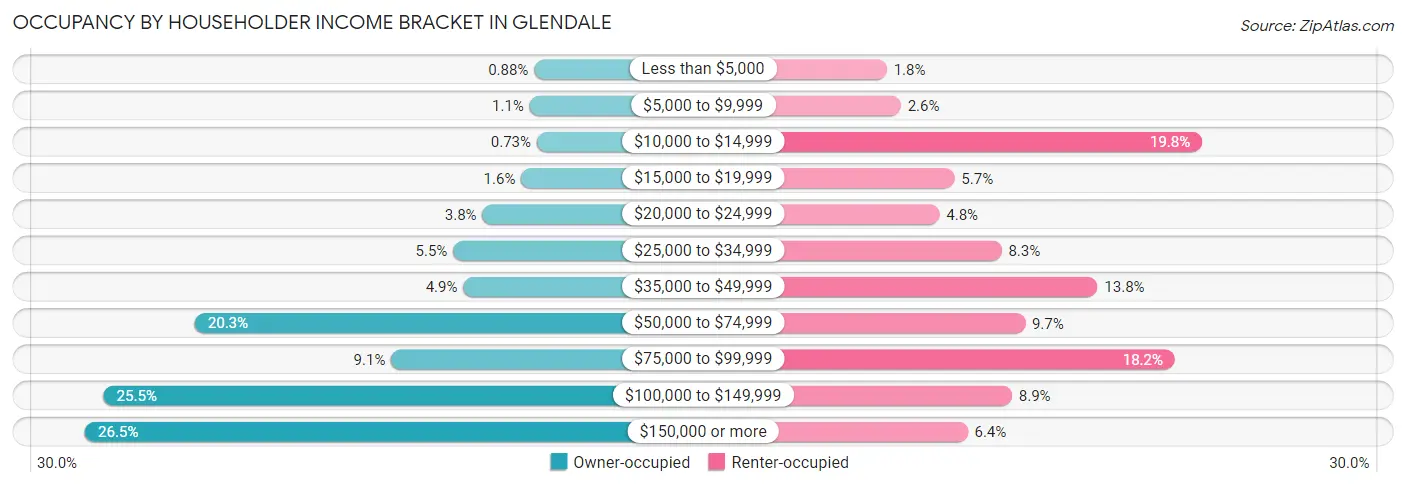
| Income Bracket | Owner-occupied | Renter-occupied |
| Less than $5,000 | 35 (0.9%) | 33 (1.8%) |
| $5,000 to $9,999 | 45 (1.1%) | 48 (2.6%) |
| $10,000 to $14,999 | 29 (0.7%) | 368 (19.8%) |
| $15,000 to $19,999 | 64 (1.6%) | 105 (5.7%) |
| $20,000 to $24,999 | 152 (3.8%) | 89 (4.8%) |
| $25,000 to $34,999 | 218 (5.5%) | 155 (8.3%) |
| $35,000 to $49,999 | 195 (4.9%) | 257 (13.8%) |
| $50,000 to $74,999 | 802 (20.3%) | 180 (9.7%) |
| $75,000 to $99,999 | 358 (9.0%) | 339 (18.2%) |
| $100,000 to $149,999 | 1,008 (25.5%) | 166 (8.9%) |
| $150,000 or more | 1,050 (26.5%) | 119 (6.4%) |
| Total | 3,956 (100.0%) | 1,859 (100.0%) |
Monthly Housing Cost Tiers in Glendale
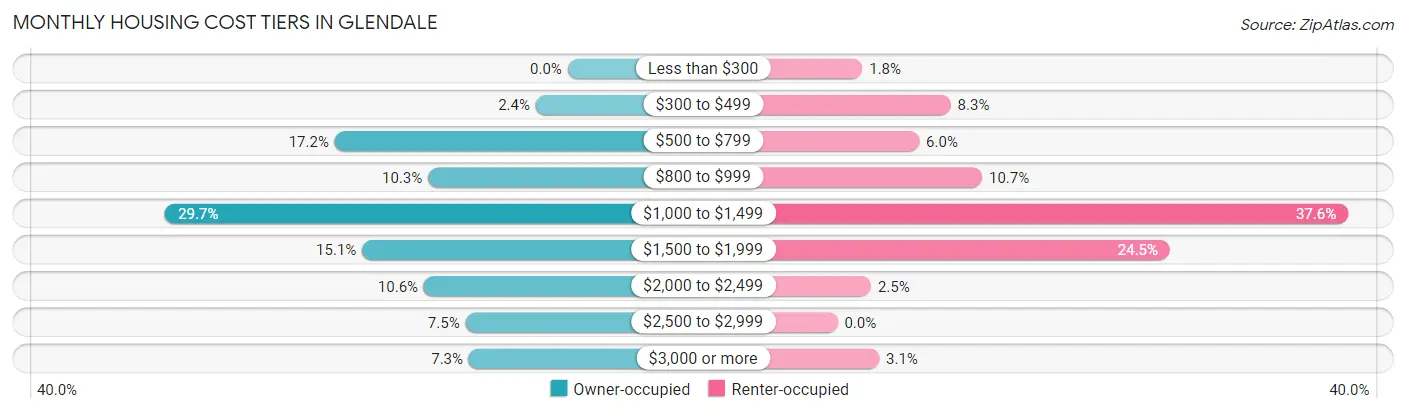
| Monthly Cost | Owner-occupied | Renter-occupied |
| Less than $300 | 0 (0.0%) | 34 (1.8%) |
| $300 to $499 | 93 (2.4%) | 155 (8.3%) |
| $500 to $799 | 679 (17.2%) | 112 (6.0%) |
| $800 to $999 | 407 (10.3%) | 198 (10.6%) |
| $1,000 to $1,499 | 1,173 (29.6%) | 699 (37.6%) |
| $1,500 to $1,999 | 599 (15.1%) | 455 (24.5%) |
| $2,000 to $2,499 | 419 (10.6%) | 46 (2.5%) |
| $2,500 to $2,999 | 298 (7.5%) | 0 (0.0%) |
| $3,000 or more | 288 (7.3%) | 57 (3.1%) |
| Total | 3,956 (100.0%) | 1,859 (100.0%) |
Physical Housing Characteristics in Glendale
Housing Structures in Glendale
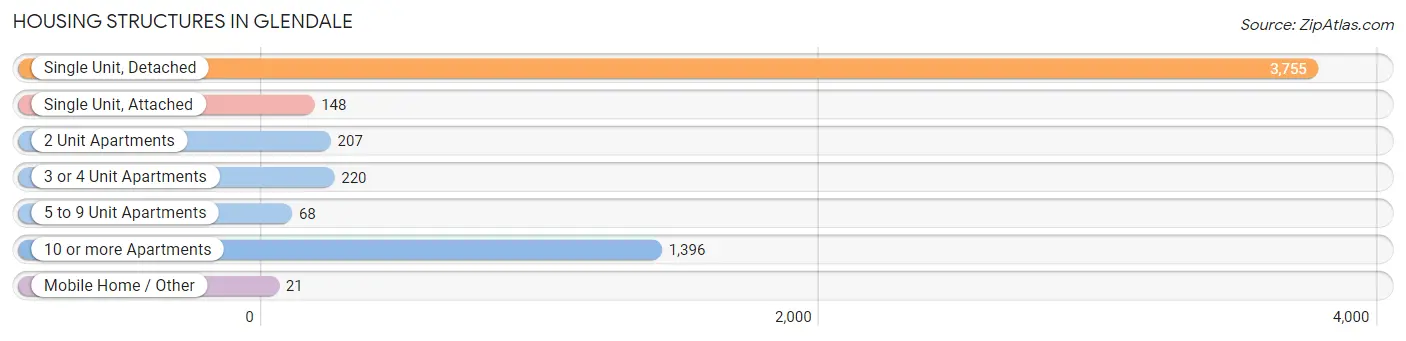
| Structure Type | # Housing Units | % Housing Units |
| Single Unit, Detached | 3,755 | 64.6% |
| Single Unit, Attached | 148 | 2.5% |
| 2 Unit Apartments | 207 | 3.6% |
| 3 or 4 Unit Apartments | 220 | 3.8% |
| 5 to 9 Unit Apartments | 68 | 1.2% |
| 10 or more Apartments | 1,396 | 24.0% |
| Mobile Home / Other | 21 | 0.4% |
| Total | 5,815 | 100.0% |
Housing Structures by Occupancy in Glendale
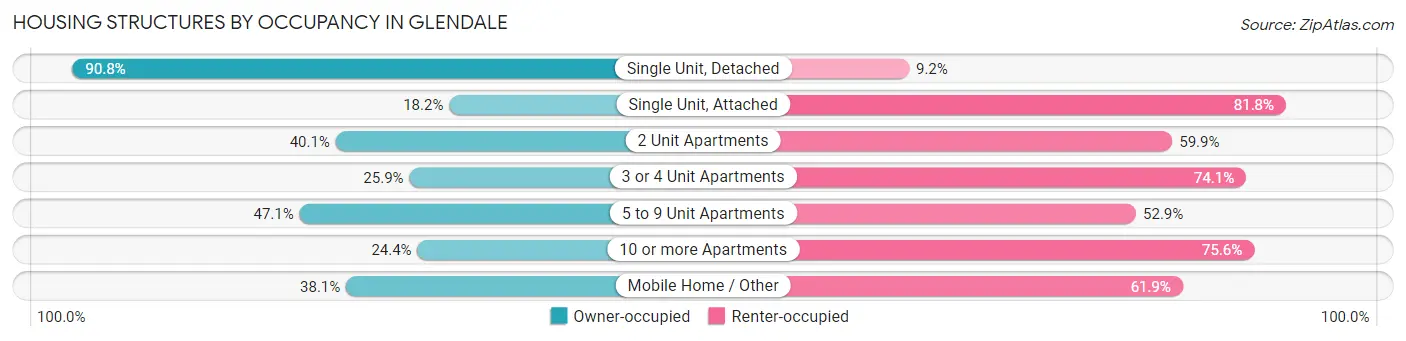
| Structure Type | Owner-occupied | Renter-occupied |
| Single Unit, Detached | 3,409 (90.8%) | 346 (9.2%) |
| Single Unit, Attached | 27 (18.2%) | 121 (81.8%) |
| 2 Unit Apartments | 83 (40.1%) | 124 (59.9%) |
| 3 or 4 Unit Apartments | 57 (25.9%) | 163 (74.1%) |
| 5 to 9 Unit Apartments | 32 (47.1%) | 36 (52.9%) |
| 10 or more Apartments | 340 (24.4%) | 1,056 (75.6%) |
| Mobile Home / Other | 8 (38.1%) | 13 (61.9%) |
| Total | 3,956 (68.0%) | 1,859 (32.0%) |
Housing Structures by Number of Rooms in Glendale
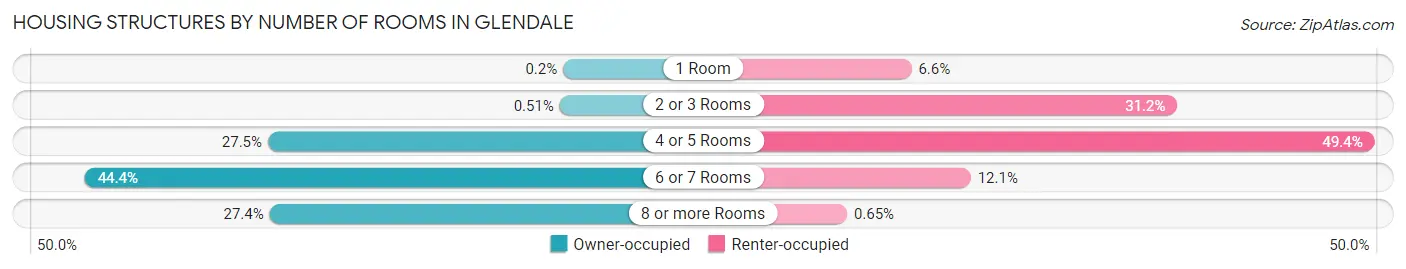
| Number of Rooms | Owner-occupied | Renter-occupied |
| 1 Room | 8 (0.2%) | 123 (6.6%) |
| 2 or 3 Rooms | 20 (0.5%) | 580 (31.2%) |
| 4 or 5 Rooms | 1,088 (27.5%) | 919 (49.4%) |
| 6 or 7 Rooms | 1,758 (44.4%) | 225 (12.1%) |
| 8 or more Rooms | 1,082 (27.4%) | 12 (0.6%) |
| Total | 3,956 (100.0%) | 1,859 (100.0%) |
Housing Structure by Heating Type in Glendale
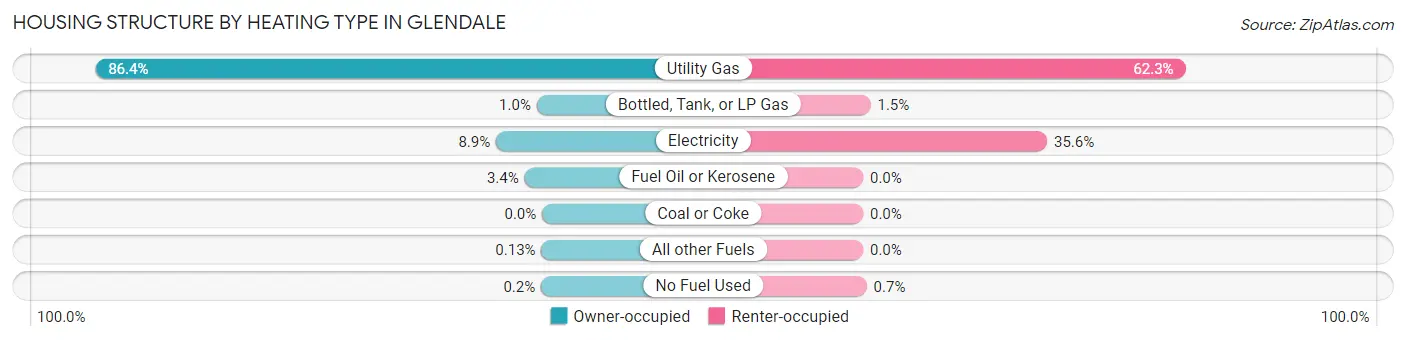
| Heating Type | Owner-occupied | Renter-occupied |
| Utility Gas | 3,416 (86.4%) | 1,158 (62.3%) |
| Bottled, Tank, or LP Gas | 41 (1.0%) | 27 (1.5%) |
| Electricity | 352 (8.9%) | 661 (35.6%) |
| Fuel Oil or Kerosene | 134 (3.4%) | 0 (0.0%) |
| Coal or Coke | 0 (0.0%) | 0 (0.0%) |
| All other Fuels | 5 (0.1%) | 0 (0.0%) |
| No Fuel Used | 8 (0.2%) | 13 (0.7%) |
| Total | 3,956 (100.0%) | 1,859 (100.0%) |
Household Vehicle Usage in Glendale
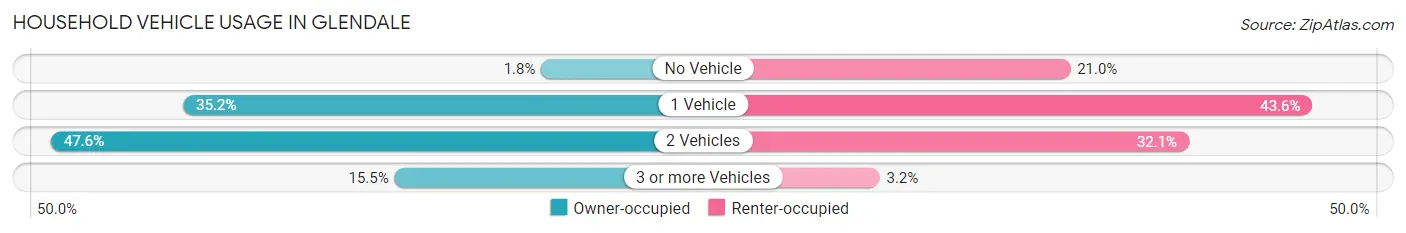
| Vehicles per Household | Owner-occupied | Renter-occupied |
| No Vehicle | 70 (1.8%) | 391 (21.0%) |
| 1 Vehicle | 1,393 (35.2%) | 811 (43.6%) |
| 2 Vehicles | 1,881 (47.5%) | 597 (32.1%) |
| 3 or more Vehicles | 612 (15.5%) | 60 (3.2%) |
| Total | 3,956 (100.0%) | 1,859 (100.0%) |
Real Estate & Mortgages in Glendale
Real Estate and Mortgage Overview in Glendale
| Characteristic | Without Mortgage | With Mortgage |
| Housing Units | 1,693 | 2,263 |
| Median Property Value | $231,300 | $266,700 |
| Median Household Income | $60,243 | $679 |
| Monthly Housing Costs | $849 | $288 |
| Real Estate Taxes | $5,401 | $0 |
Property Value by Mortgage Status in Glendale
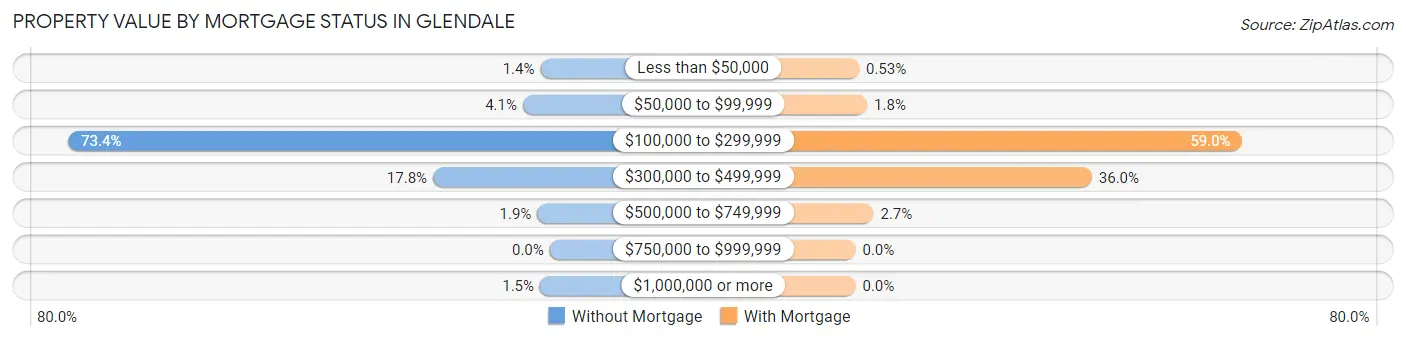
| Property Value | Without Mortgage | With Mortgage |
| Less than $50,000 | 24 (1.4%) | 12 (0.5%) |
| $50,000 to $99,999 | 69 (4.1%) | 40 (1.8%) |
| $100,000 to $299,999 | 1,242 (73.4%) | 1,334 (59.0%) |
| $300,000 to $499,999 | 301 (17.8%) | 815 (36.0%) |
| $500,000 to $749,999 | 32 (1.9%) | 62 (2.7%) |
| $750,000 to $999,999 | 0 (0.0%) | 0 (0.0%) |
| $1,000,000 or more | 25 (1.5%) | 0 (0.0%) |
| Total | 1,693 (100.0%) | 2,263 (100.0%) |
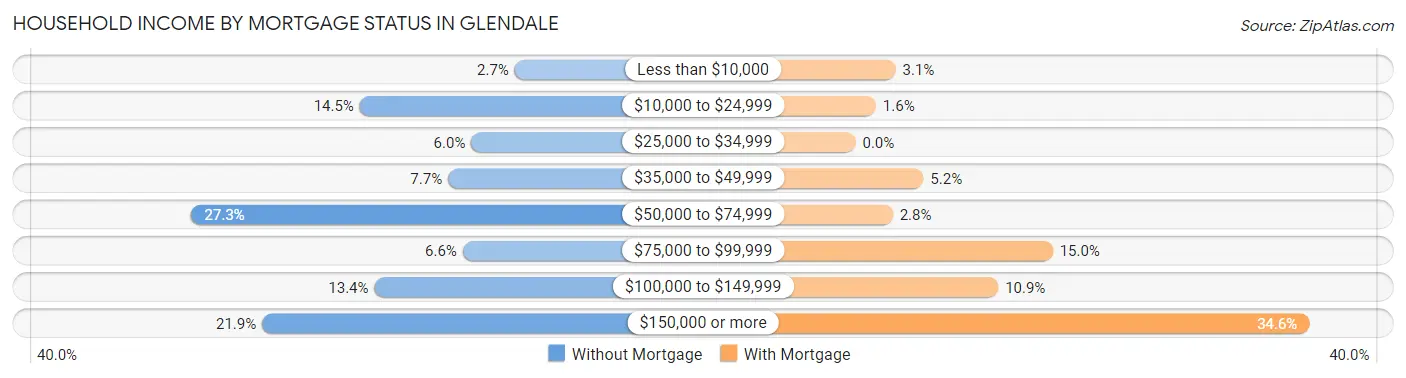
Household Income by Mortgage Status in Glendale
| Household Income | Without Mortgage | With Mortgage |
| Less than $10,000 | 45 (2.7%) | 69 (3.0%) |
| $10,000 to $24,999 | 245 (14.5%) | 35 (1.5%) |
| $25,000 to $34,999 | 101 (6.0%) | 0 (0.0%) |
| $35,000 to $49,999 | 131 (7.7%) | 117 (5.2%) |
| $50,000 to $74,999 | 462 (27.3%) | 64 (2.8%) |
| $75,000 to $99,999 | 112 (6.6%) | 340 (15.0%) |
| $100,000 to $149,999 | 226 (13.4%) | 246 (10.9%) |
| $150,000 or more | 371 (21.9%) | 782 (34.6%) |
| Total | 1,693 (100.0%) | 2,263 (100.0%) |
Property Value to Household Income Ratio in Glendale
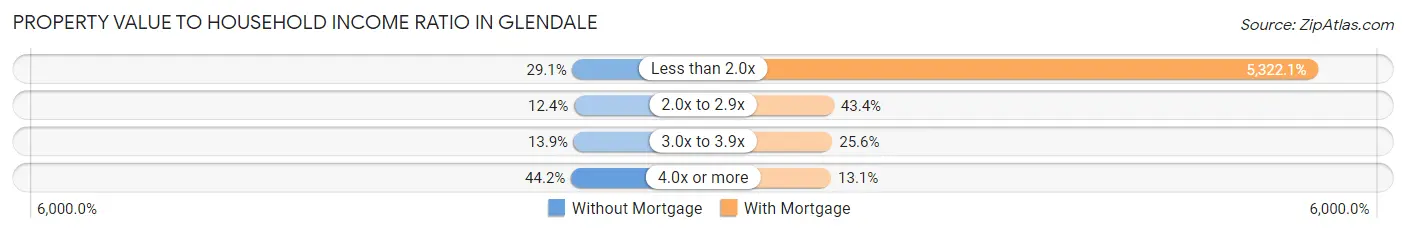
| Value-to-Income Ratio | Without Mortgage | With Mortgage |
| Less than 2.0x | 492 (29.1%) | 120,438 (5,322.1%) |
| 2.0x to 2.9x | 210 (12.4%) | 981 (43.3%) |
| 3.0x to 3.9x | 236 (13.9%) | 580 (25.6%) |
| 4.0x or more | 748 (44.2%) | 296 (13.1%) |
| Total | 1,693 (100.0%) | 2,263 (100.0%) |
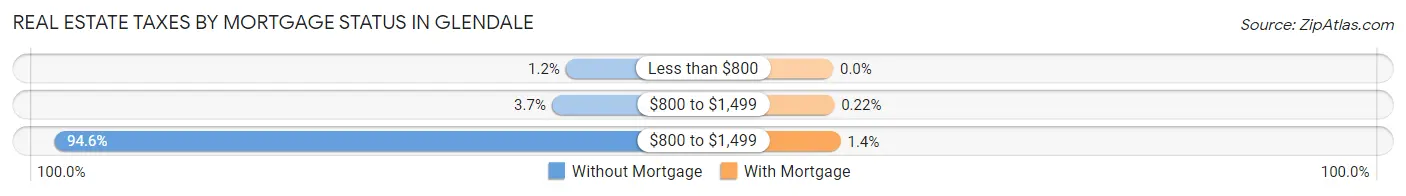
Real Estate Taxes by Mortgage Status in Glendale
| Property Taxes | Without Mortgage | With Mortgage |
| Less than $800 | 20 (1.2%) | 0 (0.0%) |
| $800 to $1,499 | 63 (3.7%) | 5 (0.2%) |
| $800 to $1,499 | 1,602 (94.6%) | 31 (1.4%) |
| Total | 1,693 (100.0%) | 2,263 (100.0%) |
Health & Disability in Glendale
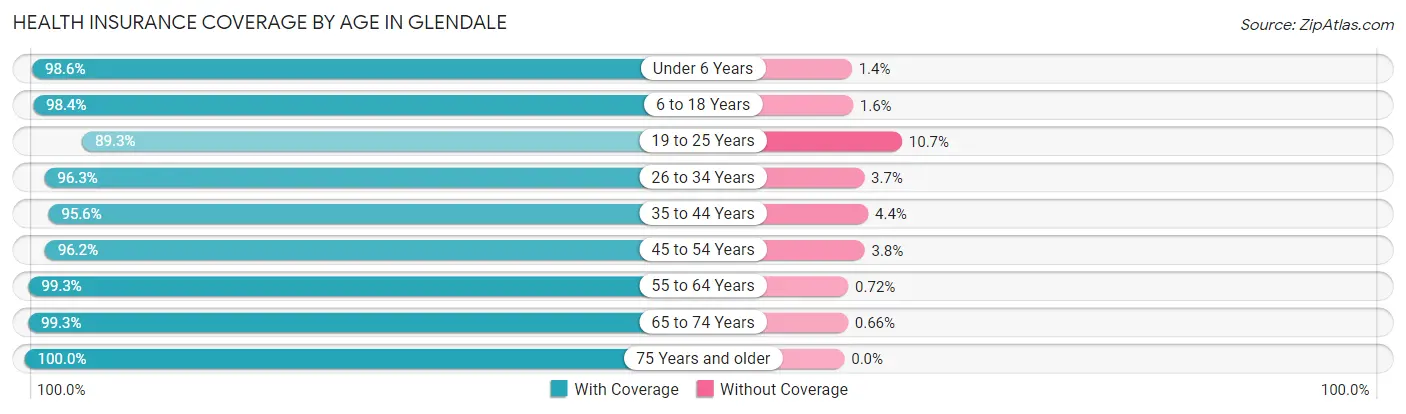
Health Insurance Coverage by Age in Glendale
| Age Bracket | With Coverage | Without Coverage |
| Under 6 Years | 710 (98.6%) | 10 (1.4%) |
| 6 to 18 Years | 2,036 (98.4%) | 33 (1.6%) |
| 19 to 25 Years | 673 (89.3%) | 81 (10.7%) |
| 26 to 34 Years | 1,381 (96.3%) | 53 (3.7%) |
| 35 to 44 Years | 1,505 (95.6%) | 70 (4.4%) |
| 45 to 54 Years | 1,812 (96.2%) | 71 (3.8%) |
| 55 to 64 Years | 1,237 (99.3%) | 9 (0.7%) |
| 65 to 74 Years | 1,971 (99.3%) | 13 (0.7%) |
| 75 Years and older | 1,276 (100.0%) | 0 (0.0%) |
| Total | 12,601 (97.4%) | 340 (2.6%) |
Health Insurance Coverage by Citizenship Status in Glendale
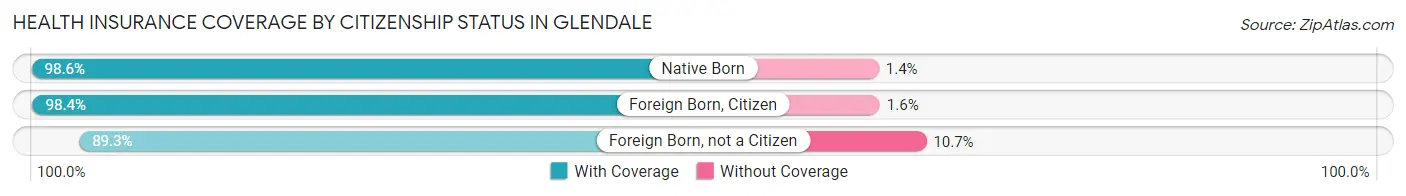
| Citizenship Status | With Coverage | Without Coverage |
| Native Born | 710 (98.6%) | 10 (1.4%) |
| Foreign Born, Citizen | 2,036 (98.4%) | 33 (1.6%) |
| Foreign Born, not a Citizen | 673 (89.3%) | 81 (10.7%) |
Health Insurance Coverage by Household Income in Glendale
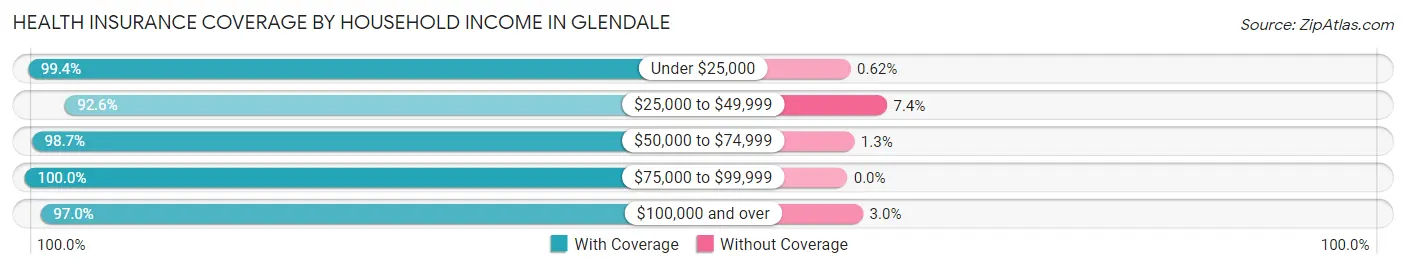
| Household Income | With Coverage | Without Coverage |
| Under $25,000 | 1,436 (99.4%) | 9 (0.6%) |
| $25,000 to $49,999 | 1,556 (92.6%) | 125 (7.4%) |
| $50,000 to $74,999 | 1,483 (98.7%) | 20 (1.3%) |
| $75,000 to $99,999 | 1,928 (100.0%) | 0 (0.0%) |
| $100,000 and over | 6,084 (97.0%) | 186 (3.0%) |
Public vs Private Health Insurance Coverage by Age in Glendale
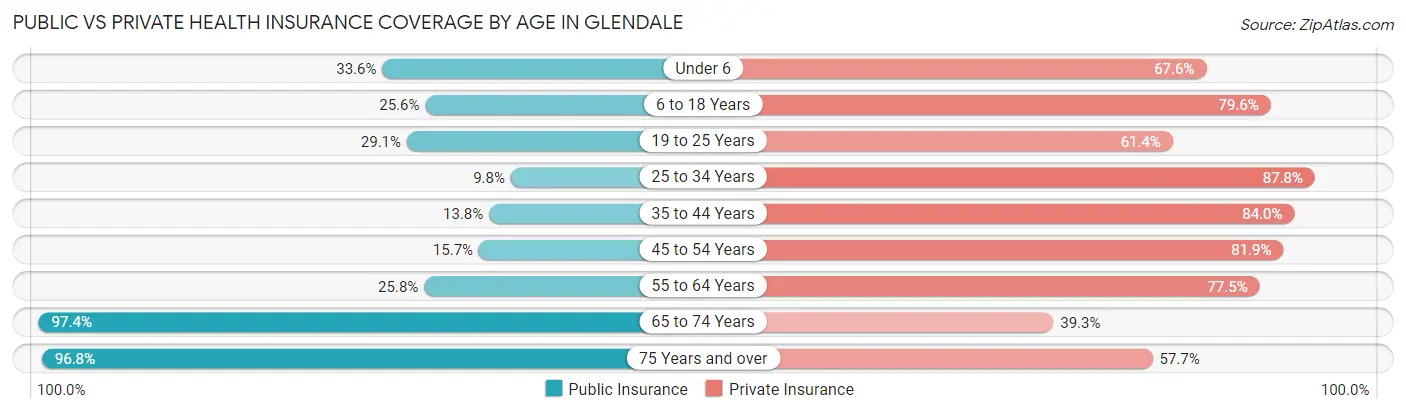
| Age Bracket | Public Insurance | Private Insurance |
| Under 6 | 242 (33.6%) | 487 (67.6%) |
| 6 to 18 Years | 530 (25.6%) | 1,647 (79.6%) |
| 19 to 25 Years | 219 (29.0%) | 463 (61.4%) |
| 25 to 34 Years | 140 (9.8%) | 1,259 (87.8%) |
| 35 to 44 Years | 217 (13.8%) | 1,323 (84.0%) |
| 45 to 54 Years | 295 (15.7%) | 1,543 (81.9%) |
| 55 to 64 Years | 322 (25.8%) | 966 (77.5%) |
| 65 to 74 Years | 1,932 (97.4%) | 779 (39.3%) |
| 75 Years and over | 1,235 (96.8%) | 736 (57.7%) |
| Total | 5,132 (39.7%) | 9,203 (71.1%) |
Disability Status by Sex by Age in Glendale
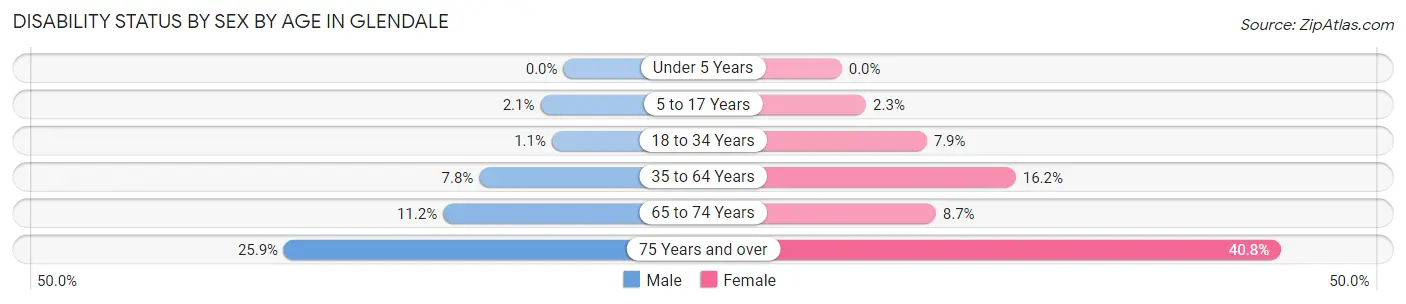
| Age Bracket | Male | Female |
| Under 5 Years | 0 (0.0%) | 0 (0.0%) |
| 5 to 17 Years | 16 (2.1%) | 28 (2.3%) |
| 18 to 34 Years | 13 (1.1%) | 90 (7.9%) |
| 35 to 64 Years | 175 (7.8%) | 398 (16.2%) |
| 65 to 74 Years | 86 (11.2%) | 106 (8.7%) |
| 75 Years and over | 133 (25.9%) | 311 (40.8%) |
Disability Class by Sex by Age in Glendale
Disability Class: Hearing Difficulty
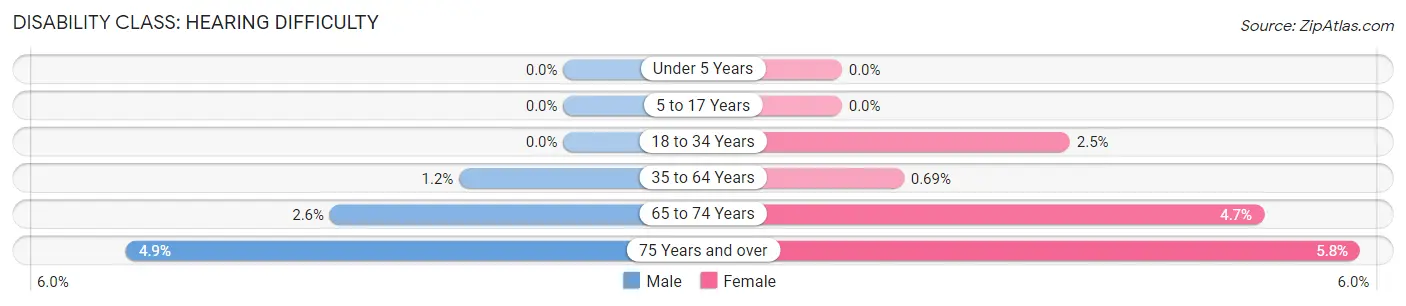
| Age Bracket | Male | Female |
| Under 5 Years | 0 (0.0%) | 0 (0.0%) |
| 5 to 17 Years | 0 (0.0%) | 0 (0.0%) |
| 18 to 34 Years | 0 (0.0%) | 29 (2.5%) |
| 35 to 64 Years | 26 (1.2%) | 17 (0.7%) |
| 65 to 74 Years | 20 (2.6%) | 57 (4.7%) |
| 75 Years and over | 25 (4.9%) | 44 (5.8%) |
Disability Class: Vision Difficulty
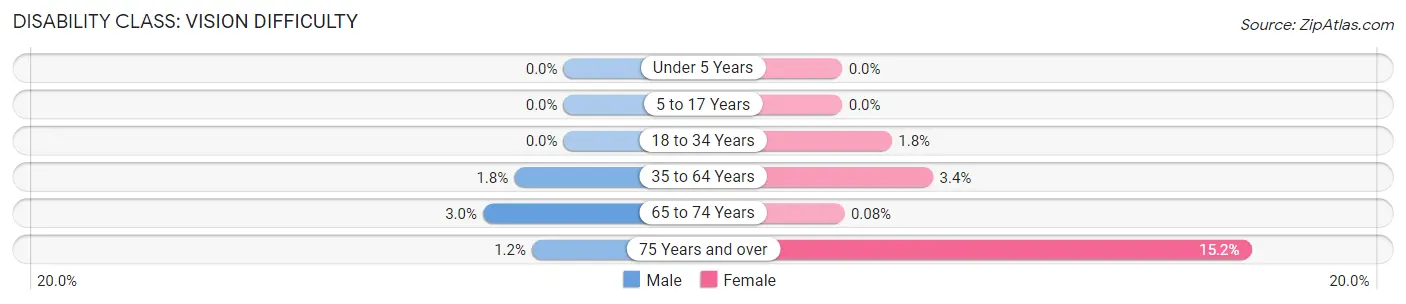
| Age Bracket | Male | Female |
| Under 5 Years | 0 (0.0%) | 0 (0.0%) |
| 5 to 17 Years | 0 (0.0%) | 0 (0.0%) |
| 18 to 34 Years | 0 (0.0%) | 21 (1.8%) |
| 35 to 64 Years | 41 (1.8%) | 83 (3.4%) |
| 65 to 74 Years | 23 (3.0%) | 1 (0.1%) |
| 75 Years and over | 6 (1.2%) | 116 (15.2%) |
Disability Class: Cognitive Difficulty
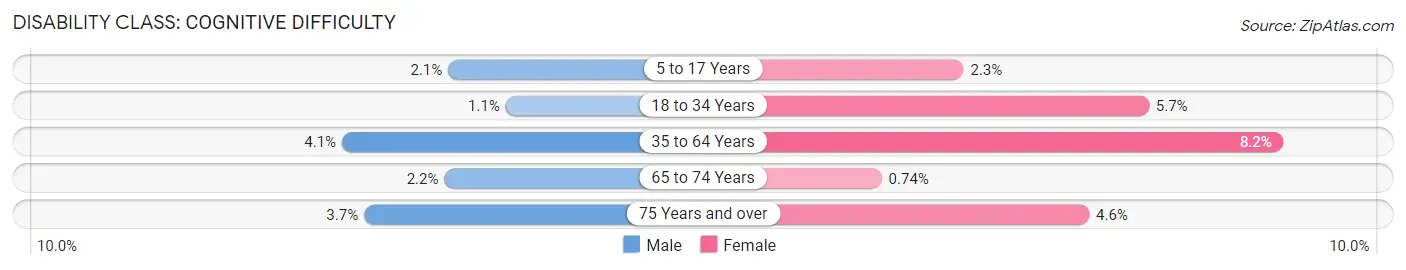
| Age Bracket | Male | Female |
| 5 to 17 Years | 16 (2.1%) | 28 (2.3%) |
| 18 to 34 Years | 13 (1.1%) | 65 (5.7%) |
| 35 to 64 Years | 92 (4.1%) | 202 (8.2%) |
| 65 to 74 Years | 17 (2.2%) | 9 (0.7%) |
| 75 Years and over | 19 (3.7%) | 35 (4.6%) |
Disability Class: Ambulatory Difficulty
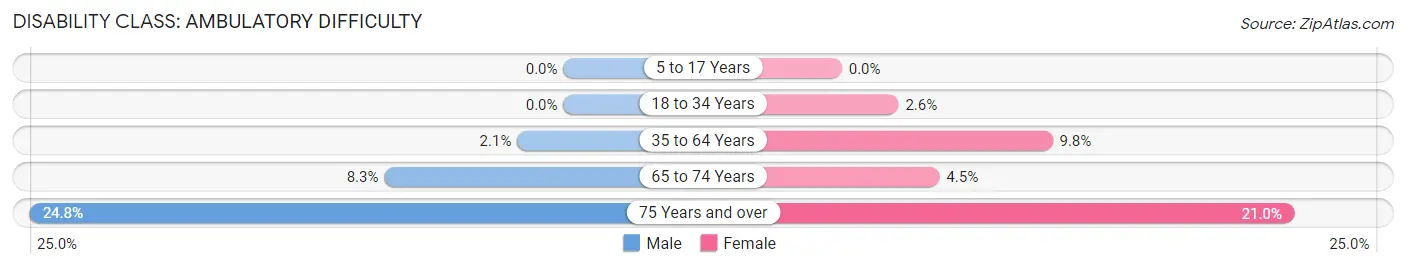
| Age Bracket | Male | Female |
| 5 to 17 Years | 0 (0.0%) | 0 (0.0%) |
| 18 to 34 Years | 0 (0.0%) | 30 (2.6%) |
| 35 to 64 Years | 48 (2.1%) | 241 (9.8%) |
| 65 to 74 Years | 64 (8.3%) | 55 (4.5%) |
| 75 Years and over | 127 (24.8%) | 160 (21.0%) |
Disability Class: Self-Care Difficulty
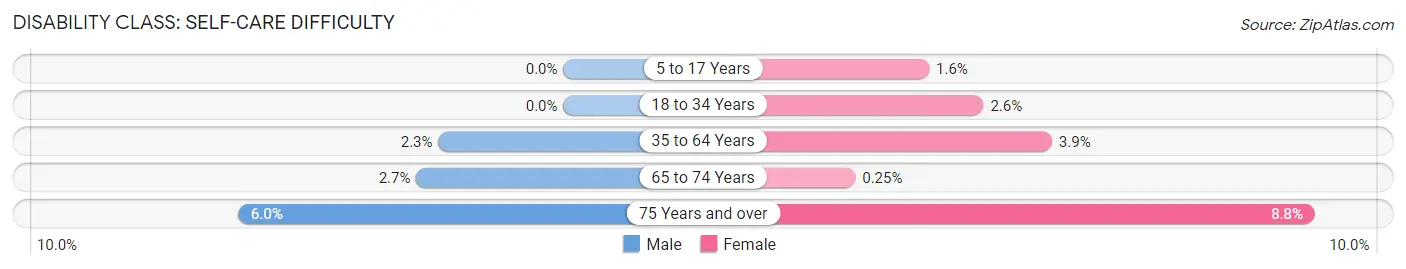
| Age Bracket | Male | Female |
| 5 to 17 Years | 0 (0.0%) | 20 (1.6%) |
| 18 to 34 Years | 0 (0.0%) | 30 (2.6%) |
| 35 to 64 Years | 52 (2.3%) | 96 (3.9%) |
| 65 to 74 Years | 21 (2.7%) | 3 (0.3%) |
| 75 Years and over | 31 (6.0%) | 67 (8.8%) |
Technology Access in Glendale
Computing Device Access in Glendale
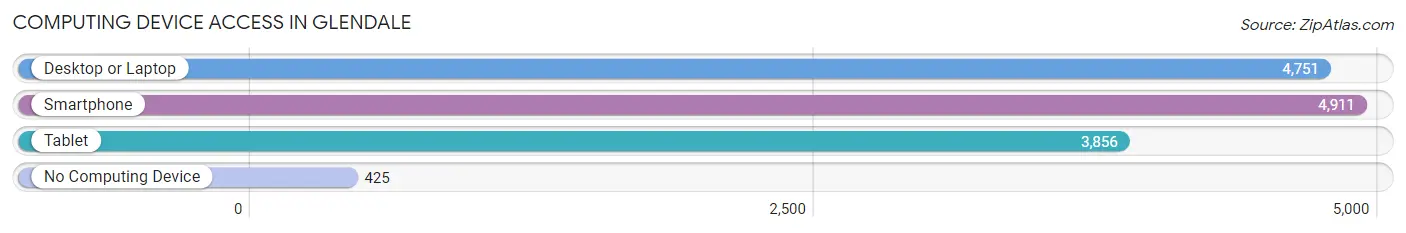
| Device Type | # Households | % Households |
| Desktop or Laptop | 4,751 | 81.7% |
| Smartphone | 4,911 | 84.5% |
| Tablet | 3,856 | 66.3% |
| No Computing Device | 425 | 7.3% |
| Total | 5,815 | 100.0% |
Internet Access in Glendale
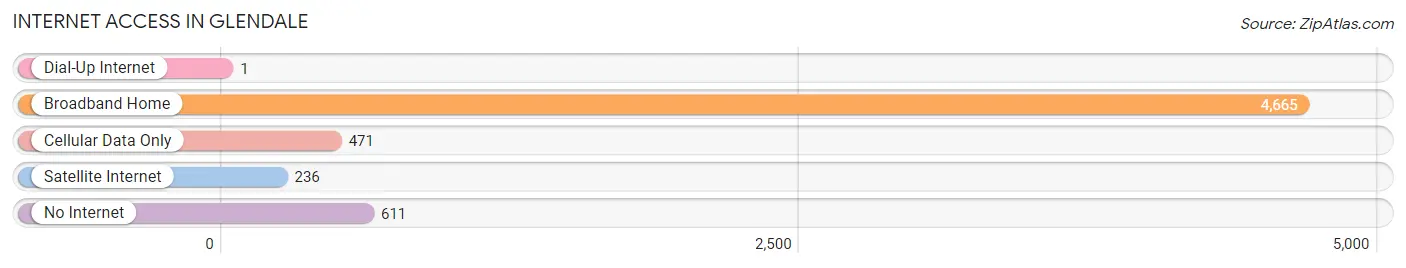
| Internet Type | # Households | % Households |
| Dial-Up Internet | 1 | 0.0% |
| Broadband Home | 4,665 | 80.2% |
| Cellular Data Only | 471 | 8.1% |
| Satellite Internet | 236 | 4.1% |
| No Internet | 611 | 10.5% |
| Total | 5,815 | 100.0% |
Glendale Summary
Glendale, Wisconsin is a small city located in Milwaukee County, Wisconsin. It is located just north of Milwaukee and is part of the Milwaukee metropolitan area. The city has a population of 12,872 as of the 2010 census.
History
Glendale was first settled in 1835 by a group of German immigrants. The city was originally known as Bohnersville, after the first settler, John Bohners. The city was later renamed Glendale in 1892. The name was chosen to reflect the city’s location near the Milwaukee River and its many glens.
The city was incorporated in 1950 and has since grown to become a thriving suburb of Milwaukee. The city is home to many businesses, including the Milwaukee Bucks basketball team, which plays its home games at the Fiserv Forum.
Geography
Glendale is located in Milwaukee County, Wisconsin. It is located just north of Milwaukee and is part of the Milwaukee metropolitan area. The city has a total area of 4.2 square miles, all of which is land. The city is bordered by the Milwaukee River to the east and the Menomonee River to the west.
The city has a humid continental climate, with cold winters and hot, humid summers. The average temperature in January is 22°F and the average temperature in July is 75°F. The city receives an average of 33 inches of precipitation per year.
Economy
Glendale’s economy is largely based on retail and services. The city is home to many businesses, including the Milwaukee Bucks basketball team, which plays its home games at the Fiserv Forum. The city is also home to many restaurants, bars, and other retail establishments.
The city is also home to several large employers, including BMO Harris Bank, Kohl’s, and the Milwaukee Bucks. The city also has a large manufacturing sector, with companies such as Briggs & Stratton, Johnson Controls, and Rockwell Automation.
Demographics
As of the 2010 census, Glendale had a population of 12,872. The racial makeup of the city was 87.3% White, 5.2% African American, 0.7% Native American, 2.2% Asian, 0.1% Pacific Islander, 1.7% from other races, and 2.8% from two or more races. Hispanic or Latino of any race were 5.2% of the population.
The median income for a household in the city was $50,945, and the median income for a family was $62,917. The per capita income for the city was $27,945. About 4.3% of families and 6.2% of the population were below the poverty line, including 8.2% of those under age 18 and 4.2% of those age 65 or over.
Glendale is a small city with a rich history and a vibrant economy. The city is home to many businesses, including the Milwaukee Bucks basketball team, and has a diverse population. The city is a great place to live, work, and play.
Common Questions
What is the Total Population of Glendale?
Total Population of Glendale is 13,227.
What is the Total Male Population of Glendale?
Total Male Population of Glendale is 5,984.
What is the Total Female Population of Glendale?
Total Female Population of Glendale is 7,243.
What is the Ratio of Males per 100 Females in Glendale?
There are 82.62 Males per 100 Females in Glendale.
What is the Ratio of Females per 100 Males in Glendale?
There are 121.04 Females per 100 Males in Glendale.
What is the Median Population Age in Glendale?
Median Population Age in Glendale is 45.4 Years.
What is the Average Family Size in Glendale
Average Family Size in Glendale is 2.9 People.
What is the Average Household Size in Glendale
Average Household Size in Glendale is 2.2 People.
What is Per Capita Income in Glendale?
Per Capita income in Glendale is $45,577.
What is the Median Family Income in Glendale?
Median Family Income in Glendale is $113,835.
What is the Median Household income in Glendale?
Median Household Income in Glendale is $79,861.
What is Income or Wage Gap in Glendale?
Income or Wage Gap in Glendale is 23.9%.
Women in Glendale earn 76.1 cents for every dollar earned by a man.
What is Family Income Deficit in Glendale?
Family Income Deficit in Glendale is $8,654.
Families that are below poverty line in Glendale earn $8,654 less on average than the poverty threshold level.
What is Inequality or Gini Index in Glendale?
Inequality or Gini Index in Glendale is 0.45.
How Large is the Labor Force in Glendale?
There are 6,611 People in the Labor Forcein in Glendale.
What is the Percentage of People in the Labor Force in Glendale?
59.8% of People are in the Labor Force in Glendale.
What is the Unemployment Rate in Glendale?
Unemployment Rate in Glendale is 4.1%.