Cities with the Most Immigrants from South Central Asia in Wisconsin
RELATED REPORTS & OPTIONS
South Central Asia
Wisconsin
Compare Cities
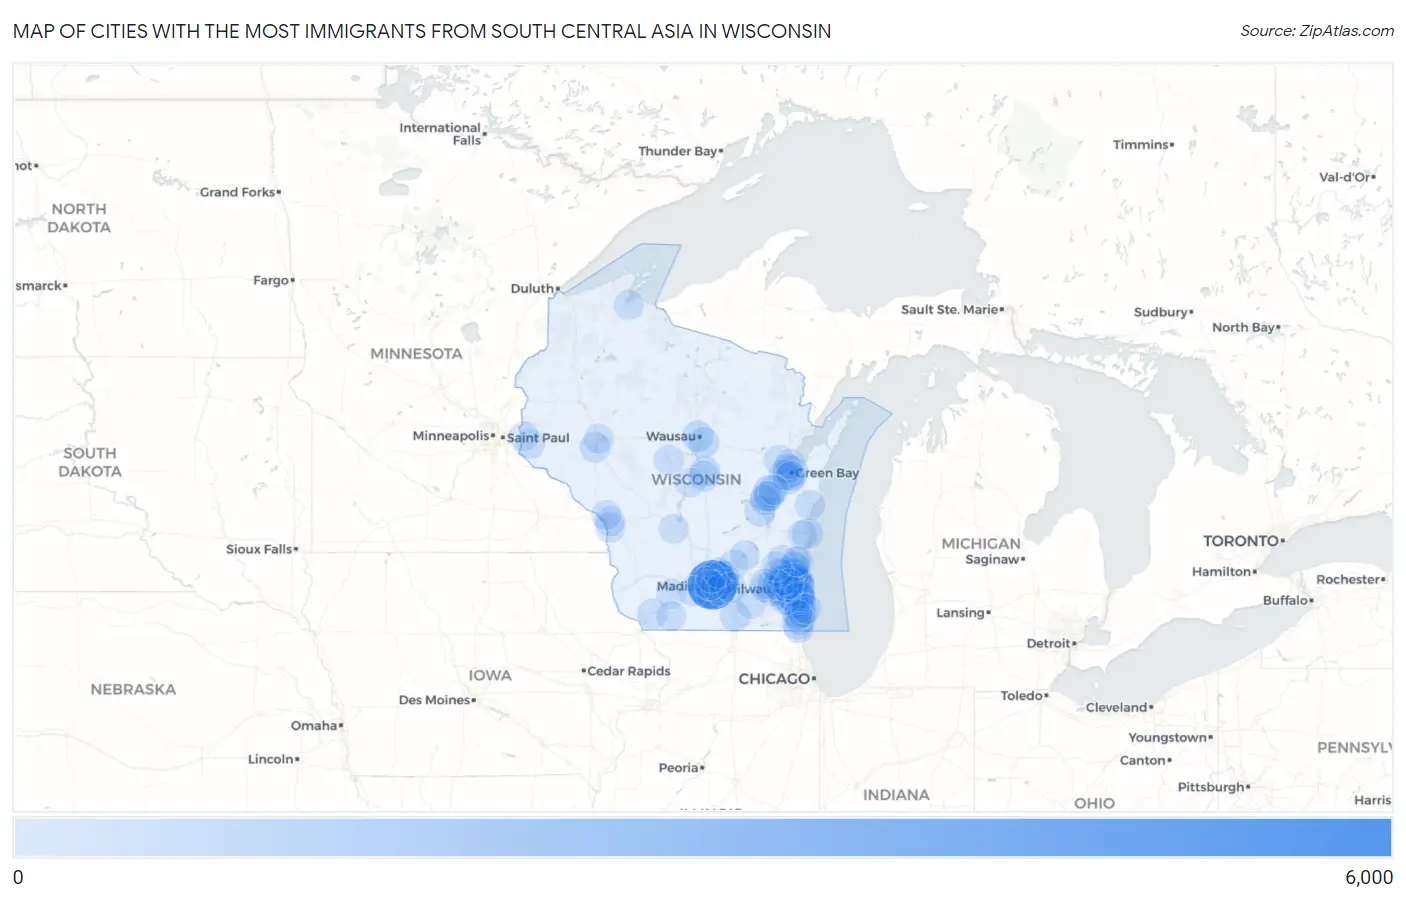
Map of Cities with the Most Immigrants from South Central Asia in Wisconsin
0
6,000
Cities with the Most Immigrants from South Central Asia in Wisconsin
| City | South Central Asia | vs State | vs National | |
| 1. | Madison | 5,265 | 30,911(17.03%)#1 | 4,330,976(0.12%)#94 |
| 2. | Milwaukee | 2,577 | 30,911(8.34%)#2 | 4,330,976(0.06%)#245 |
| 3. | Brookfield | 1,978 | 30,911(6.40%)#3 | 4,330,976(0.05%)#330 |
| 4. | Oak Creek | 1,283 | 30,911(4.15%)#4 | 4,330,976(0.03%)#507 |
| 5. | Franklin | 1,075 | 30,911(3.48%)#5 | 4,330,976(0.02%)#616 |
| 6. | Sun Prairie | 884 | 30,911(2.86%)#6 | 4,330,976(0.02%)#751 |
| 7. | Menomonee Falls | 839 | 30,911(2.71%)#7 | 4,330,976(0.02%)#783 |
| 8. | New Berlin | 828 | 30,911(2.68%)#8 | 4,330,976(0.02%)#794 |
| 9. | Appleton | 603 | 30,911(1.95%)#9 | 4,330,976(0.01%)#1,013 |
| 10. | Greenfield | 603 | 30,911(1.95%)#10 | 4,330,976(0.01%)#1,014 |
| 11. | Greendale | 561 | 30,911(1.81%)#11 | 4,330,976(0.01%)#1,064 |
| 12. | Wauwatosa | 558 | 30,911(1.81%)#12 | 4,330,976(0.01%)#1,069 |
| 13. | Fitchburg | 550 | 30,911(1.78%)#13 | 4,330,976(0.01%)#1,076 |
| 14. | Green Bay | 423 | 30,911(1.37%)#14 | 4,330,976(0.01%)#1,253 |
| 15. | West Allis | 401 | 30,911(1.30%)#15 | 4,330,976(0.01%)#1,293 |
| 16. | Sussex | 394 | 30,911(1.27%)#16 | 4,330,976(0.01%)#1,308 |
| 17. | Germantown | 379 | 30,911(1.23%)#17 | 4,330,976(0.01%)#1,340 |
| 18. | Wausau | 338 | 30,911(1.09%)#18 | 4,330,976(0.01%)#1,466 |
| 19. | De Pere | 307 | 30,911(0.99%)#19 | 4,330,976(0.01%)#1,537 |
| 20. | Kenosha | 301 | 30,911(0.97%)#20 | 4,330,976(0.01%)#1,559 |
| 21. | Weston | 298 | 30,911(0.96%)#21 | 4,330,976(0.01%)#1,574 |
| 22. | Mequon | 273 | 30,911(0.88%)#22 | 4,330,976(0.01%)#1,664 |
| 23. | Janesville | 266 | 30,911(0.86%)#23 | 4,330,976(0.01%)#1,684 |
| 24. | Middleton | 260 | 30,911(0.84%)#24 | 4,330,976(0.01%)#1,712 |
| 25. | Mount Pleasant | 248 | 30,911(0.80%)#25 | 4,330,976(0.01%)#1,766 |
| 26. | Shorewood | 240 | 30,911(0.78%)#26 | 4,330,976(0.01%)#1,806 |
| 27. | Sheboygan | 232 | 30,911(0.75%)#27 | 4,330,976(0.01%)#1,827 |
| 28. | Oshkosh | 221 | 30,911(0.71%)#28 | 4,330,976(0.01%)#1,882 |
| 29. | Ashwaubenon | 207 | 30,911(0.67%)#29 | 4,330,976(0.00%)#1,962 |
| 30. | Pleasant Prairie | 204 | 30,911(0.66%)#30 | 4,330,976(0.00%)#1,976 |
| 31. | Eau Claire | 199 | 30,911(0.64%)#31 | 4,330,976(0.00%)#1,994 |
| 32. | Plover | 198 | 30,911(0.64%)#32 | 4,330,976(0.00%)#2,006 |
| 33. | Cottage Grove | 175 | 30,911(0.57%)#33 | 4,330,976(0.00%)#2,153 |
| 34. | Stevens Point | 171 | 30,911(0.55%)#34 | 4,330,976(0.00%)#2,186 |
| 35. | Caledonia | 169 | 30,911(0.55%)#35 | 4,330,976(0.00%)#2,200 |
| 36. | Somers | 163 | 30,911(0.53%)#36 | 4,330,976(0.00%)#2,234 |
| 37. | Hartland | 146 | 30,911(0.47%)#37 | 4,330,976(0.00%)#2,368 |
| 38. | Fox Crossing | 145 | 30,911(0.47%)#38 | 4,330,976(0.00%)#2,376 |
| 39. | Monona | 129 | 30,911(0.42%)#39 | 4,330,976(0.00%)#2,500 |
| 40. | Hobart | 127 | 30,911(0.41%)#40 | 4,330,976(0.00%)#2,521 |
| 41. | Fox Point | 125 | 30,911(0.40%)#41 | 4,330,976(0.00%)#2,538 |
| 42. | La Crosse | 121 | 30,911(0.39%)#42 | 4,330,976(0.00%)#2,564 |
| 43. | Onalaska | 115 | 30,911(0.37%)#43 | 4,330,976(0.00%)#2,639 |
| 44. | Greenville | 113 | 30,911(0.37%)#44 | 4,330,976(0.00%)#2,671 |
| 45. | Platteville | 109 | 30,911(0.35%)#45 | 4,330,976(0.00%)#2,705 |
| 46. | Bayside | 108 | 30,911(0.35%)#46 | 4,330,976(0.00%)#2,724 |
| 47. | Manitowoc | 107 | 30,911(0.35%)#47 | 4,330,976(0.00%)#2,727 |
| 48. | Brown Deer | 107 | 30,911(0.35%)#48 | 4,330,976(0.00%)#2,732 |
| 49. | Marshfield | 104 | 30,911(0.34%)#49 | 4,330,976(0.00%)#2,758 |
| 50. | Mcfarland | 103 | 30,911(0.33%)#50 | 4,330,976(0.00%)#2,777 |
| 51. | Grafton | 101 | 30,911(0.33%)#51 | 4,330,976(0.00%)#2,806 |
| 52. | Glendale | 99 | 30,911(0.32%)#52 | 4,330,976(0.00%)#2,835 |
| 53. | Neenah | 98 | 30,911(0.32%)#53 | 4,330,976(0.00%)#2,845 |
| 54. | Mount Horeb | 84 | 30,911(0.27%)#54 | 4,330,976(0.00%)#3,068 |
| 55. | Racine | 83 | 30,911(0.27%)#55 | 4,330,976(0.00%)#3,075 |
| 56. | South Milwaukee | 83 | 30,911(0.27%)#56 | 4,330,976(0.00%)#3,080 |
| 57. | Whitefish Bay | 82 | 30,911(0.27%)#57 | 4,330,976(0.00%)#3,095 |
| 58. | Menasha | 78 | 30,911(0.25%)#58 | 4,330,976(0.00%)#3,156 |
| 59. | Thiensville | 68 | 30,911(0.22%)#59 | 4,330,976(0.00%)#3,346 |
| 60. | West Bend | 63 | 30,911(0.20%)#60 | 4,330,976(0.00%)#3,435 |
| 61. | Columbus | 61 | 30,911(0.20%)#61 | 4,330,976(0.00%)#3,492 |
| 62. | Beaver Dam | 57 | 30,911(0.18%)#62 | 4,330,976(0.00%)#3,574 |
| 63. | River Hills | 56 | 30,911(0.18%)#63 | 4,330,976(0.00%)#3,606 |
| 64. | Whitewater | 54 | 30,911(0.17%)#64 | 4,330,976(0.00%)#3,635 |
| 65. | Windsor | 51 | 30,911(0.16%)#65 | 4,330,976(0.00%)#3,727 |
| 66. | Ashland | 50 | 30,911(0.16%)#66 | 4,330,976(0.00%)#3,755 |
| 67. | River Falls | 49 | 30,911(0.16%)#67 | 4,330,976(0.00%)#3,778 |
| 68. | St Francis | 43 | 30,911(0.14%)#68 | 4,330,976(0.00%)#3,955 |
| 69. | Deerfield | 43 | 30,911(0.14%)#69 | 4,330,976(0.00%)#3,973 |
| 70. | Cedarburg | 42 | 30,911(0.14%)#70 | 4,330,976(0.00%)#3,990 |
| 71. | Pulaski | 41 | 30,911(0.13%)#71 | 4,330,976(0.00%)#4,030 |
| 72. | Wales | 41 | 30,911(0.13%)#72 | 4,330,976(0.00%)#4,032 |
| 73. | Port Washington | 39 | 30,911(0.13%)#73 | 4,330,976(0.00%)#4,078 |
| 74. | Pewaukee | 38 | 30,911(0.12%)#74 | 4,330,976(0.00%)#4,115 |
| 75. | Mauston | 38 | 30,911(0.12%)#75 | 4,330,976(0.00%)#4,129 |
| 76. | Shorewood Hills | 35 | 30,911(0.11%)#76 | 4,330,976(0.00%)#4,232 |
| 77. | Cudahy | 33 | 30,911(0.11%)#77 | 4,330,976(0.00%)#4,292 |
| 78. | Sheboygan Falls | 33 | 30,911(0.11%)#78 | 4,330,976(0.00%)#4,301 |
| 79. | Muskego | 31 | 30,911(0.10%)#79 | 4,330,976(0.00%)#4,376 |
| 80. | Lannon | 28 | 30,911(0.09%)#80 | 4,330,976(0.00%)#4,562 |
| 81. | Oconomowoc | 27 | 30,911(0.09%)#81 | 4,330,976(0.00%)#4,578 |
| 82. | Richfield | 25 | 30,911(0.08%)#82 | 4,330,976(0.00%)#4,687 |
| 83. | Dodgeville | 25 | 30,911(0.08%)#83 | 4,330,976(0.00%)#4,709 |
| 84. | Darlington | 25 | 30,911(0.08%)#84 | 4,330,976(0.00%)#4,729 |
| 85. | Wind Point | 24 | 30,911(0.08%)#85 | 4,330,976(0.00%)#4,798 |
| 86. | Waunakee | 23 | 30,911(0.07%)#86 | 4,330,976(0.00%)#4,825 |
| 87. | Suamico | 23 | 30,911(0.07%)#87 | 4,330,976(0.00%)#4,827 |
| 88. | Chippewa Falls | 22 | 30,911(0.07%)#88 | 4,330,976(0.00%)#4,893 |
| 89. | Howard | 21 | 30,911(0.07%)#89 | 4,330,976(0.00%)#4,951 |
| 90. | Elm Grove | 21 | 30,911(0.07%)#90 | 4,330,976(0.00%)#4,973 |
| 91. | Summit | 21 | 30,911(0.07%)#91 | 4,330,976(0.00%)#4,978 |
| 92. | Wisconsin Rapids | 19 | 30,911(0.06%)#92 | 4,330,976(0.00%)#5,066 |
| 93. | Hudson | 19 | 30,911(0.06%)#93 | 4,330,976(0.00%)#5,070 |
| 94. | Sturtevant | 19 | 30,911(0.06%)#94 | 4,330,976(0.00%)#5,085 |
| 95. | Butler | 19 | 30,911(0.06%)#95 | 4,330,976(0.00%)#5,114 |
| 96. | Allouez | 18 | 30,911(0.06%)#96 | 4,330,976(0.00%)#5,141 |
| 97. | Little Chute | 18 | 30,911(0.06%)#97 | 4,330,976(0.00%)#5,145 |
| 98. | Saukville | 17 | 30,911(0.05%)#98 | 4,330,976(0.00%)#5,246 |
| 99. | Holmen | 16 | 30,911(0.05%)#99 | 4,330,976(0.00%)#5,304 |
| 100. | Slinger | 16 | 30,911(0.05%)#100 | 4,330,976(0.00%)#5,317 |
Common Questions
What are the Top 10 Cities with the Most Immigrants from South Central Asia in Wisconsin?
Top 10 Cities with the Most Immigrants from South Central Asia in Wisconsin are:
#1
5,265
#2
2,577
#3
1,978
#4
1,283
#5
1,075
#6
884
#7
839
#8
828
#9
603
#10
603
What city has the Most Immigrants from South Central Asia in Wisconsin?
Madison has the Most Immigrants from South Central Asia in Wisconsin with 5,265.
What is the Total Immigrants from South Central Asia in the State of Wisconsin?
Total Immigrants from South Central Asia in Wisconsin is 30,911.
What is the Total Immigrants from South Central Asia in the United States?
Total Immigrants from South Central Asia in the United States is 4,330,976.