Minocqua, WI
Minocqua Map
Minocqua Overview
439
TOTAL POPULATION
144
MALE POPULATION
295
FEMALE POPULATION
48.81
MALES / 100 FEMALES
204.86
FEMALES / 100 MALES
51.6
MEDIAN AGE
2.6
AVG FAMILY SIZE
1.5
AVG HOUSEHOLD SIZE
$80,005
PER CAPITA INCOME
$250,001
AVG FAMILY INCOME
0.53
INEQUALITY / GINI INDEX
225
LABOR FORCE [ PEOPLE ]
56.3%
PERCENT IN LABOR FORCE
Minocqua Zip Codes
Minocqua Area Codes
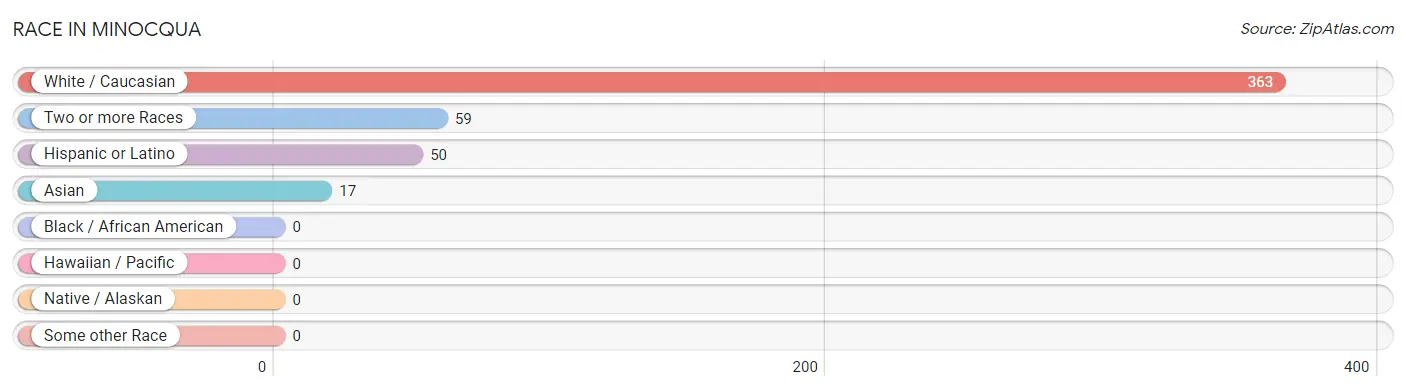
Race in Minocqua
The most populous races in Minocqua are White / Caucasian (363 | 82.7%), Two or more Races (59 | 13.4%), and Hispanic or Latino (50 | 11.4%).
| Race | # Population | % Population |
| Asian | 17 | 3.9% |
| Black / African American | 0 | 0.0% |
| Hawaiian / Pacific | 0 | 0.0% |
| Hispanic or Latino | 50 | 11.4% |
| Native / Alaskan | 0 | 0.0% |
| White / Caucasian | 363 | 82.7% |
| Two or more Races | 59 | 13.4% |
| Some other Race | 0 | 0.0% |
| Total | 439 | 100.0% |
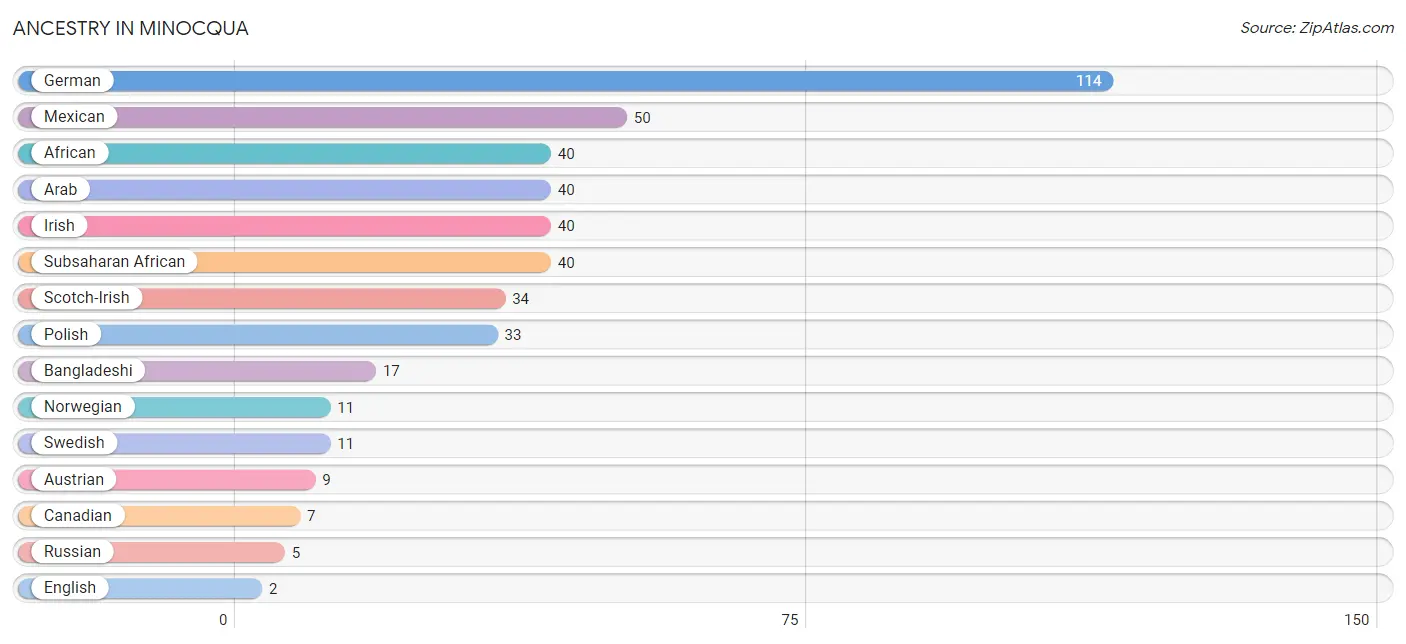
Ancestry in Minocqua
The most populous ancestries reported in Minocqua are German (114 | 26.0%), Mexican (50 | 11.4%), African (40 | 9.1%), Arab (40 | 9.1%), and Irish (40 | 9.1%), together accounting for 64.7% of all Minocqua residents.
| Ancestry | # Population | % Population |
| African | 40 | 9.1% |
| Arab | 40 | 9.1% |
| Austrian | 9 | 2.1% |
| Bangladeshi | 17 | 3.9% |
| Canadian | 7 | 1.6% |
| English | 2 | 0.5% |
| German | 114 | 26.0% |
| Irish | 40 | 9.1% |
| Mexican | 50 | 11.4% |
| Norwegian | 11 | 2.5% |
| Polish | 33 | 7.5% |
| Russian | 5 | 1.1% |
| Scotch-Irish | 34 | 7.7% |
| Subsaharan African | 40 | 9.1% |
| Swedish | 11 | 2.5% | View All 15 Rows |
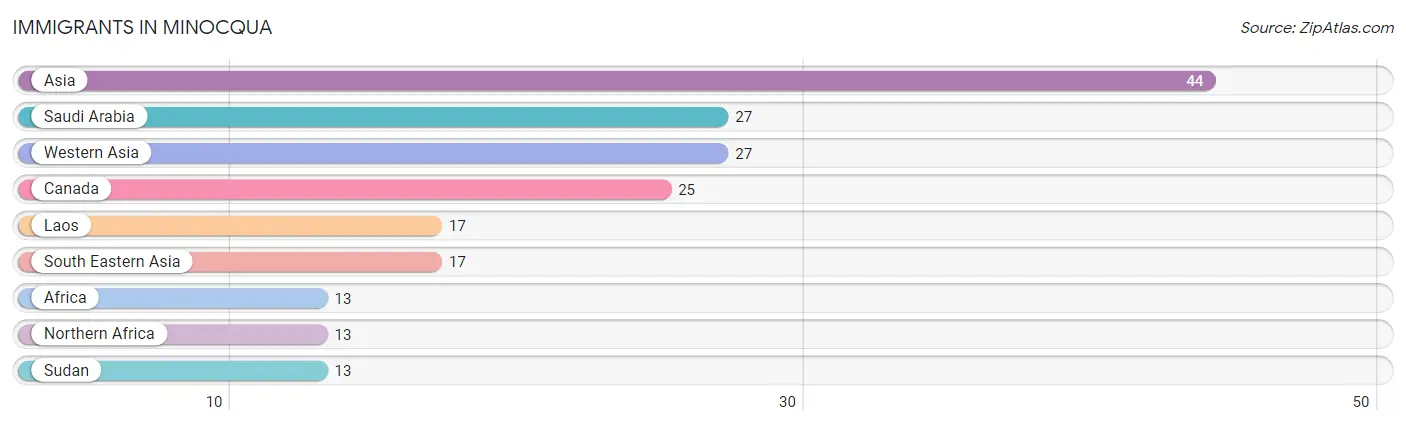
Immigrants in Minocqua
The most numerous immigrant groups reported in Minocqua came from Asia (44 | 10.0%), Saudi Arabia (27 | 6.1%), Western Asia (27 | 6.1%), Canada (25 | 5.7%), and Laos (17 | 3.9%), together accounting for 31.9% of all Minocqua residents.
| Immigration Origin | # Population | % Population |
| Africa | 13 | 3.0% |
| Asia | 44 | 10.0% |
| Canada | 25 | 5.7% |
| Laos | 17 | 3.9% |
| Northern Africa | 13 | 3.0% |
| Saudi Arabia | 27 | 6.1% |
| South Eastern Asia | 17 | 3.9% |
| Sudan | 13 | 3.0% |
| Western Asia | 27 | 6.1% | View All 9 Rows |
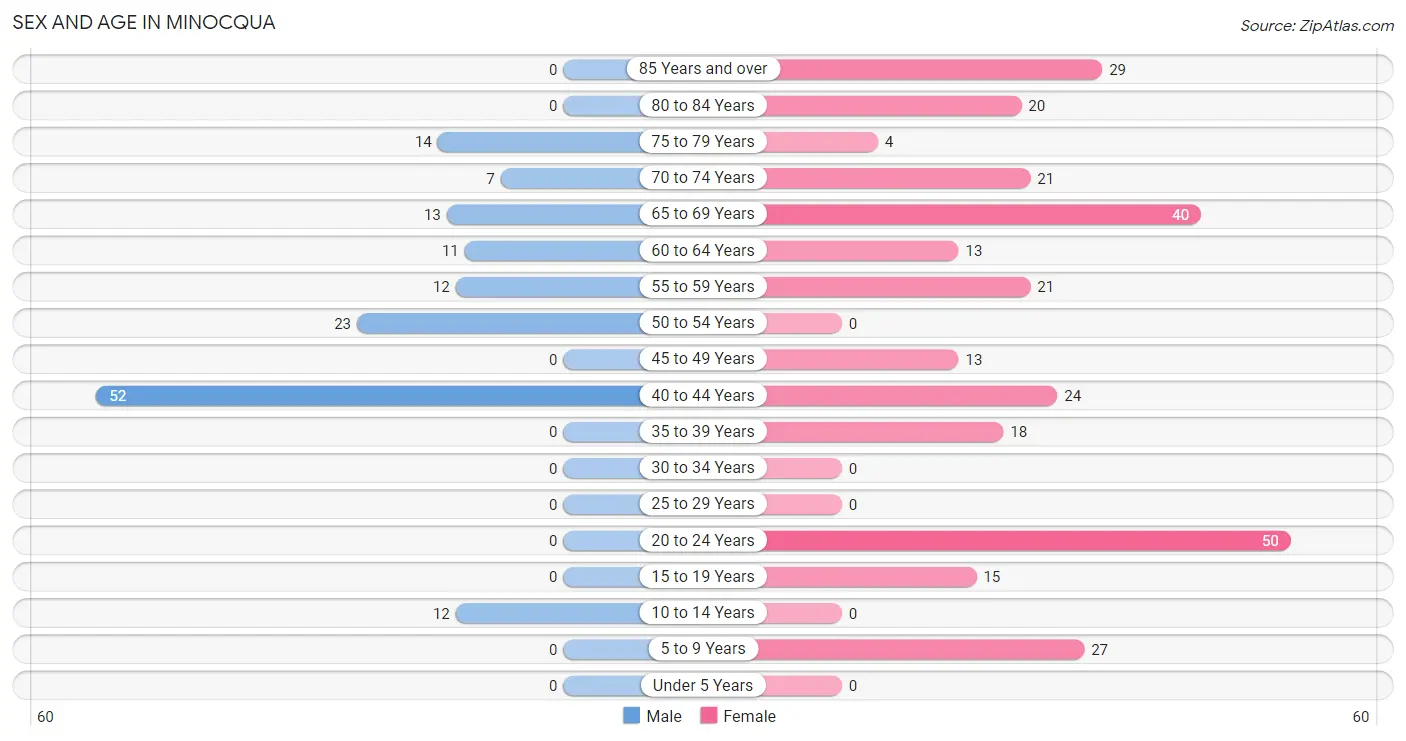
Sex and Age in Minocqua
Sex and Age in Minocqua
The most populous age groups in Minocqua are 40 to 44 Years (52 | 36.1%) for men and 20 to 24 Years (50 | 17.0%) for women.
| Age Bracket | Male | Female |
| Under 5 Years | 0 (0.0%) | 0 (0.0%) |
| 5 to 9 Years | 0 (0.0%) | 27 (9.1%) |
| 10 to 14 Years | 12 (8.3%) | 0 (0.0%) |
| 15 to 19 Years | 0 (0.0%) | 15 (5.1%) |
| 20 to 24 Years | 0 (0.0%) | 50 (17.0%) |
| 25 to 29 Years | 0 (0.0%) | 0 (0.0%) |
| 30 to 34 Years | 0 (0.0%) | 0 (0.0%) |
| 35 to 39 Years | 0 (0.0%) | 18 (6.1%) |
| 40 to 44 Years | 52 (36.1%) | 24 (8.1%) |
| 45 to 49 Years | 0 (0.0%) | 13 (4.4%) |
| 50 to 54 Years | 23 (16.0%) | 0 (0.0%) |
| 55 to 59 Years | 12 (8.3%) | 21 (7.1%) |
| 60 to 64 Years | 11 (7.6%) | 13 (4.4%) |
| 65 to 69 Years | 13 (9.0%) | 40 (13.6%) |
| 70 to 74 Years | 7 (4.9%) | 21 (7.1%) |
| 75 to 79 Years | 14 (9.7%) | 4 (1.4%) |
| 80 to 84 Years | 0 (0.0%) | 20 (6.8%) |
| 85 Years and over | 0 (0.0%) | 29 (9.8%) |
| Total | 144 (100.0%) | 295 (100.0%) |
Families and Households in Minocqua
Median Family Size in Minocqua
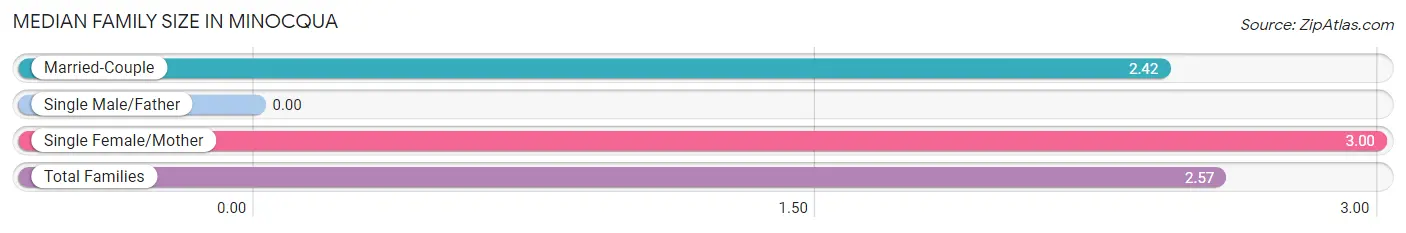
| Family Type | # Families | Family Size |
| Married-Couple | 52 (75.4%) | 2.42 |
| Single Male/Father | 0 (0.0%) | - |
| Single Female/Mother | 17 (24.6%) | 3.00 |
| Total Families | 69 (100.0%) | 2.57 |
Median Household Size in Minocqua
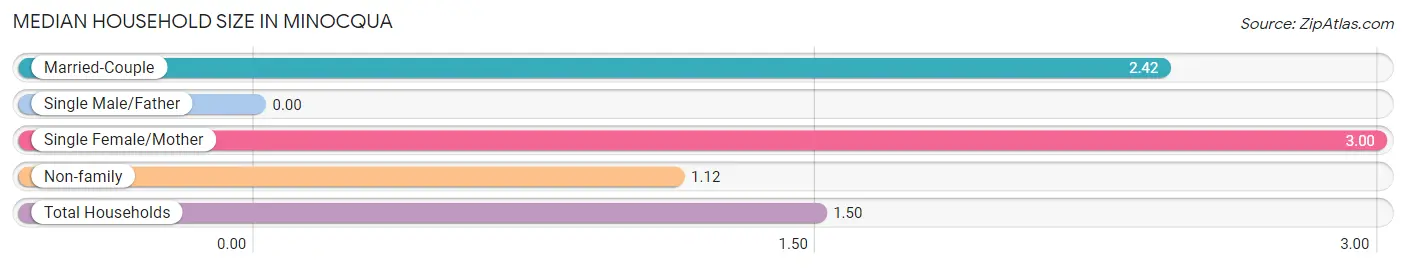
| Household Type | # Households | Household Size |
| Married-Couple | 52 (20.1%) | 2.42 |
| Single Male/Father | 0 (0.0%) | - |
| Single Female/Mother | 17 (6.6%) | 3.00 |
| Non-family | 190 (73.4%) | 1.12 |
| Total Households | 259 (100.0%) | 1.50 |
Household Size by Marriage Status in Minocqua
Out of a total of 259 households in Minocqua, 69 (26.6%) are family households, while 190 (73.4%) are nonfamily households. The most numerous type of family households are 3-person households, comprising 42, and the most common type of nonfamily households are 1-person households, comprising 171.
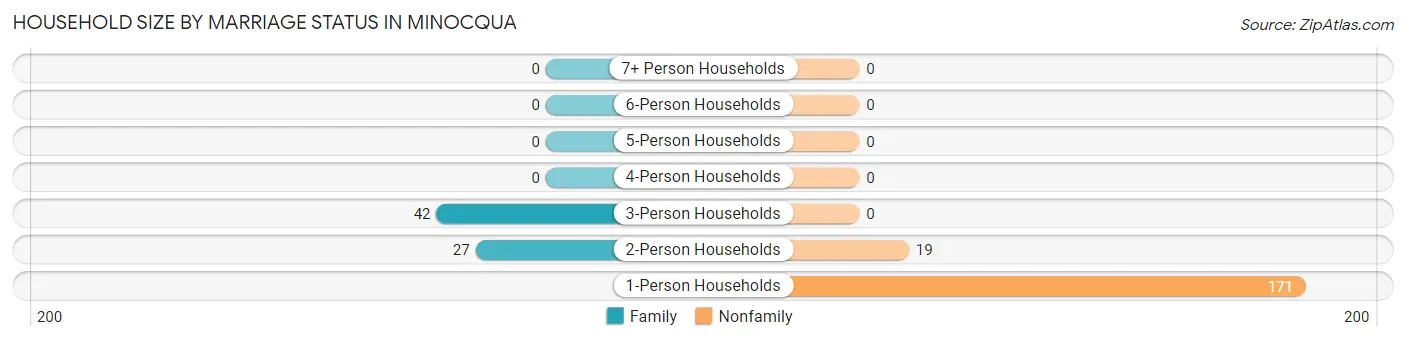
| Household Size | Family Households | Nonfamily Households |
| 1-Person Households | - | 171 (66.0%) |
| 2-Person Households | 27 (10.4%) | 19 (7.3%) |
| 3-Person Households | 42 (16.2%) | 0 (0.0%) |
| 4-Person Households | 0 (0.0%) | 0 (0.0%) |
| 5-Person Households | 0 (0.0%) | 0 (0.0%) |
| 6-Person Households | 0 (0.0%) | 0 (0.0%) |
| 7+ Person Households | 0 (0.0%) | 0 (0.0%) |
| Total | 69 (26.6%) | 190 (73.4%) |
Female Fertility in Minocqua
Fertility by Age in Minocqua
| Age Bracket | Women with Births | Births / 1,000 Women |
| 15 to 19 years | 0 (0.0%) | 0.0 |
| 20 to 34 years | 0 (0.0%) | 0.0 |
| 35 to 50 years | 0 (0.0%) | 0.0 |
| Total | 0 (0.0%) | 0.0 |
Fertility by Age by Marriage Status in Minocqua
| Age Bracket | Married | Unmarried |
| 15 to 19 years | 0 (0.0%) | 0 (0.0%) |
| 20 to 34 years | 0 (0.0%) | 0 (0.0%) |
| 35 to 50 years | 0 (0.0%) | 0 (0.0%) |
| Total | 0 (0.0%) | 0 (0.0%) |
Fertility by Education in Minocqua
| Educational Attainment | Women with Births | Births / 1,000 Women |
| Less than High School | 0 (0.0%) | 0.0 |
| High School Diploma | 0 (0.0%) | 0.0 |
| College or Associate's Degree | 0 (0.0%) | 0.0 |
| Bachelor's Degree | 0 (0.0%) | 0.0 |
| Graduate Degree | 0 (0.0%) | 0.0 |
| Total | 0 (0.0%) | 0.0 |
Fertility by Education by Marriage Status in Minocqua
| Educational Attainment | Married | Unmarried |
| Less than High School | 0 (0.0%) | 0 (0.0%) |
| High School Diploma | 0 (0.0%) | 0 (0.0%) |
| College or Associate's Degree | 0 (0.0%) | 0 (0.0%) |
| Bachelor's Degree | 0 (0.0%) | 0 (0.0%) |
| Graduate Degree | 0 (0.0%) | 0 (0.0%) |
| Total | 0 (0.0%) | 0 (0.0%) |
Income in Minocqua
Income Overview in Minocqua
| Characteristic | Number | Measure |
| Per Capita Income | 439 | $80,005 |
| Median Family Income | 69 | $250,001 |
| Mean Family Income | 69 | $266,000 |
| Median Household Income | 259 | $0 |
| Mean Household Income | 259 | $133,089 |
| Income Deficit | 69 | $0 |
| Wage / Income Gap (%) | 439 | 0.00% |
| Wage / Income Gap ($) | 439 | 100.00¢ per $1 |
| Gini / Inequality Index | 439 | 0.53 |
Earnings by Sex in Minocqua
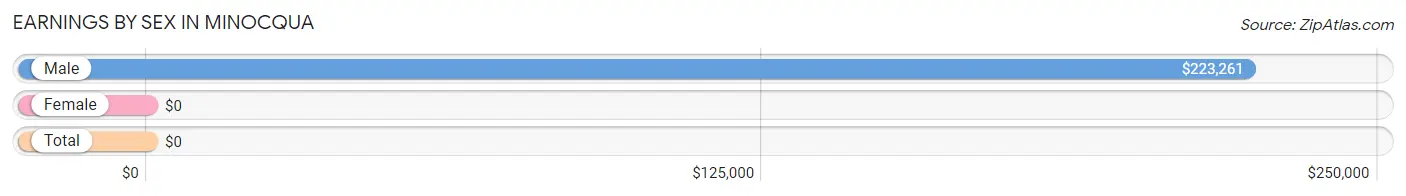
| Sex | Number | Average Earnings |
| Male | 90 (39.0%) | $223,261 |
| Female | 141 (61.0%) | $0 |
| Total | 231 (100.0%) | $0 |
Earnings by Sex by Income Bracket in Minocqua
The most common earnings brackets in Minocqua are $100,000+ for men (52 | 57.8%) and $10,000 to $12,499 for women (50 | 35.5%).
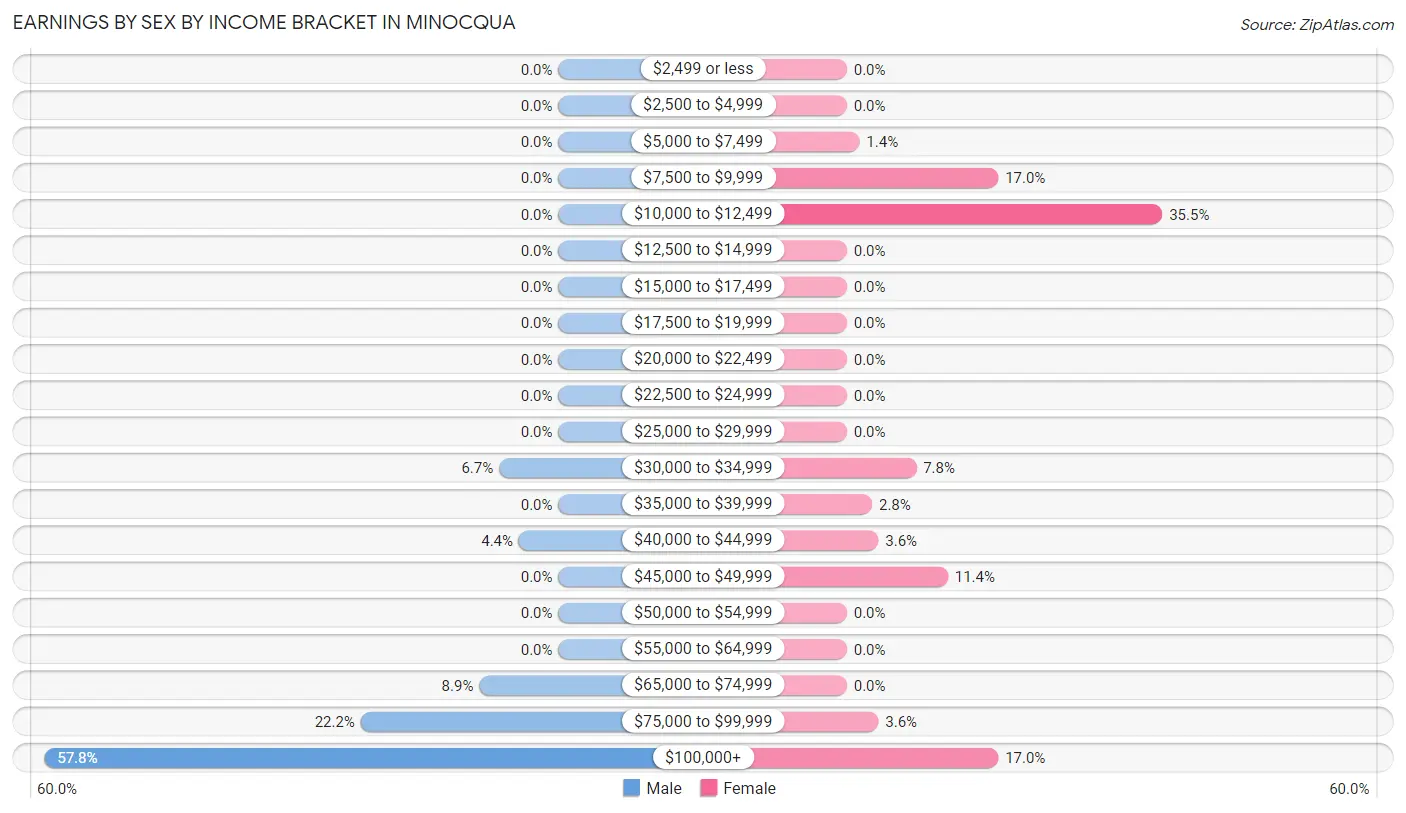
| Income | Male | Female |
| $2,499 or less | 0 (0.0%) | 0 (0.0%) |
| $2,500 to $4,999 | 0 (0.0%) | 0 (0.0%) |
| $5,000 to $7,499 | 0 (0.0%) | 2 (1.4%) |
| $7,500 to $9,999 | 0 (0.0%) | 24 (17.0%) |
| $10,000 to $12,499 | 0 (0.0%) | 50 (35.5%) |
| $12,500 to $14,999 | 0 (0.0%) | 0 (0.0%) |
| $15,000 to $17,499 | 0 (0.0%) | 0 (0.0%) |
| $17,500 to $19,999 | 0 (0.0%) | 0 (0.0%) |
| $20,000 to $22,499 | 0 (0.0%) | 0 (0.0%) |
| $22,500 to $24,999 | 0 (0.0%) | 0 (0.0%) |
| $25,000 to $29,999 | 0 (0.0%) | 0 (0.0%) |
| $30,000 to $34,999 | 6 (6.7%) | 11 (7.8%) |
| $35,000 to $39,999 | 0 (0.0%) | 4 (2.8%) |
| $40,000 to $44,999 | 4 (4.4%) | 5 (3.5%) |
| $45,000 to $49,999 | 0 (0.0%) | 16 (11.4%) |
| $50,000 to $54,999 | 0 (0.0%) | 0 (0.0%) |
| $55,000 to $64,999 | 0 (0.0%) | 0 (0.0%) |
| $65,000 to $74,999 | 8 (8.9%) | 0 (0.0%) |
| $75,000 to $99,999 | 20 (22.2%) | 5 (3.5%) |
| $100,000+ | 52 (57.8%) | 24 (17.0%) |
| Total | 90 (100.0%) | 141 (100.0%) |
Earnings by Sex by Educational Attainment in Minocqua
Average earnings in Minocqua are $223,261 for men and $42,250 for women, a difference of 81.1%. Men with an educational attainment of high school diploma enjoy the highest average annual earnings of $43,438, while those with high school diploma education earn the least with $43,438. Women with an educational attainment of high school diploma earn the most with the average annual earnings of $34,318, while those with high school diploma education have the smallest earnings of $34,318.
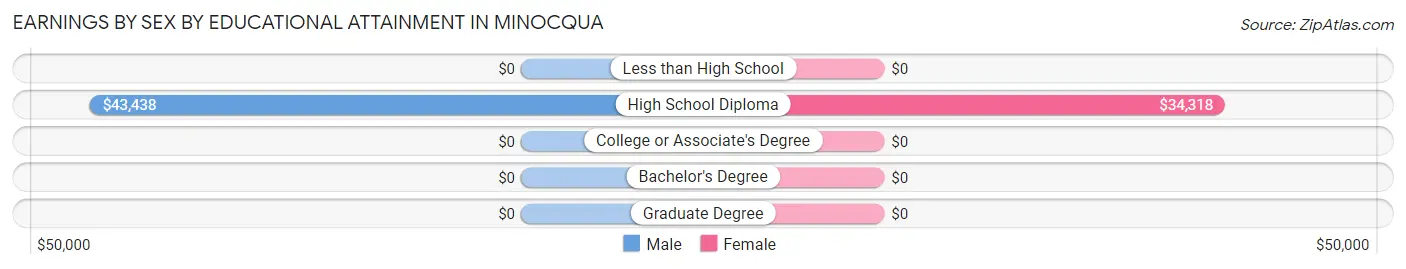
| Educational Attainment | Male Income | Female Income |
| Less than High School | - | - |
| High School Diploma | $43,438 | $34,318 |
| College or Associate's Degree | - | - |
| Bachelor's Degree | - | - |
| Graduate Degree | - | - |
| Total | $223,261 | $42,250 |
Family Income in Minocqua
Family Income Brackets in Minocqua
According to the Minocqua family income data, there are 42 families falling into the $200,000+ income range, which is the most common income bracket and makes up 60.9% of all families.
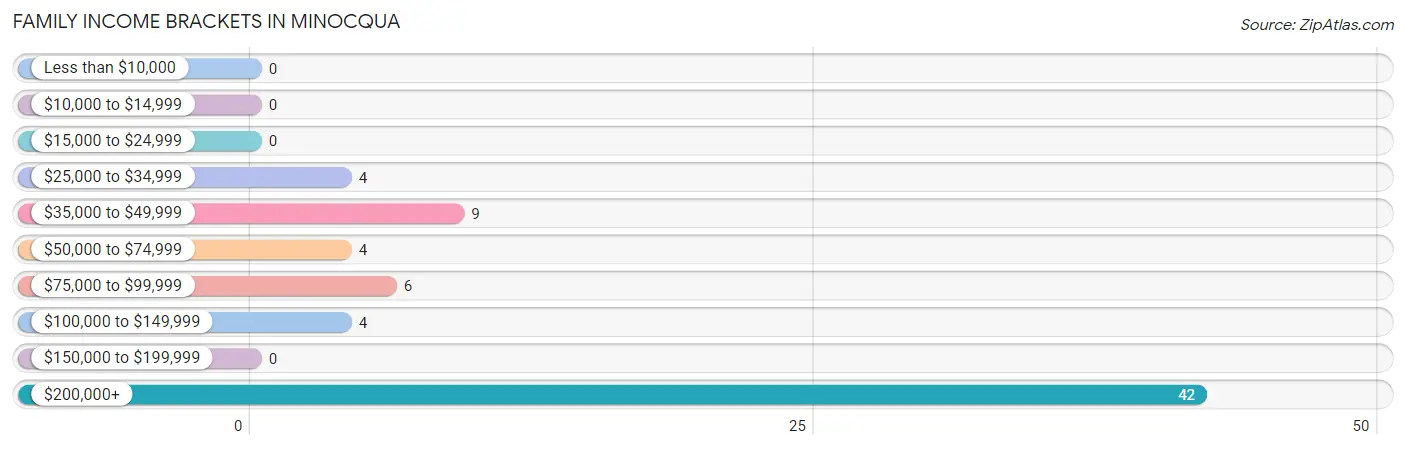
| Income Bracket | # Families | % Families |
| Less than $10,000 | 0 | 0.0% |
| $10,000 to $14,999 | 0 | 0.0% |
| $15,000 to $24,999 | 0 | 0.0% |
| $25,000 to $34,999 | 4 | 5.8% |
| $35,000 to $49,999 | 9 | 13.0% |
| $50,000 to $74,999 | 4 | 5.8% |
| $75,000 to $99,999 | 6 | 8.7% |
| $100,000 to $149,999 | 4 | 5.8% |
| $150,000 to $199,999 | 0 | 0.0% |
| $200,000+ | 42 | 60.9% |
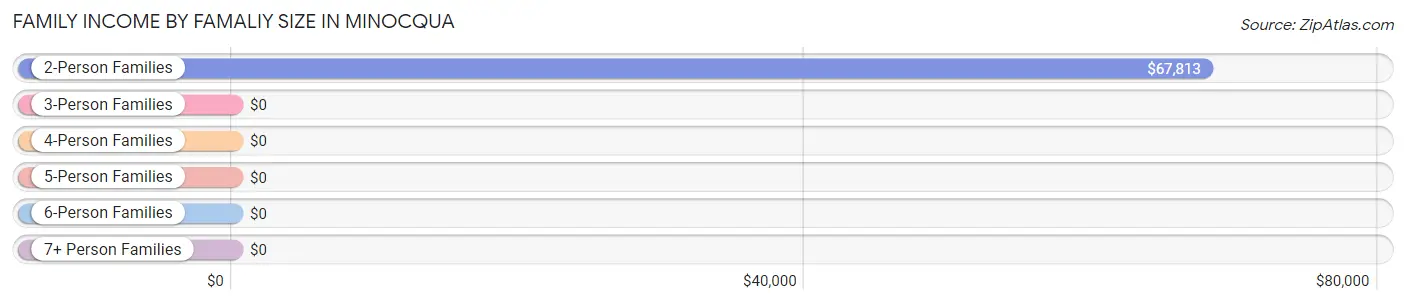
Family Income by Famaliy Size in Minocqua
2-person families (27 | 39.1%) account for the highest median family income in Minocqua with $67,813 per family, while 2-person families (27 | 39.1%) have the highest median income of $33,906 per family member.
| Income Bracket | # Families | Median Income |
| 2-Person Families | 27 (39.1%) | $67,813 |
| 3-Person Families | 42 (60.9%) | $0 |
| 4-Person Families | 0 (0.0%) | $0 |
| 5-Person Families | 0 (0.0%) | $0 |
| 6-Person Families | 0 (0.0%) | $0 |
| 7+ Person Families | 0 (0.0%) | $0 |
| Total | 69 (100.0%) | $250,001 |
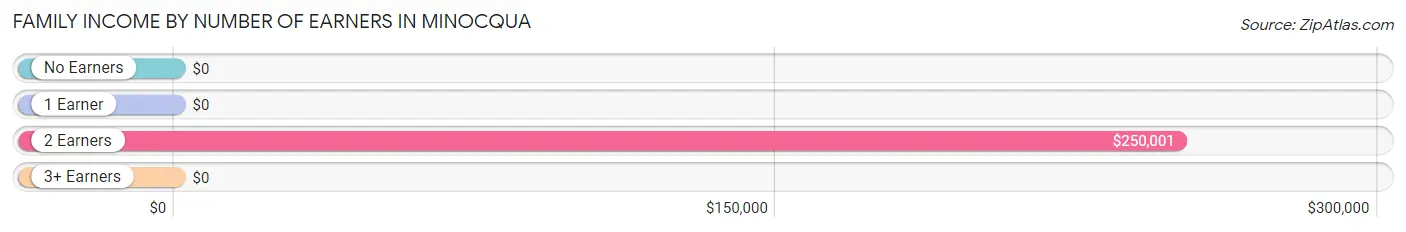
Family Income by Number of Earners in Minocqua
| Number of Earners | # Families | Median Income |
| No Earners | 13 (18.8%) | $0 |
| 1 Earner | 13 (18.8%) | $0 |
| 2 Earners | 43 (62.3%) | $250,001 |
| 3+ Earners | 0 (0.0%) | $0 |
| Total | 69 (100.0%) | $250,001 |
Household Income in Minocqua
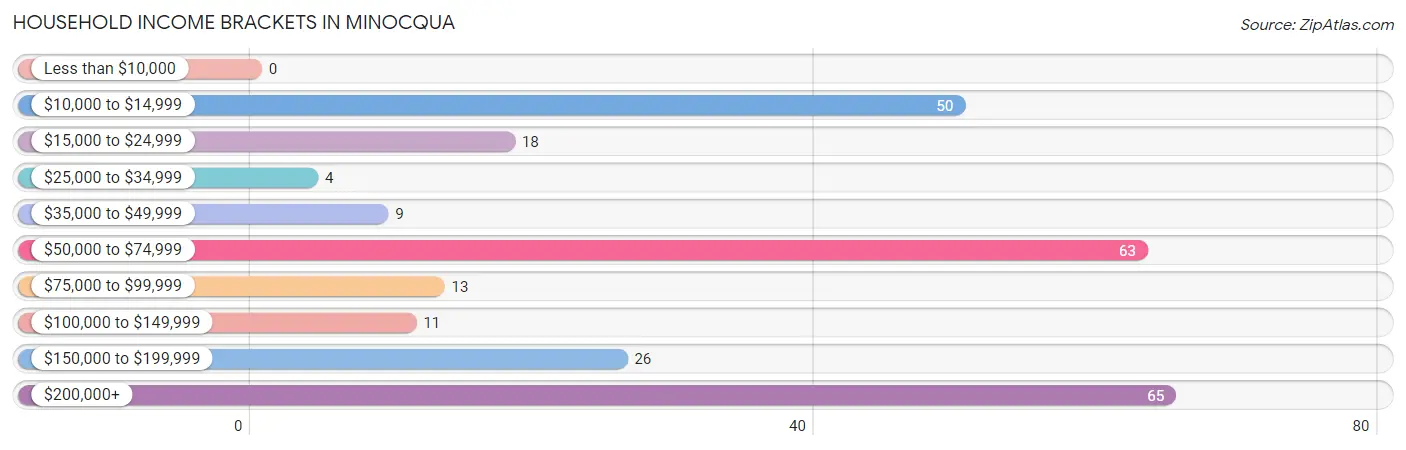
Household Income Brackets in Minocqua
With 65 households falling in the category, the $200,000+ income range is the most frequent in Minocqua, accounting for 25.1% of all households.
| Income Bracket | # Households | % Households |
| Less than $10,000 | 0 | 0.0% |
| $10,000 to $14,999 | 50 | 19.3% |
| $15,000 to $24,999 | 18 | 6.9% |
| $25,000 to $34,999 | 4 | 1.5% |
| $35,000 to $49,999 | 9 | 3.5% |
| $50,000 to $74,999 | 63 | 24.3% |
| $75,000 to $99,999 | 13 | 5.0% |
| $100,000 to $149,999 | 11 | 4.2% |
| $150,000 to $199,999 | 26 | 10.0% |
| $200,000+ | 65 | 25.1% |
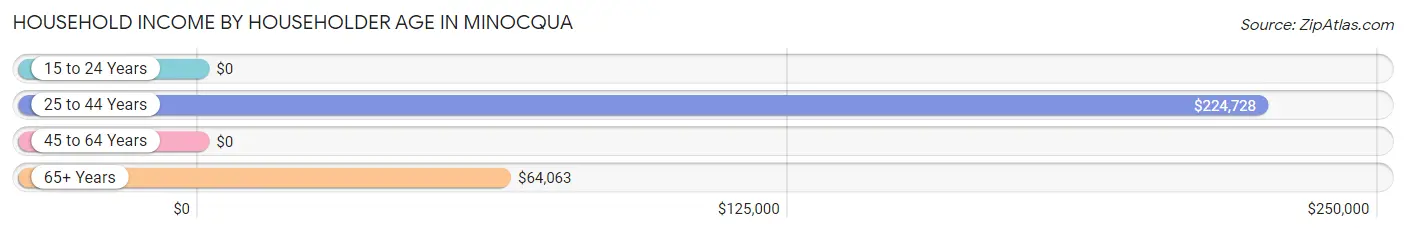
Household Income by Householder Age in Minocqua
The median household income in Minocqua is $0, with the highest median household income of $224,728 found in the 25 to 44 years age bracket for the primary householder. A total of 63 households (24.3%) fall into this category. Meanwhile, the 15 to 24 years age bracket for the primary householder has the lowest median household income of $0, with 50 households (19.3%) in this group.
| Income Bracket | # Households | Median Income |
| 15 to 24 Years | 50 (19.3%) | $0 |
| 25 to 44 Years | 63 (24.3%) | $224,728 |
| 45 to 64 Years | 59 (22.8%) | $0 |
| 65+ Years | 87 (33.6%) | $64,063 |
| Total | 259 (100.0%) | $0 |
Poverty in Minocqua
Income Below Poverty by Sex and Age in Minocqua
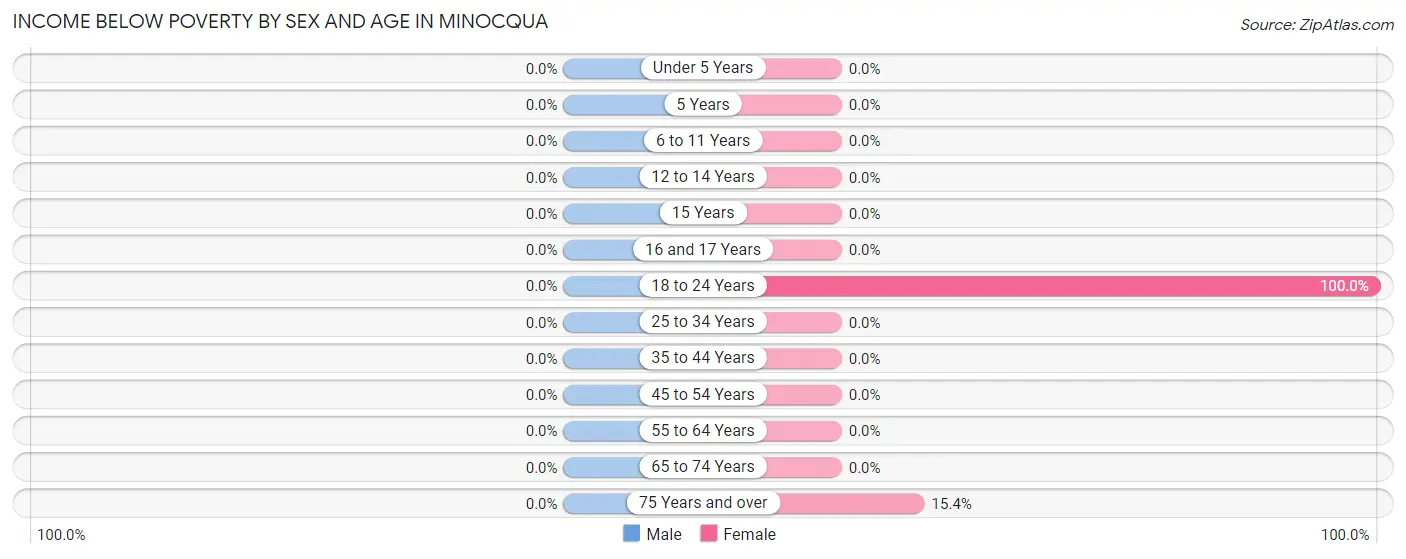
| Age Bracket | Male | Female |
| Under 5 Years | 0 (0.0%) | 0 (0.0%) |
| 5 Years | 0 (0.0%) | 0 (0.0%) |
| 6 to 11 Years | 0 (0.0%) | 0 (0.0%) |
| 12 to 14 Years | 0 (0.0%) | 0 (0.0%) |
| 15 Years | 0 (0.0%) | 0 (0.0%) |
| 16 and 17 Years | 0 (0.0%) | 0 (0.0%) |
| 18 to 24 Years | 0 (0.0%) | 50 (100.0%) |
| 25 to 34 Years | 0 (0.0%) | 0 (0.0%) |
| 35 to 44 Years | 0 (0.0%) | 0 (0.0%) |
| 45 to 54 Years | 0 (0.0%) | 0 (0.0%) |
| 55 to 64 Years | 0 (0.0%) | 0 (0.0%) |
| 65 to 74 Years | 0 (0.0%) | 0 (0.0%) |
| 75 Years and over | 0 (0.0%) | 6 (15.4%) |
| Total | 0 (0.0%) | 56 (22.9%) |
Income Above Poverty by Sex and Age in Minocqua
According to the poverty statistics in Minocqua, males aged 12 to 14 years and females aged 6 to 11 years are the age groups that are most secure financially, with 100.0% of males and 100.0% of females in these age groups living above the poverty line.
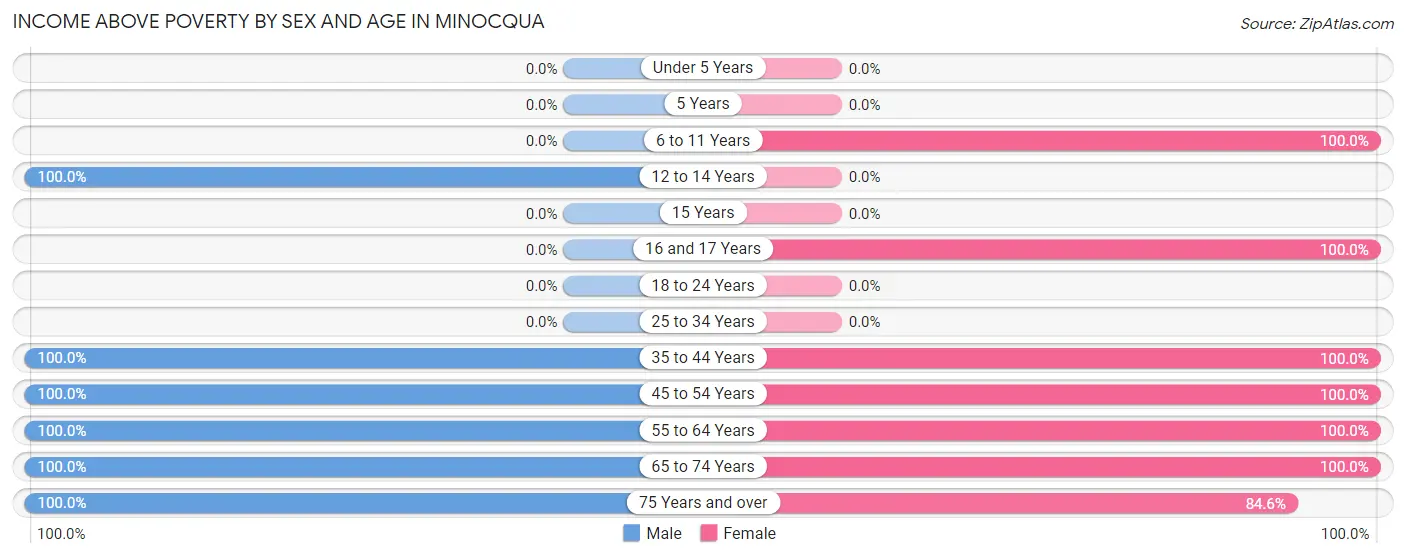
| Age Bracket | Male | Female |
| Under 5 Years | 0 (0.0%) | 0 (0.0%) |
| 5 Years | 0 (0.0%) | 0 (0.0%) |
| 6 to 11 Years | 0 (0.0%) | 27 (100.0%) |
| 12 to 14 Years | 12 (100.0%) | 0 (0.0%) |
| 15 Years | 0 (0.0%) | 0 (0.0%) |
| 16 and 17 Years | 0 (0.0%) | 15 (100.0%) |
| 18 to 24 Years | 0 (0.0%) | 0 (0.0%) |
| 25 to 34 Years | 0 (0.0%) | 0 (0.0%) |
| 35 to 44 Years | 52 (100.0%) | 42 (100.0%) |
| 45 to 54 Years | 23 (100.0%) | 13 (100.0%) |
| 55 to 64 Years | 23 (100.0%) | 34 (100.0%) |
| 65 to 74 Years | 20 (100.0%) | 25 (100.0%) |
| 75 Years and over | 14 (100.0%) | 33 (84.6%) |
| Total | 144 (100.0%) | 189 (77.1%) |
Income Below Poverty Among Married-Couple Families in Minocqua
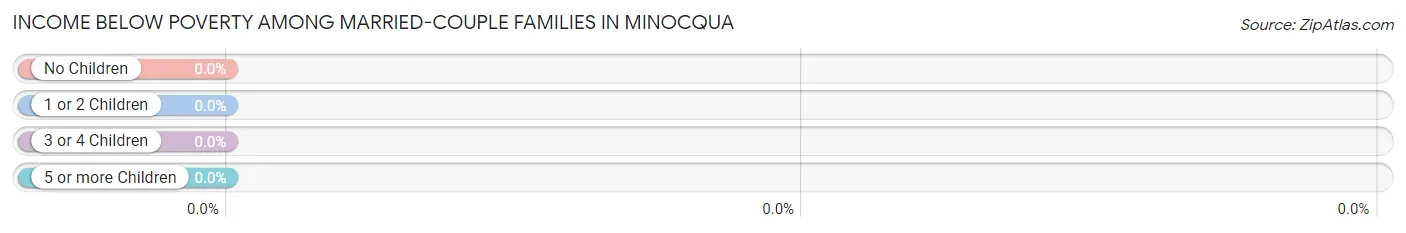
| Children | Above Poverty | Below Poverty |
| No Children | 23 (100.0%) | 0 (0.0%) |
| 1 or 2 Children | 29 (100.0%) | 0 (0.0%) |
| 3 or 4 Children | 0 (0.0%) | 0 (0.0%) |
| 5 or more Children | 0 (0.0%) | 0 (0.0%) |
| Total | 52 (100.0%) | 0 (0.0%) |
Income Below Poverty Among Single-Parent Households in Minocqua
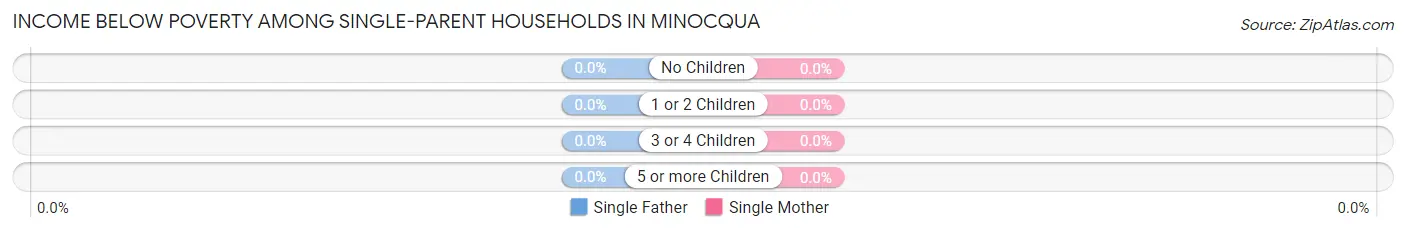
| Children | Single Father | Single Mother |
| No Children | 0 (0.0%) | 0 (0.0%) |
| 1 or 2 Children | 0 (0.0%) | 0 (0.0%) |
| 3 or 4 Children | 0 (0.0%) | 0 (0.0%) |
| 5 or more Children | 0 (0.0%) | 0 (0.0%) |
| Total | 0 (0.0%) | 0 (0.0%) |
Income Below Poverty Among Married-Couple vs Single-Parent Households in Minocqua
| Children | Married-Couple Families | Single-Parent Households |
| No Children | 0 (0.0%) | 0 (0.0%) |
| 1 or 2 Children | 0 (0.0%) | 0 (0.0%) |
| 3 or 4 Children | 0 (0.0%) | 0 (0.0%) |
| 5 or more Children | 0 (0.0%) | 0 (0.0%) |
| Total | 0 (0.0%) | 0 (0.0%) |
Employment Characteristics in Minocqua
Employment by Class of Employer in Minocqua
Among the 221 employed individuals in Minocqua, private company employees (96 | 43.4%), local government employees (74 | 33.5%), and not-for-profit organizations (40 | 18.1%) make up the most common classes of employment.
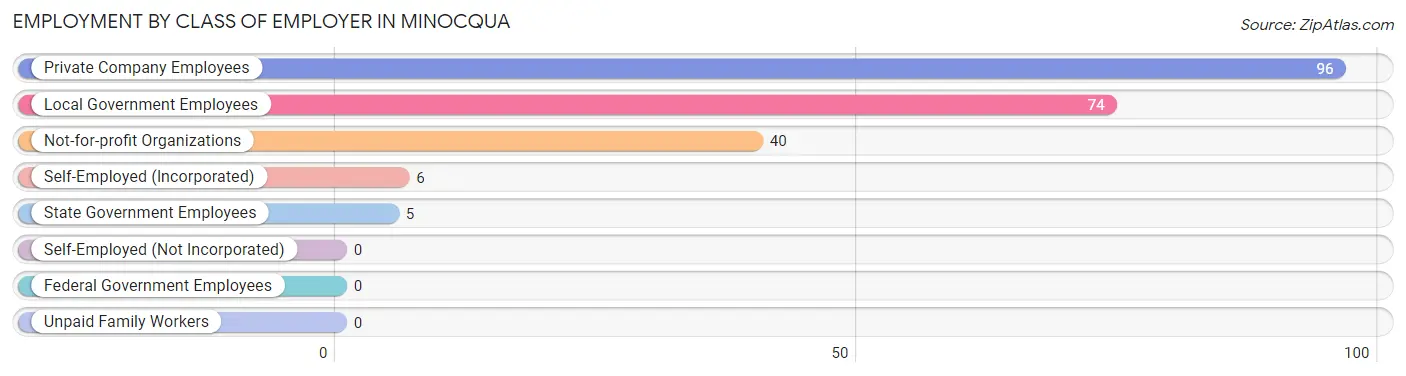
| Employer Class | # Employees | % Employees |
| Private Company Employees | 96 | 43.4% |
| Self-Employed (Incorporated) | 6 | 2.7% |
| Self-Employed (Not Incorporated) | 0 | 0.0% |
| Not-for-profit Organizations | 40 | 18.1% |
| Local Government Employees | 74 | 33.5% |
| State Government Employees | 5 | 2.3% |
| Federal Government Employees | 0 | 0.0% |
| Unpaid Family Workers | 0 | 0.0% |
| Total | 221 | 100.0% |
Employment Status by Age in Minocqua
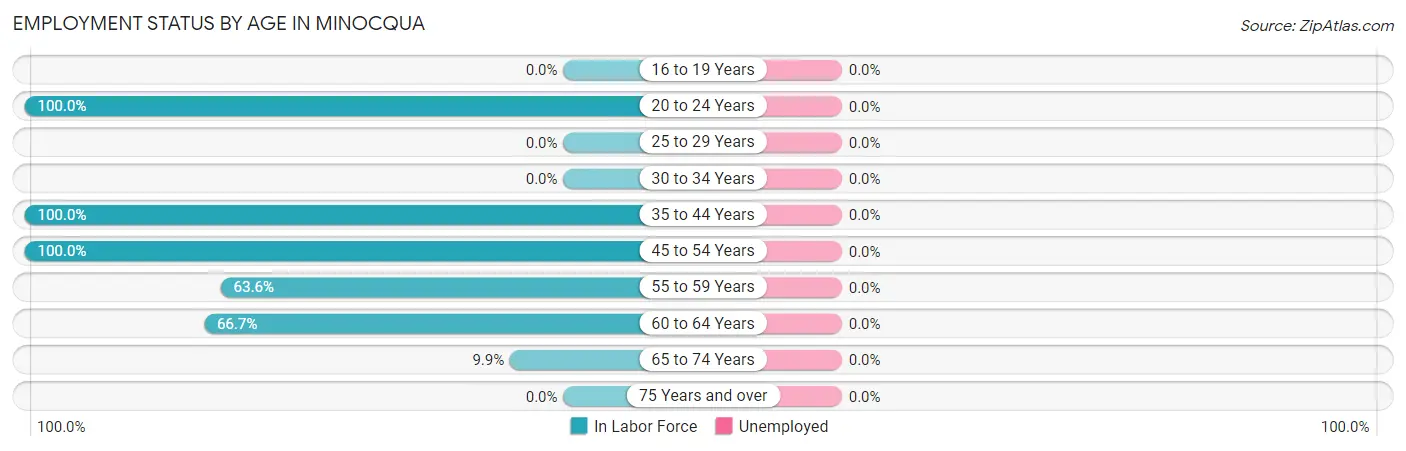
| Age Bracket | In Labor Force | Unemployed |
| 16 to 19 Years | 0 (0.0%) | 0 (0.0%) |
| 20 to 24 Years | 50 (100.0%) | 0 (0.0%) |
| 25 to 29 Years | 0 (0.0%) | 0 (0.0%) |
| 30 to 34 Years | 0 (0.0%) | 0 (0.0%) |
| 35 to 44 Years | 94 (100.0%) | 0 (0.0%) |
| 45 to 54 Years | 36 (100.0%) | 0 (0.0%) |
| 55 to 59 Years | 21 (63.6%) | 0 (0.0%) |
| 60 to 64 Years | 16 (66.7%) | 0 (0.0%) |
| 65 to 74 Years | 8 (9.9%) | 0 (0.0%) |
| 75 Years and over | 0 (0.0%) | 0 (0.0%) |
| Total | 225 (56.3%) | 0 (0.0%) |
Employment Status by Educational Attainment in Minocqua
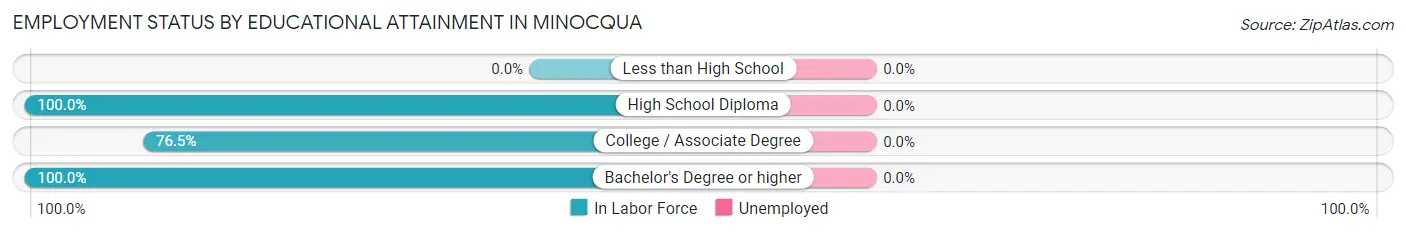
| Educational Attainment | In Labor Force | Unemployed |
| Less than High School | 0 (0.0%) | 0 (0.0%) |
| High School Diploma | 23 (100.0%) | 0 (0.0%) |
| College / Associate Degree | 39 (76.5%) | 0 (0.0%) |
| Bachelor's Degree or higher | 105 (100.0%) | 0 (0.0%) |
| Total | 167 (89.3%) | 0 (0.0%) |
Employment Occupations by Sex in Minocqua
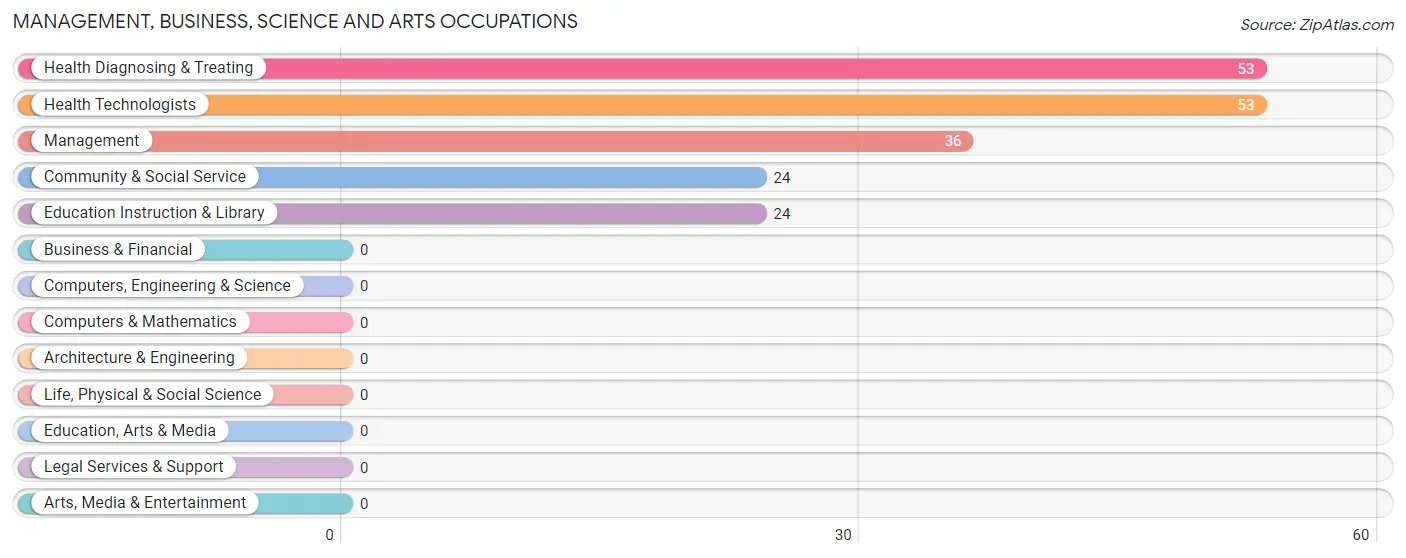
Management, Business, Science and Arts Occupations
The most common Management, Business, Science and Arts occupations in Minocqua are Health Diagnosing & Treating (53 | 23.6%), Health Technologists (53 | 23.6%), Management (36 | 16.0%), Community & Social Service (24 | 10.7%), and Education Instruction & Library (24 | 10.7%).
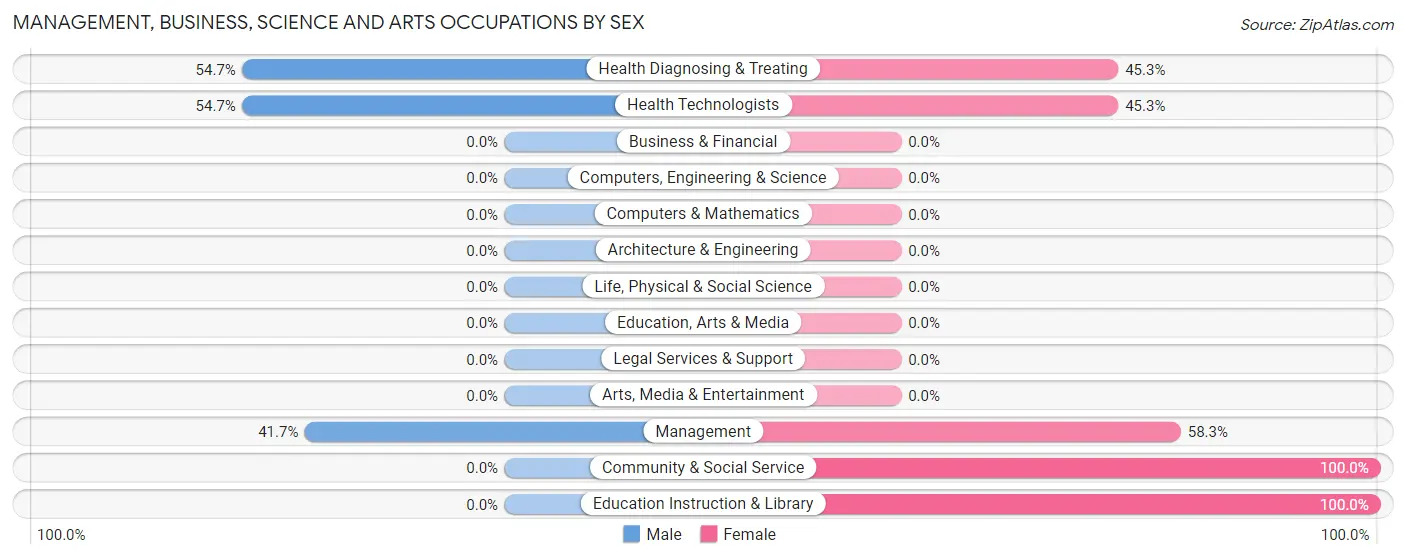
Management, Business, Science and Arts Occupations by Sex
Within the Management, Business, Science and Arts occupations in Minocqua, the most male-oriented occupations are Health Diagnosing & Treating (54.7%), Health Technologists (54.7%), and Management (41.7%), while the most female-oriented occupations are Community & Social Service (100.0%), Education Instruction & Library (100.0%), and Management (58.3%).
| Occupation | Male | Female |
| Management | 15 (41.7%) | 21 (58.3%) |
| Business & Financial | 0 (0.0%) | 0 (0.0%) |
| Computers, Engineering & Science | 0 (0.0%) | 0 (0.0%) |
| Computers & Mathematics | 0 (0.0%) | 0 (0.0%) |
| Architecture & Engineering | 0 (0.0%) | 0 (0.0%) |
| Life, Physical & Social Science | 0 (0.0%) | 0 (0.0%) |
| Community & Social Service | 0 (0.0%) | 24 (100.0%) |
| Education, Arts & Media | 0 (0.0%) | 0 (0.0%) |
| Legal Services & Support | 0 (0.0%) | 0 (0.0%) |
| Education Instruction & Library | 0 (0.0%) | 24 (100.0%) |
| Arts, Media & Entertainment | 0 (0.0%) | 0 (0.0%) |
| Health Diagnosing & Treating | 29 (54.7%) | 24 (45.3%) |
| Health Technologists | 29 (54.7%) | 24 (45.3%) |
| Total (Category) | 44 (38.9%) | 69 (61.1%) |
| Total (Overall) | 90 (40.0%) | 135 (60.0%) |
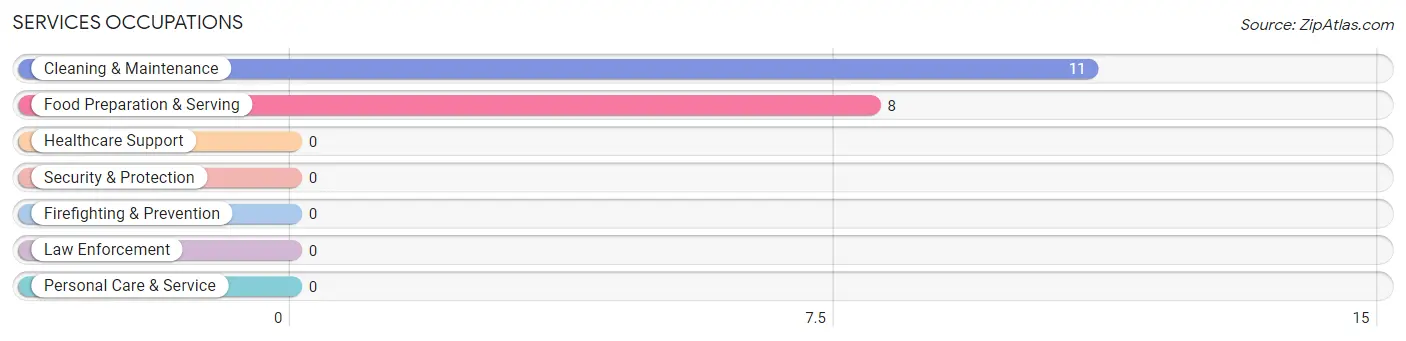
Services Occupations
The most common Services occupations in Minocqua are Cleaning & Maintenance (11 | 4.9%), and Food Preparation & Serving (8 | 3.6%).
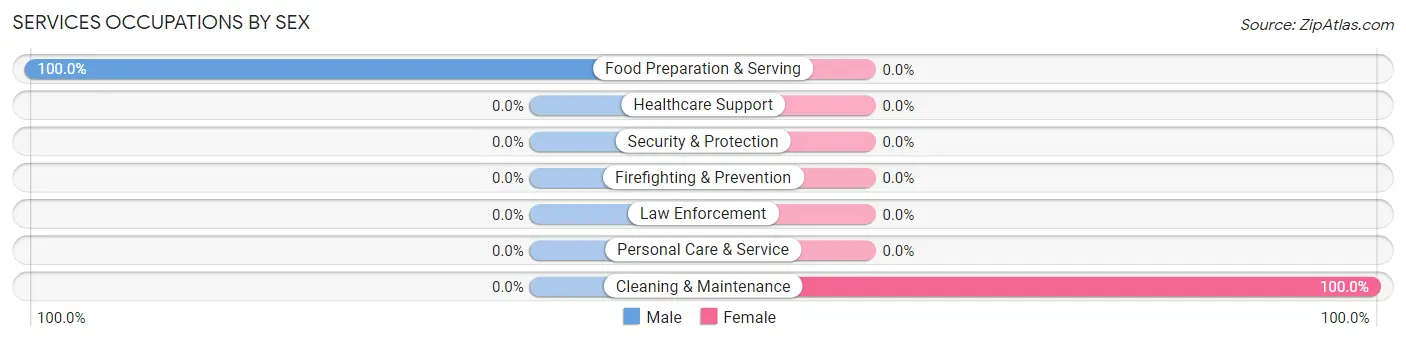
Services Occupations by Sex
| Occupation | Male | Female |
| Healthcare Support | 0 (0.0%) | 0 (0.0%) |
| Security & Protection | 0 (0.0%) | 0 (0.0%) |
| Firefighting & Prevention | 0 (0.0%) | 0 (0.0%) |
| Law Enforcement | 0 (0.0%) | 0 (0.0%) |
| Food Preparation & Serving | 8 (100.0%) | 0 (0.0%) |
| Cleaning & Maintenance | 0 (0.0%) | 11 (100.0%) |
| Personal Care & Service | 0 (0.0%) | 0 (0.0%) |
| Total (Category) | 8 (42.1%) | 11 (57.9%) |
| Total (Overall) | 90 (40.0%) | 135 (60.0%) |
Sales and Office Occupations
The most common Sales and Office occupations in Minocqua are Office & Administration (78 | 34.7%), and Sales & Related (6 | 2.7%).
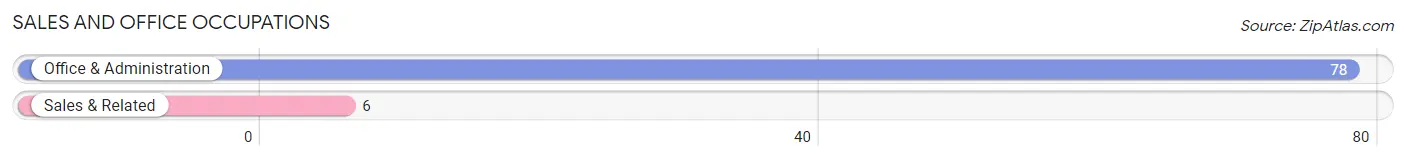
Sales and Office Occupations by Sex

| Occupation | Male | Female |
| Sales & Related | 6 (100.0%) | 0 (0.0%) |
| Office & Administration | 23 (29.5%) | 55 (70.5%) |
| Total (Category) | 29 (34.5%) | 55 (65.5%) |
| Total (Overall) | 90 (40.0%) | 135 (60.0%) |
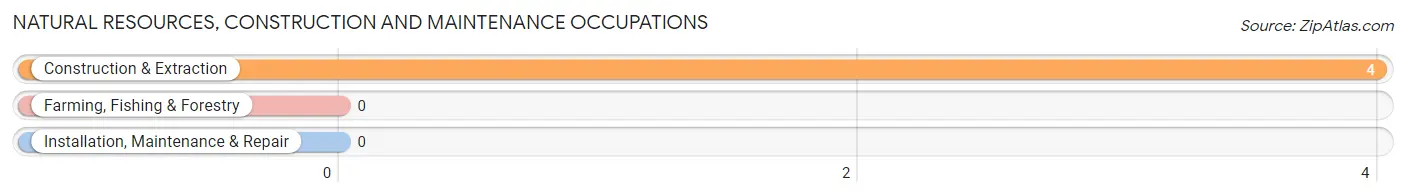
Natural Resources, Construction and Maintenance Occupations
The most common Natural Resources, Construction and Maintenance occupations in Minocqua are , and Construction & Extraction (4 | 1.8%).
Natural Resources, Construction and Maintenance Occupations by Sex
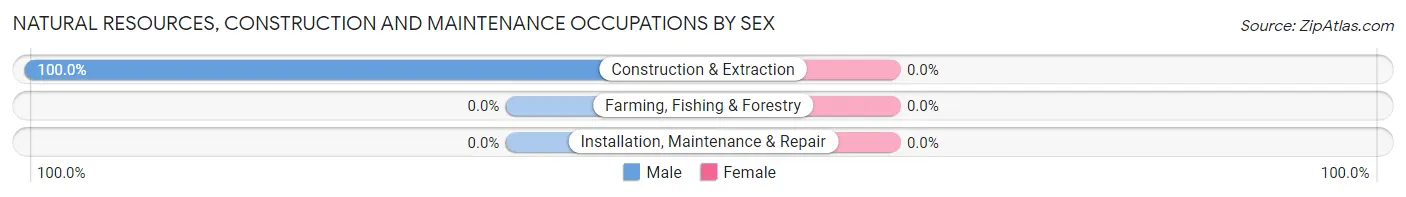
| Occupation | Male | Female |
| Farming, Fishing & Forestry | 0 (0.0%) | 0 (0.0%) |
| Construction & Extraction | 4 (100.0%) | 0 (0.0%) |
| Installation, Maintenance & Repair | 0 (0.0%) | 0 (0.0%) |
| Total (Category) | 4 (100.0%) | 0 (0.0%) |
| Total (Overall) | 90 (40.0%) | 135 (60.0%) |
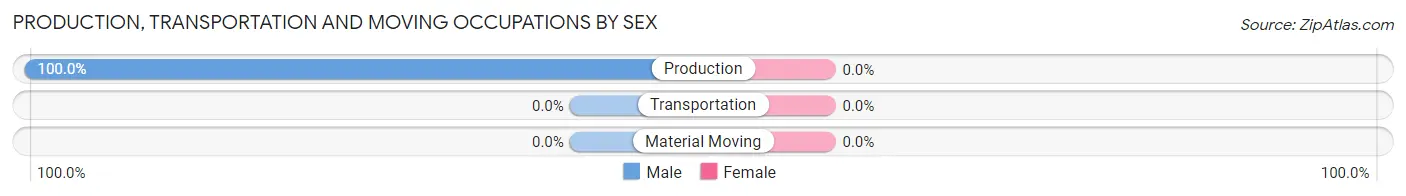
Production, Transportation and Moving Occupations
The most common Production, Transportation and Moving occupations in Minocqua are , and Production (5 | 2.2%).
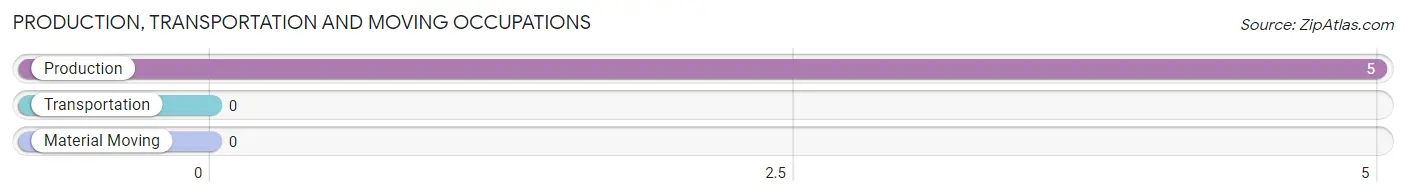
Production, Transportation and Moving Occupations by Sex
| Occupation | Male | Female |
| Production | 5 (100.0%) | 0 (0.0%) |
| Transportation | 0 (0.0%) | 0 (0.0%) |
| Material Moving | 0 (0.0%) | 0 (0.0%) |
| Total (Category) | 5 (100.0%) | 0 (0.0%) |
| Total (Overall) | 90 (40.0%) | 135 (60.0%) |
Employment Industries by Sex in Minocqua
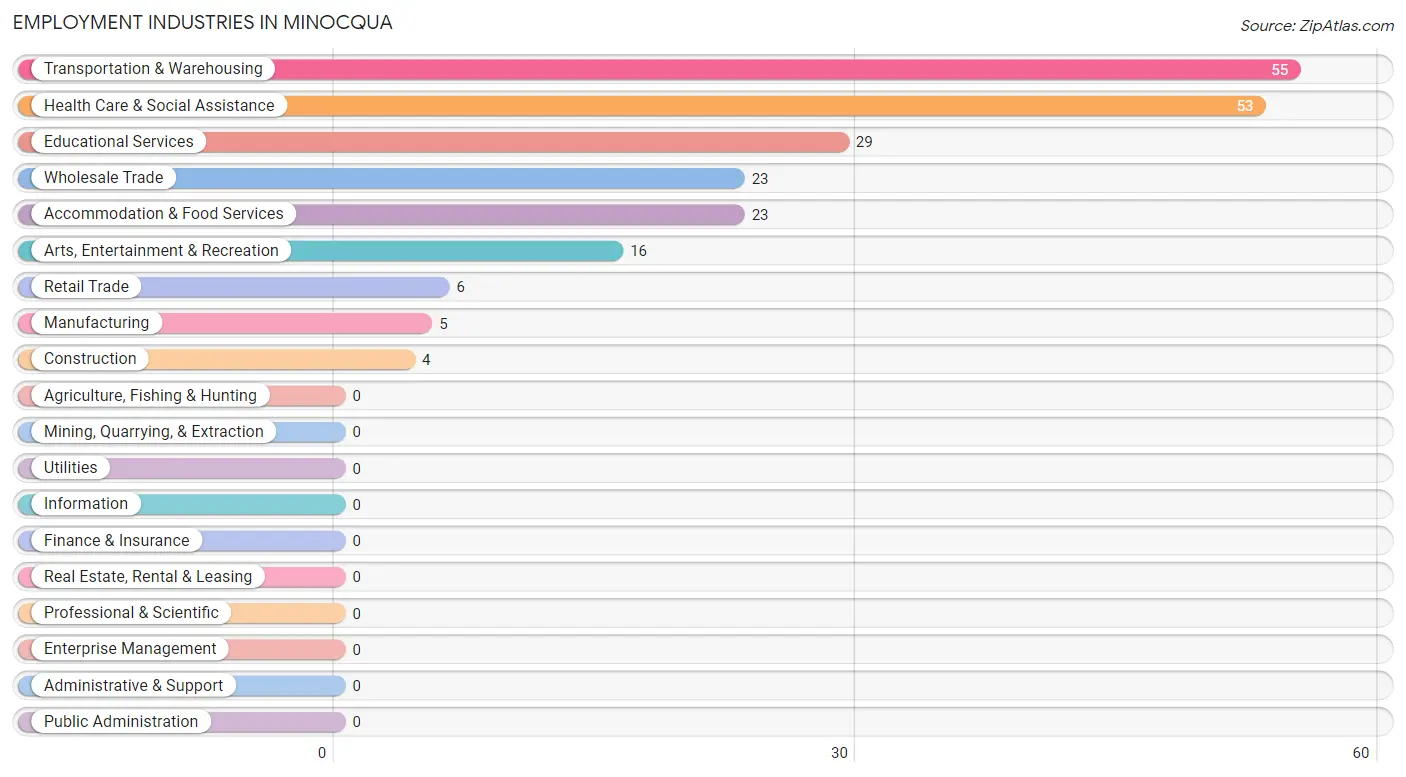
Employment Industries in Minocqua
The major employment industries in Minocqua include Transportation & Warehousing (55 | 24.4%), Health Care & Social Assistance (53 | 23.6%), Educational Services (29 | 12.9%), Wholesale Trade (23 | 10.2%), and Accommodation & Food Services (23 | 10.2%).
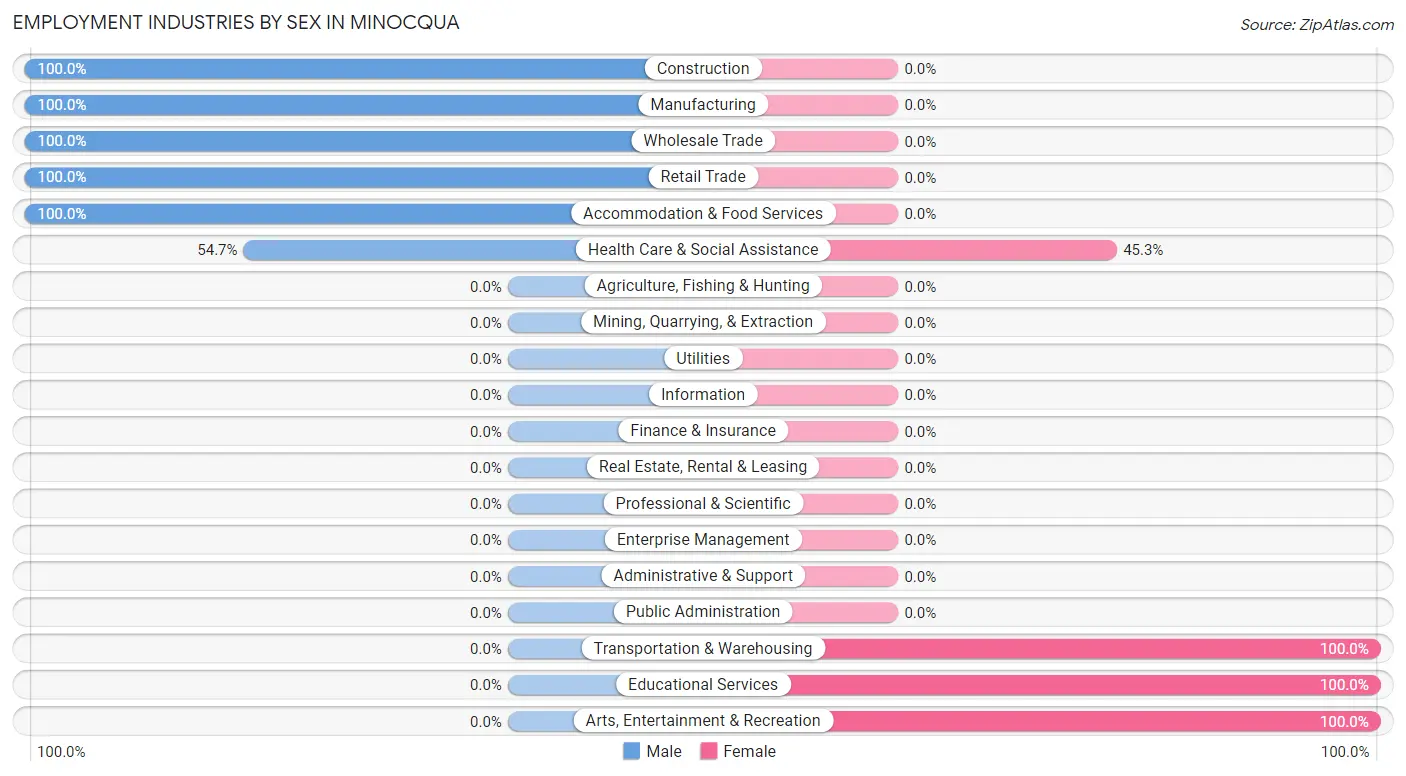
Employment Industries by Sex in Minocqua
The Minocqua industries that see more men than women are Construction (100.0%), Manufacturing (100.0%), and Wholesale Trade (100.0%), whereas the industries that tend to have a higher number of women are Transportation & Warehousing (100.0%), Educational Services (100.0%), and Arts, Entertainment & Recreation (100.0%).
| Industry | Male | Female |
| Agriculture, Fishing & Hunting | 0 (0.0%) | 0 (0.0%) |
| Mining, Quarrying, & Extraction | 0 (0.0%) | 0 (0.0%) |
| Construction | 4 (100.0%) | 0 (0.0%) |
| Manufacturing | 5 (100.0%) | 0 (0.0%) |
| Wholesale Trade | 23 (100.0%) | 0 (0.0%) |
| Retail Trade | 6 (100.0%) | 0 (0.0%) |
| Transportation & Warehousing | 0 (0.0%) | 55 (100.0%) |
| Utilities | 0 (0.0%) | 0 (0.0%) |
| Information | 0 (0.0%) | 0 (0.0%) |
| Finance & Insurance | 0 (0.0%) | 0 (0.0%) |
| Real Estate, Rental & Leasing | 0 (0.0%) | 0 (0.0%) |
| Professional & Scientific | 0 (0.0%) | 0 (0.0%) |
| Enterprise Management | 0 (0.0%) | 0 (0.0%) |
| Administrative & Support | 0 (0.0%) | 0 (0.0%) |
| Educational Services | 0 (0.0%) | 29 (100.0%) |
| Health Care & Social Assistance | 29 (54.7%) | 24 (45.3%) |
| Arts, Entertainment & Recreation | 0 (0.0%) | 16 (100.0%) |
| Accommodation & Food Services | 23 (100.0%) | 0 (0.0%) |
| Public Administration | 0 (0.0%) | 0 (0.0%) |
| Total | 90 (40.0%) | 135 (60.0%) |
Education in Minocqua
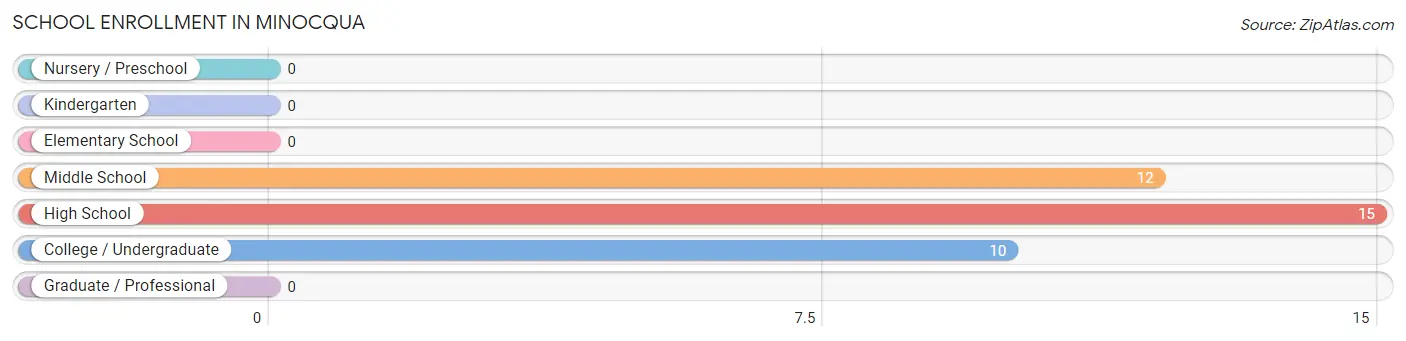
School Enrollment in Minocqua
The most common levels of schooling among the 37 students in Minocqua are high school (15 | 40.5%), middle school (12 | 32.4%), and college / undergraduate (10 | 27.0%).
| School Level | # Students | % Students |
| Nursery / Preschool | 0 | 0.0% |
| Kindergarten | 0 | 0.0% |
| Elementary School | 0 | 0.0% |
| Middle School | 12 | 32.4% |
| High School | 15 | 40.5% |
| College / Undergraduate | 10 | 27.0% |
| Graduate / Professional | 0 | 0.0% |
| Total | 37 | 100.0% |
School Enrollment by Age by Funding Source in Minocqua
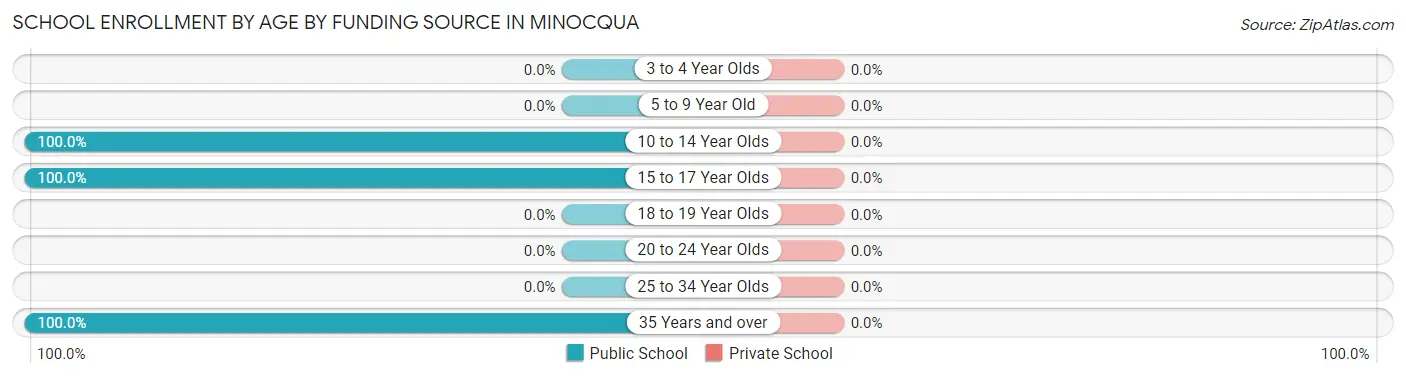
| Age Bracket | Public School | Private School |
| 3 to 4 Year Olds | 0 (0.0%) | 0 (0.0%) |
| 5 to 9 Year Old | 0 (0.0%) | 0 (0.0%) |
| 10 to 14 Year Olds | 12 (100.0%) | 0 (0.0%) |
| 15 to 17 Year Olds | 15 (100.0%) | 0 (0.0%) |
| 18 to 19 Year Olds | 0 (0.0%) | 0 (0.0%) |
| 20 to 24 Year Olds | 0 (0.0%) | 0 (0.0%) |
| 25 to 34 Year Olds | 0 (0.0%) | 0 (0.0%) |
| 35 Years and over | 10 (100.0%) | 0 (0.0%) |
| Total | 37 (100.0%) | 0 (0.0%) |
Educational Attainment by Field of Study in Minocqua
Education (52 | 31.3%), science & technology (29 | 17.5%), business (28 | 16.9%), bio, nature & agricultural (24 | 14.5%), and arts & humanities (24 | 14.5%) are the most common fields of study among 166 individuals in Minocqua who have obtained a bachelor's degree or higher.
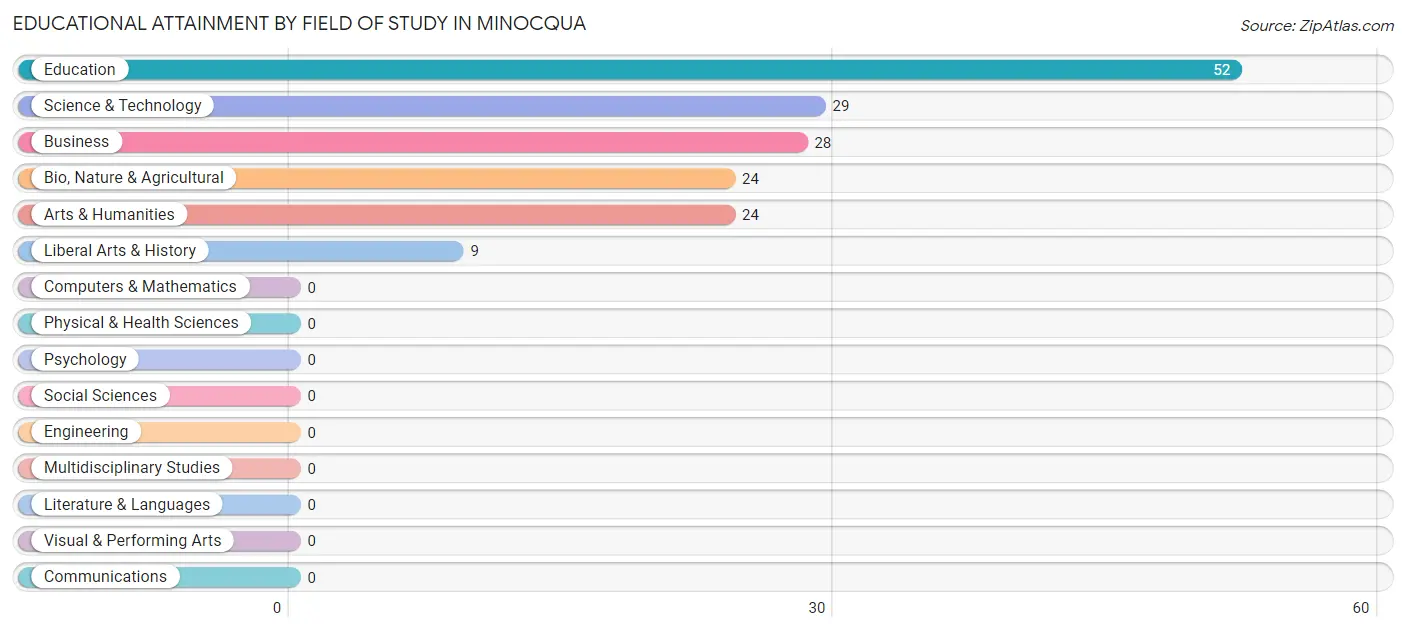
| Field of Study | # Graduates | % Graduates |
| Computers & Mathematics | 0 | 0.0% |
| Bio, Nature & Agricultural | 24 | 14.5% |
| Physical & Health Sciences | 0 | 0.0% |
| Psychology | 0 | 0.0% |
| Social Sciences | 0 | 0.0% |
| Engineering | 0 | 0.0% |
| Multidisciplinary Studies | 0 | 0.0% |
| Science & Technology | 29 | 17.5% |
| Business | 28 | 16.9% |
| Education | 52 | 31.3% |
| Literature & Languages | 0 | 0.0% |
| Liberal Arts & History | 9 | 5.4% |
| Visual & Performing Arts | 0 | 0.0% |
| Communications | 0 | 0.0% |
| Arts & Humanities | 24 | 14.5% |
| Total | 166 | 100.0% |
Transportation & Commute in Minocqua
Vehicle Availability by Sex in Minocqua
The most prevalent vehicle ownership categories in Minocqua are males with 2 vehicles (86, accounting for 100.0%) and females with 2 vehicles (69, making up 63.7%).
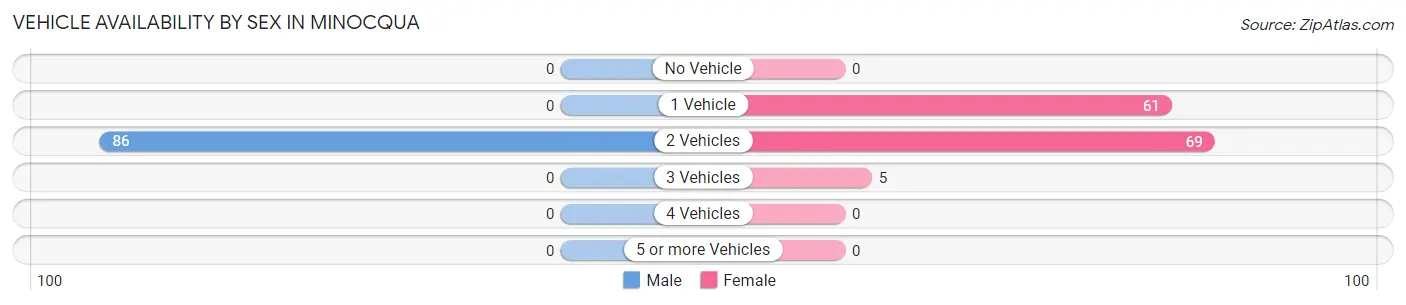
| Vehicles Available | Male | Female |
| No Vehicle | 0 (0.0%) | 0 (0.0%) |
| 1 Vehicle | 0 (0.0%) | 61 (45.2%) |
| 2 Vehicles | 86 (100.0%) | 69 (51.1%) |
| 3 Vehicles | 0 (0.0%) | 5 (3.7%) |
| 4 Vehicles | 0 (0.0%) | 0 (0.0%) |
| 5 or more Vehicles | 0 (0.0%) | 0 (0.0%) |
| Total | 86 (100.0%) | 135 (100.0%) |
Commute Time in Minocqua
The most frequently occuring commute durations in Minocqua are 10 to 14 minutes (104 commuters, 48.1%), 5 to 9 minutes (82 commuters, 38.0%), and 20 to 24 minutes (11 commuters, 5.1%).
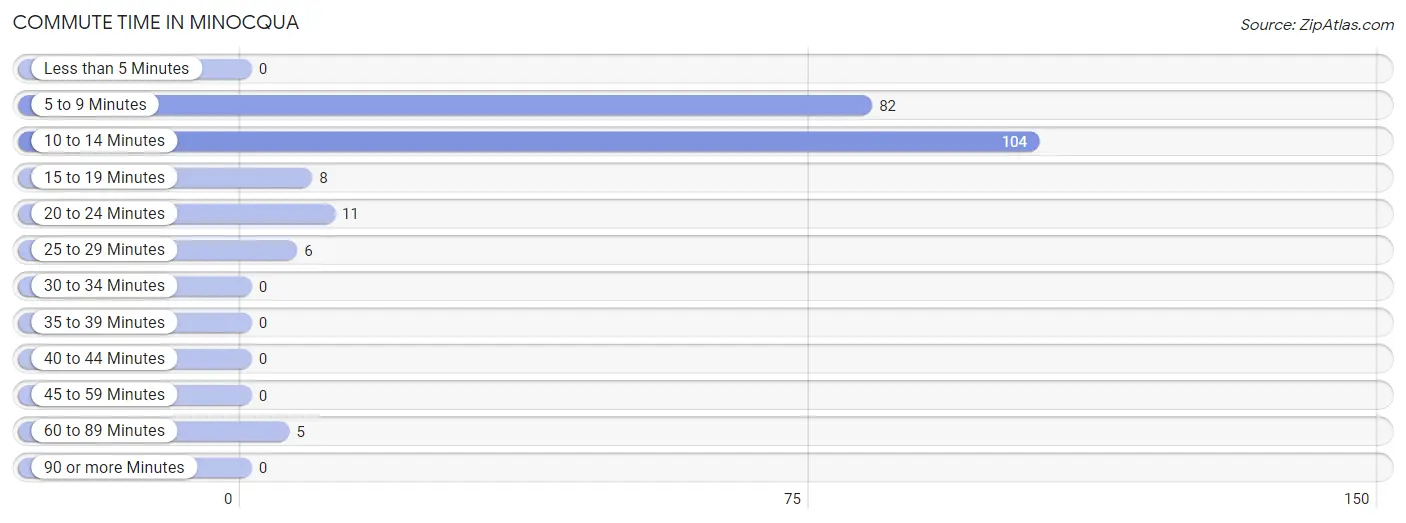
| Commute Time | # Commuters | % Commuters |
| Less than 5 Minutes | 0 | 0.0% |
| 5 to 9 Minutes | 82 | 38.0% |
| 10 to 14 Minutes | 104 | 48.1% |
| 15 to 19 Minutes | 8 | 3.7% |
| 20 to 24 Minutes | 11 | 5.1% |
| 25 to 29 Minutes | 6 | 2.8% |
| 30 to 34 Minutes | 0 | 0.0% |
| 35 to 39 Minutes | 0 | 0.0% |
| 40 to 44 Minutes | 0 | 0.0% |
| 45 to 59 Minutes | 0 | 0.0% |
| 60 to 89 Minutes | 5 | 2.3% |
| 90 or more Minutes | 0 | 0.0% |
Commute Time by Sex in Minocqua
The most common commute times in Minocqua are 10 to 14 minutes (38 commuters, 44.2%) for males and 10 to 14 minutes (66 commuters, 50.8%) for females.
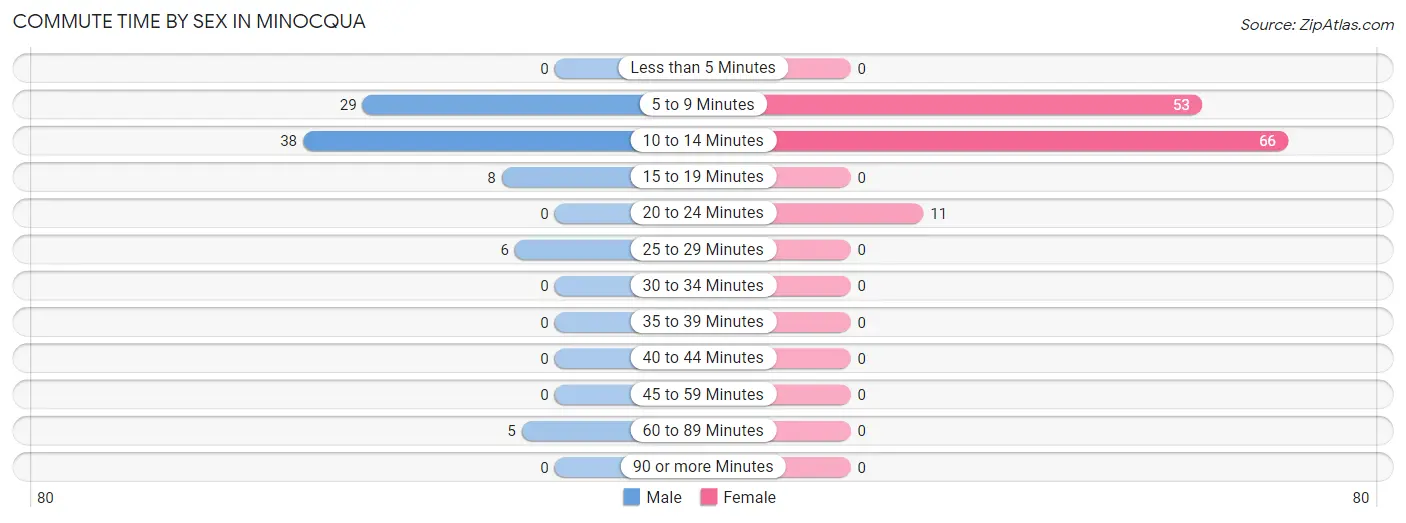
| Commute Time | Male | Female |
| Less than 5 Minutes | 0 (0.0%) | 0 (0.0%) |
| 5 to 9 Minutes | 29 (33.7%) | 53 (40.8%) |
| 10 to 14 Minutes | 38 (44.2%) | 66 (50.8%) |
| 15 to 19 Minutes | 8 (9.3%) | 0 (0.0%) |
| 20 to 24 Minutes | 0 (0.0%) | 11 (8.5%) |
| 25 to 29 Minutes | 6 (7.0%) | 0 (0.0%) |
| 30 to 34 Minutes | 0 (0.0%) | 0 (0.0%) |
| 35 to 39 Minutes | 0 (0.0%) | 0 (0.0%) |
| 40 to 44 Minutes | 0 (0.0%) | 0 (0.0%) |
| 45 to 59 Minutes | 0 (0.0%) | 0 (0.0%) |
| 60 to 89 Minutes | 5 (5.8%) | 0 (0.0%) |
| 90 or more Minutes | 0 (0.0%) | 0 (0.0%) |
Time of Departure to Work by Sex in Minocqua
The most frequent times of departure to work in Minocqua are 9:00 AM to 9:59 AM (38, 44.2%) for males and 4:00 PM to 11:59 PM (50, 38.5%) for females.
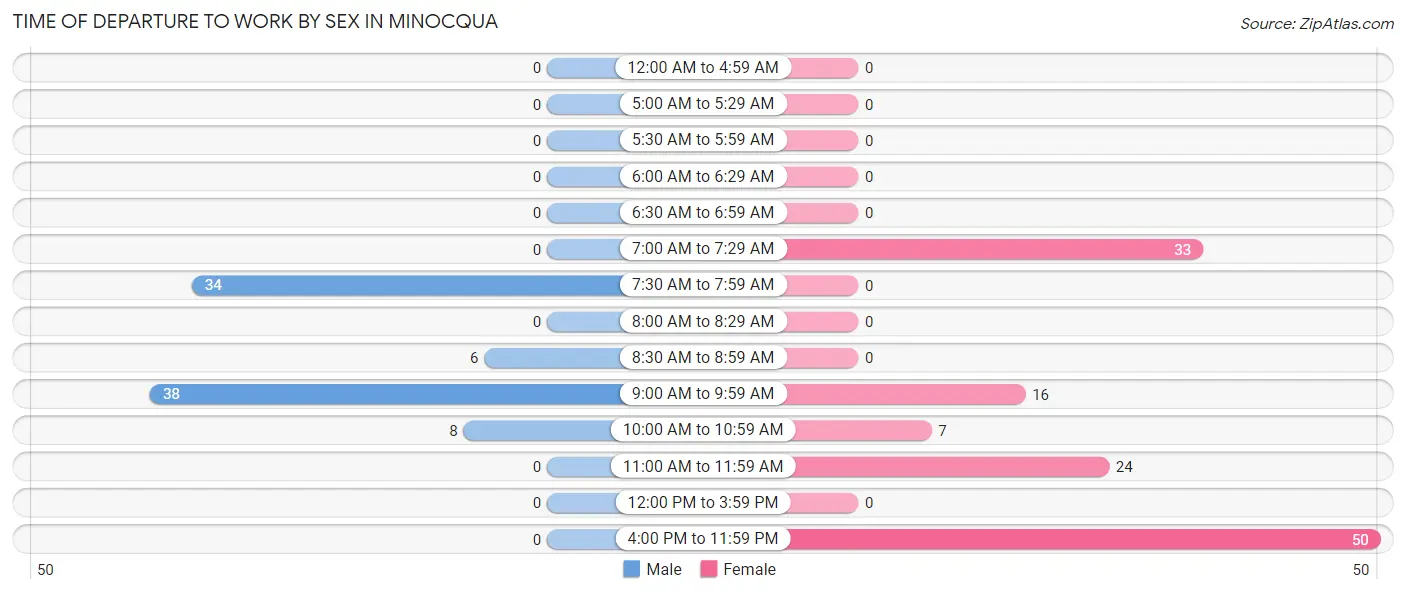
| Time of Departure | Male | Female |
| 12:00 AM to 4:59 AM | 0 (0.0%) | 0 (0.0%) |
| 5:00 AM to 5:29 AM | 0 (0.0%) | 0 (0.0%) |
| 5:30 AM to 5:59 AM | 0 (0.0%) | 0 (0.0%) |
| 6:00 AM to 6:29 AM | 0 (0.0%) | 0 (0.0%) |
| 6:30 AM to 6:59 AM | 0 (0.0%) | 0 (0.0%) |
| 7:00 AM to 7:29 AM | 0 (0.0%) | 33 (25.4%) |
| 7:30 AM to 7:59 AM | 34 (39.5%) | 0 (0.0%) |
| 8:00 AM to 8:29 AM | 0 (0.0%) | 0 (0.0%) |
| 8:30 AM to 8:59 AM | 6 (7.0%) | 0 (0.0%) |
| 9:00 AM to 9:59 AM | 38 (44.2%) | 16 (12.3%) |
| 10:00 AM to 10:59 AM | 8 (9.3%) | 7 (5.4%) |
| 11:00 AM to 11:59 AM | 0 (0.0%) | 24 (18.5%) |
| 12:00 PM to 3:59 PM | 0 (0.0%) | 0 (0.0%) |
| 4:00 PM to 11:59 PM | 0 (0.0%) | 50 (38.5%) |
| Total | 86 (100.0%) | 130 (100.0%) |
Housing Occupancy in Minocqua
Occupancy by Ownership in Minocqua
Of the total 259 dwellings in Minocqua, owner-occupied units account for 177 (68.3%), while renter-occupied units make up 82 (31.7%).
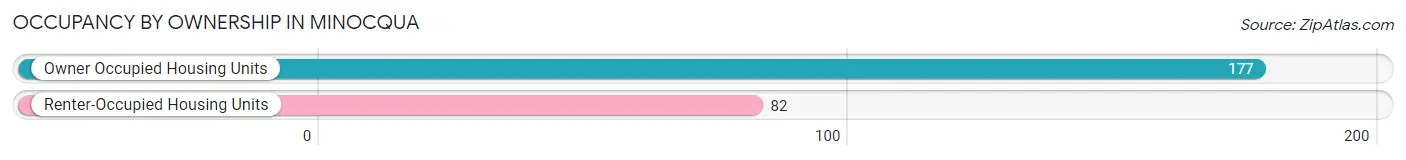
| Occupancy | # Housing Units | % Housing Units |
| Owner Occupied Housing Units | 177 | 68.3% |
| Renter-Occupied Housing Units | 82 | 31.7% |
| Total Occupied Housing Units | 259 | 100.0% |
Occupancy by Household Size in Minocqua
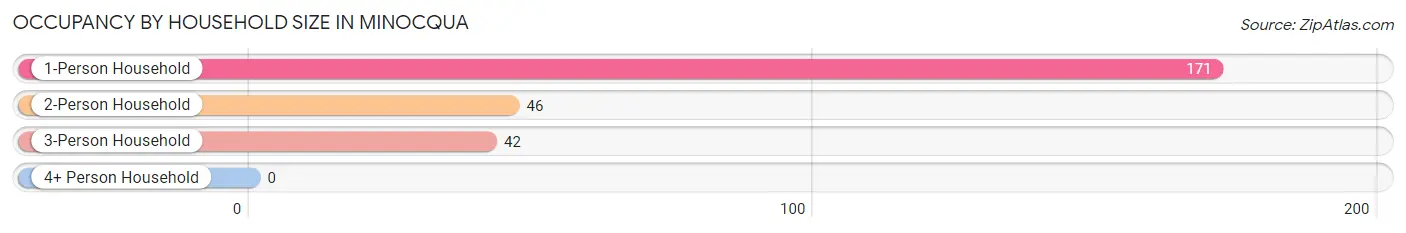
| Household Size | # Housing Units | % Housing Units |
| 1-Person Household | 171 | 66.0% |
| 2-Person Household | 46 | 17.8% |
| 3-Person Household | 42 | 16.2% |
| 4+ Person Household | 0 | 0.0% |
| Total Housing Units | 259 | 100.0% |
Occupancy by Ownership by Household Size in Minocqua
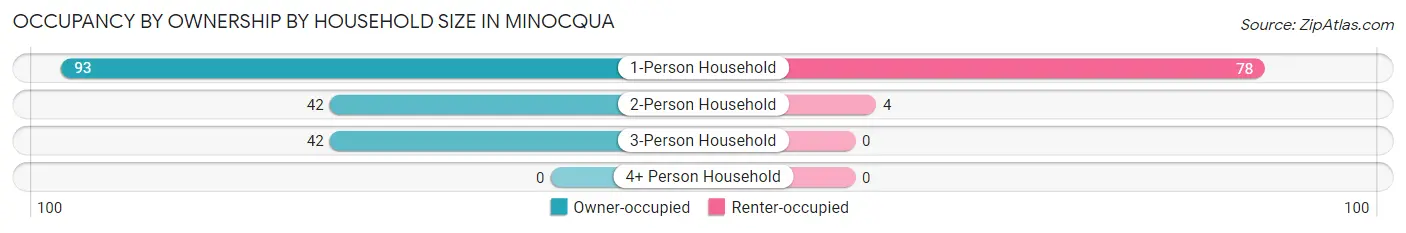
| Household Size | Owner-occupied | Renter-occupied |
| 1-Person Household | 93 (54.4%) | 78 (45.6%) |
| 2-Person Household | 42 (91.3%) | 4 (8.7%) |
| 3-Person Household | 42 (100.0%) | 0 (0.0%) |
| 4+ Person Household | 0 (0.0%) | 0 (0.0%) |
| Total Housing Units | 177 (68.3%) | 82 (31.7%) |
Occupancy by Educational Attainment in Minocqua
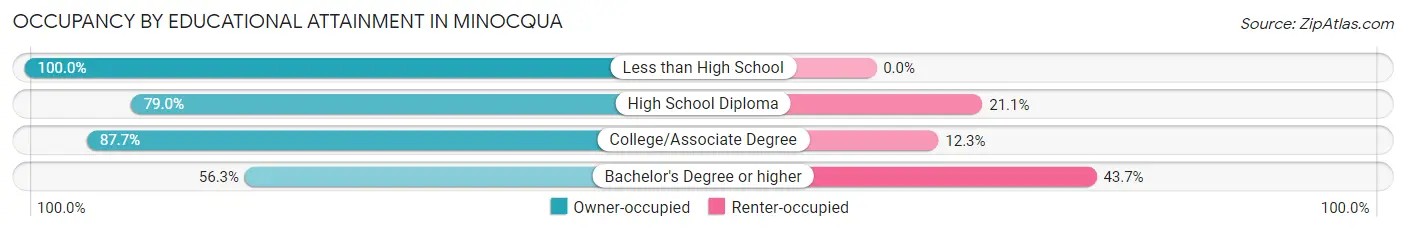
| Household Size | Owner-occupied | Renter-occupied |
| Less than High School | 9 (100.0%) | 0 (0.0%) |
| High School Diploma | 15 (78.9%) | 4 (21.0%) |
| College/Associate Degree | 64 (87.7%) | 9 (12.3%) |
| Bachelor's Degree or higher | 89 (56.3%) | 69 (43.7%) |
Occupancy by Age of Householder in Minocqua
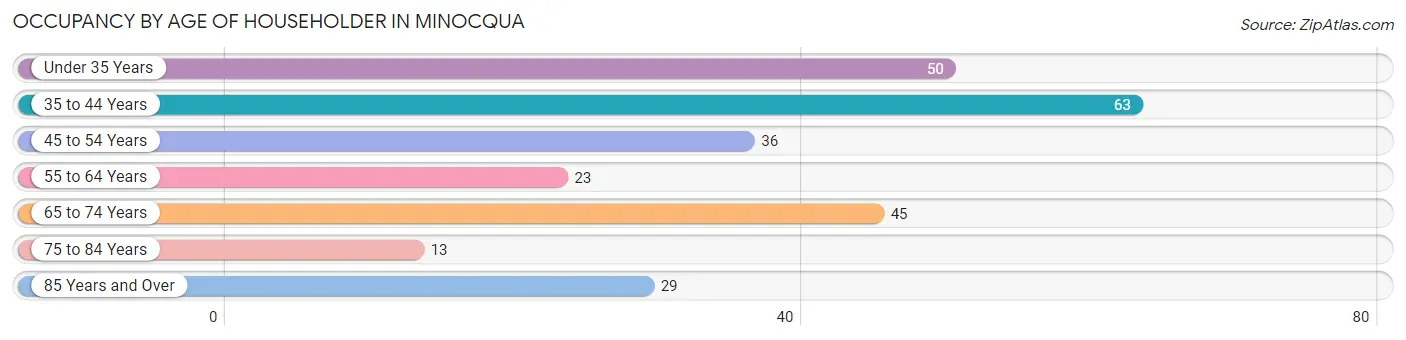
| Age Bracket | # Households | % Households |
| Under 35 Years | 50 | 19.3% |
| 35 to 44 Years | 63 | 24.3% |
| 45 to 54 Years | 36 | 13.9% |
| 55 to 64 Years | 23 | 8.9% |
| 65 to 74 Years | 45 | 17.4% |
| 75 to 84 Years | 13 | 5.0% |
| 85 Years and Over | 29 | 11.2% |
| Total | 259 | 100.0% |
Housing Finances in Minocqua
Median Income by Occupancy in Minocqua
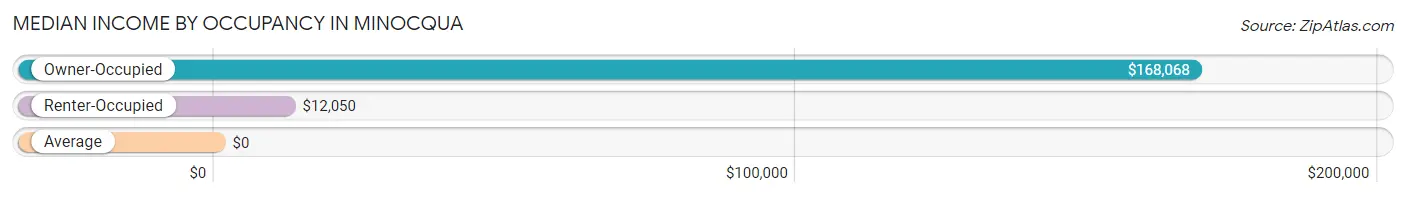
| Occupancy Type | # Households | Median Income |
| Owner-Occupied | 177 (68.3%) | $168,068 |
| Renter-Occupied | 82 (31.7%) | $12,050 |
| Average | 259 (100.0%) | $0 |
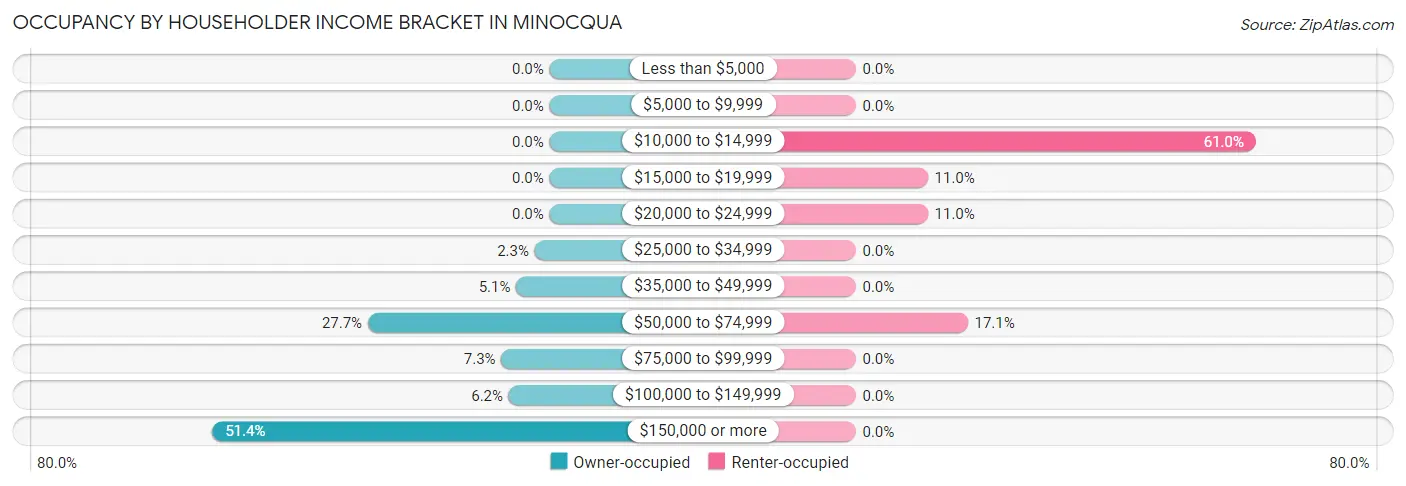
Occupancy by Householder Income Bracket in Minocqua
| Income Bracket | Owner-occupied | Renter-occupied |
| Less than $5,000 | 0 (0.0%) | 0 (0.0%) |
| $5,000 to $9,999 | 0 (0.0%) | 0 (0.0%) |
| $10,000 to $14,999 | 0 (0.0%) | 50 (61.0%) |
| $15,000 to $19,999 | 0 (0.0%) | 9 (11.0%) |
| $20,000 to $24,999 | 0 (0.0%) | 9 (11.0%) |
| $25,000 to $34,999 | 4 (2.3%) | 0 (0.0%) |
| $35,000 to $49,999 | 9 (5.1%) | 0 (0.0%) |
| $50,000 to $74,999 | 49 (27.7%) | 14 (17.1%) |
| $75,000 to $99,999 | 13 (7.3%) | 0 (0.0%) |
| $100,000 to $149,999 | 11 (6.2%) | 0 (0.0%) |
| $150,000 or more | 91 (51.4%) | 0 (0.0%) |
| Total | 177 (100.0%) | 82 (100.0%) |
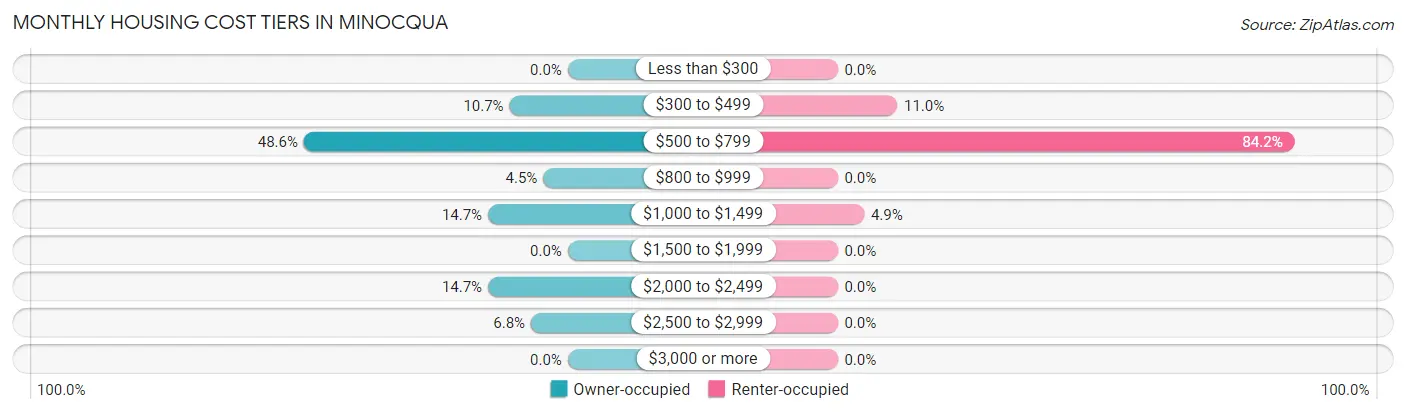
Monthly Housing Cost Tiers in Minocqua
| Monthly Cost | Owner-occupied | Renter-occupied |
| Less than $300 | 0 (0.0%) | 0 (0.0%) |
| $300 to $499 | 19 (10.7%) | 9 (11.0%) |
| $500 to $799 | 86 (48.6%) | 69 (84.2%) |
| $800 to $999 | 8 (4.5%) | 0 (0.0%) |
| $1,000 to $1,499 | 26 (14.7%) | 4 (4.9%) |
| $1,500 to $1,999 | 0 (0.0%) | 0 (0.0%) |
| $2,000 to $2,499 | 26 (14.7%) | 0 (0.0%) |
| $2,500 to $2,999 | 12 (6.8%) | 0 (0.0%) |
| $3,000 or more | 0 (0.0%) | 0 (0.0%) |
| Total | 177 (100.0%) | 82 (100.0%) |
Physical Housing Characteristics in Minocqua
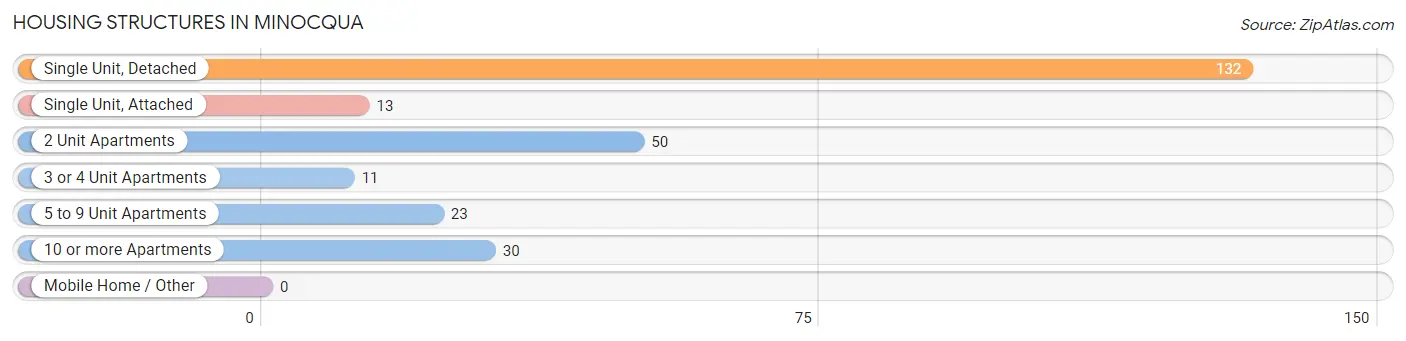
Housing Structures in Minocqua
| Structure Type | # Housing Units | % Housing Units |
| Single Unit, Detached | 132 | 51.0% |
| Single Unit, Attached | 13 | 5.0% |
| 2 Unit Apartments | 50 | 19.3% |
| 3 or 4 Unit Apartments | 11 | 4.3% |
| 5 to 9 Unit Apartments | 23 | 8.9% |
| 10 or more Apartments | 30 | 11.6% |
| Mobile Home / Other | 0 | 0.0% |
| Total | 259 | 100.0% |
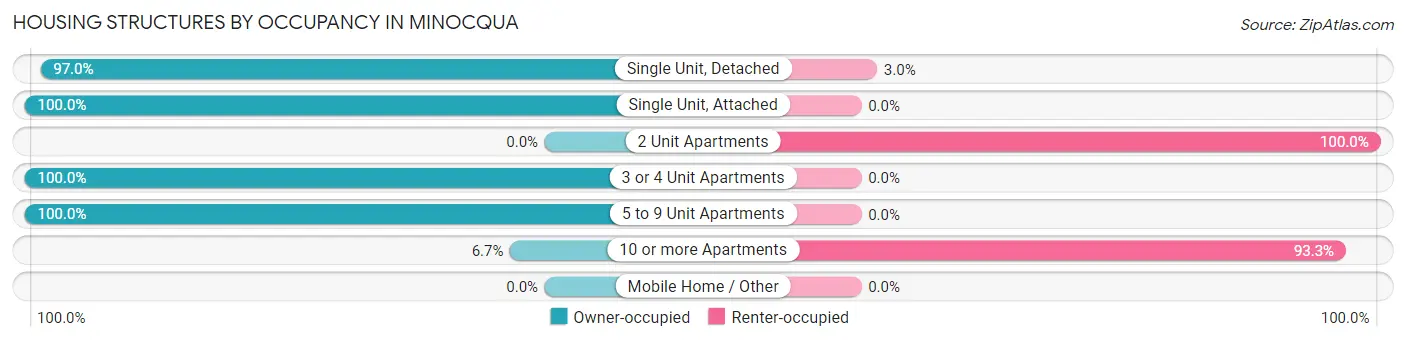
Housing Structures by Occupancy in Minocqua
| Structure Type | Owner-occupied | Renter-occupied |
| Single Unit, Detached | 128 (97.0%) | 4 (3.0%) |
| Single Unit, Attached | 13 (100.0%) | 0 (0.0%) |
| 2 Unit Apartments | 0 (0.0%) | 50 (100.0%) |
| 3 or 4 Unit Apartments | 11 (100.0%) | 0 (0.0%) |
| 5 to 9 Unit Apartments | 23 (100.0%) | 0 (0.0%) |
| 10 or more Apartments | 2 (6.7%) | 28 (93.3%) |
| Mobile Home / Other | 0 (0.0%) | 0 (0.0%) |
| Total | 177 (68.3%) | 82 (31.7%) |
Housing Structures by Number of Rooms in Minocqua
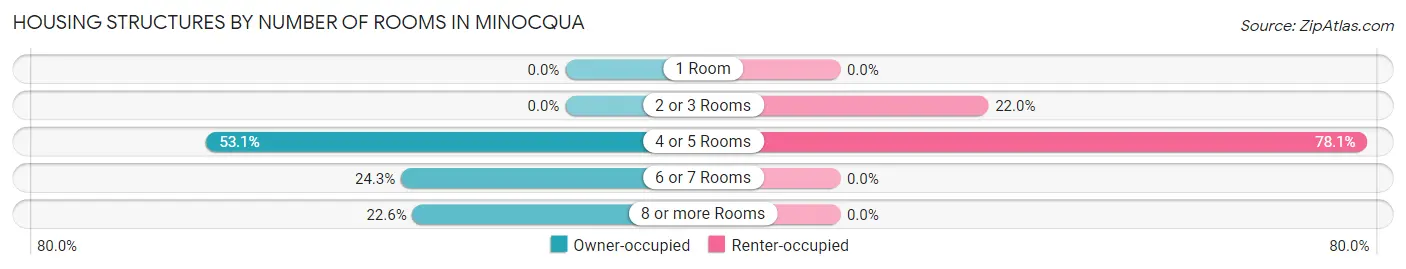
| Number of Rooms | Owner-occupied | Renter-occupied |
| 1 Room | 0 (0.0%) | 0 (0.0%) |
| 2 or 3 Rooms | 0 (0.0%) | 18 (22.0%) |
| 4 or 5 Rooms | 94 (53.1%) | 64 (78.0%) |
| 6 or 7 Rooms | 43 (24.3%) | 0 (0.0%) |
| 8 or more Rooms | 40 (22.6%) | 0 (0.0%) |
| Total | 177 (100.0%) | 82 (100.0%) |
Housing Structure by Heating Type in Minocqua
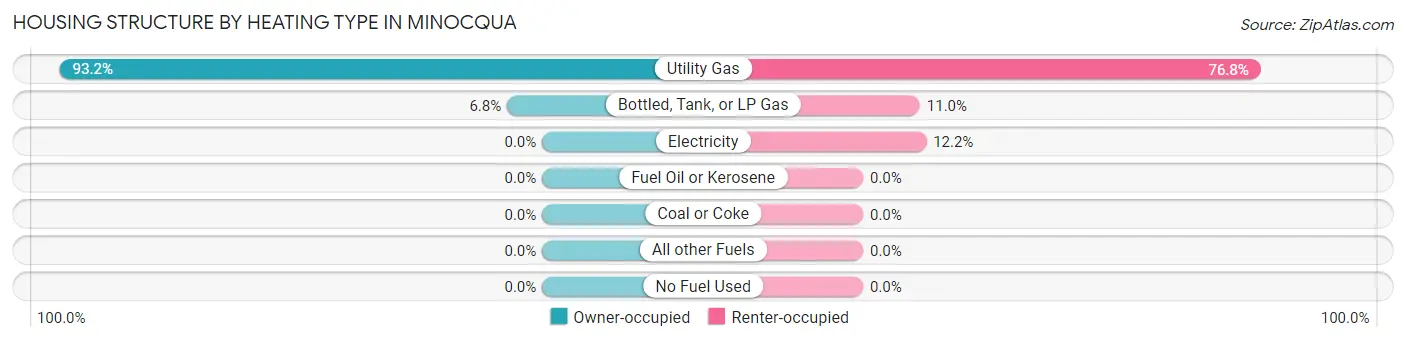
| Heating Type | Owner-occupied | Renter-occupied |
| Utility Gas | 165 (93.2%) | 63 (76.8%) |
| Bottled, Tank, or LP Gas | 12 (6.8%) | 9 (11.0%) |
| Electricity | 0 (0.0%) | 10 (12.2%) |
| Fuel Oil or Kerosene | 0 (0.0%) | 0 (0.0%) |
| Coal or Coke | 0 (0.0%) | 0 (0.0%) |
| All other Fuels | 0 (0.0%) | 0 (0.0%) |
| No Fuel Used | 0 (0.0%) | 0 (0.0%) |
| Total | 177 (100.0%) | 82 (100.0%) |
Household Vehicle Usage in Minocqua
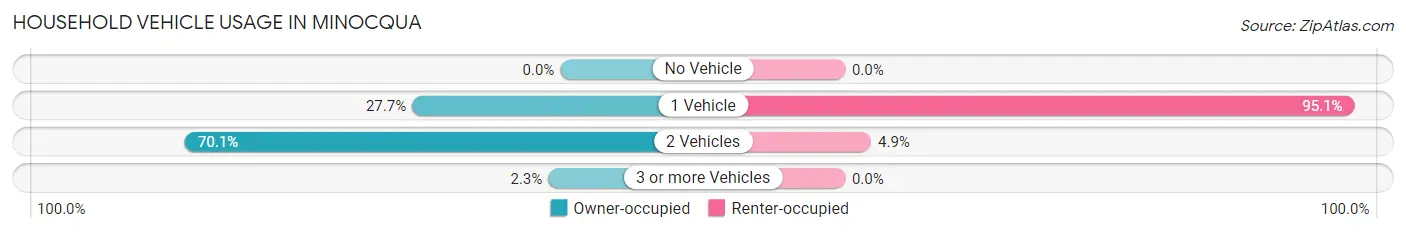
| Vehicles per Household | Owner-occupied | Renter-occupied |
| No Vehicle | 0 (0.0%) | 0 (0.0%) |
| 1 Vehicle | 49 (27.7%) | 78 (95.1%) |
| 2 Vehicles | 124 (70.1%) | 4 (4.9%) |
| 3 or more Vehicles | 4 (2.3%) | 0 (0.0%) |
| Total | 177 (100.0%) | 82 (100.0%) |
Real Estate & Mortgages in Minocqua
Real Estate and Mortgage Overview in Minocqua
| Characteristic | Without Mortgage | With Mortgage |
| Housing Units | 102 | 75 |
| Median Property Value | $220,700 | $0 |
| Median Household Income | - | - |
| Monthly Housing Costs | $606 | $0 |
| Real Estate Taxes | $1,600 | $0 |
Property Value by Mortgage Status in Minocqua
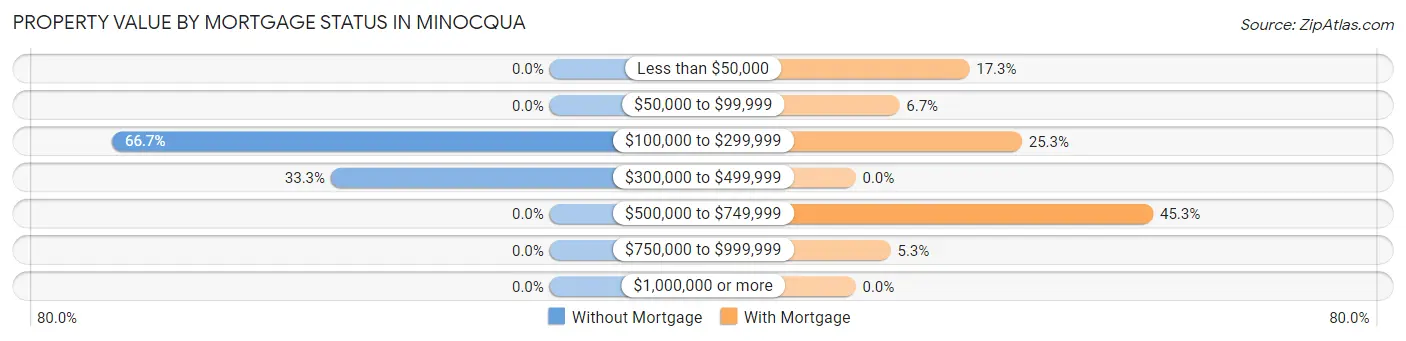
| Property Value | Without Mortgage | With Mortgage |
| Less than $50,000 | 0 (0.0%) | 13 (17.3%) |
| $50,000 to $99,999 | 0 (0.0%) | 5 (6.7%) |
| $100,000 to $299,999 | 68 (66.7%) | 19 (25.3%) |
| $300,000 to $499,999 | 34 (33.3%) | 0 (0.0%) |
| $500,000 to $749,999 | 0 (0.0%) | 34 (45.3%) |
| $750,000 to $999,999 | 0 (0.0%) | 4 (5.3%) |
| $1,000,000 or more | 0 (0.0%) | 0 (0.0%) |
| Total | 102 (100.0%) | 75 (100.0%) |
Household Income by Mortgage Status in Minocqua
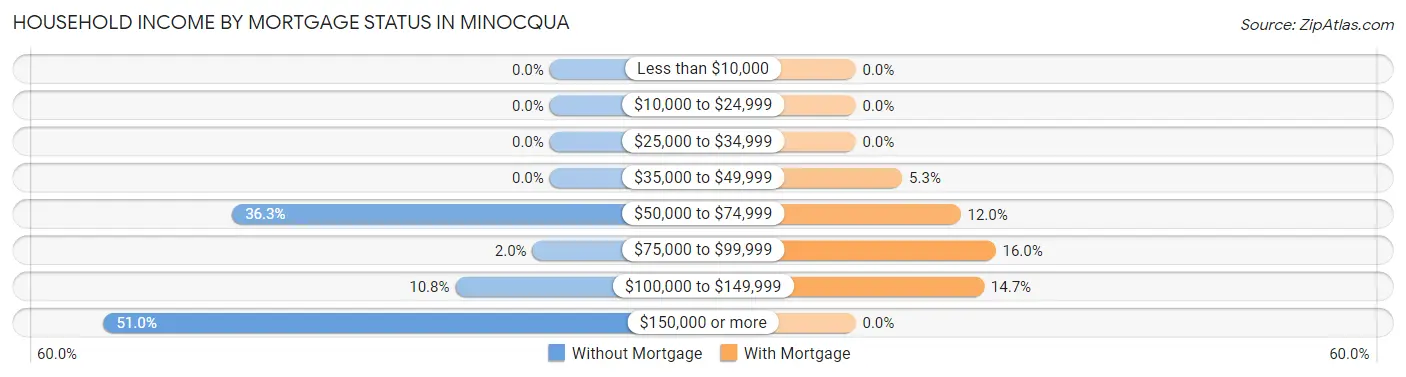
| Household Income | Without Mortgage | With Mortgage |
| Less than $10,000 | 0 (0.0%) | 0 (0.0%) |
| $10,000 to $24,999 | 0 (0.0%) | 0 (0.0%) |
| $25,000 to $34,999 | 0 (0.0%) | 0 (0.0%) |
| $35,000 to $49,999 | 0 (0.0%) | 4 (5.3%) |
| $50,000 to $74,999 | 37 (36.3%) | 9 (12.0%) |
| $75,000 to $99,999 | 2 (2.0%) | 12 (16.0%) |
| $100,000 to $149,999 | 11 (10.8%) | 11 (14.7%) |
| $150,000 or more | 52 (51.0%) | 0 (0.0%) |
| Total | 102 (100.0%) | 75 (100.0%) |
Property Value to Household Income Ratio in Minocqua
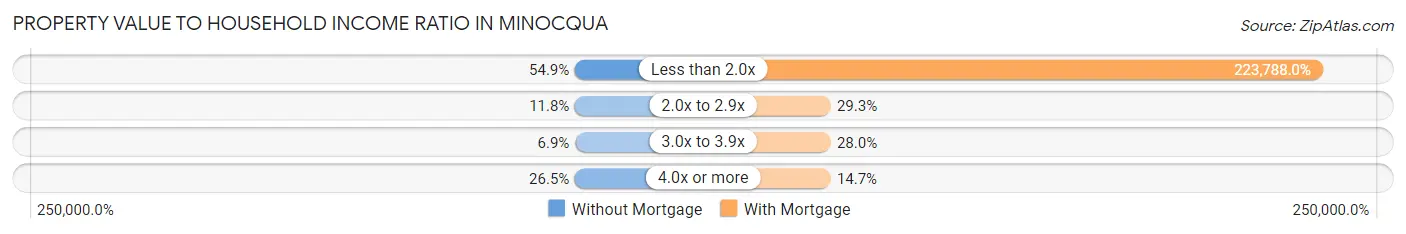
| Value-to-Income Ratio | Without Mortgage | With Mortgage |
| Less than 2.0x | 56 (54.9%) | 167,841 (223,788.0%) |
| 2.0x to 2.9x | 12 (11.8%) | 22 (29.3%) |
| 3.0x to 3.9x | 7 (6.9%) | 21 (28.0%) |
| 4.0x or more | 27 (26.5%) | 11 (14.7%) |
| Total | 102 (100.0%) | 75 (100.0%) |
Real Estate Taxes by Mortgage Status in Minocqua
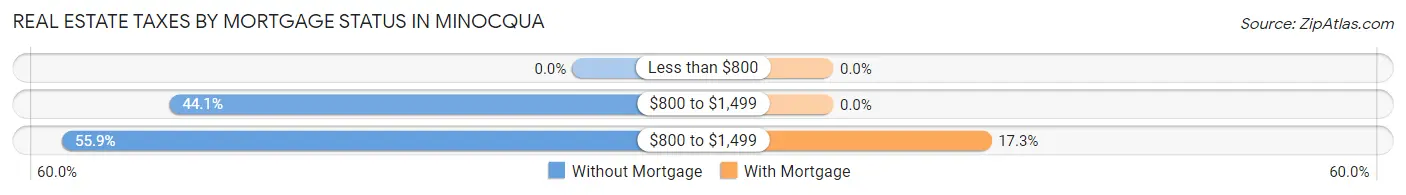
| Property Taxes | Without Mortgage | With Mortgage |
| Less than $800 | 0 (0.0%) | 0 (0.0%) |
| $800 to $1,499 | 45 (44.1%) | 0 (0.0%) |
| $800 to $1,499 | 57 (55.9%) | 13 (17.3%) |
| Total | 102 (100.0%) | 75 (100.0%) |
Health & Disability in Minocqua
Health Insurance Coverage by Age in Minocqua
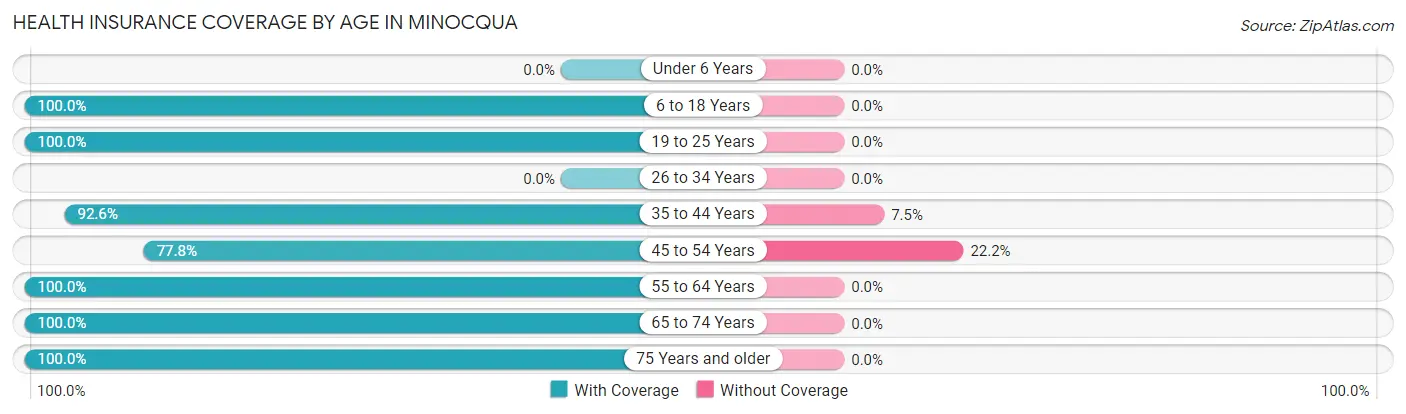
| Age Bracket | With Coverage | Without Coverage |
| Under 6 Years | 0 (0.0%) | 0 (0.0%) |
| 6 to 18 Years | 54 (100.0%) | 0 (0.0%) |
| 19 to 25 Years | 50 (100.0%) | 0 (0.0%) |
| 26 to 34 Years | 0 (0.0%) | 0 (0.0%) |
| 35 to 44 Years | 87 (92.5%) | 7 (7.4%) |
| 45 to 54 Years | 28 (77.8%) | 8 (22.2%) |
| 55 to 64 Years | 57 (100.0%) | 0 (0.0%) |
| 65 to 74 Years | 45 (100.0%) | 0 (0.0%) |
| 75 Years and older | 53 (100.0%) | 0 (0.0%) |
| Total | 374 (96.1%) | 15 (3.9%) |
Health Insurance Coverage by Citizenship Status in Minocqua
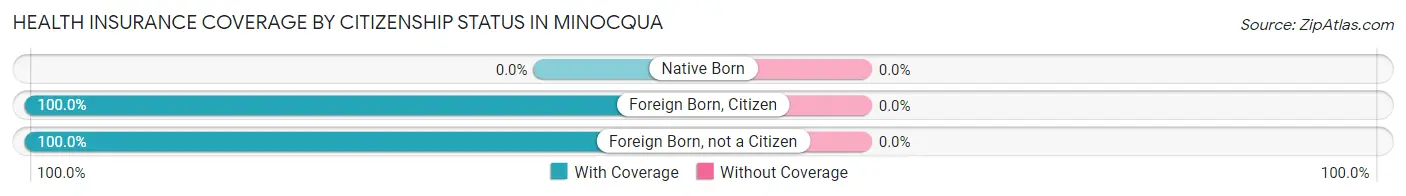
| Citizenship Status | With Coverage | Without Coverage |
| Native Born | 0 (0.0%) | 0 (0.0%) |
| Foreign Born, Citizen | 54 (100.0%) | 0 (0.0%) |
| Foreign Born, not a Citizen | 50 (100.0%) | 0 (0.0%) |
Health Insurance Coverage by Household Income in Minocqua
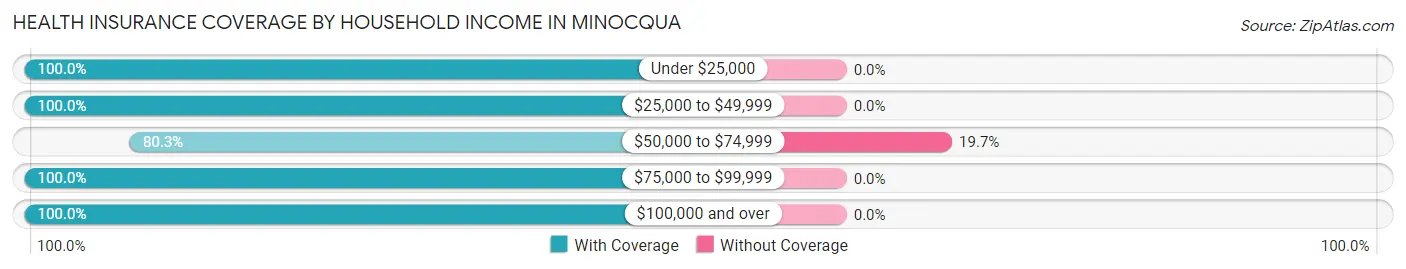
| Household Income | With Coverage | Without Coverage |
| Under $25,000 | 68 (100.0%) | 0 (0.0%) |
| $25,000 to $49,999 | 26 (100.0%) | 0 (0.0%) |
| $50,000 to $74,999 | 61 (80.3%) | 15 (19.7%) |
| $75,000 to $99,999 | 18 (100.0%) | 0 (0.0%) |
| $100,000 and over | 201 (100.0%) | 0 (0.0%) |
Public vs Private Health Insurance Coverage by Age in Minocqua
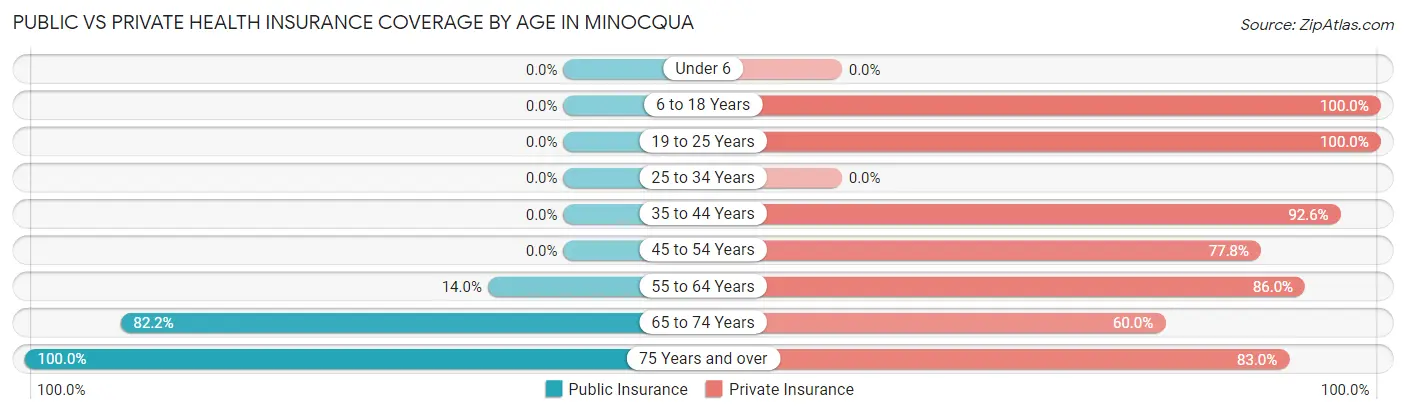
| Age Bracket | Public Insurance | Private Insurance |
| Under 6 | 0 (0.0%) | 0 (0.0%) |
| 6 to 18 Years | 0 (0.0%) | 54 (100.0%) |
| 19 to 25 Years | 0 (0.0%) | 50 (100.0%) |
| 25 to 34 Years | 0 (0.0%) | 0 (0.0%) |
| 35 to 44 Years | 0 (0.0%) | 87 (92.5%) |
| 45 to 54 Years | 0 (0.0%) | 28 (77.8%) |
| 55 to 64 Years | 8 (14.0%) | 49 (86.0%) |
| 65 to 74 Years | 37 (82.2%) | 27 (60.0%) |
| 75 Years and over | 53 (100.0%) | 44 (83.0%) |
| Total | 98 (25.2%) | 339 (87.2%) |
Disability Status by Sex by Age in Minocqua
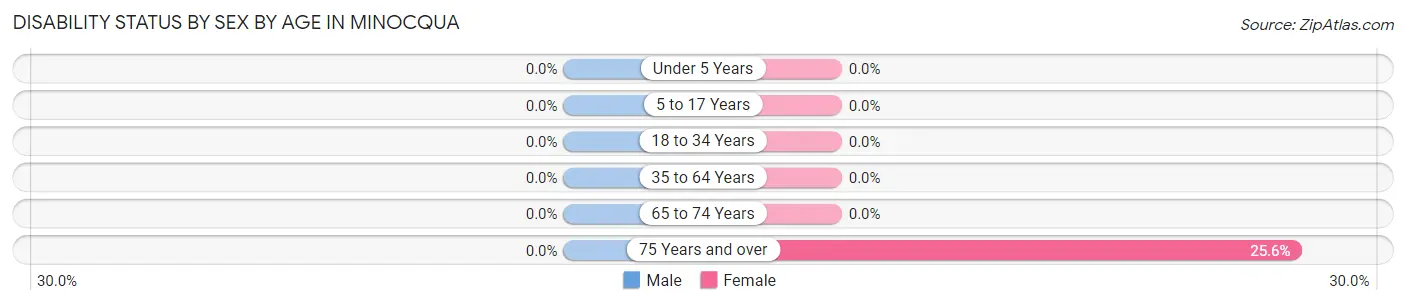
| Age Bracket | Male | Female |
| Under 5 Years | 0 (0.0%) | 0 (0.0%) |
| 5 to 17 Years | 0 (0.0%) | 0 (0.0%) |
| 18 to 34 Years | 0 (0.0%) | 0 (0.0%) |
| 35 to 64 Years | 0 (0.0%) | 0 (0.0%) |
| 65 to 74 Years | 0 (0.0%) | 0 (0.0%) |
| 75 Years and over | 0 (0.0%) | 10 (25.6%) |
Disability Class by Sex by Age in Minocqua
Disability Class: Hearing Difficulty
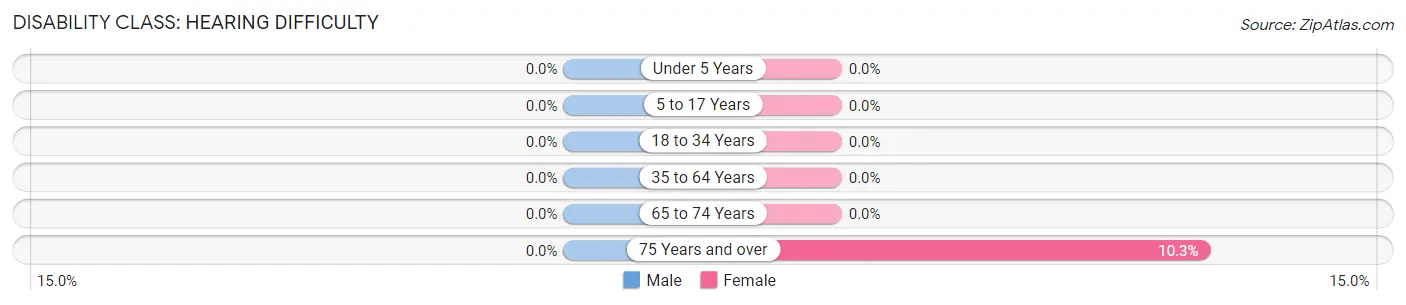
| Age Bracket | Male | Female |
| Under 5 Years | 0 (0.0%) | 0 (0.0%) |
| 5 to 17 Years | 0 (0.0%) | 0 (0.0%) |
| 18 to 34 Years | 0 (0.0%) | 0 (0.0%) |
| 35 to 64 Years | 0 (0.0%) | 0 (0.0%) |
| 65 to 74 Years | 0 (0.0%) | 0 (0.0%) |
| 75 Years and over | 0 (0.0%) | 4 (10.3%) |
Disability Class: Vision Difficulty
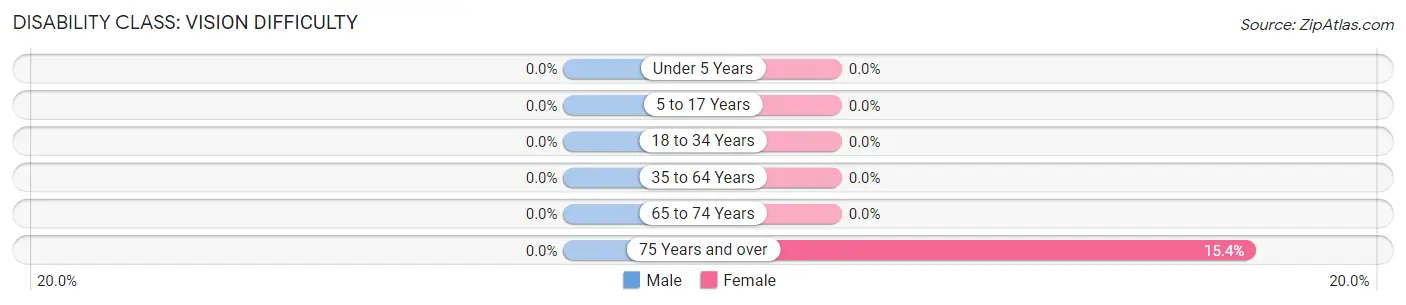
| Age Bracket | Male | Female |
| Under 5 Years | 0 (0.0%) | 0 (0.0%) |
| 5 to 17 Years | 0 (0.0%) | 0 (0.0%) |
| 18 to 34 Years | 0 (0.0%) | 0 (0.0%) |
| 35 to 64 Years | 0 (0.0%) | 0 (0.0%) |
| 65 to 74 Years | 0 (0.0%) | 0 (0.0%) |
| 75 Years and over | 0 (0.0%) | 6 (15.4%) |
Disability Class: Cognitive Difficulty
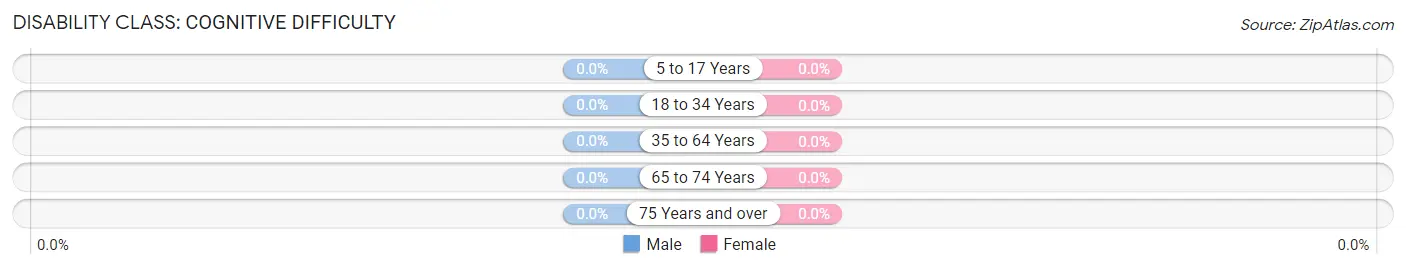
| Age Bracket | Male | Female |
| 5 to 17 Years | 0 (0.0%) | 0 (0.0%) |
| 18 to 34 Years | 0 (0.0%) | 0 (0.0%) |
| 35 to 64 Years | 0 (0.0%) | 0 (0.0%) |
| 65 to 74 Years | 0 (0.0%) | 0 (0.0%) |
| 75 Years and over | 0 (0.0%) | 0 (0.0%) |
Disability Class: Ambulatory Difficulty
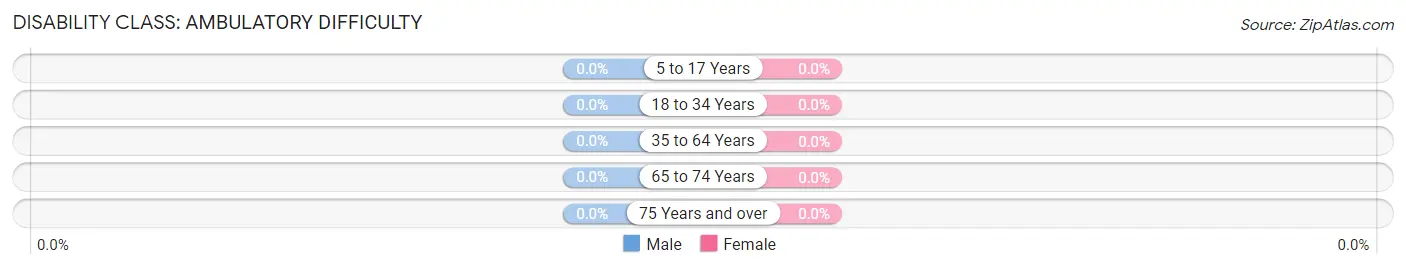
| Age Bracket | Male | Female |
| 5 to 17 Years | 0 (0.0%) | 0 (0.0%) |
| 18 to 34 Years | 0 (0.0%) | 0 (0.0%) |
| 35 to 64 Years | 0 (0.0%) | 0 (0.0%) |
| 65 to 74 Years | 0 (0.0%) | 0 (0.0%) |
| 75 Years and over | 0 (0.0%) | 0 (0.0%) |
Disability Class: Self-Care Difficulty
| Age Bracket | Male | Female |
| 5 to 17 Years | 0 (0.0%) | 0 (0.0%) |
| 18 to 34 Years | 0 (0.0%) | 0 (0.0%) |
| 35 to 64 Years | 0 (0.0%) | 0 (0.0%) |
| 65 to 74 Years | 0 (0.0%) | 0 (0.0%) |
| 75 Years and over | 0 (0.0%) | 0 (0.0%) |
Technology Access in Minocqua
Computing Device Access in Minocqua
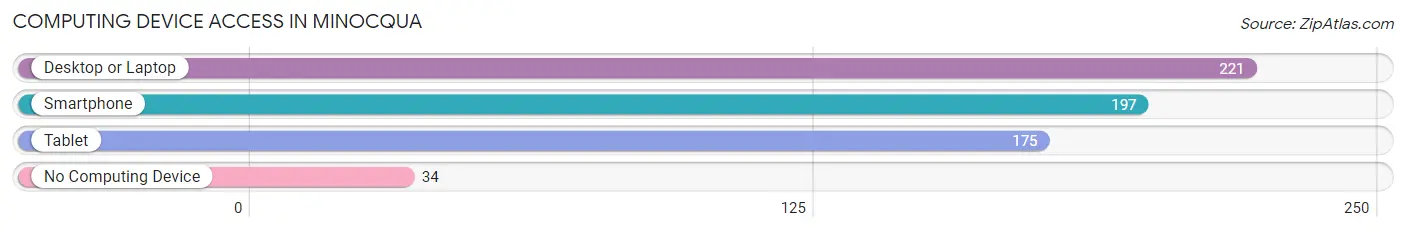
| Device Type | # Households | % Households |
| Desktop or Laptop | 221 | 85.3% |
| Smartphone | 197 | 76.1% |
| Tablet | 175 | 67.6% |
| No Computing Device | 34 | 13.1% |
| Total | 259 | 100.0% |
Internet Access in Minocqua
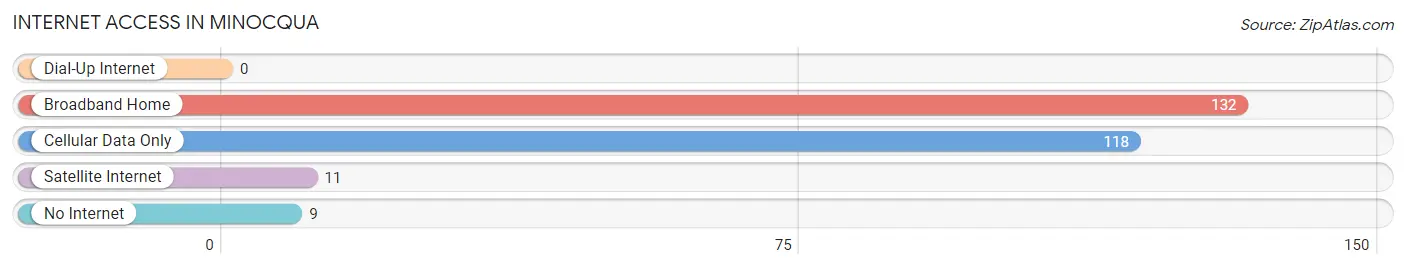
| Internet Type | # Households | % Households |
| Dial-Up Internet | 0 | 0.0% |
| Broadband Home | 132 | 51.0% |
| Cellular Data Only | 118 | 45.6% |
| Satellite Internet | 11 | 4.3% |
| No Internet | 9 | 3.5% |
| Total | 259 | 100.0% |
Minocqua Summary
Minocqua, Wisconsin is a small town located in Oneida County in the north-central part of the state. It is situated on the shores of Lake Minocqua, a large lake in the Wisconsin River chain. The town is known for its natural beauty, outdoor recreation, and small-town charm.
History
The area that is now Minocqua was first inhabited by the Ojibwe people, who called the area “Min-o-kwa”, meaning “little lake”. The first white settlers arrived in the area in the late 1800s, and the town was officially founded in 1887. The town was named after the lake, and the name was later changed to Minocqua.
The town quickly grew, and by the early 1900s, it had become a popular tourist destination. The town was known for its resorts, fishing, and outdoor recreation. In the 1920s, the town was connected to the rest of the state by a railroad line, which further increased its popularity.
Geography
Minocqua is located in the north-central part of Wisconsin, in Oneida County. It is situated on the shores of Lake Minocqua, a large lake in the Wisconsin River chain. The town is surrounded by forests and lakes, and is known for its natural beauty.
The town has a total area of 8.2 square miles, of which 7.7 square miles is land and 0.5 square miles is water. The town is located at an elevation of 1,072 feet above sea level.
Economy
The economy of Minocqua is largely based on tourism. The town is known for its resorts, fishing, and outdoor recreation. The town is also home to several small businesses, including restaurants, shops, and other services.
The town is also home to several manufacturing companies, including a paper mill and a furniture factory. The town is also home to a number of government offices, including the Oneida County Courthouse.
Demographics
As of the 2010 census, the population of Minocqua was 4,385. The racial makeup of the town was 97.2% White, 0.3% African American, 0.7% Native American, 0.4% Asian, 0.1% Pacific Islander, 0.3% from other races, and 1.0% from two or more races. Hispanic or Latino of any race were 1.2% of the population.
The median income for a household in the town was $41,944, and the median income for a family was $50,917. The per capita income for the town was $22,945. About 8.2% of families and 11.2% of the population were below the poverty line, including 15.2% of those under age 18 and 6.2% of those age 65 or over.
Common Questions
What is the Total Population of Minocqua?
Total Population of Minocqua is 439.
What is the Total Male Population of Minocqua?
Total Male Population of Minocqua is 144.
What is the Total Female Population of Minocqua?
Total Female Population of Minocqua is 295.
What is the Ratio of Males per 100 Females in Minocqua?
There are 48.81 Males per 100 Females in Minocqua.
What is the Ratio of Females per 100 Males in Minocqua?
There are 204.86 Females per 100 Males in Minocqua.
What is the Median Population Age in Minocqua?
Median Population Age in Minocqua is 51.6 Years.
What is the Average Family Size in Minocqua
Average Family Size in Minocqua is 2.6 People.
What is the Average Household Size in Minocqua
Average Household Size in Minocqua is 1.5 People.
What is Per Capita Income in Minocqua?
Per Capita income in Minocqua is $80,005.
What is the Median Family Income in Minocqua?
Median Family Income in Minocqua is $250,001.
What is Inequality or Gini Index in Minocqua?
Inequality or Gini Index in Minocqua is 0.53.
How Large is the Labor Force in Minocqua?
There are 225 People in the Labor Forcein in Minocqua.
What is the Percentage of People in the Labor Force in Minocqua?
56.3% of People are in the Labor Force in Minocqua.