Area Code 509
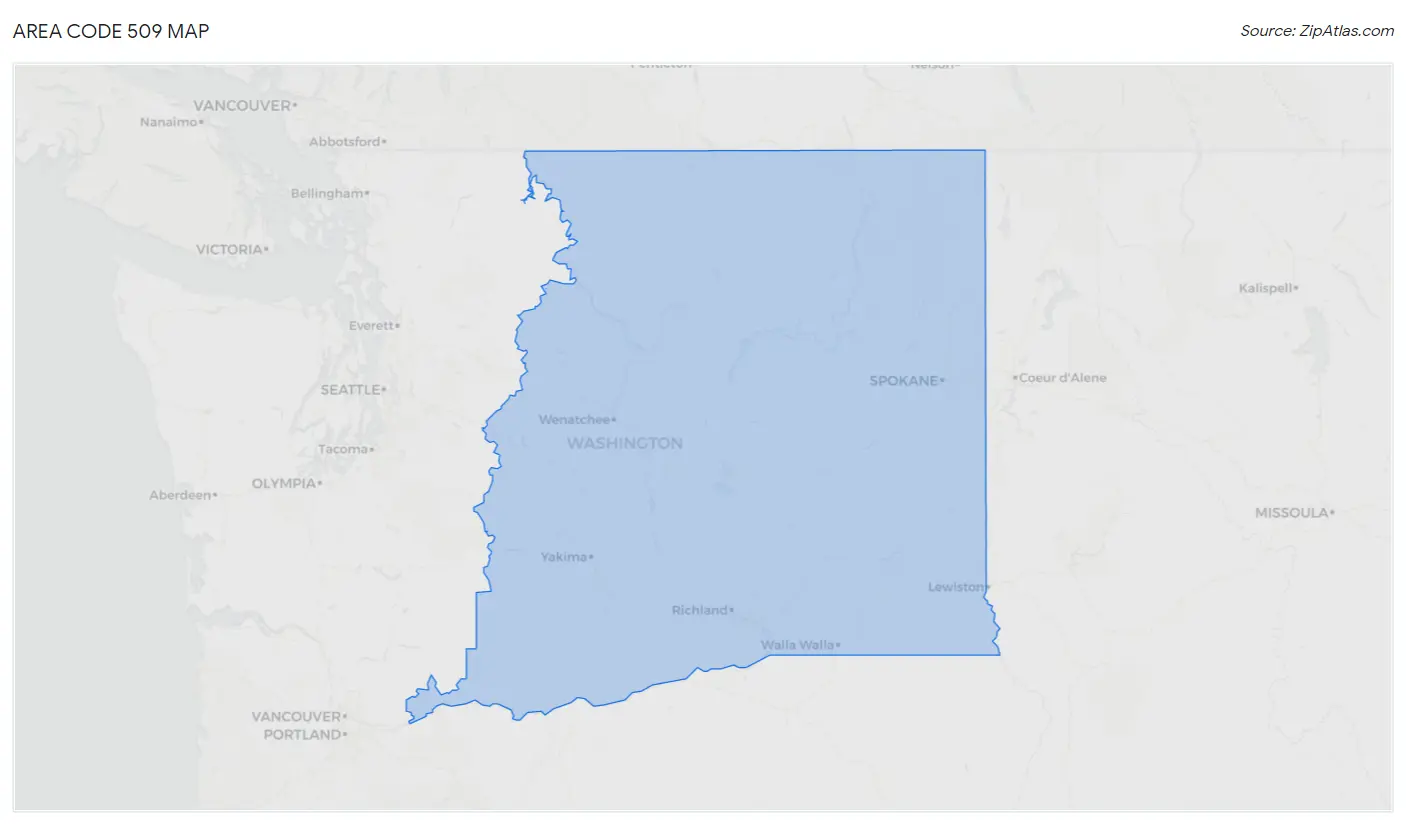
Area Code 509 Map
Area Code 509 Overview
1,658,251
TOTAL POPULATION
835,818
MALE POPULATION
822,433
FEMALE POPULATION
101.63
MALES / 100 FEMALES
98.40
FEMALES / 100 MALES
43.2
MEDIAN AGE
3.0
AVG FAMILY SIZE
2.5
AVG HOUSEHOLD SIZE
$34,238
PER CAPITA INCOME
$81,234
AVG FAMILY INCOME
$67,513
AVG HOUSEHOLD INCOME
29.2%
WAGE / INCOME GAP [ % ]
70.8¢/ $1
WAGE / INCOME GAP [ $ ]
$10,753
FAMILY INCOME DEFICIT
94.10
INEQUALITY / GINI INDEX
728,171
LABOR FORCE [ PEOPLE ]
56.0%
PERCENT IN LABOR FORCE
6.9%
UNEMPLOYMENT RATE
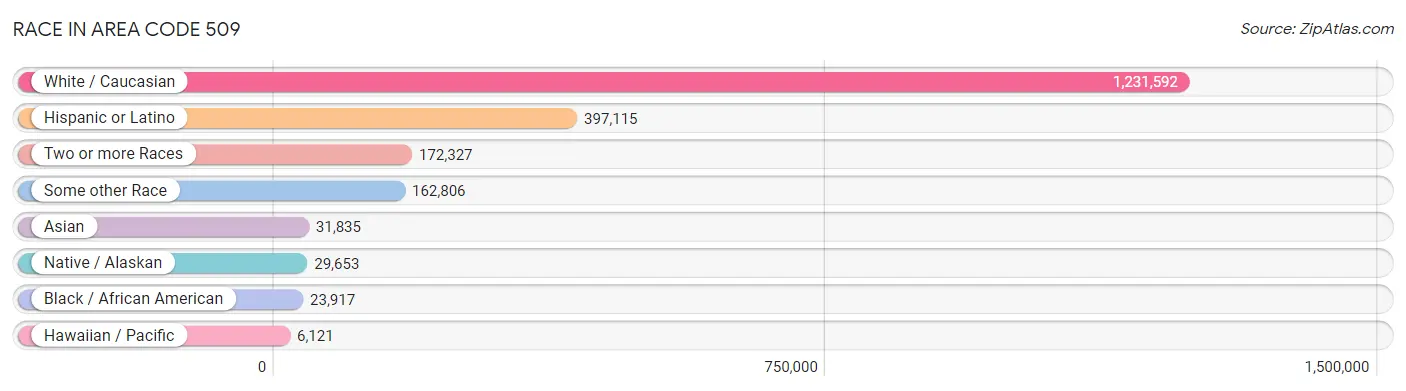
Race in Area Code 509
The most populous races in Area Code 509 are White / Caucasian (1,231,592 | 74.3%), Hispanic or Latino (397,115 | 23.9%), and Two or more Races (172,327 | 10.4%).
| Race | # Population | % Population |
| Asian | 31,835 | 1.9% |
| Black / African American | 23,917 | 1.4% |
| Hawaiian / Pacific | 6,121 | 0.4% |
| Hispanic or Latino | 397,115 | 23.9% |
| Native / Alaskan | 29,653 | 1.8% |
| White / Caucasian | 1,231,592 | 74.3% |
| Two or more Races | 172,327 | 10.4% |
| Some other Race | 162,806 | 9.8% |
| Total | 1,658,251 | 100.0% |
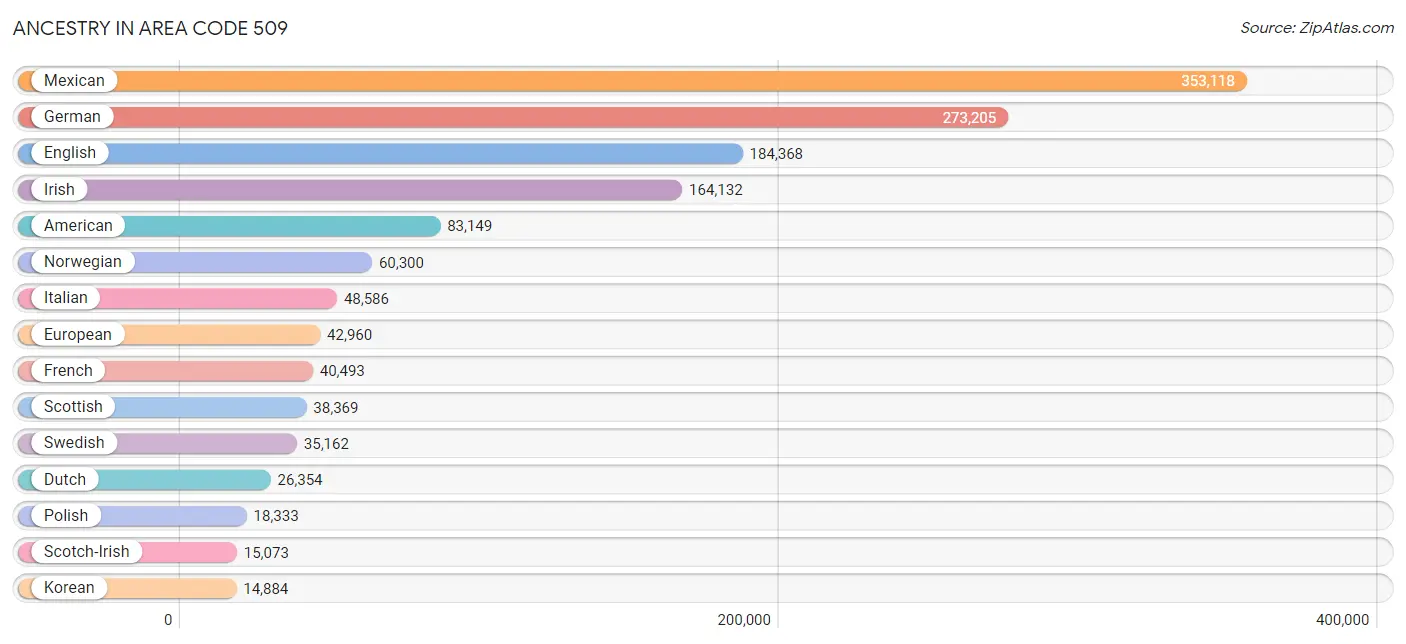
Ancestry in Area Code 509
The most populous ancestries reported in Area Code 509 are Mexican (353,118 | 21.3%), German (273,205 | 16.5%), English (184,368 | 11.1%), Irish (164,132 | 9.9%), and American (83,149 | 5.0%), together accounting for 63.8% of all Area Code 509 residents.
| Ancestry | # Population | % Population |
| Afghan | 316 | 0.0% |
| African | 3,663 | 0.2% |
| Alaska Native | 498 | 0.0% |
| Alaskan Athabascan | 226 | 0.0% |
| Albanian | 270 | 0.0% |
| Aleut | 388 | 0.0% |
| Alsatian | 13 | 0.0% |
| American | 83,149 | 5.0% |
| Apache | 942 | 0.1% |
| Arab | 5,691 | 0.3% |
| Arapaho | 15 | 0.0% |
| Argentinean | 349 | 0.0% |
| Armenian | 1,149 | 0.1% |
| Assyrian / Chaldean / Syriac | 33 | 0.0% |
| Australian | 836 | 0.1% |
| Austrian | 3,847 | 0.2% |
| Bahamian | 9 | 0.0% |
| Bangladeshi | 453 | 0.0% |
| Barbadian | 11 | 0.0% |
| Basque | 1,045 | 0.1% |
| Belgian | 1,082 | 0.1% |
| Belizean | 28 | 0.0% |
| Bhutanese | 9,050 | 0.5% |
| Blackfeet | 3,547 | 0.2% |
| Bolivian | 291 | 0.0% |
| Brazilian | 590 | 0.0% |
| British | 11,930 | 0.7% |
| British West Indian | 21 | 0.0% |
| Bulgarian | 404 | 0.0% |
| Burmese | 5,102 | 0.3% |
| Cajun | 59 | 0.0% |
| Cambodian | 287 | 0.0% |
| Canadian | 4,251 | 0.3% |
| Cape Verdean | 47 | 0.0% |
| Carpatho Rusyn | 27 | 0.0% |
| Celtic | 362 | 0.0% |
| Central American | 12,245 | 0.7% |
| Central American Indian | 1,408 | 0.1% |
| Cherokee | 5,447 | 0.3% |
| Cheyenne | 60 | 0.0% |
| Chickasaw | 440 | 0.0% |
| Chilean | 513 | 0.0% |
| Chinese | 93 | 0.0% |
| Chippewa | 1,911 | 0.1% |
| Choctaw | 995 | 0.1% |
| Colombian | 1,237 | 0.1% |
| Colville | 7,048 | 0.4% |
| Comanche | 89 | 0.0% |
| Costa Rican | 831 | 0.1% |
| Cree | 333 | 0.0% |
| Creek | 349 | 0.0% |
| Croatian | 2,126 | 0.1% |
| Crow | 203 | 0.0% |
| Cuban | 2,246 | 0.1% |
| Cypriot | 27 | 0.0% |
| Czech | 5,803 | 0.4% |
| Czechoslovakian | 917 | 0.1% |
| Danish | 12,625 | 0.8% |
| Delaware | 110 | 0.0% |
| Dominican | 826 | 0.1% |
| Dutch | 26,354 | 1.6% |
| Dutch West Indian | 50 | 0.0% |
| Eastern European | 2,755 | 0.2% |
| Ecuadorian | 622 | 0.0% |
| Egyptian | 402 | 0.0% |
| English | 184,368 | 11.1% |
| Estonian | 158 | 0.0% |
| Ethiopian | 810 | 0.1% |
| European | 42,960 | 2.6% |
| Fijian | 1,960 | 0.1% |
| Filipino | 443 | 0.0% |
| Finnish | 6,549 | 0.4% |
| French | 40,493 | 2.4% |
| French American Indian | 482 | 0.0% |
| French Canadian | 9,678 | 0.6% |
| German | 273,205 | 16.5% |
| German Russian | 229 | 0.0% |
| Ghanaian | 26 | 0.0% |
| Greek | 4,158 | 0.3% |
| Guamanian / Chamorro | 1,373 | 0.1% |
| Guatemalan | 3,521 | 0.2% |
| Guyanese | 136 | 0.0% |
| Haitian | 342 | 0.0% |
| Hmong | 4 | 0.0% |
| Honduran | 1,729 | 0.1% |
| Hopi | 99 | 0.0% |
| Hungarian | 3,760 | 0.2% |
| Icelander | 746 | 0.0% |
| Indian (Asian) | 8,926 | 0.5% |
| Indonesian | 1,628 | 0.1% |
| Inupiat | 542 | 0.0% |
| Iranian | 734 | 0.0% |
| Iraqi | 860 | 0.1% |
| Irish | 164,132 | 9.9% |
| Iroquois | 709 | 0.0% |
| Israeli | 116 | 0.0% |
| Italian | 48,586 | 2.9% |
| Jamaican | 1,450 | 0.1% |
| Japanese | 626 | 0.0% |
| Jordanian | 8 | 0.0% |
| Kenyan | 376 | 0.0% |
| Korean | 14,884 | 0.9% |
| Laotian | 428 | 0.0% |
| Latvian | 295 | 0.0% |
| Lebanese | 764 | 0.1% |
| Liberian | 321 | 0.0% |
| Lithuanian | 1,486 | 0.1% |
| Lumbee | 15 | 0.0% |
| Luxembourger | 190 | 0.0% |
| Macedonian | 112 | 0.0% |
| Malaysian | 322 | 0.0% |
| Maltese | 94 | 0.0% |
| Marshallese | 451 | 0.0% |
| Menominee | 19 | 0.0% |
| Mexican | 353,118 | 21.3% |
| Mexican American Indian | 4,607 | 0.3% |
| Mongolian | 130 | 0.0% |
| Moroccan | 106 | 0.0% |
| Native Hawaiian | 4,340 | 0.3% |
| Navajo | 814 | 0.1% |
| Nepalese | 53 | 0.0% |
| New Zealander | 86 | 0.0% |
| Nicaraguan | 542 | 0.0% |
| Nigerian | 540 | 0.0% |
| Northern European | 5,394 | 0.3% |
| Norwegian | 60,300 | 3.6% |
| Okinawan | 2 | 0.0% |
| Osage | 100 | 0.0% |
| Ottawa | 62 | 0.0% |
| Paiute | 367 | 0.0% |
| Pakistani | 1,781 | 0.1% |
| Palestinian | 261 | 0.0% |
| Panamanian | 329 | 0.0% |
| Pennsylvania German | 584 | 0.0% |
| Peruvian | 673 | 0.0% |
| Pima | 62 | 0.0% |
| Polish | 18,333 | 1.1% |
| Portuguese | 4,267 | 0.3% |
| Potawatomi | 507 | 0.0% |
| Pueblo | 227 | 0.0% |
| Puerto Rican | 4,927 | 0.3% |
| Puget Sound Salish | 1,644 | 0.1% |
| Romanian | 2,375 | 0.1% |
| Russian | 12,192 | 0.7% |
| Salvadoran | 5,261 | 0.3% |
| Samoan | 1,293 | 0.1% |
| Scandinavian | 13,691 | 0.8% |
| Scotch-Irish | 15,073 | 0.9% |
| Scottish | 38,369 | 2.3% |
| Seminole | 106 | 0.0% |
| Senegalese | 13 | 0.0% |
| Serbian | 366 | 0.0% |
| Shoshone | 189 | 0.0% |
| Sioux | 1,803 | 0.1% |
| Slavic | 438 | 0.0% |
| Slovak | 995 | 0.1% |
| Slovene | 529 | 0.0% |
| Somali | 88 | 0.0% |
| South African | 182 | 0.0% |
| South American | 4,143 | 0.3% |
| South American Indian | 201 | 0.0% |
| Spaniard | 5,126 | 0.3% |
| Spanish | 5,333 | 0.3% |
| Spanish American | 68 | 0.0% |
| Spanish American Indian | 98 | 0.0% |
| Sri Lankan | 6,488 | 0.4% |
| Subsaharan African | 8,028 | 0.5% |
| Sudanese | 556 | 0.0% |
| Swedish | 35,162 | 2.1% |
| Swiss | 6,499 | 0.4% |
| Syrian | 349 | 0.0% |
| Thai | 3,761 | 0.2% |
| Tlingit-Haida | 747 | 0.1% |
| Tohono O'Odham | 45 | 0.0% |
| Tongan | 161 | 0.0% |
| Trinidadian and Tobagonian | 118 | 0.0% |
| Tsimshian | 109 | 0.0% |
| Turkish | 572 | 0.0% |
| U.S. Virgin Islander | 58 | 0.0% |
| Ugandan | 447 | 0.0% |
| Ukrainian | 10,254 | 0.6% |
| Uruguayan | 77 | 0.0% |
| Ute | 148 | 0.0% |
| Venezuelan | 377 | 0.0% |
| Vietnamese | 163 | 0.0% |
| Welsh | 14,530 | 0.9% |
| West Indian | 43 | 0.0% |
| Yakama | 6,465 | 0.4% |
| Yaqui | 199 | 0.0% |
| Yugoslavian | 2,083 | 0.1% |
| Yuman | 32 | 0.0% |
| Yup'ik | 166 | 0.0% |
| Zimbabwean | 41 | 0.0% | View All 193 Rows |
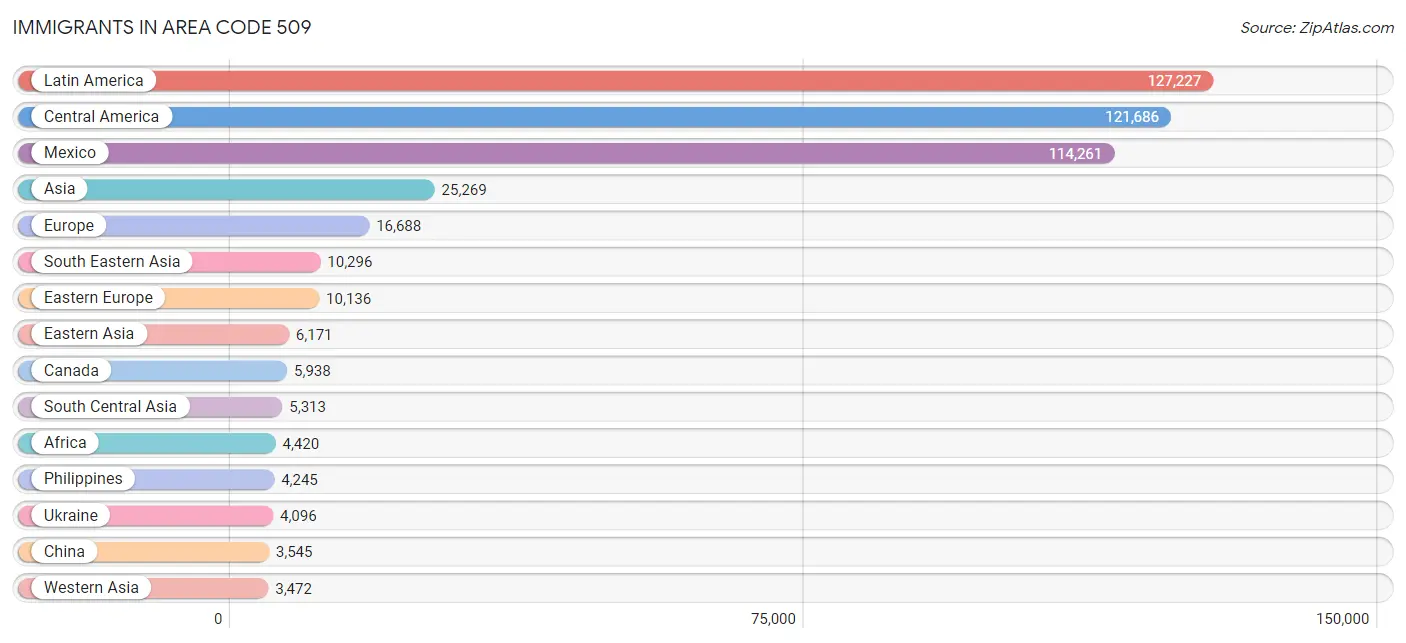
Immigrants in Area Code 509
The most numerous immigrant groups reported in Area Code 509 came from Latin America (127,227 | 7.7%), Central America (121,686 | 7.3%), Mexico (114,261 | 6.9%), Asia (25,269 | 1.5%), and Europe (16,688 | 1.0%), together accounting for 24.4% of all Area Code 509 residents.
| Immigration Origin | # Population | % Population |
| Afghanistan | 378 | 0.0% |
| Africa | 4,420 | 0.3% |
| Albania | 105 | 0.0% |
| Argentina | 281 | 0.0% |
| Armenia | 7 | 0.0% |
| Asia | 25,269 | 1.5% |
| Australia | 295 | 0.0% |
| Austria | 153 | 0.0% |
| Bahamas | 9 | 0.0% |
| Bangladesh | 166 | 0.0% |
| Barbados | 11 | 0.0% |
| Belarus | 714 | 0.0% |
| Belgium | 10 | 0.0% |
| Bolivia | 97 | 0.0% |
| Bosnia and Herzegovina | 637 | 0.0% |
| Brazil | 458 | 0.0% |
| Bulgaria | 194 | 0.0% |
| Cambodia | 213 | 0.0% |
| Cameroon | 71 | 0.0% |
| Canada | 5,938 | 0.4% |
| Caribbean | 2,663 | 0.2% |
| Central America | 121,686 | 7.3% |
| Chile | 104 | 0.0% |
| China | 3,545 | 0.2% |
| Colombia | 775 | 0.1% |
| Congo | 56 | 0.0% |
| Costa Rica | 234 | 0.0% |
| Croatia | 88 | 0.0% |
| Cuba | 1,009 | 0.1% |
| Czechoslovakia | 196 | 0.0% |
| Denmark | 117 | 0.0% |
| Dominican Republic | 275 | 0.0% |
| Eastern Africa | 1,990 | 0.1% |
| Eastern Asia | 6,171 | 0.4% |
| Eastern Europe | 10,136 | 0.6% |
| Ecuador | 264 | 0.0% |
| Egypt | 135 | 0.0% |
| El Salvador | 3,030 | 0.2% |
| England | 1,030 | 0.1% |
| Eritrea | 63 | 0.0% |
| Ethiopia | 703 | 0.0% |
| Europe | 16,688 | 1.0% |
| Fiji | 73 | 0.0% |
| France | 303 | 0.0% |
| Germany | 2,199 | 0.1% |
| Ghana | 138 | 0.0% |
| Greece | 23 | 0.0% |
| Guatemala | 2,482 | 0.2% |
| Guyana | 76 | 0.0% |
| Haiti | 233 | 0.0% |
| Honduras | 1,205 | 0.1% |
| Hong Kong | 100 | 0.0% |
| Hungary | 82 | 0.0% |
| India | 2,265 | 0.1% |
| Indonesia | 246 | 0.0% |
| Iran | 551 | 0.0% |
| Iraq | 1,371 | 0.1% |
| Ireland | 206 | 0.0% |
| Israel | 55 | 0.0% |
| Italy | 236 | 0.0% |
| Jamaica | 1,051 | 0.1% |
| Japan | 853 | 0.1% |
| Jordan | 71 | 0.0% |
| Kazakhstan | 566 | 0.0% |
| Kenya | 478 | 0.0% |
| Korea | 1,699 | 0.1% |
| Kuwait | 208 | 0.0% |
| Laos | 342 | 0.0% |
| Latin America | 127,227 | 7.7% |
| Latvia | 139 | 0.0% |
| Lebanon | 283 | 0.0% |
| Liberia | 302 | 0.0% |
| Lithuania | 41 | 0.0% |
| Malaysia | 146 | 0.0% |
| Mexico | 114,261 | 6.9% |
| Micronesia | 533 | 0.0% |
| Middle Africa | 259 | 0.0% |
| Moldova | 806 | 0.1% |
| Morocco | 43 | 0.0% |
| Nepal | 317 | 0.0% |
| Netherlands | 300 | 0.0% |
| Nicaragua | 314 | 0.0% |
| Nigeria | 133 | 0.0% |
| Northern Africa | 825 | 0.1% |
| Northern Europe | 2,704 | 0.2% |
| Norway | 112 | 0.0% |
| Oceania | 2,464 | 0.2% |
| Pakistan | 304 | 0.0% |
| Panama | 160 | 0.0% |
| Peru | 348 | 0.0% |
| Philippines | 4,245 | 0.3% |
| Poland | 306 | 0.0% |
| Portugal | 60 | 0.0% |
| Romania | 384 | 0.0% |
| Russia | 1,734 | 0.1% |
| Saudi Arabia | 646 | 0.0% |
| Scotland | 173 | 0.0% |
| Senegal | 8 | 0.0% |
| Singapore | 11 | 0.0% |
| Somalia | 98 | 0.0% |
| South Africa | 182 | 0.0% |
| South America | 2,878 | 0.2% |
| South Central Asia | 5,313 | 0.3% |
| South Eastern Asia | 10,296 | 0.6% |
| Southern Europe | 694 | 0.0% |
| Spain | 367 | 0.0% |
| Sri Lanka | 49 | 0.0% |
| Sudan | 555 | 0.0% |
| Sweden | 153 | 0.0% |
| Switzerland | 168 | 0.0% |
| Syria | 380 | 0.0% |
| Taiwan | 444 | 0.0% |
| Thailand | 1,059 | 0.1% |
| Trinidad and Tobago | 60 | 0.0% |
| Turkey | 223 | 0.0% |
| Uganda | 303 | 0.0% |
| Ukraine | 4,096 | 0.3% |
| Uruguay | 52 | 0.0% |
| Uzbekistan | 203 | 0.0% |
| Venezuela | 414 | 0.0% |
| Vietnam | 3,247 | 0.2% |
| Western Africa | 901 | 0.1% |
| Western Asia | 3,472 | 0.2% |
| Western Europe | 3,133 | 0.2% |
| Zaire | 74 | 0.0% |
| Zimbabwe | 44 | 0.0% | View All 126 Rows |
Sex and Age in Area Code 509
Sex and Age in Area Code 509
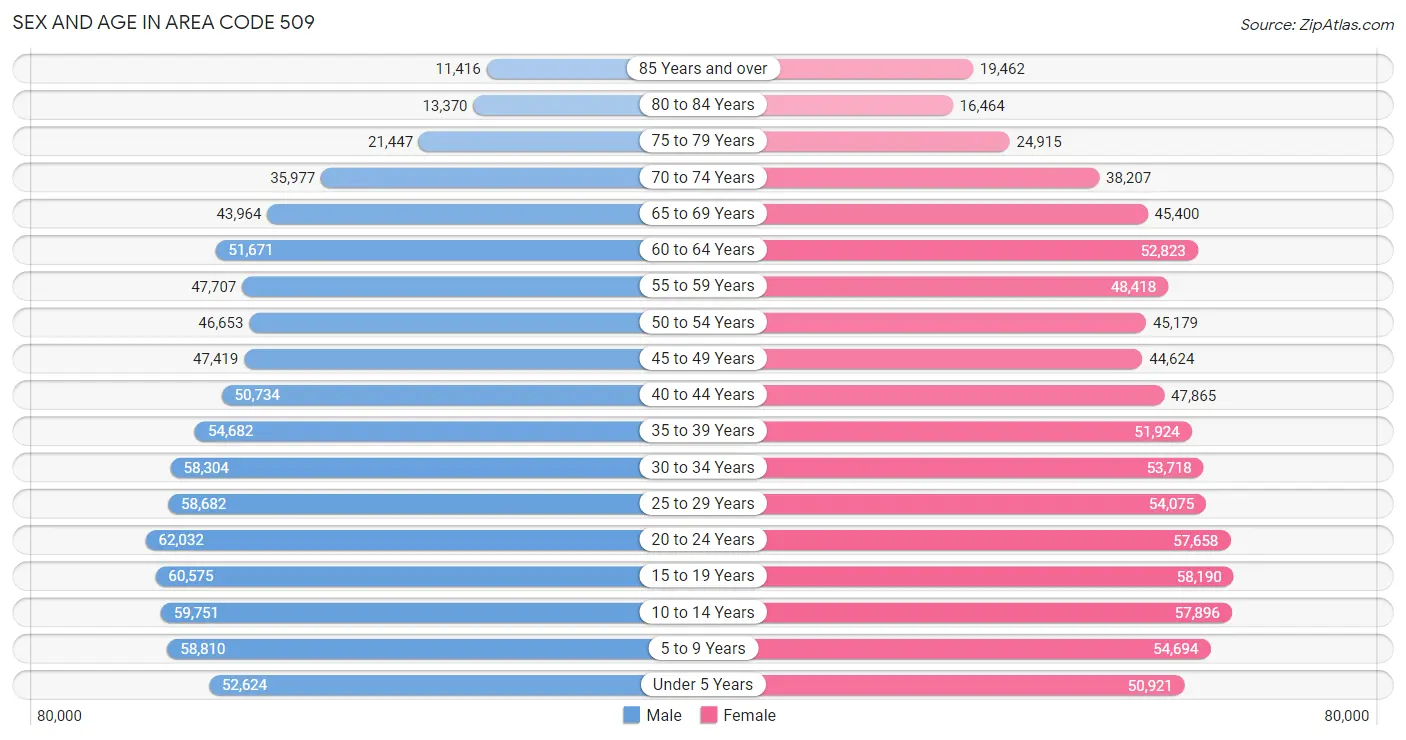
The most populous age groups in Area Code 509 are 20 to 24 Years (62,032 | 7.4%) for men and 15 to 19 Years (58,190 | 7.1%) for women.
| Age Bracket | Male | Female |
| Under 5 Years | 52,624 (6.3%) | 50,921 (6.2%) |
| 5 to 9 Years | 58,810 (7.0%) | 54,694 (6.7%) |
| 10 to 14 Years | 59,751 (7.1%) | 57,896 (7.0%) |
| 15 to 19 Years | 60,575 (7.2%) | 58,190 (7.1%) |
| 20 to 24 Years | 62,032 (7.4%) | 57,658 (7.0%) |
| 25 to 29 Years | 58,682 (7.0%) | 54,075 (6.6%) |
| 30 to 34 Years | 58,304 (7.0%) | 53,718 (6.5%) |
| 35 to 39 Years | 54,682 (6.5%) | 51,924 (6.3%) |
| 40 to 44 Years | 50,734 (6.1%) | 47,865 (5.8%) |
| 45 to 49 Years | 47,419 (5.7%) | 44,624 (5.4%) |
| 50 to 54 Years | 46,653 (5.6%) | 45,179 (5.5%) |
| 55 to 59 Years | 47,707 (5.7%) | 48,418 (5.9%) |
| 60 to 64 Years | 51,671 (6.2%) | 52,823 (6.4%) |
| 65 to 69 Years | 43,964 (5.3%) | 45,400 (5.5%) |
| 70 to 74 Years | 35,977 (4.3%) | 38,207 (4.6%) |
| 75 to 79 Years | 21,447 (2.6%) | 24,915 (3.0%) |
| 80 to 84 Years | 13,370 (1.6%) | 16,464 (2.0%) |
| 85 Years and over | 11,416 (1.4%) | 19,462 (2.4%) |
| Total | 835,818 (100.0%) | 822,433 (100.0%) |
Families and Households in Area Code 509
Median Family Size in Area Code 509
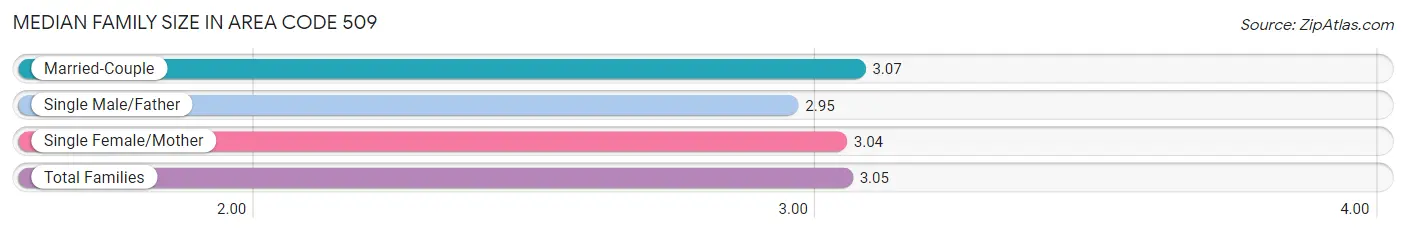
The median family size in Area Code 509 is 3.05 persons per family, with married-couple families (301,283 | 74.3%) accounting for the largest median family size of 3.07012 persons per family. On the other hand, single male/father families (33,636 | 8.3%) represent the smallest median family size with 2.95 persons per family.
| Family Type | # Families | Family Size |
| Married-Couple | 301,283 (74.3%) | 3.07 |
| Single Male/Father | 33,636 (8.3%) | 2.95 |
| Single Female/Mother | 70,849 (17.5%) | 3.04 |
| Total Families | 405,768 (100.0%) | 3.05 |
Median Household Size in Area Code 509
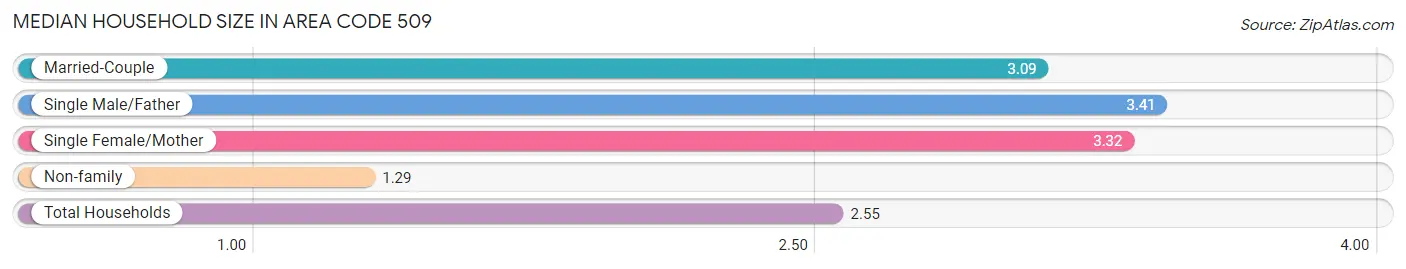
The median household size in Area Code 509 is 2.55 persons per household, with single male/father households (33,636 | 5.5%) accounting for the largest median household size of 3.4127 persons per household. non-family households (210,176 | 34.1%) represent the smallest median household size with 1.29 persons per household.
| Household Type | # Households | Household Size |
| Married-Couple | 301,283 (48.9%) | 3.09 |
| Single Male/Father | 33,636 (5.5%) | 3.41 |
| Single Female/Mother | 70,849 (11.5%) | 3.32 |
| Non-family | 210,176 (34.1%) | 1.29 |
| Total Households | 615,944 (100.0%) | 2.55 |
Household Size by Marriage Status in Area Code 509
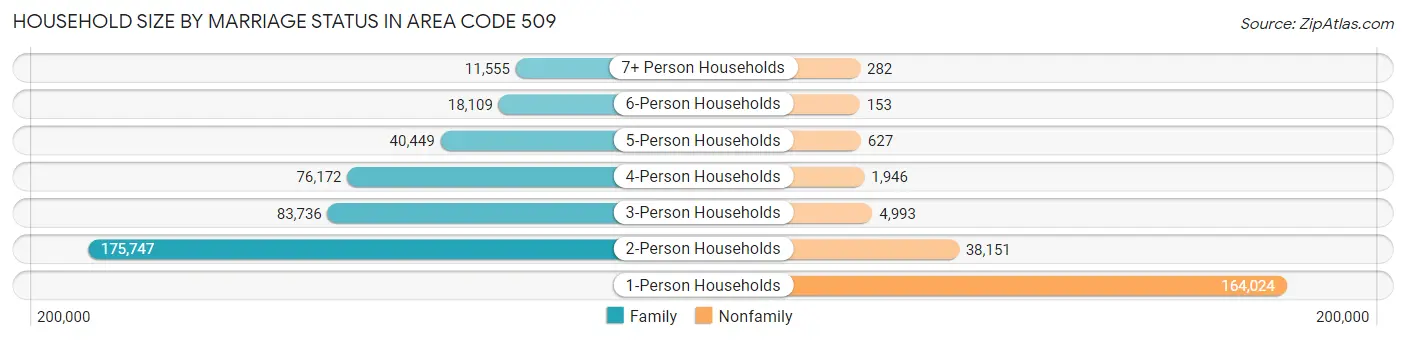
Out of a total of 615,944 households in Area Code 509, 405,768 (65.9%) are family households, while 210,176 (34.1%) are nonfamily households. The most numerous type of family households are 2-person households, comprising 175,747, and the most common type of nonfamily households are 1-person households, comprising 164,024.
| Household Size | Family Households | Nonfamily Households |
| 1-Person Households | - | 164,024 (26.6%) |
| 2-Person Households | 175,747 (28.5%) | 38,151 (6.2%) |
| 3-Person Households | 83,736 (13.6%) | 4,993 (0.8%) |
| 4-Person Households | 76,172 (12.4%) | 1,946 (0.3%) |
| 5-Person Households | 40,449 (6.6%) | 627 (0.1%) |
| 6-Person Households | 18,109 (2.9%) | 153 (0.0%) |
| 7+ Person Households | 11,555 (1.9%) | 282 (0.1%) |
| Total | 405,768 (65.9%) | 210,176 (34.1%) |
Female Fertility in Area Code 509
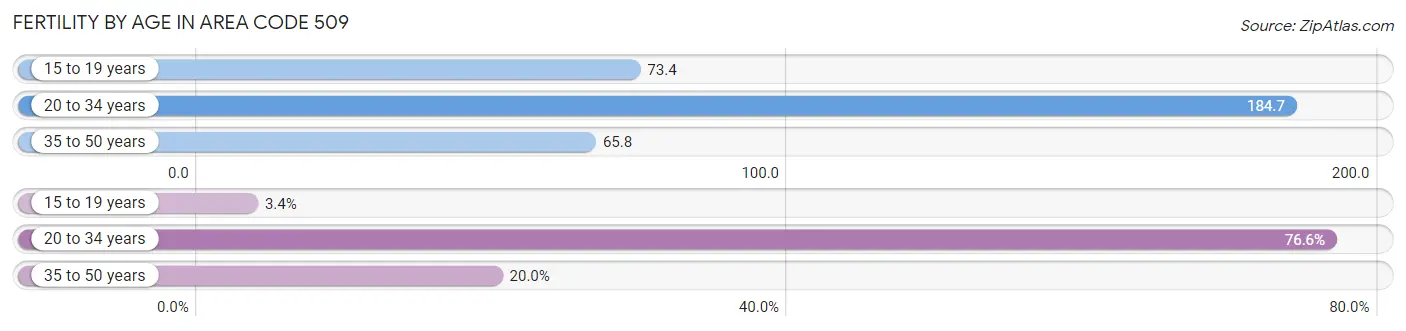
Fertility by Age in Area Code 509
Average fertility rate in Area Code 509 is 88.2 births per 1,000 women. Women in the age bracket of 20 to 34 years have the highest fertility rate with 184.7 births per 1,000 women. Women in the age bracket of 20 to 34 years acount for 76.6% of all women with births.
| Age Bracket | Women with Births | Births / 1,000 Women |
| 15 to 19 years | 724 (3.4%) | 73.4 |
| 20 to 34 years | 16,341 (76.6%) | 184.7 |
| 35 to 50 years | 4,264 (20.0%) | 65.8 |
| Total | 21,329 (100.0%) | 88.2 |
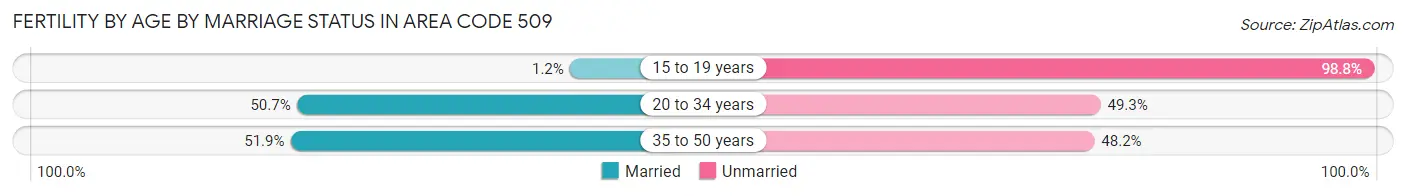
Fertility by Age by Marriage Status in Area Code 509
53.4% of women with births (21,329) in Area Code 509 are married. The highest percentage of unmarried women with births falls into 15 to 19 years age bracket with 98.8% of them unmarried at the time of birth, while the lowest percentage of unmarried women with births belong to 35 to 50 years age bracket with 48.2% of them unmarried.
| Age Bracket | Married | Unmarried |
| 15 to 19 years | 9 (1.2%) | 715 (98.8%) |
| 20 to 34 years | 8,290 (50.7%) | 8,051 (49.3%) |
| 35 to 50 years | 2,211 (51.8%) | 2,053 (48.1%) |
| Total | 11,388 (53.4%) | 9,941 (46.6%) |
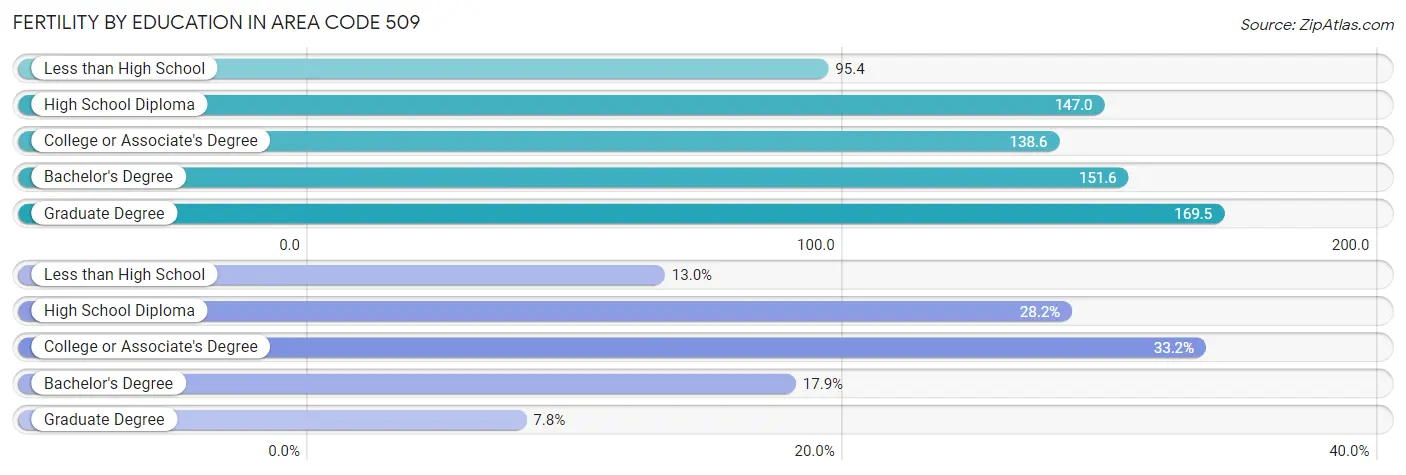
Fertility by Education in Area Code 509
Average fertility rate in Area Code 509 is 88.2 births per 1,000 women. Women with the education attainment of graduate degree have the highest fertility rate of 169.5 births per 1,000 women, while women with the education attainment of less than high school have the lowest fertility at 95.4 births per 1,000 women. Women with the education attainment of college or associate's degree represent 33.2% of all women with births.
| Educational Attainment | Women with Births | Births / 1,000 Women |
| Less than High School | 2,762 (13.0%) | 95.4 |
| High School Diploma | 6,015 (28.2%) | 147.0 |
| College or Associate's Degree | 7,086 (33.2%) | 138.6 |
| Bachelor's Degree | 3,810 (17.9%) | 151.6 |
| Graduate Degree | 1,656 (7.8%) | 169.5 |
| Total | 21,329 (100.0%) | 88.2 |
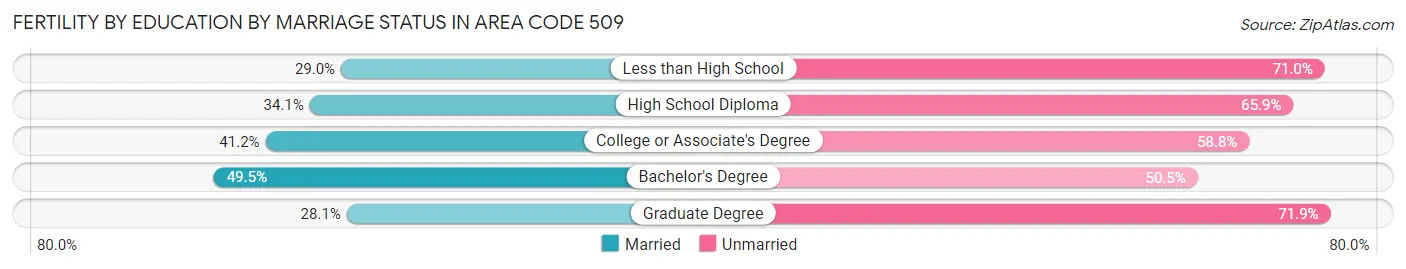
Fertility by Education by Marriage Status in Area Code 509
46.6% of women with births in Area Code 509 are unmarried. Women with the educational attainment of bachelor's degree are most likely to be married with 49.5% of them married at childbirth, while women with the educational attainment of graduate degree are least likely to be married with 71.9% of them unmarried at childbirth.
| Educational Attainment | Married | Unmarried |
| Less than High School | 801 (29.0%) | 1,961 (71.0%) |
| High School Diploma | 2,049 (34.1%) | 3,966 (65.9%) |
| College or Associate's Degree | 2,918 (41.2%) | 4,168 (58.8%) |
| Bachelor's Degree | 1,886 (49.5%) | 1,924 (50.5%) |
| Graduate Degree | 465 (28.1%) | 1,191 (71.9%) |
| Total | 11,388 (53.4%) | 9,941 (46.6%) |
Income in Area Code 509
Income Overview in Area Code 509
Per Capita Income in Area Code 509 is $34,238, while median incomes of families and households are $81,234 and $67,513 respectively.
| Characteristic | Number | Measure |
| Per Capita Income | 1,658,251 | $34,238 |
| Median Family Income | 405,768 | $81,234 |
| Mean Family Income | 405,768 | $21,855,133 |
| Median Household Income | 615,944 | $67,513 |
| Mean Household Income | 615,944 | $19,667,965 |
| Income Deficit | 405,768 | $10,753 |
| Wage / Income Gap (%) | 1,658,251 | 29.25% |
| Wage / Income Gap ($) | 1,658,251 | 70.75¢ per $1 |
| Gini / Inequality Index | 1,658,251 | 94.10 |
Earnings by Sex in Area Code 509
Average Earnings in Area Code 509 are $39,377, $47,712 for men and $32,859 for women, a difference of 31.1%.
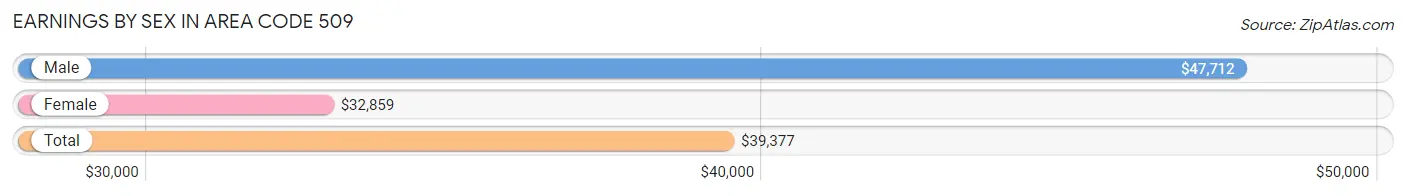
| Sex | Number | Average Earnings |
| Male | 455,371 (53.9%) | $47,712 |
| Female | 388,773 (46.1%) | $32,859 |
| Total | 844,144 (100.0%) | $39,377 |
Earnings by Sex by Income Bracket in Area Code 509
The most common earnings brackets in Area Code 509 are $100,000+ for men (70,057 | 15.4%) and $25,000 to $29,999 for women (30,704 | 7.9%).
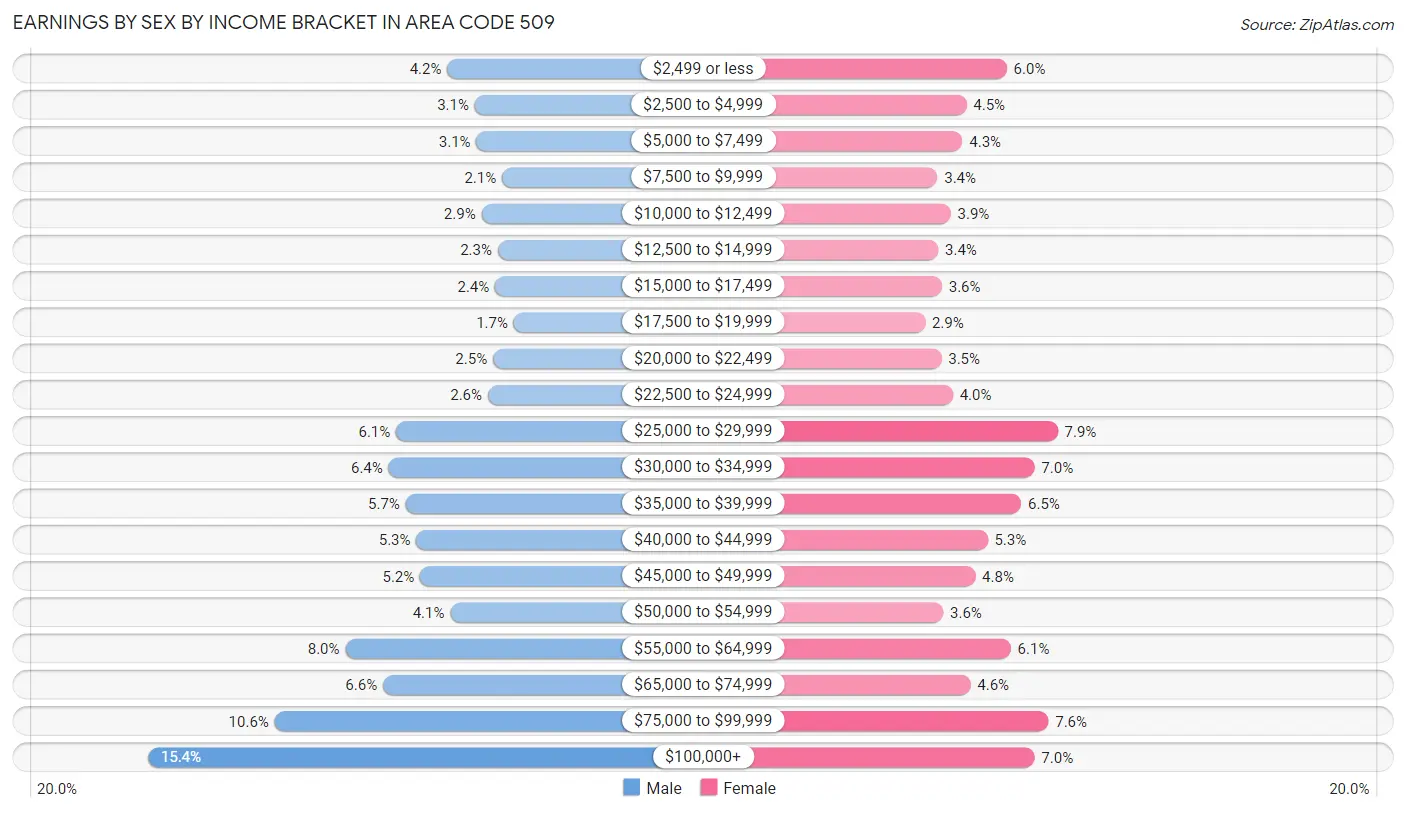
| Income | Male | Female |
| $2,499 or less | 18,929 (4.2%) | 23,300 (6.0%) |
| $2,500 to $4,999 | 14,250 (3.1%) | 17,415 (4.5%) |
| $5,000 to $7,499 | 13,965 (3.1%) | 16,841 (4.3%) |
| $7,500 to $9,999 | 9,597 (2.1%) | 13,188 (3.4%) |
| $10,000 to $12,499 | 13,102 (2.9%) | 15,136 (3.9%) |
| $12,500 to $14,999 | 10,353 (2.3%) | 13,299 (3.4%) |
| $15,000 to $17,499 | 10,793 (2.4%) | 13,857 (3.6%) |
| $17,500 to $19,999 | 7,599 (1.7%) | 11,402 (2.9%) |
| $20,000 to $22,499 | 11,168 (2.5%) | 13,754 (3.5%) |
| $22,500 to $24,999 | 12,000 (2.6%) | 15,437 (4.0%) |
| $25,000 to $29,999 | 27,702 (6.1%) | 30,704 (7.9%) |
| $30,000 to $34,999 | 28,969 (6.4%) | 27,316 (7.0%) |
| $35,000 to $39,999 | 26,037 (5.7%) | 25,387 (6.5%) |
| $40,000 to $44,999 | 24,204 (5.3%) | 20,484 (5.3%) |
| $45,000 to $49,999 | 23,586 (5.2%) | 18,685 (4.8%) |
| $50,000 to $54,999 | 18,428 (4.1%) | 14,035 (3.6%) |
| $55,000 to $64,999 | 36,340 (8.0%) | 23,873 (6.1%) |
| $65,000 to $74,999 | 29,908 (6.6%) | 18,002 (4.6%) |
| $75,000 to $99,999 | 48,384 (10.6%) | 29,342 (7.5%) |
| $100,000+ | 70,057 (15.4%) | 27,316 (7.0%) |
| Total | 455,371 (100.0%) | 388,773 (100.0%) |
Earnings by Sex by Educational Attainment in Area Code 509
Average earnings in Area Code 509 are $10,878,795 for men and $7,493,647 for women, a difference of 31.1%. Men with an educational attainment of graduate degree enjoy the highest average annual earnings of $10,244,146, while those with less than high school education earn the least with $4,668,155. Women with an educational attainment of graduate degree earn the most with the average annual earnings of $7,840,417, while those with less than high school education have the smallest earnings of $1,764,276.
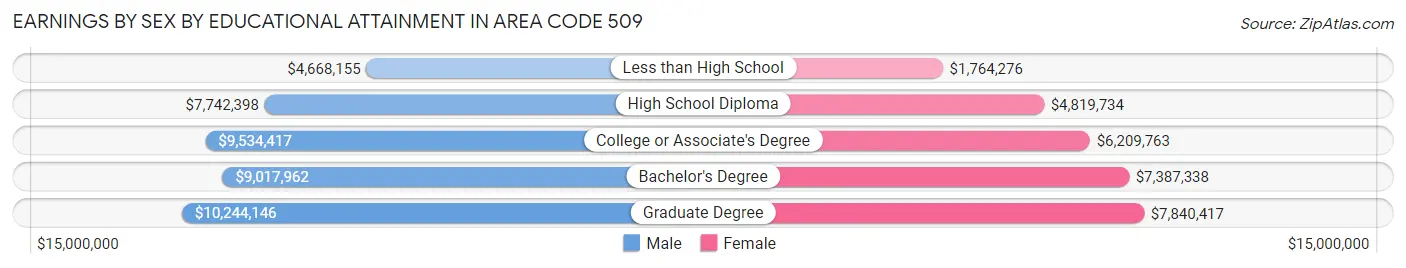
| Educational Attainment | Male Income | Female Income |
| Less than High School | $4,668,155 | $1,764,276 |
| High School Diploma | $7,742,398 | $4,819,734 |
| College or Associate's Degree | $9,534,417 | $6,209,763 |
| Bachelor's Degree | $9,017,962 | $7,387,338 |
| Graduate Degree | $10,244,146 | $7,840,417 |
| Total | $10,878,795 | $7,493,647 |
Family Income in Area Code 509
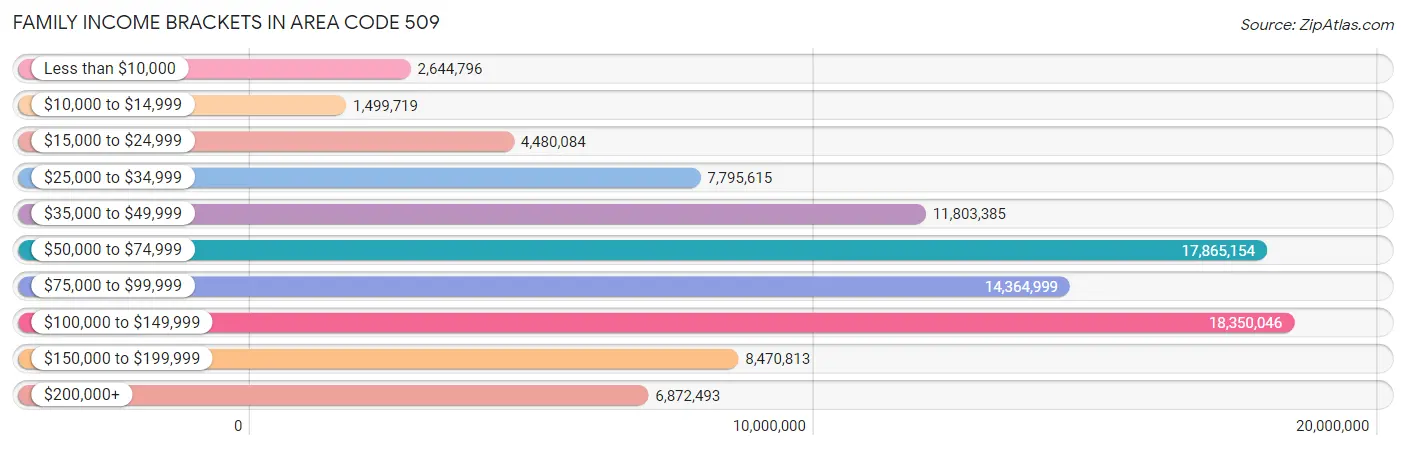
Family Income Brackets in Area Code 509
According to the Area Code 509 family income data, there are 18,350,046 families falling into the $100,000 to $149,999 income range, which is the most common income bracket and makes up 4,522.3% of all families. Conversely, the $10,000 to $14,999 income bracket is the least frequent group with only 1,499,719 families (369.6%) belonging to this category.
| Income Bracket | # Families | % Families |
| Less than $10,000 | 2,644,796 | 651.8% |
| $10,000 to $14,999 | 1,499,719 | 369.6% |
| $15,000 to $24,999 | 4,480,084 | 1,104.1% |
| $25,000 to $34,999 | 7,795,615 | 1,921.2% |
| $35,000 to $49,999 | 11,803,385 | 2,908.9% |
| $50,000 to $74,999 | 17,865,154 | 4,402.8% |
| $75,000 to $99,999 | 14,364,999 | 3,540.2% |
| $100,000 to $149,999 | 18,350,046 | 4,522.3% |
| $150,000 to $199,999 | 8,470,813 | 2,087.6% |
| $200,000+ | 6,872,493 | 1,693.7% |
Family Income by Famaliy Size in Area Code 509
7+ person families (9,466 | 2.3%) account for the highest median family income in Area Code 509 with $118,338 per family, while 2-person families (191,062 | 47.1%) have the highest median income of $36,936 per family member.
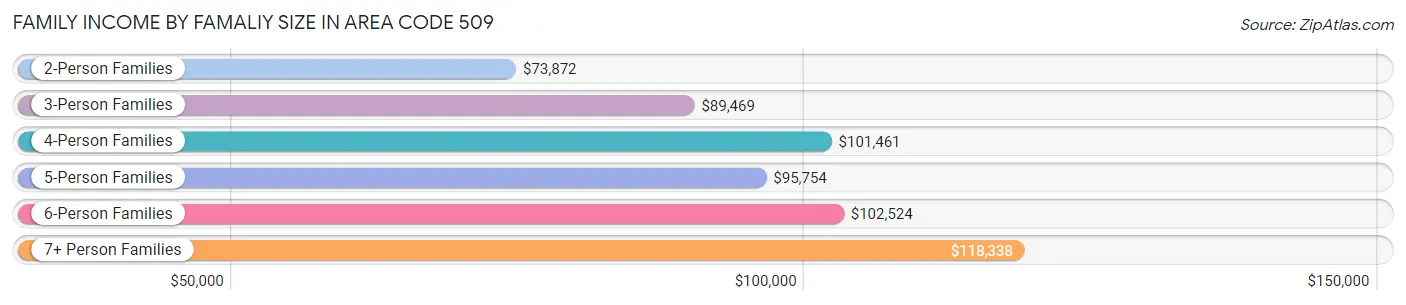
| Income Bracket | # Families | Median Income |
| 2-Person Families | 191,062 (47.1%) | $73,872 |
| 3-Person Families | 82,415 (20.3%) | $89,469 |
| 4-Person Families | 70,420 (17.3%) | $101,461 |
| 5-Person Families | 36,562 (9.0%) | $95,754 |
| 6-Person Families | 15,843 (3.9%) | $102,524 |
| 7+ Person Families | 9,466 (2.3%) | $118,338 |
| Total | 405,768 (100.0%) | $81,234 |
Family Income by Number of Earners in Area Code 509
The median family income in Area Code 509 is $81,234, with families comprising 3+ earners (45,815) having the highest median family income of $133,117, while families with no earners (65,973) have the lowest median family income of $50,443, accounting for 11.3% and 16.3% of families, respectively.
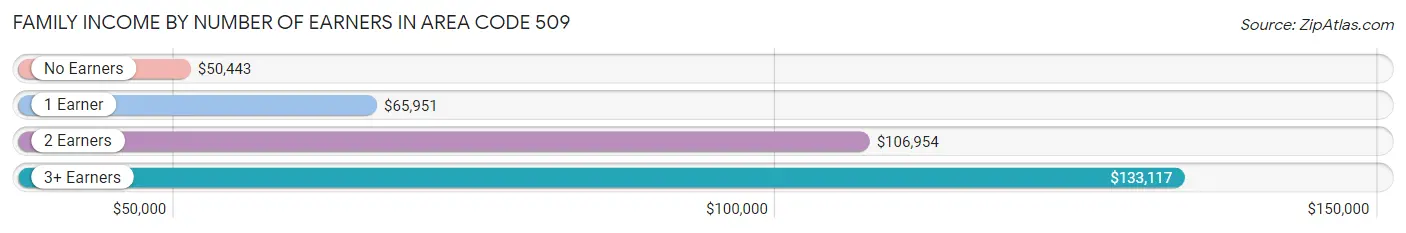
| Number of Earners | # Families | Median Income |
| No Earners | 65,973 (16.3%) | $50,443 |
| 1 Earner | 131,319 (32.4%) | $65,951 |
| 2 Earners | 162,661 (40.1%) | $106,954 |
| 3+ Earners | 45,815 (11.3%) | $133,117 |
| Total | 405,768 (100.0%) | $81,234 |
Household Income in Area Code 509
Household Income Brackets in Area Code 509
With 25,889,974 households falling in the category, the $50,000 to $74,999 income range is the most frequent in Area Code 509, accounting for 4,203.3% of all households. In contrast, only 5,891,504 households (956.5%) fall into the $10,000 to $14,999 income bracket, making it the least populous group.
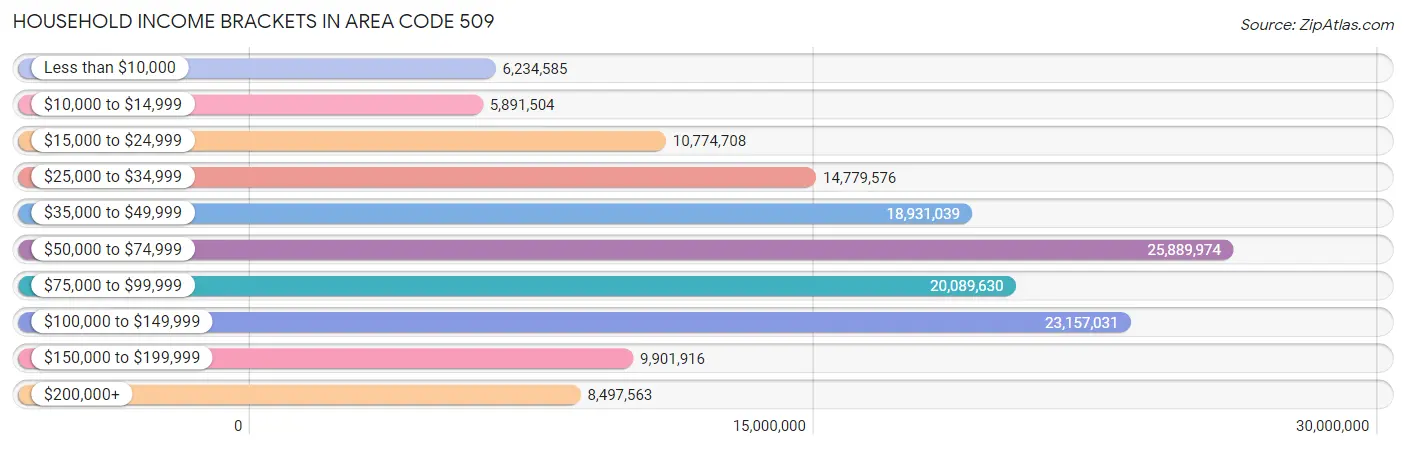
| Income Bracket | # Households | % Households |
| Less than $10,000 | 6,234,585 | 1,012.2% |
| $10,000 to $14,999 | 5,891,504 | 956.5% |
| $15,000 to $24,999 | 10,774,708 | 1,749.3% |
| $25,000 to $34,999 | 14,779,576 | 2,399.5% |
| $35,000 to $49,999 | 18,931,039 | 3,073.5% |
| $50,000 to $74,999 | 25,889,974 | 4,203.3% |
| $75,000 to $99,999 | 20,089,630 | 3,261.6% |
| $100,000 to $149,999 | 23,157,031 | 3,759.6% |
| $150,000 to $199,999 | 9,901,916 | 1,607.6% |
| $200,000+ | 8,497,563 | 1,379.6% |
Household Income by Householder Age in Area Code 509
The median household income in Area Code 509 is $67,513, with the highest median household income of $86,188 found in the 45 to 64 years age bracket for the primary householder. A total of 212,941 households (34.6%) fall into this category. Meanwhile, the 65+ years age bracket for the primary householder has the lowest median household income of $51,820, with 168,794 households (27.4%) in this group.
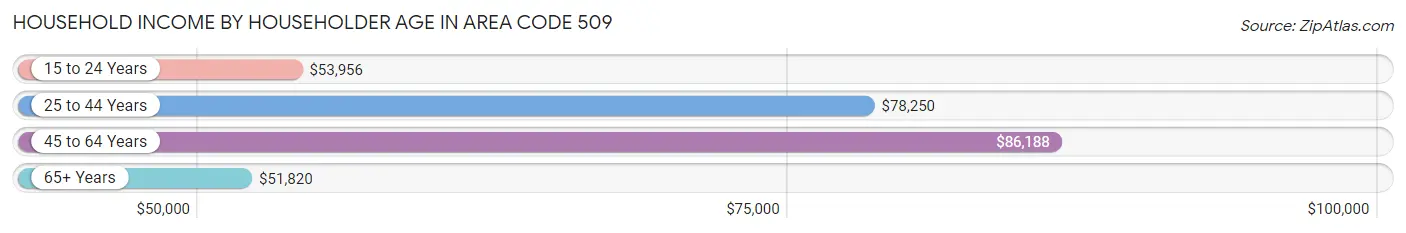
| Income Bracket | # Households | Median Income |
| 15 to 24 Years | 32,615 (5.3%) | $53,956 |
| 25 to 44 Years | 201,594 (32.7%) | $78,250 |
| 45 to 64 Years | 212,941 (34.6%) | $86,188 |
| 65+ Years | 168,794 (27.4%) | $51,820 |
| Total | 615,944 (100.0%) | $67,513 |
Poverty in Area Code 509
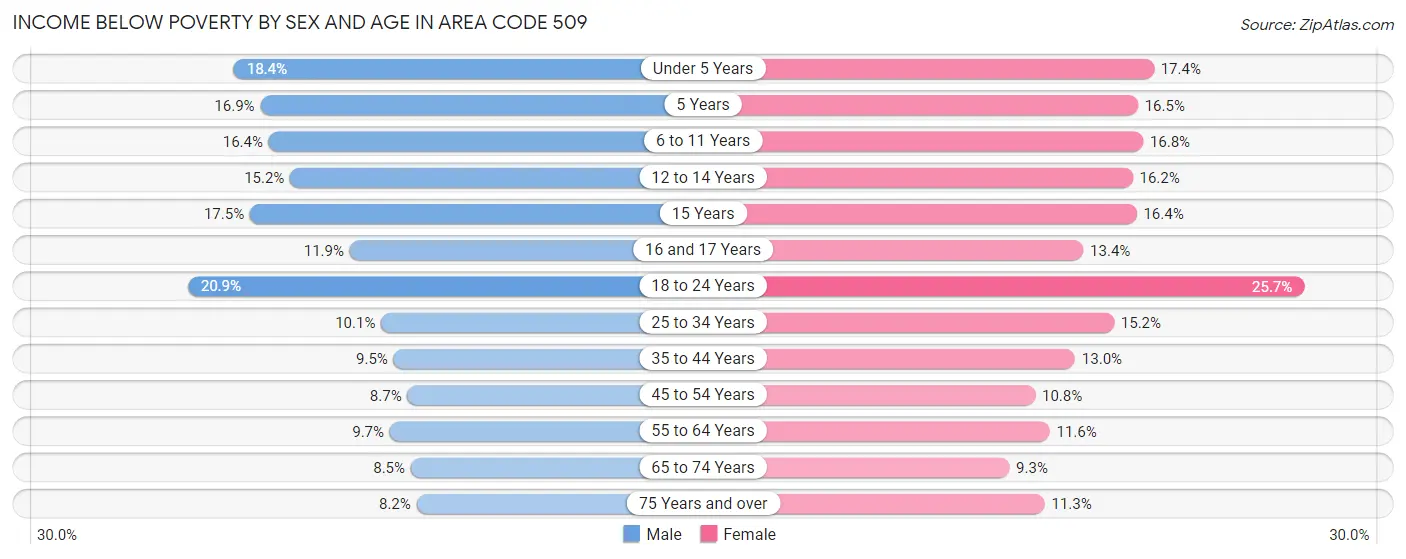
Income Below Poverty by Sex and Age in Area Code 509
With 12.1% poverty level for males and 14.3% for females among the residents of Area Code 509, 18 to 24 year old males and 18 to 24 year old females are the most vulnerable to poverty, with 16,517 males (20.9%) and 19,113 females (25.7%) in their respective age groups living below the poverty level.
| Age Bracket | Male | Female |
| Under 5 Years | 9,501 (18.3%) | 8,625 (17.4%) |
| 5 Years | 1,883 (16.9%) | 1,675 (16.5%) |
| 6 to 11 Years | 11,494 (16.4%) | 11,234 (16.8%) |
| 12 to 14 Years | 5,276 (15.2%) | 5,394 (16.2%) |
| 15 Years | 2,159 (17.4%) | 1,954 (16.4%) |
| 16 and 17 Years | 2,704 (11.9%) | 2,930 (13.4%) |
| 18 to 24 Years | 16,517 (20.9%) | 19,113 (25.7%) |
| 25 to 34 Years | 11,505 (10.1%) | 16,262 (15.1%) |
| 35 to 44 Years | 9,704 (9.5%) | 12,938 (13.0%) |
| 45 to 54 Years | 8,025 (8.7%) | 9,639 (10.8%) |
| 55 to 64 Years | 9,494 (9.7%) | 11,667 (11.6%) |
| 65 to 74 Years | 6,700 (8.5%) | 7,728 (9.3%) |
| 75 Years and over | 3,659 (8.2%) | 6,586 (11.3%) |
| Total | 98,621 (12.1%) | 115,745 (14.3%) |
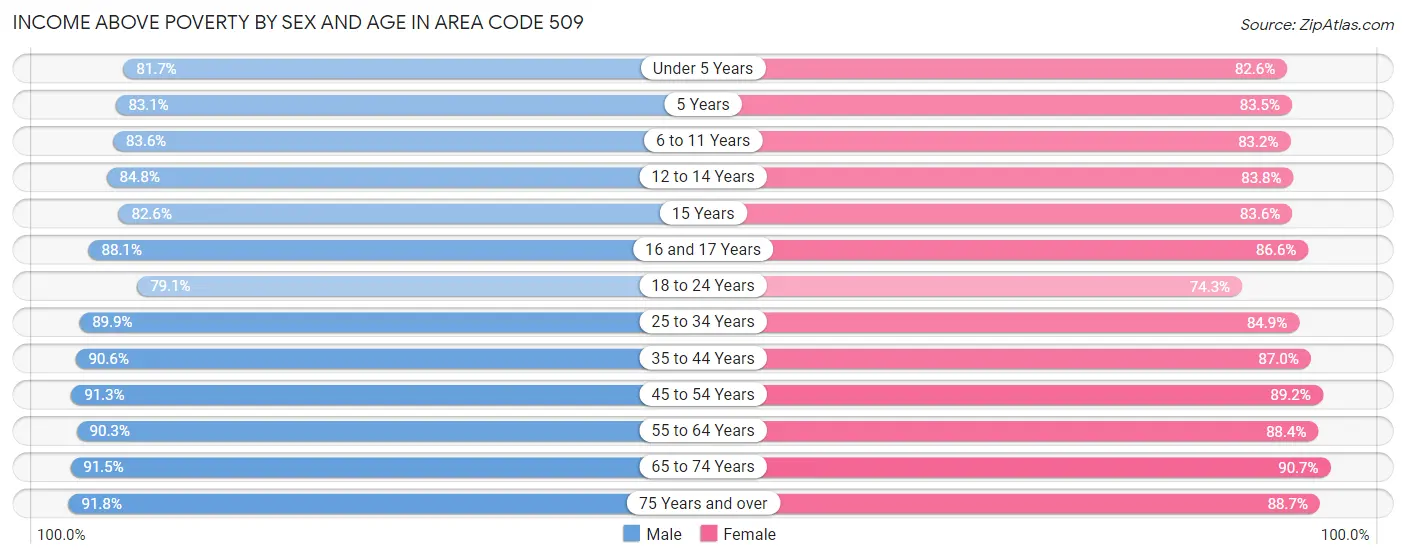
Income Above Poverty by Sex and Age in Area Code 509
According to the poverty statistics in Area Code 509, males aged 75 years and over and females aged 65 to 74 years are the age groups that are most secure financially, with 91.8% of males and 90.7% of females in these age groups living above the poverty line.
| Age Bracket | Male | Female |
| Under 5 Years | 42,288 (81.7%) | 41,029 (82.6%) |
| 5 Years | 9,277 (83.1%) | 8,491 (83.5%) |
| 6 to 11 Years | 58,607 (83.6%) | 55,750 (83.2%) |
| 12 to 14 Years | 29,410 (84.8%) | 27,919 (83.8%) |
| 15 Years | 10,214 (82.6%) | 9,957 (83.6%) |
| 16 and 17 Years | 20,040 (88.1%) | 18,867 (86.6%) |
| 18 to 24 Years | 62,457 (79.1%) | 55,131 (74.3%) |
| 25 to 34 Years | 102,001 (89.9%) | 91,077 (84.9%) |
| 35 to 44 Years | 92,953 (90.5%) | 86,714 (87.0%) |
| 45 to 54 Years | 84,440 (91.3%) | 79,954 (89.2%) |
| 55 to 64 Years | 88,779 (90.3%) | 89,193 (88.4%) |
| 65 to 74 Years | 72,182 (91.5%) | 75,207 (90.7%) |
| 75 Years and over | 41,133 (91.8%) | 51,771 (88.7%) |
| Total | 713,781 (87.9%) | 691,060 (85.7%) |
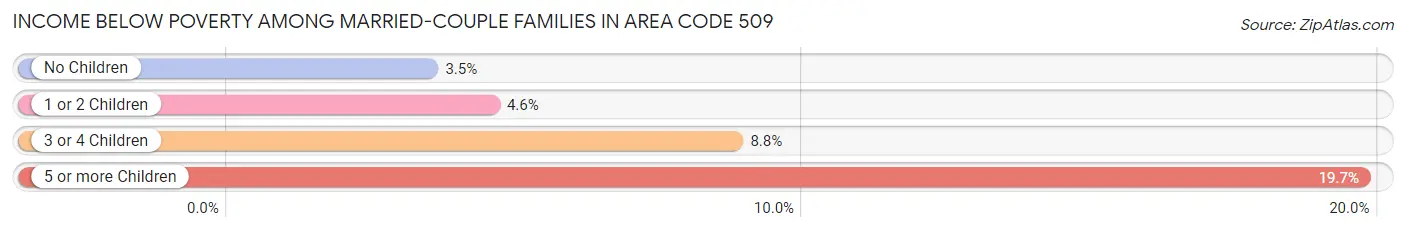
Income Below Poverty Among Married-Couple Families in Area Code 509
The poverty statistics for married-couple families in Area Code 509 show that 4.5% or 13,717 of the total 301,283 families live below the poverty line. Families with 5 or more children have the highest poverty rate of 19.7%, comprising of 736 families. On the other hand, families with no children have the lowest poverty rate of 3.5%, which includes 6,148 families.
| Children | Above Poverty | Below Poverty |
| No Children | 169,923 (96.5%) | 6,148 (3.5%) |
| 1 or 2 Children | 86,745 (95.4%) | 4,142 (4.6%) |
| 3 or 4 Children | 27,902 (91.2%) | 2,691 (8.8%) |
| 5 or more Children | 2,996 (80.3%) | 736 (19.7%) |
| Total | 287,566 (95.5%) | 13,717 (4.5%) |
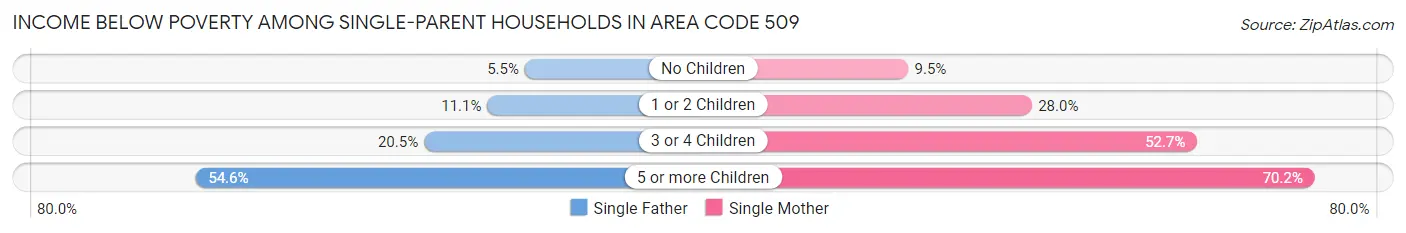
Income Below Poverty Among Single-Parent Households in Area Code 509
According to the poverty data in Area Code 509, 10.7% or 3,586 single-father households and 26.1% or 18,481 single-mother households are living below the poverty line. Among single-father households, those with 5 or more children have the highest poverty rate, with 275 households (54.6%) experiencing poverty. Likewise, among single-mother households, those with 5 or more children have the highest poverty rate, with 777 households (70.2%) falling below the poverty line.
| Children | Single Father | Single Mother |
| No Children | 656 (5.5%) | 2,208 (9.5%) |
| 1 or 2 Children | 1,959 (11.1%) | 10,217 (28.0%) |
| 3 or 4 Children | 696 (20.5%) | 5,279 (52.7%) |
| 5 or more Children | 275 (54.6%) | 777 (70.2%) |
| Total | 3,586 (10.7%) | 18,481 (26.1%) |
Income Below Poverty Among Married-Couple vs Single-Parent Households in Area Code 509
The poverty data for Area Code 509 shows that 13,717 of the married-couple family households (4.5%) and 22,067 of the single-parent households (21.1%) are living below the poverty level. Within the married-couple family households, those with 5 or more children have the highest poverty rate, with 736 households (19.7%) falling below the poverty line. Among the single-parent households, those with 5 or more children have the highest poverty rate, with 1,052 household (65.3%) living below poverty.
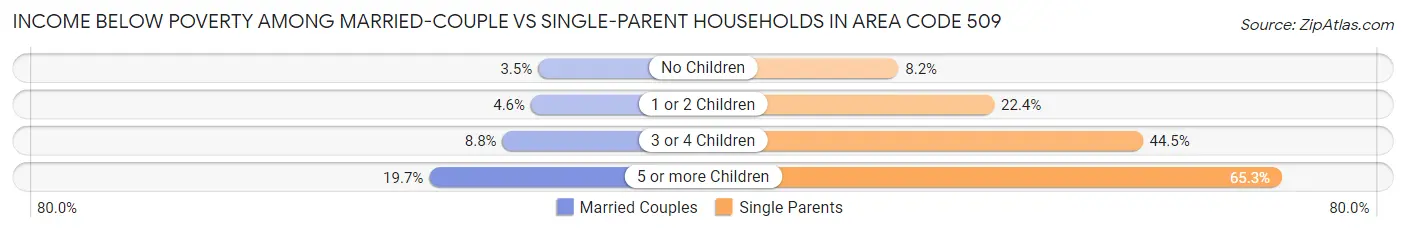
| Children | Married-Couple Families | Single-Parent Households |
| No Children | 6,148 (3.5%) | 2,864 (8.2%) |
| 1 or 2 Children | 4,142 (4.6%) | 12,176 (22.4%) |
| 3 or 4 Children | 2,691 (8.8%) | 5,975 (44.5%) |
| 5 or more Children | 736 (19.7%) | 1,052 (65.3%) |
| Total | 13,717 (4.5%) | 22,067 (21.1%) |
Employment Characteristics in Area Code 509
Employment by Class of Employer in Area Code 509
Among the 730,673 employed individuals in Area Code 509, private company employees (464,157 | 63.5%), not-for-profit organizations (62,732 | 8.6%), and local government employees (58,593 | 8.0%) make up the most common classes of employment.
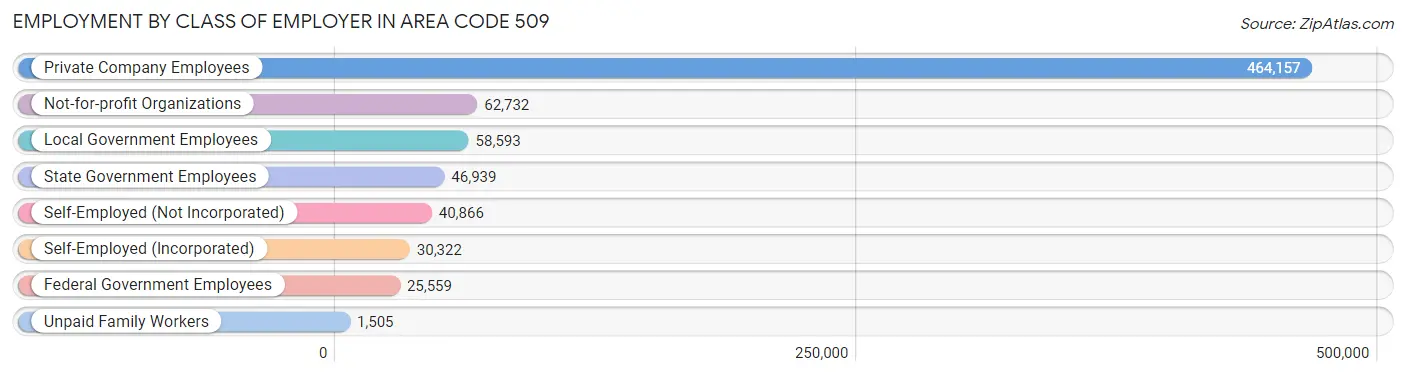
| Employer Class | # Employees | % Employees |
| Private Company Employees | 464,157 | 63.5% |
| Self-Employed (Incorporated) | 30,322 | 4.2% |
| Self-Employed (Not Incorporated) | 40,866 | 5.6% |
| Not-for-profit Organizations | 62,732 | 8.6% |
| Local Government Employees | 58,593 | 8.0% |
| State Government Employees | 46,939 | 6.4% |
| Federal Government Employees | 25,559 | 3.5% |
| Unpaid Family Workers | 1,505 | 0.2% |
| Total | 730,673 | 100.0% |
Employment Status by Age in Area Code 509
According to the labor force statistics for Area Code 509, out of the total population over 16 years of age (1,299,235), 56.0% or 728,221 individuals are in the labor force, with 6.9% or 49,956 of them unemployed. The age group with the highest labor force participation rate is 35 to 44 years, with 79.9% or 164,041 individuals in the labor force. Within the labor force, the 16 to 19 years age range has the highest percentage of unemployed individuals, with 2,907.2% or 1,153,199 of them being unemployed.
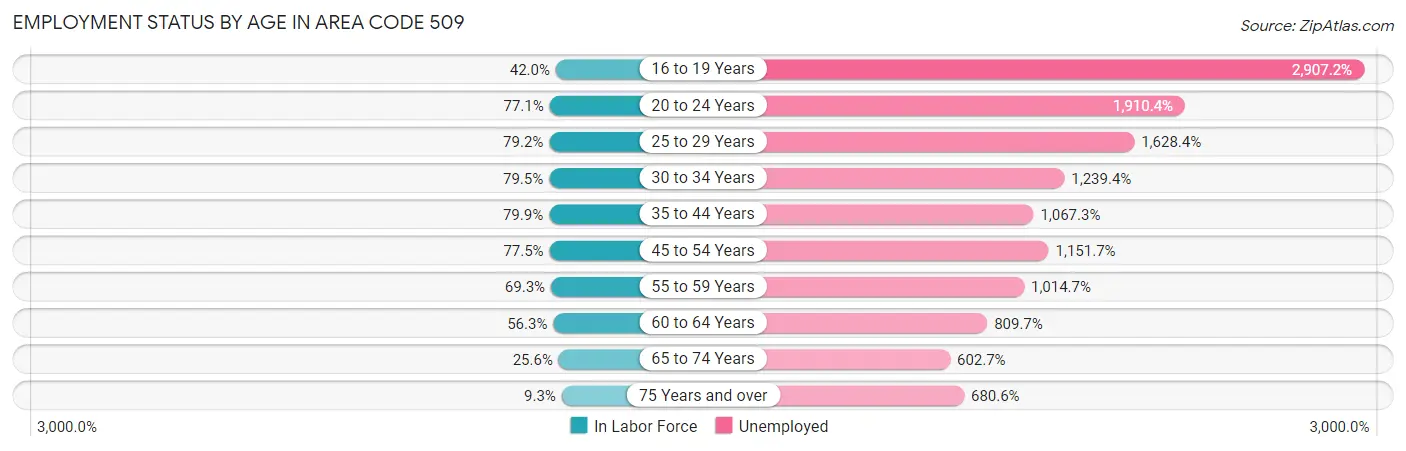
| Age Bracket | In Labor Force | Unemployed |
| 16 to 19 Years | 39,666 (42.0%) | 1,153,199 (2,907.2%) |
| 20 to 24 Years | 92,224 (77.0%) | 1,761,790 (1,910.4%) |
| 25 to 29 Years | 89,274 (79.2%) | 1,453,673 (1,628.4%) |
| 30 to 34 Years | 89,041 (79.5%) | 1,103,636 (1,239.4%) |
| 35 to 44 Years | 164,047 (79.9%) | 1,750,810 (1,067.3%) |
| 45 to 54 Years | 142,574 (77.5%) | 1,642,059 (1,151.7%) |
| 55 to 59 Years | 66,580 (69.3%) | 675,547 (1,014.7%) |
| 60 to 64 Years | 58,780 (56.2%) | 475,925 (809.7%) |
| 65 to 74 Years | 41,873 (25.6%) | 252,338 (602.7%) |
| 75 Years and over | 9,972 (9.3%) | 67,849 (680.6%) |
| Total | 728,171 (56.0%) | 49,924 (6.9%) |
Employment Status by Educational Attainment in Area Code 509
According to labor force statistics for Area Code 509, 72.7% of individuals (592,370) out of the total population between 25 and 64 years of age (814,478) are in the labor force, with 1,167.1% or 6,913,550 of them being unemployed. The group with the highest labor force participation rate are those with the educational attainment of bachelor's degree or higher, with 83.1% or 184,352 individuals in the labor force. Within the labor force, individuals with less than high school education have the highest percentage of unemployment, with 2,071.7% or 1,367,757 of them being unemployed.
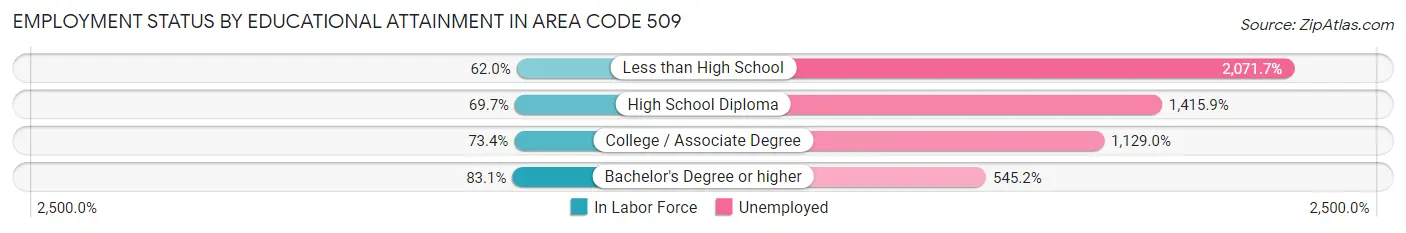
| Educational Attainment | In Labor Force | Unemployed |
| Less than High School | 66,018 (62.0%) | 2,207,831 (2,071.7%) |
| High School Diploma | 143,025 (69.7%) | 2,905,271 (1,415.9%) |
| College / Associate Degree | 206,041 (73.4%) | 3,169,871 (1,129.0%) |
| Bachelor's Degree or higher | 184,357 (83.1%) | 1,210,071 (545.2%) |
| Total | 592,360 (72.7%) | 9,505,773 (1,167.1%) |
Employment Occupations by Sex in Area Code 509
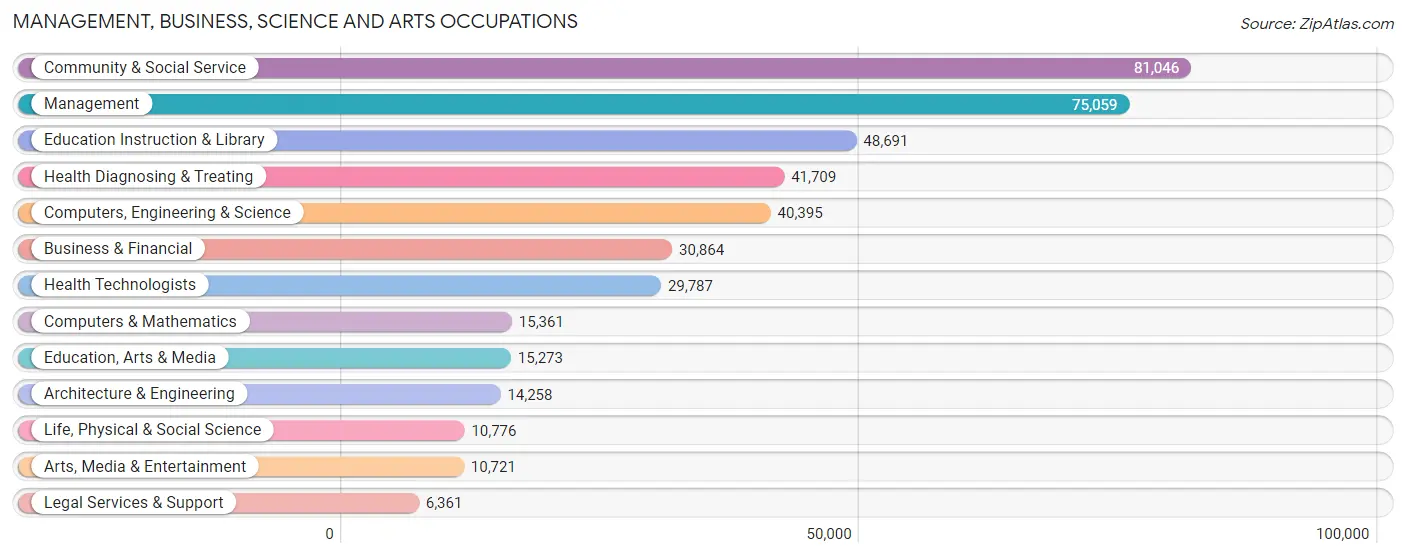
Management, Business, Science and Arts Occupations
The most common Management, Business, Science and Arts occupations in Area Code 509 are Community & Social Service (81,046 | 10.9%), Management (75,059 | 10.1%), Education Instruction & Library (48,691 | 6.5%), Health Diagnosing & Treating (41,709 | 5.6%), and Computers, Engineering & Science (40,395 | 5.4%).
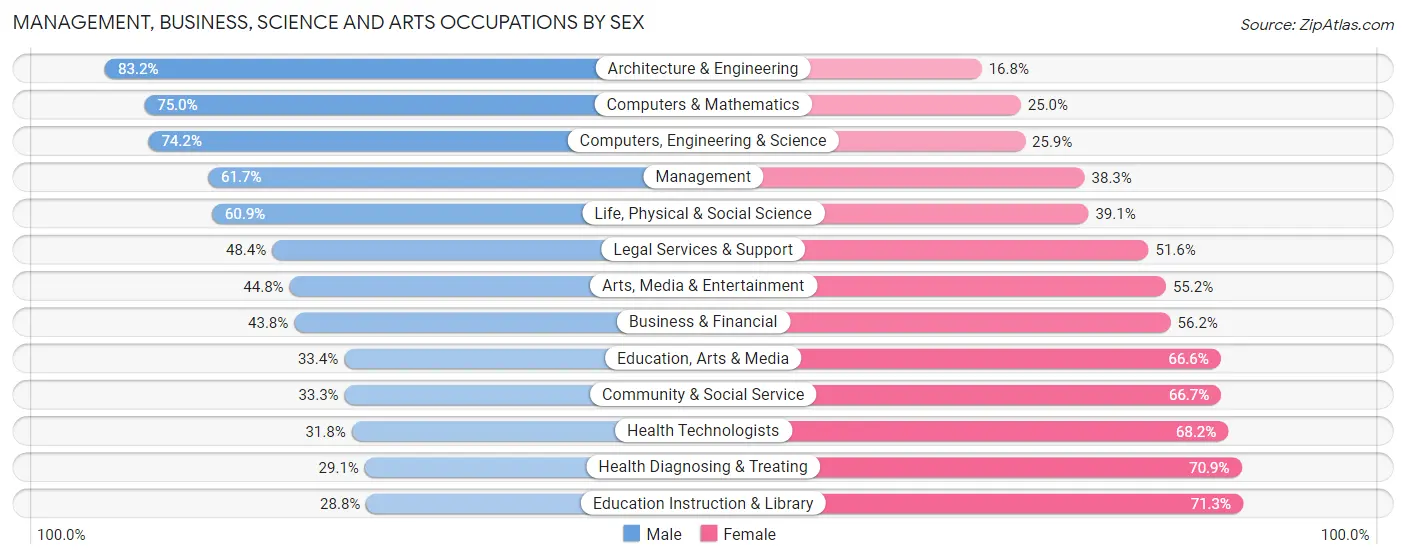
Management, Business, Science and Arts Occupations by Sex
Within the Management, Business, Science and Arts occupations in Area Code 509, the most male-oriented occupations are Architecture & Engineering (83.2%), Computers & Mathematics (75.0%), and Computers, Engineering & Science (74.2%), while the most female-oriented occupations are Education Instruction & Library (71.3%), Health Diagnosing & Treating (70.9%), and Health Technologists (68.2%).
| Occupation | Male | Female |
| Management | 46,331 (61.7%) | 28,728 (38.3%) |
| Business & Financial | 13,512 (43.8%) | 17,352 (56.2%) |
| Computers, Engineering & Science | 29,952 (74.2%) | 10,443 (25.9%) |
| Computers & Mathematics | 11,526 (75.0%) | 3,835 (25.0%) |
| Architecture & Engineering | 11,861 (83.2%) | 2,397 (16.8%) |
| Life, Physical & Social Science | 6,565 (60.9%) | 4,211 (39.1%) |
| Community & Social Service | 26,970 (33.3%) | 54,076 (66.7%) |
| Education, Arts & Media | 5,096 (33.4%) | 10,177 (66.6%) |
| Legal Services & Support | 3,078 (48.4%) | 3,283 (51.6%) |
| Education Instruction & Library | 13,997 (28.7%) | 34,694 (71.3%) |
| Arts, Media & Entertainment | 4,799 (44.8%) | 5,922 (55.2%) |
| Health Diagnosing & Treating | 12,121 (29.1%) | 29,588 (70.9%) |
| Health Technologists | 9,474 (31.8%) | 20,313 (68.2%) |
| Total (Category) | 128,886 (47.9%) | 140,187 (52.1%) |
| Total (Overall) | 399,918 (53.7%) | 344,289 (46.3%) |
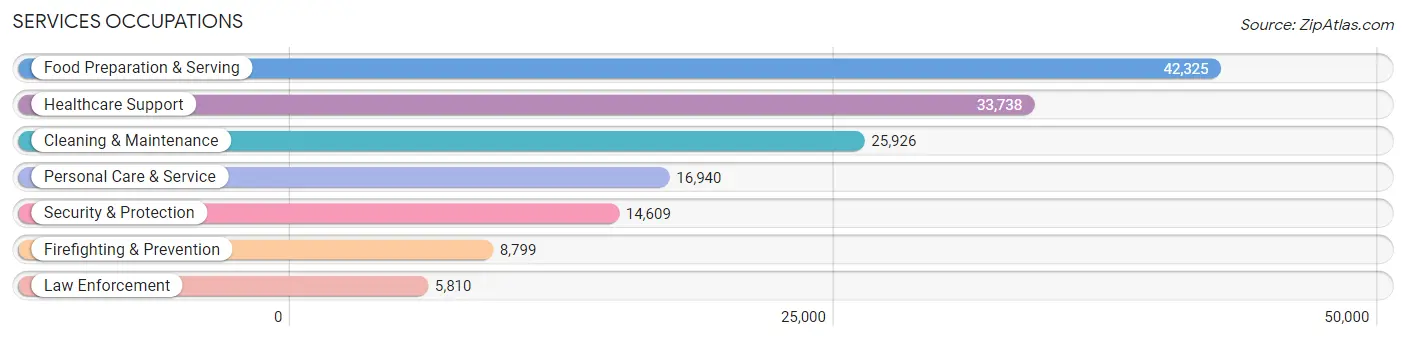
Services Occupations
The most common Services occupations in Area Code 509 are Food Preparation & Serving (42,325 | 5.7%), Healthcare Support (33,738 | 4.5%), Cleaning & Maintenance (25,926 | 3.5%), Personal Care & Service (16,940 | 2.3%), and Security & Protection (14,609 | 2.0%).
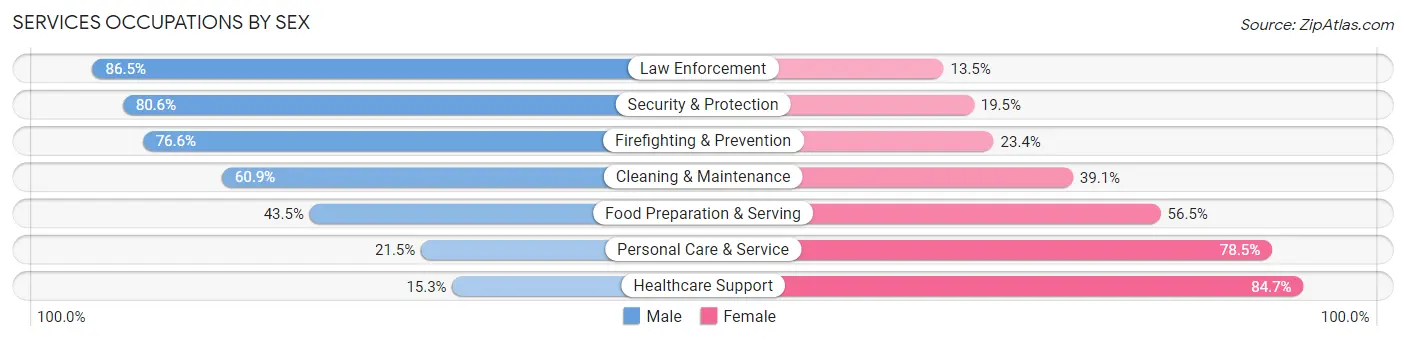
Services Occupations by Sex
Within the Services occupations in Area Code 509, the most male-oriented occupations are Law Enforcement (86.5%), Security & Protection (80.5%), and Firefighting & Prevention (76.6%), while the most female-oriented occupations are Healthcare Support (84.7%), Personal Care & Service (78.5%), and Food Preparation & Serving (56.5%).
| Occupation | Male | Female |
| Healthcare Support | 5,154 (15.3%) | 28,584 (84.7%) |
| Security & Protection | 11,768 (80.5%) | 2,841 (19.5%) |
| Firefighting & Prevention | 6,741 (76.6%) | 2,058 (23.4%) |
| Law Enforcement | 5,027 (86.5%) | 783 (13.5%) |
| Food Preparation & Serving | 18,430 (43.5%) | 23,895 (56.5%) |
| Cleaning & Maintenance | 15,794 (60.9%) | 10,132 (39.1%) |
| Personal Care & Service | 3,639 (21.5%) | 13,301 (78.5%) |
| Total (Category) | 54,785 (41.0%) | 78,753 (59.0%) |
| Total (Overall) | 399,918 (53.7%) | 344,289 (46.3%) |
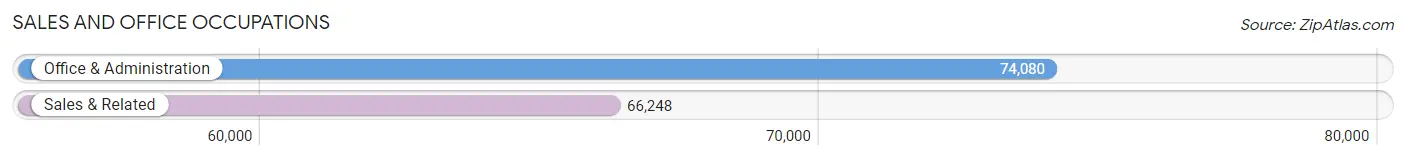
Sales and Office Occupations
The most common Sales and Office occupations in Area Code 509 are Office & Administration (74,080 | 10.0%), and Sales & Related (66,248 | 8.9%).
Sales and Office Occupations by Sex
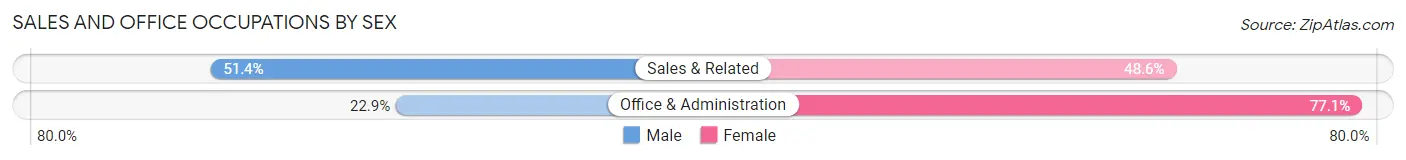
| Occupation | Male | Female |
| Sales & Related | 34,066 (51.4%) | 32,182 (48.6%) |
| Office & Administration | 16,931 (22.9%) | 57,149 (77.1%) |
| Total (Category) | 50,997 (36.3%) | 89,331 (63.7%) |
| Total (Overall) | 399,918 (53.7%) | 344,289 (46.3%) |
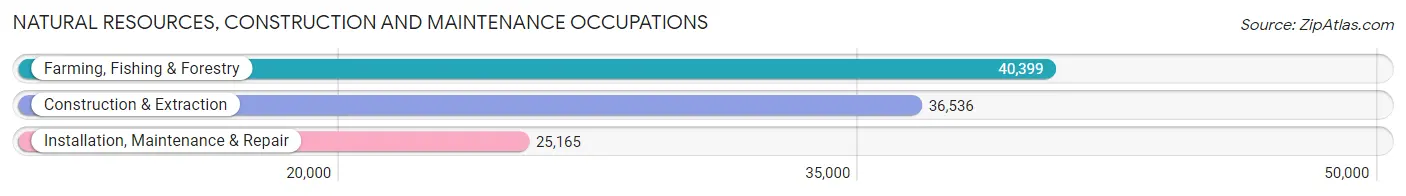
Natural Resources, Construction and Maintenance Occupations
The most common Natural Resources, Construction and Maintenance occupations in Area Code 509 are Farming, Fishing & Forestry (40,399 | 5.4%), Construction & Extraction (36,536 | 4.9%), and Installation, Maintenance & Repair (25,165 | 3.4%).
Natural Resources, Construction and Maintenance Occupations by Sex
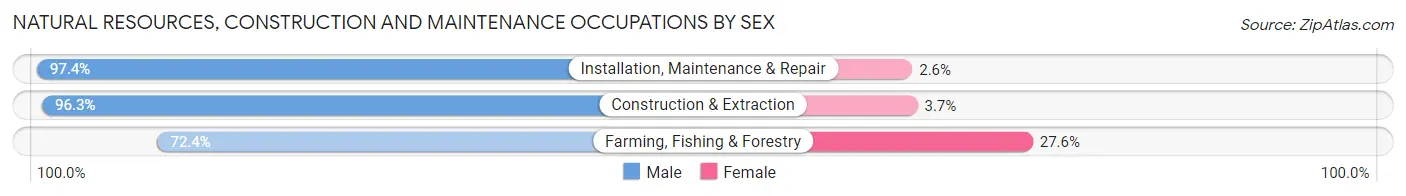
| Occupation | Male | Female |
| Farming, Fishing & Forestry | 29,234 (72.4%) | 11,165 (27.6%) |
| Construction & Extraction | 35,199 (96.3%) | 1,337 (3.7%) |
| Installation, Maintenance & Repair | 24,518 (97.4%) | 647 (2.6%) |
| Total (Category) | 88,951 (87.1%) | 13,149 (12.9%) |
| Total (Overall) | 399,918 (53.7%) | 344,289 (46.3%) |
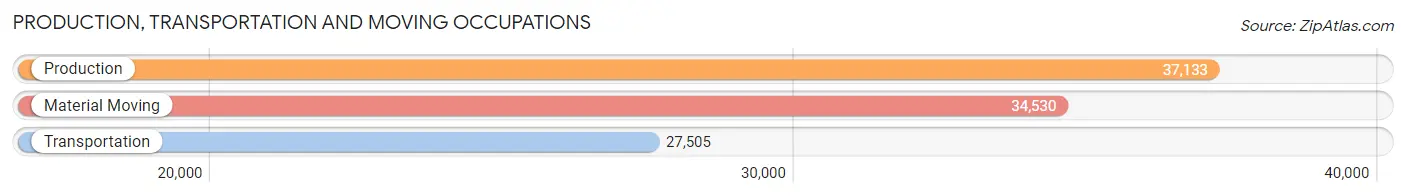
Production, Transportation and Moving Occupations
The most common Production, Transportation and Moving occupations in Area Code 509 are Production (37,133 | 5.0%), Material Moving (34,530 | 4.6%), and Transportation (27,505 | 3.7%).
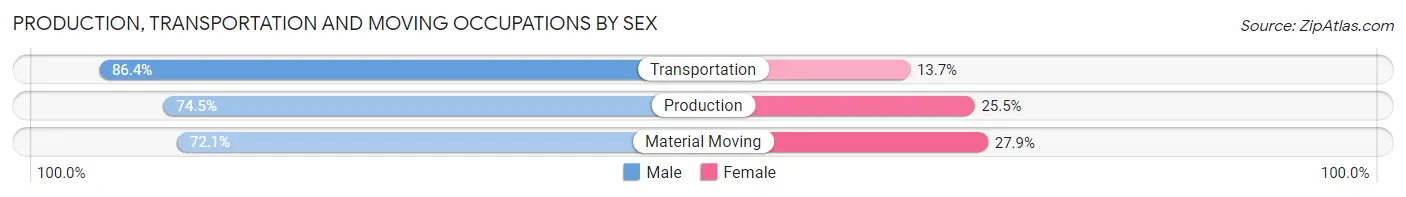
Production, Transportation and Moving Occupations by Sex
| Occupation | Male | Female |
| Production | 27,667 (74.5%) | 9,466 (25.5%) |
| Transportation | 23,750 (86.4%) | 3,755 (13.7%) |
| Material Moving | 24,882 (72.1%) | 9,648 (27.9%) |
| Total (Category) | 76,299 (76.9%) | 22,869 (23.1%) |
| Total (Overall) | 399,918 (53.7%) | 344,289 (46.3%) |
Employment Industries by Sex in Area Code 509
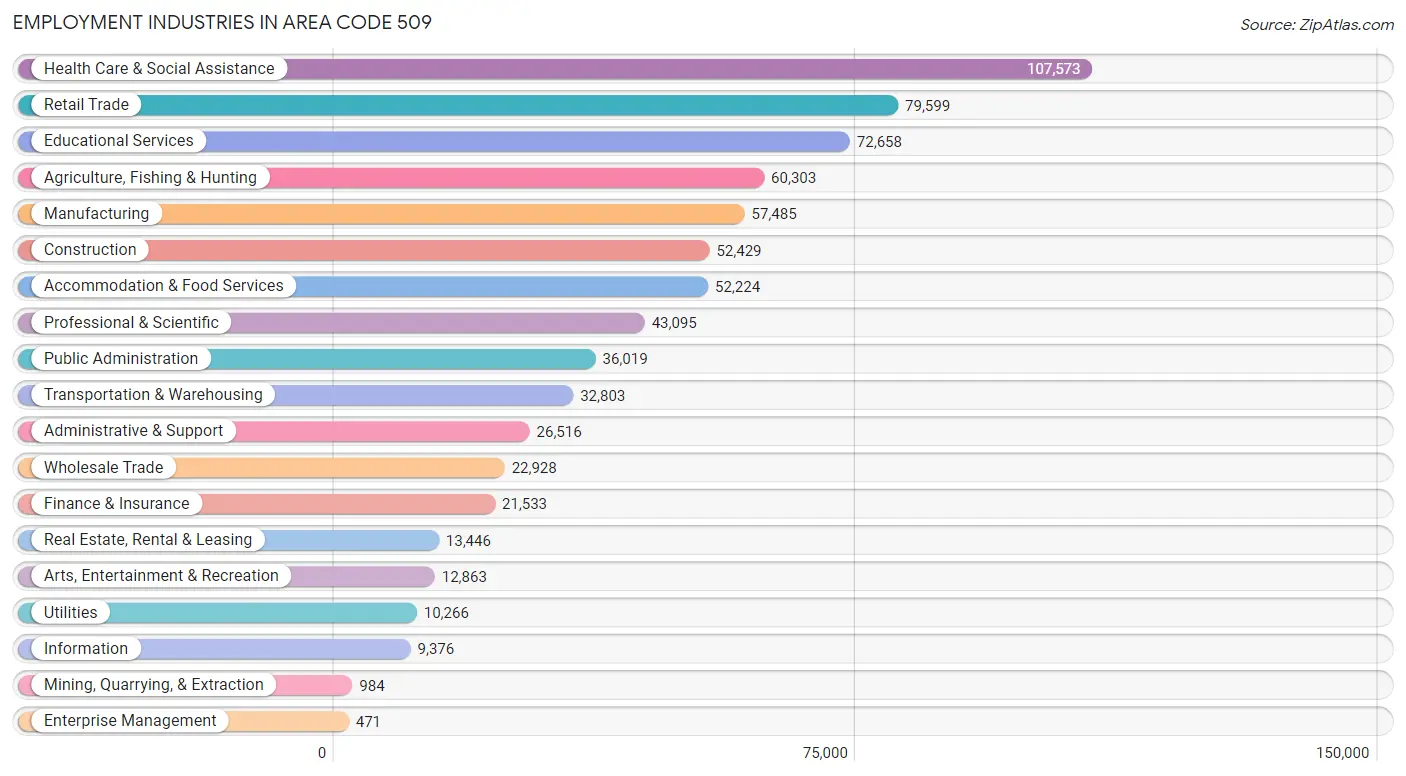
Employment Industries in Area Code 509
The major employment industries in Area Code 509 include Health Care & Social Assistance (107,573 | 14.4%), Retail Trade (79,599 | 10.7%), Educational Services (72,658 | 9.8%), Agriculture, Fishing & Hunting (60,303 | 8.1%), and Manufacturing (57,485 | 7.7%).
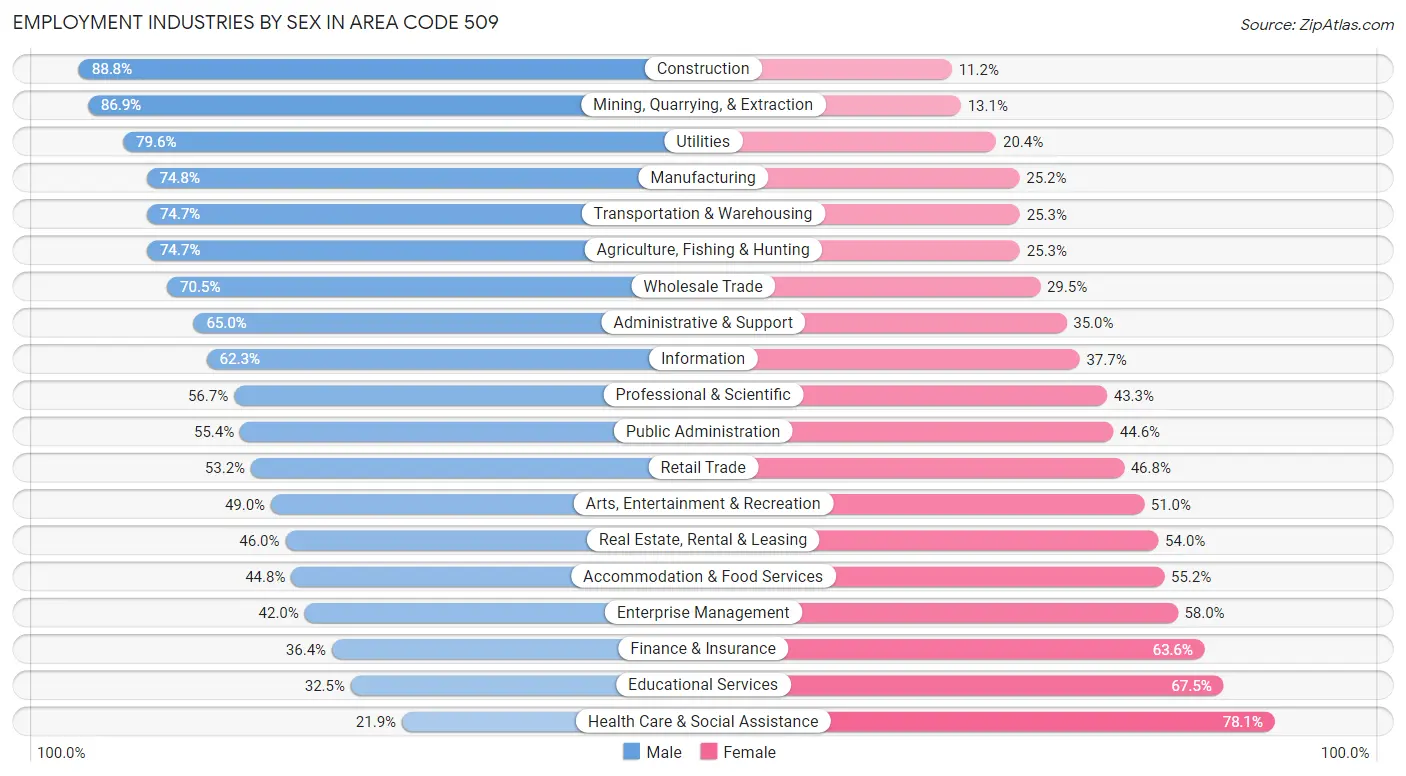
Employment Industries by Sex in Area Code 509
The Area Code 509 industries that see more men than women are Construction (88.8%), Mining, Quarrying, & Extraction (86.9%), and Utilities (79.6%), whereas the industries that tend to have a higher number of women are Health Care & Social Assistance (78.1%), Educational Services (67.5%), and Finance & Insurance (63.6%).
| Industry | Male | Female |
| Agriculture, Fishing & Hunting | 45,023 (74.7%) | 15,280 (25.3%) |
| Mining, Quarrying, & Extraction | 855 (86.9%) | 129 (13.1%) |
| Construction | 46,536 (88.8%) | 5,893 (11.2%) |
| Manufacturing | 42,973 (74.8%) | 14,512 (25.2%) |
| Wholesale Trade | 16,162 (70.5%) | 6,766 (29.5%) |
| Retail Trade | 42,317 (53.2%) | 37,282 (46.8%) |
| Transportation & Warehousing | 24,495 (74.7%) | 8,308 (25.3%) |
| Utilities | 8,171 (79.6%) | 2,095 (20.4%) |
| Information | 5,842 (62.3%) | 3,534 (37.7%) |
| Finance & Insurance | 7,835 (36.4%) | 13,698 (63.6%) |
| Real Estate, Rental & Leasing | 6,189 (46.0%) | 7,257 (54.0%) |
| Professional & Scientific | 24,416 (56.7%) | 18,679 (43.3%) |
| Enterprise Management | 198 (42.0%) | 273 (58.0%) |
| Administrative & Support | 17,247 (65.0%) | 9,269 (35.0%) |
| Educational Services | 23,598 (32.5%) | 49,060 (67.5%) |
| Health Care & Social Assistance | 23,555 (21.9%) | 84,018 (78.1%) |
| Arts, Entertainment & Recreation | 6,304 (49.0%) | 6,559 (51.0%) |
| Accommodation & Food Services | 23,404 (44.8%) | 28,820 (55.2%) |
| Public Administration | 19,954 (55.4%) | 16,065 (44.6%) |
| Total | 399,918 (53.7%) | 344,289 (46.3%) |
Education in Area Code 509
School Enrollment in Area Code 509
The most common levels of schooling among the 424,528 students in Area Code 509 are middle school (93,258 | 22.0%), high school (90,440 | 21.3%), and elementary school (89,760 | 21.1%).
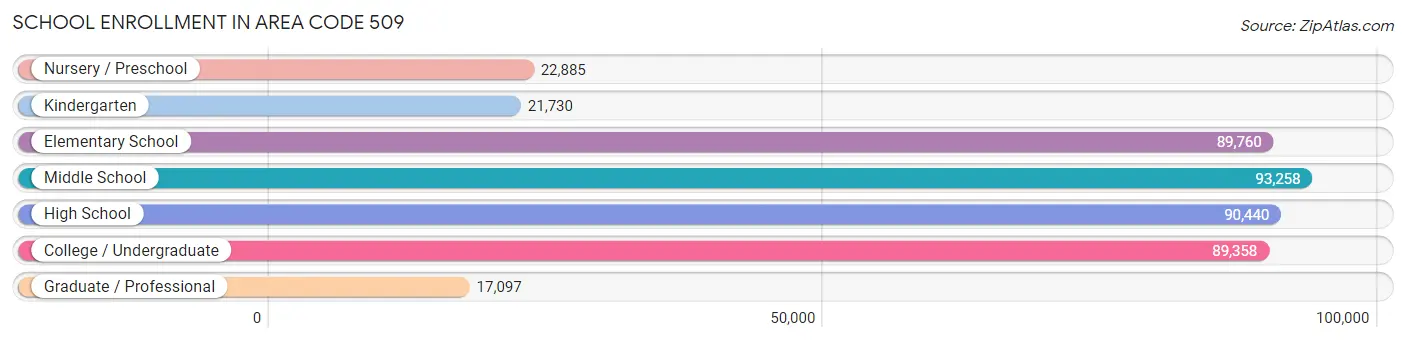
| School Level | # Students | % Students |
| Nursery / Preschool | 22,885 | 5.4% |
| Kindergarten | 21,730 | 5.1% |
| Elementary School | 89,760 | 21.1% |
| Middle School | 93,258 | 22.0% |
| High School | 90,440 | 21.3% |
| College / Undergraduate | 89,358 | 21.0% |
| Graduate / Professional | 17,097 | 4.0% |
| Total | 424,528 | 100.0% |
School Enrollment by Age by Funding Source in Area Code 509
Out of a total of 424,528 students who are enrolled in schools in Area Code 509, 56,016 (13.2%) attend a private institution, while the remaining 368,512 (86.8%) are enrolled in public schools. The age group of 3 to 4 year olds has the highest likelihood of being enrolled in private schools, with 6,384 (38.8% in the age bracket) enrolled. Conversely, the age group of 15 to 17 year olds has the lowest likelihood of being enrolled in a private school, with 62,699 (93.6% in the age bracket) attending a public institution.
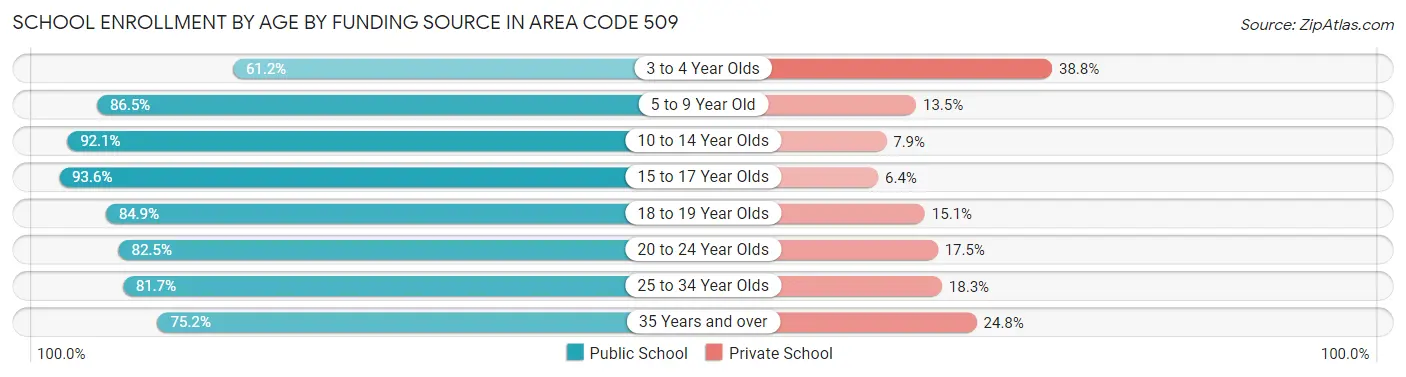
| Age Bracket | Public School | Private School |
| 3 to 4 Year Olds | 10,066 (61.2%) | 6,384 (38.8%) |
| 5 to 9 Year Old | 91,029 (86.5%) | 14,186 (13.5%) |
| 10 to 14 Year Olds | 105,408 (92.1%) | 9,093 (7.9%) |
| 15 to 17 Year Olds | 62,699 (93.6%) | 4,297 (6.4%) |
| 18 to 19 Year Olds | 28,467 (84.9%) | 5,075 (15.1%) |
| 20 to 24 Year Olds | 36,238 (82.5%) | 7,691 (17.5%) |
| 25 to 34 Year Olds | 20,137 (81.7%) | 4,510 (18.3%) |
| 35 Years and over | 14,482 (75.2%) | 4,766 (24.8%) |
| Total | 368,512 (86.8%) | 56,016 (13.2%) |
Educational Attainment by Field of Study in Area Code 509
Business (50,086 | 15.3%), education (48,090 | 14.7%), science & technology (35,777 | 11.0%), bio, nature & agricultural (29,999 | 9.2%), and social sciences (24,905 | 7.6%) are the most common fields of study among 326,876 individuals in Area Code 509 who have obtained a bachelor's degree or higher.
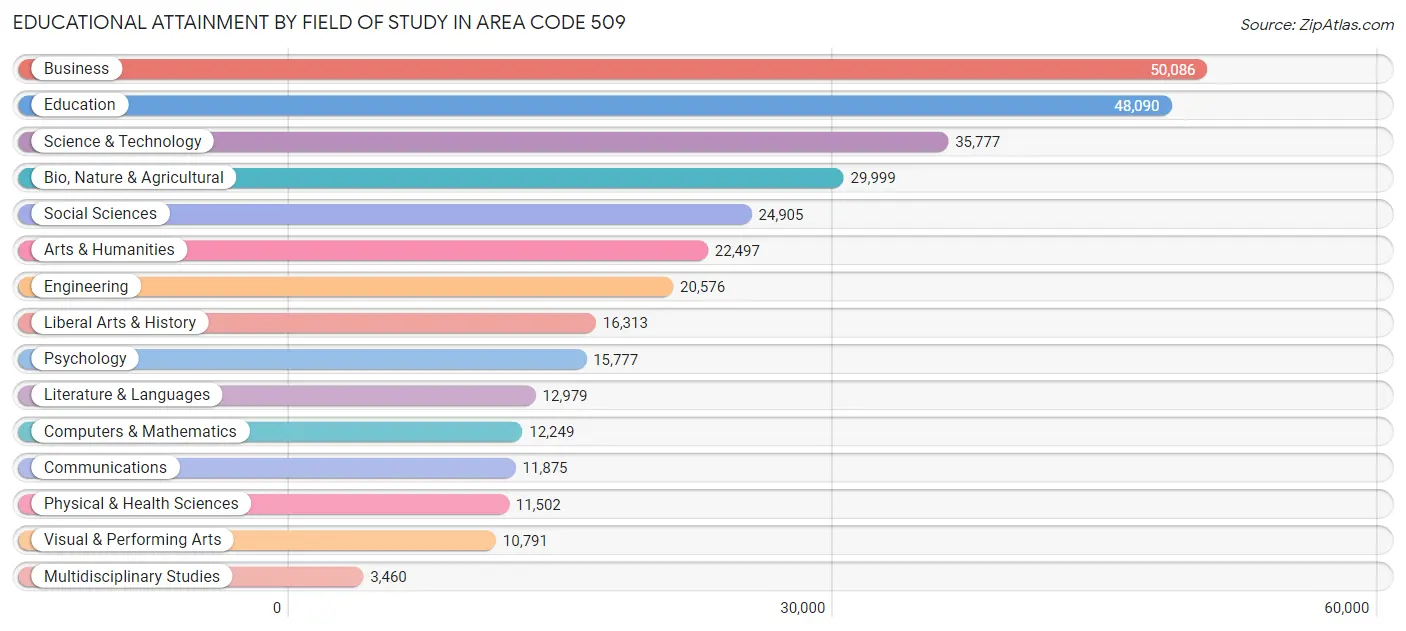
| Field of Study | # Graduates | % Graduates |
| Computers & Mathematics | 12,249 | 3.7% |
| Bio, Nature & Agricultural | 29,999 | 9.2% |
| Physical & Health Sciences | 11,502 | 3.5% |
| Psychology | 15,777 | 4.8% |
| Social Sciences | 24,905 | 7.6% |
| Engineering | 20,576 | 6.3% |
| Multidisciplinary Studies | 3,460 | 1.1% |
| Science & Technology | 35,777 | 11.0% |
| Business | 50,086 | 15.3% |
| Education | 48,090 | 14.7% |
| Literature & Languages | 12,979 | 4.0% |
| Liberal Arts & History | 16,313 | 5.0% |
| Visual & Performing Arts | 10,791 | 3.3% |
| Communications | 11,875 | 3.6% |
| Arts & Humanities | 22,497 | 6.9% |
| Total | 326,876 | 100.0% |
Transportation & Commute in Area Code 509
Vehicle Availability by Sex in Area Code 509
The most prevalent vehicle ownership categories in Area Code 509 are males with 2 vehicles (144,817, accounting for 37.3%) and females with 2 vehicles (120,980, making up 43.6%).
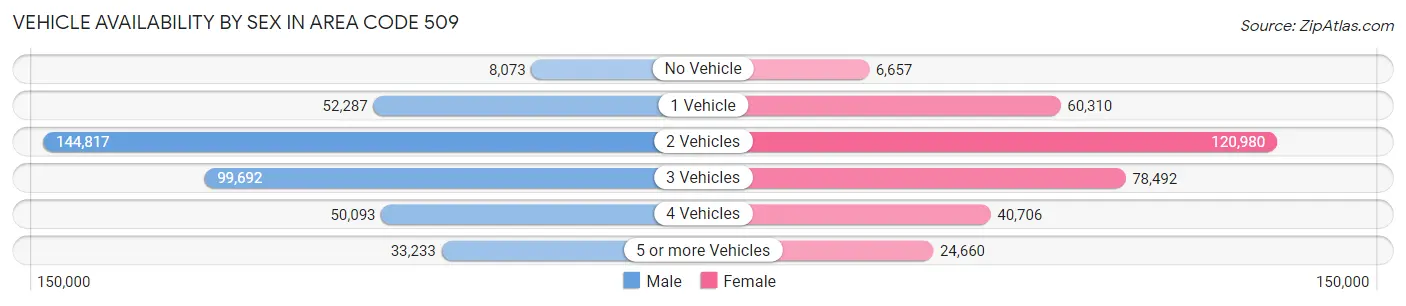
| Vehicles Available | Male | Female |
| No Vehicle | 8,073 (2.1%) | 6,657 (2.0%) |
| 1 Vehicle | 52,287 (13.5%) | 60,310 (18.2%) |
| 2 Vehicles | 144,817 (37.3%) | 120,980 (36.5%) |
| 3 Vehicles | 99,692 (25.7%) | 78,492 (23.7%) |
| 4 Vehicles | 50,093 (12.9%) | 40,706 (12.3%) |
| 5 or more Vehicles | 33,233 (8.6%) | 24,660 (7.4%) |
| Total | 388,195 (100.0%) | 331,805 (100.0%) |
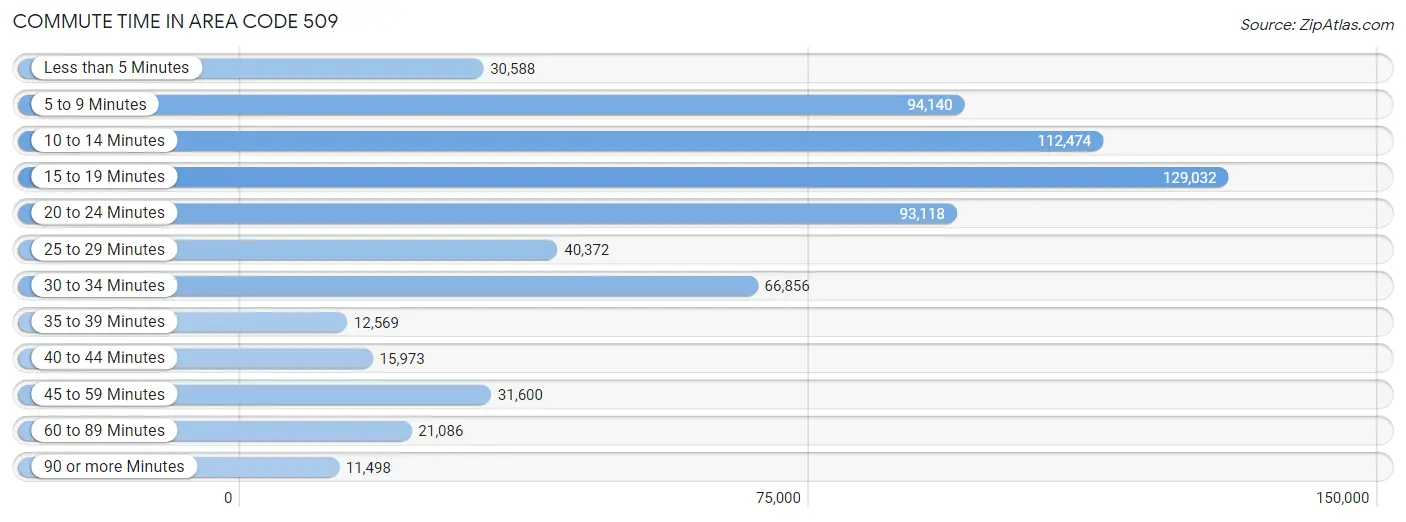
Commute Time in Area Code 509
The most frequently occuring commute durations in Area Code 509 are 15 to 19 minutes (129,032 commuters, 19.6%), 10 to 14 minutes (112,474 commuters, 17.1%), and 5 to 9 minutes (94,140 commuters, 14.3%).
| Commute Time | # Commuters | % Commuters |
| Less than 5 Minutes | 30,588 | 4.6% |
| 5 to 9 Minutes | 94,140 | 14.3% |
| 10 to 14 Minutes | 112,474 | 17.1% |
| 15 to 19 Minutes | 129,032 | 19.6% |
| 20 to 24 Minutes | 93,118 | 14.1% |
| 25 to 29 Minutes | 40,372 | 6.1% |
| 30 to 34 Minutes | 66,856 | 10.1% |
| 35 to 39 Minutes | 12,569 | 1.9% |
| 40 to 44 Minutes | 15,973 | 2.4% |
| 45 to 59 Minutes | 31,600 | 4.8% |
| 60 to 89 Minutes | 21,086 | 3.2% |
| 90 or more Minutes | 11,498 | 1.7% |
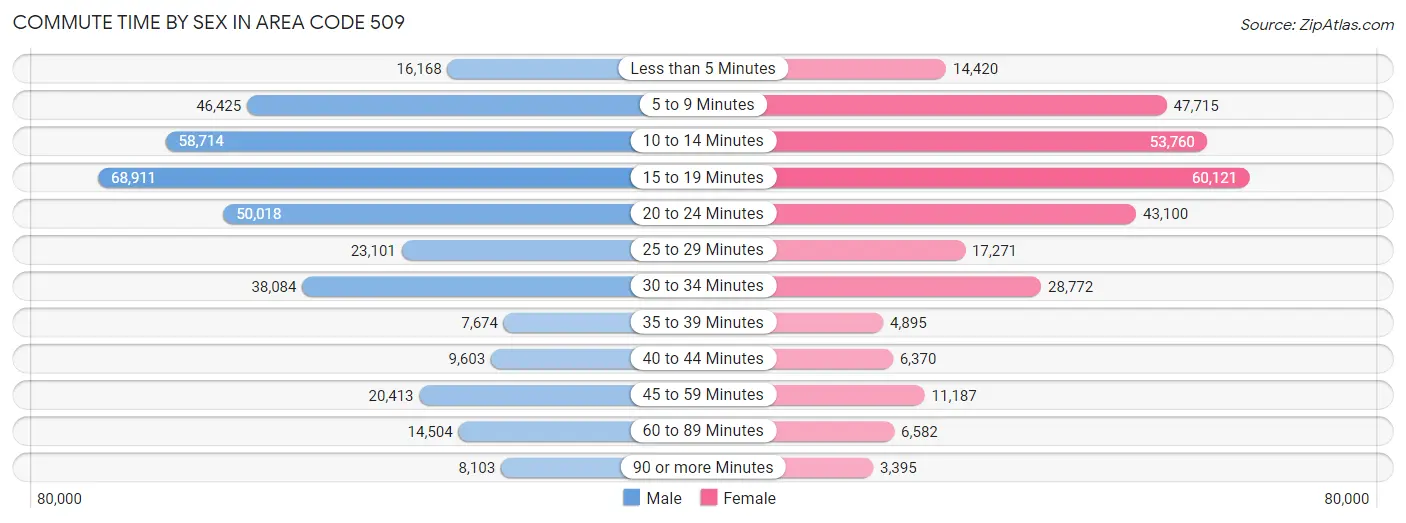
Commute Time by Sex in Area Code 509
The most common commute times in Area Code 509 are 15 to 19 minutes (68,911 commuters, 19.1%) for males and 15 to 19 minutes (60,121 commuters, 20.2%) for females.
| Commute Time | Male | Female |
| Less than 5 Minutes | 16,168 (4.5%) | 14,420 (4.9%) |
| 5 to 9 Minutes | 46,425 (12.8%) | 47,715 (16.0%) |
| 10 to 14 Minutes | 58,714 (16.2%) | 53,760 (18.1%) |
| 15 to 19 Minutes | 68,911 (19.1%) | 60,121 (20.2%) |
| 20 to 24 Minutes | 50,018 (13.8%) | 43,100 (14.5%) |
| 25 to 29 Minutes | 23,101 (6.4%) | 17,271 (5.8%) |
| 30 to 34 Minutes | 38,084 (10.5%) | 28,772 (9.7%) |
| 35 to 39 Minutes | 7,674 (2.1%) | 4,895 (1.6%) |
| 40 to 44 Minutes | 9,603 (2.6%) | 6,370 (2.1%) |
| 45 to 59 Minutes | 20,413 (5.6%) | 11,187 (3.8%) |
| 60 to 89 Minutes | 14,504 (4.0%) | 6,582 (2.2%) |
| 90 or more Minutes | 8,103 (2.2%) | 3,395 (1.1%) |
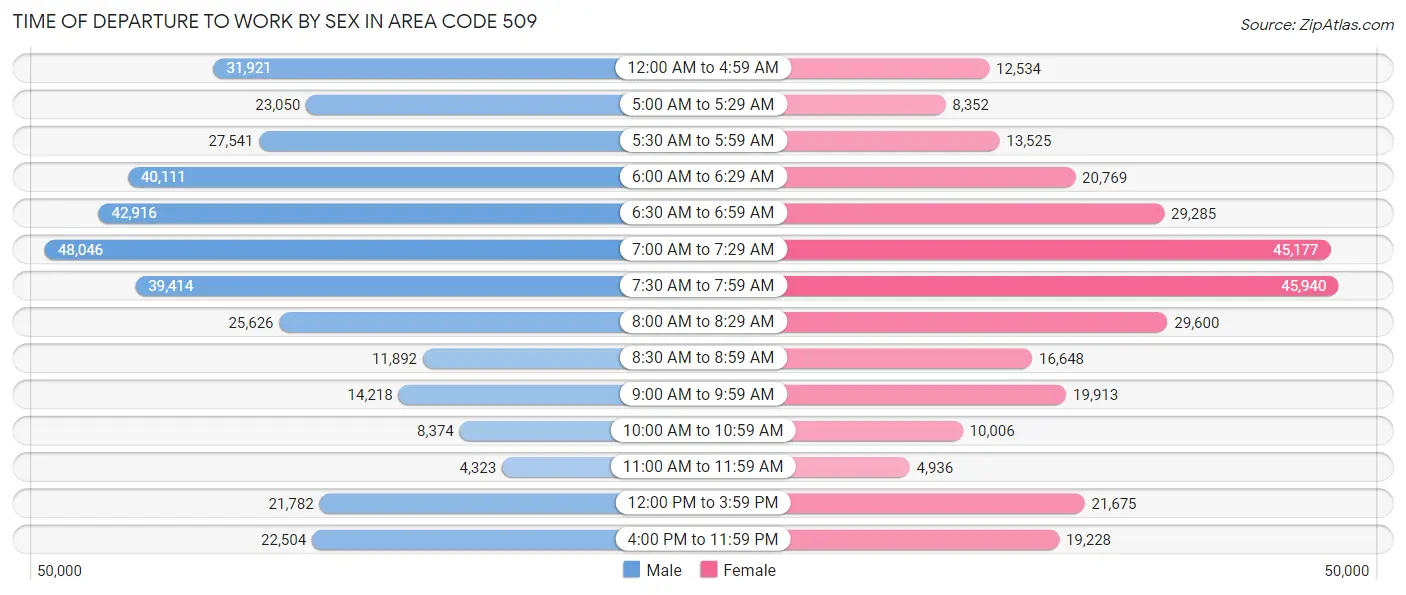
Time of Departure to Work by Sex in Area Code 509
The most frequent times of departure to work in Area Code 509 are 7:00 AM to 7:29 AM (48,046, 13.3%) for males and 7:30 AM to 7:59 AM (45,940, 15.4%) for females.
| Time of Departure | Male | Female |
| 12:00 AM to 4:59 AM | 31,921 (8.8%) | 12,534 (4.2%) |
| 5:00 AM to 5:29 AM | 23,050 (6.4%) | 8,352 (2.8%) |
| 5:30 AM to 5:59 AM | 27,541 (7.6%) | 13,525 (4.5%) |
| 6:00 AM to 6:29 AM | 40,111 (11.1%) | 20,769 (7.0%) |
| 6:30 AM to 6:59 AM | 42,916 (11.9%) | 29,285 (9.8%) |
| 7:00 AM to 7:29 AM | 48,046 (13.3%) | 45,177 (15.2%) |
| 7:30 AM to 7:59 AM | 39,414 (10.9%) | 45,940 (15.4%) |
| 8:00 AM to 8:29 AM | 25,626 (7.1%) | 29,600 (10.0%) |
| 8:30 AM to 8:59 AM | 11,892 (3.3%) | 16,648 (5.6%) |
| 9:00 AM to 9:59 AM | 14,218 (3.9%) | 19,913 (6.7%) |
| 10:00 AM to 10:59 AM | 8,374 (2.3%) | 10,006 (3.4%) |
| 11:00 AM to 11:59 AM | 4,323 (1.2%) | 4,936 (1.7%) |
| 12:00 PM to 3:59 PM | 21,782 (6.0%) | 21,675 (7.3%) |
| 4:00 PM to 11:59 PM | 22,504 (6.2%) | 19,228 (6.5%) |
| Total | 361,718 (100.0%) | 297,588 (100.0%) |
Housing Occupancy in Area Code 509
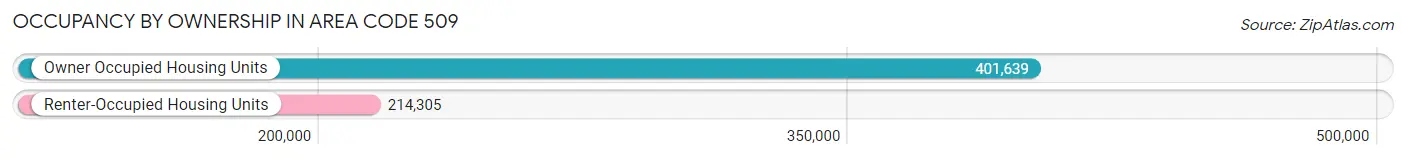
Occupancy by Ownership in Area Code 509
Of the total 615,944 dwellings in Area Code 509, owner-occupied units account for 401,639 (65.2%), while renter-occupied units make up 214,305 (34.8%).
| Occupancy | # Housing Units | % Housing Units |
| Owner Occupied Housing Units | 401,639 | 65.2% |
| Renter-Occupied Housing Units | 214,305 | 34.8% |
| Total Occupied Housing Units | 615,944 | 100.0% |
Occupancy by Household Size in Area Code 509
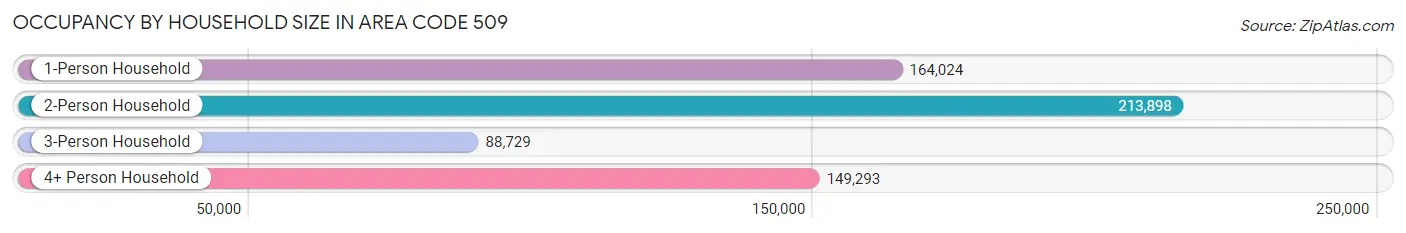
| Household Size | # Housing Units | % Housing Units |
| 1-Person Household | 164,024 | 26.6% |
| 2-Person Household | 213,898 | 34.7% |
| 3-Person Household | 88,729 | 14.4% |
| 4+ Person Household | 149,293 | 24.2% |
| Total Housing Units | 615,944 | 100.0% |
Occupancy by Ownership by Household Size in Area Code 509
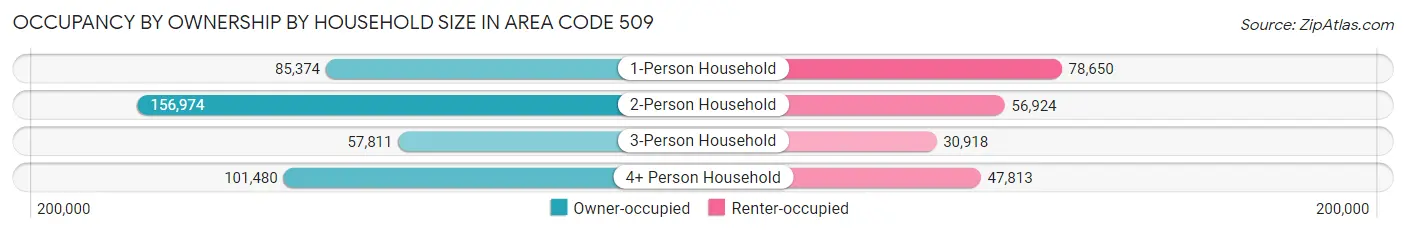
| Household Size | Owner-occupied | Renter-occupied |
| 1-Person Household | 85,374 (52.0%) | 78,650 (47.9%) |
| 2-Person Household | 156,974 (73.4%) | 56,924 (26.6%) |
| 3-Person Household | 57,811 (65.1%) | 30,918 (34.8%) |
| 4+ Person Household | 101,480 (68.0%) | 47,813 (32.0%) |
| Total Housing Units | 401,639 (65.2%) | 214,305 (34.8%) |
Occupancy by Educational Attainment in Area Code 509
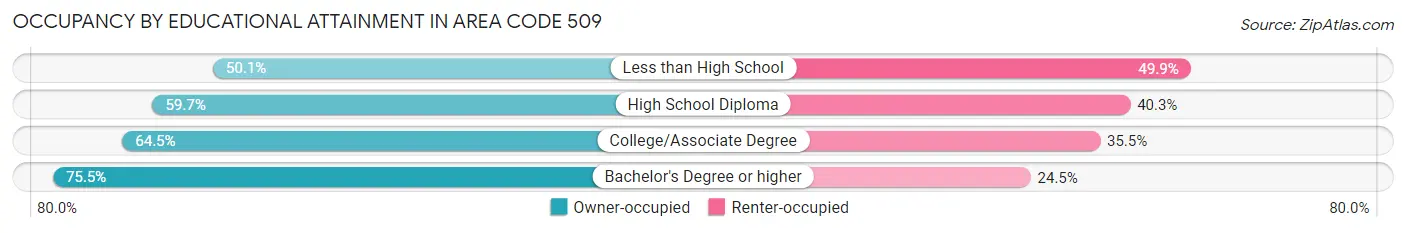
| Household Size | Owner-occupied | Renter-occupied |
| Less than High School | 31,603 (50.1%) | 31,444 (49.9%) |
| High School Diploma | 83,874 (59.7%) | 56,592 (40.3%) |
| College/Associate Degree | 147,747 (64.5%) | 81,347 (35.5%) |
| Bachelor's Degree or higher | 138,415 (75.5%) | 44,922 (24.5%) |
Occupancy by Age of Householder in Area Code 509
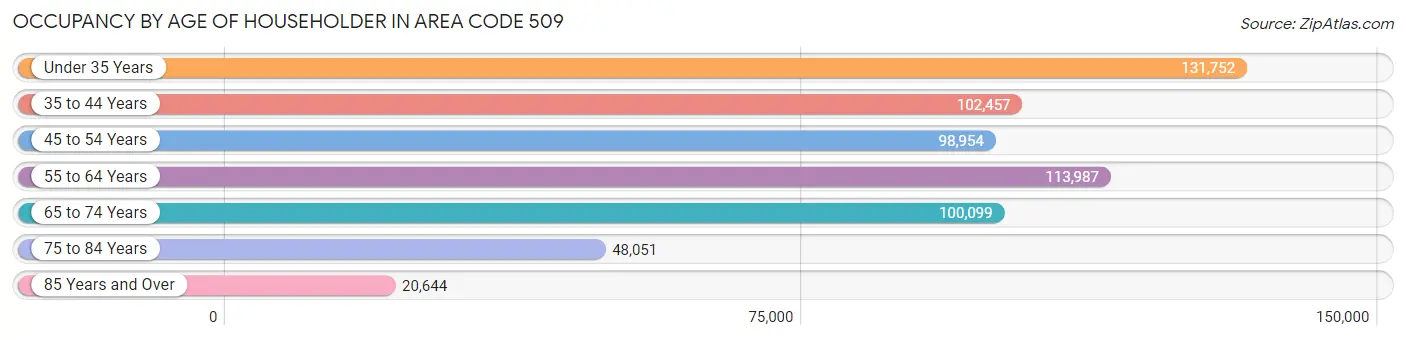
| Age Bracket | # Households | % Households |
| Under 35 Years | 131,752 | 21.4% |
| 35 to 44 Years | 102,457 | 16.6% |
| 45 to 54 Years | 98,954 | 16.1% |
| 55 to 64 Years | 113,987 | 18.5% |
| 65 to 74 Years | 100,099 | 16.3% |
| 75 to 84 Years | 48,051 | 7.8% |
| 85 Years and Over | 20,644 | 3.4% |
| Total | 615,944 | 100.0% |
Housing Finances in Area Code 509
Median Income by Occupancy in Area Code 509
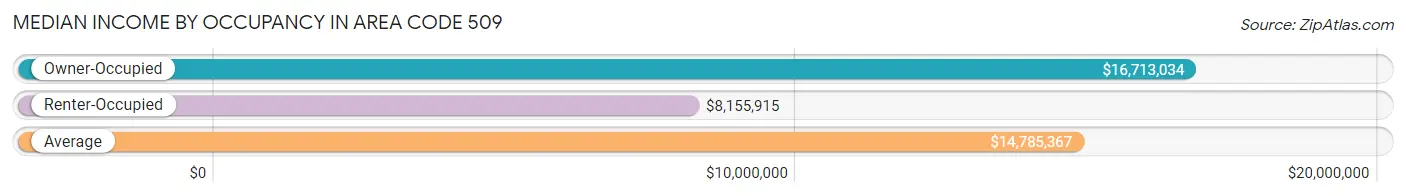
| Occupancy Type | # Households | Median Income |
| Owner-Occupied | 401,639 (65.2%) | $16,713,034 |
| Renter-Occupied | 214,305 (34.8%) | $8,155,915 |
| Average | 615,944 (100.0%) | $14,785,367 |
Occupancy by Householder Income Bracket in Area Code 509
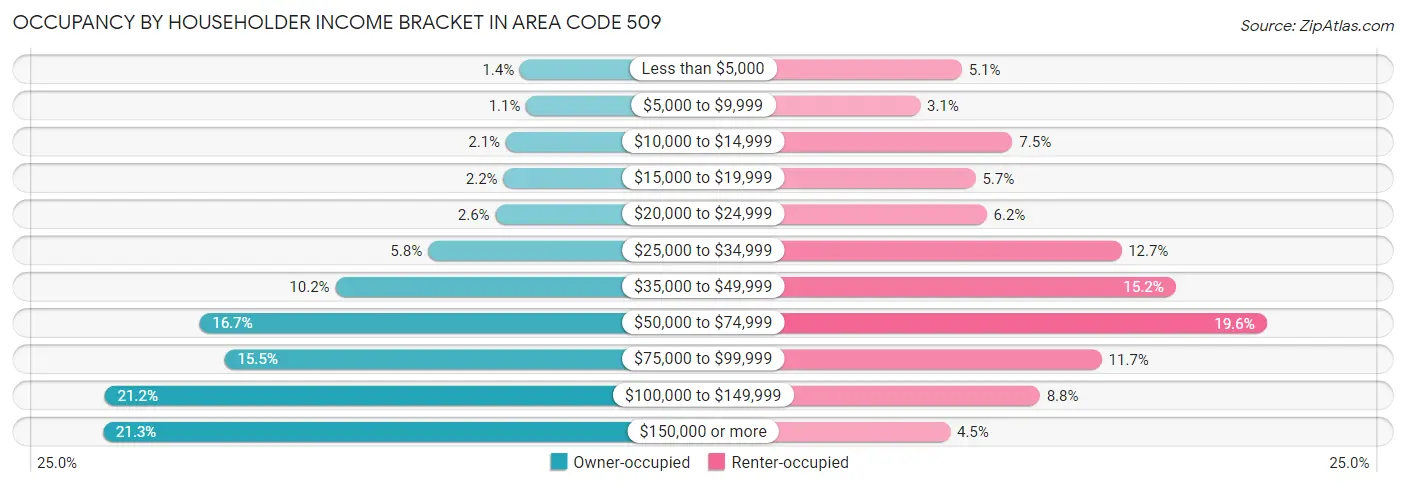
| Income Bracket | Owner-occupied | Renter-occupied |
| Less than $5,000 | 5,657 (1.4%) | 10,834 (5.1%) |
| $5,000 to $9,999 | 4,470 (1.1%) | 6,572 (3.1%) |
| $10,000 to $14,999 | 8,353 (2.1%) | 16,013 (7.5%) |
| $15,000 to $19,999 | 8,833 (2.2%) | 12,241 (5.7%) |
| $20,000 to $24,999 | 10,377 (2.6%) | 13,377 (6.2%) |
| $25,000 to $34,999 | 23,259 (5.8%) | 27,106 (12.7%) |
| $35,000 to $49,999 | 40,973 (10.2%) | 32,668 (15.2%) |
| $50,000 to $74,999 | 66,989 (16.7%) | 41,948 (19.6%) |
| $75,000 to $99,999 | 62,191 (15.5%) | 25,110 (11.7%) |
| $100,000 to $149,999 | 85,106 (21.2%) | 18,799 (8.8%) |
| $150,000 or more | 85,431 (21.3%) | 9,637 (4.5%) |
| Total | 401,639 (100.0%) | 214,305 (100.0%) |
Monthly Housing Cost Tiers in Area Code 509
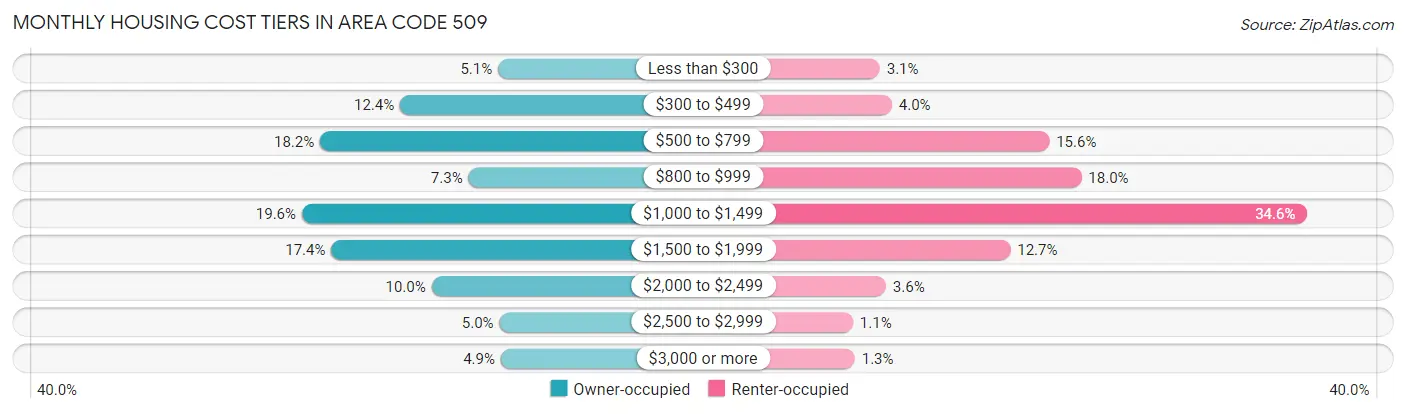
| Monthly Cost | Owner-occupied | Renter-occupied |
| Less than $300 | 20,599 (5.1%) | 6,696 (3.1%) |
| $300 to $499 | 49,596 (12.3%) | 8,598 (4.0%) |
| $500 to $799 | 73,251 (18.2%) | 33,423 (15.6%) |
| $800 to $999 | 29,352 (7.3%) | 38,513 (18.0%) |
| $1,000 to $1,499 | 78,624 (19.6%) | 74,141 (34.6%) |
| $1,500 to $1,999 | 69,936 (17.4%) | 27,277 (12.7%) |
| $2,000 to $2,499 | 40,270 (10.0%) | 7,652 (3.6%) |
| $2,500 to $2,999 | 20,197 (5.0%) | 2,445 (1.1%) |
| $3,000 or more | 19,814 (4.9%) | 2,736 (1.3%) |
| Total | 401,639 (100.0%) | 214,305 (100.0%) |
Physical Housing Characteristics in Area Code 509
Housing Structures in Area Code 509
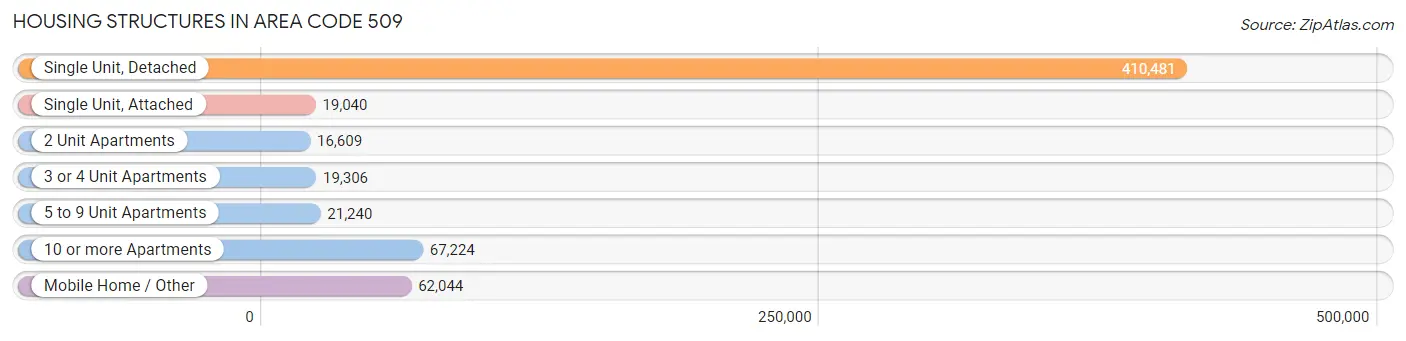
| Structure Type | # Housing Units | % Housing Units |
| Single Unit, Detached | 410,481 | 66.6% |
| Single Unit, Attached | 19,040 | 3.1% |
| 2 Unit Apartments | 16,609 | 2.7% |
| 3 or 4 Unit Apartments | 19,306 | 3.1% |
| 5 to 9 Unit Apartments | 21,240 | 3.5% |
| 10 or more Apartments | 67,224 | 10.9% |
| Mobile Home / Other | 62,044 | 10.1% |
| Total | 615,944 | 100.0% |
Housing Structures by Occupancy in Area Code 509
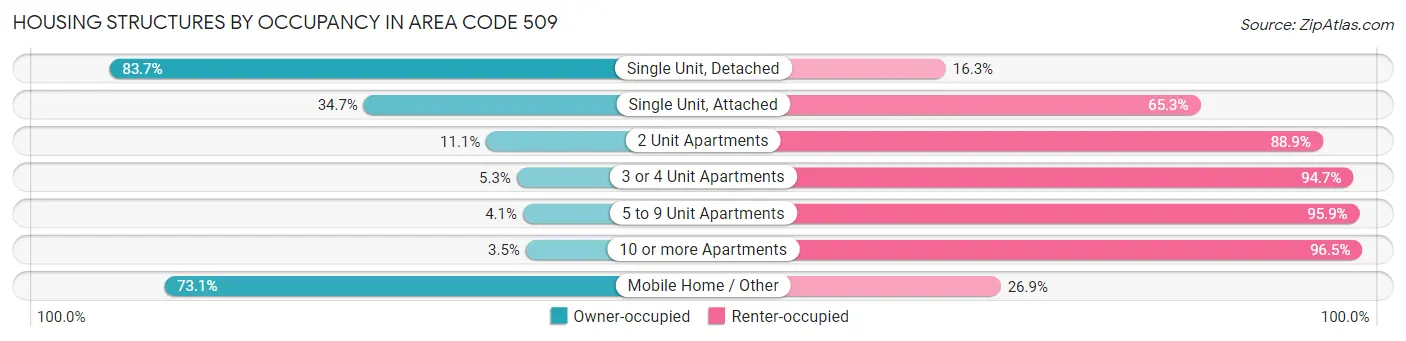
| Structure Type | Owner-occupied | Renter-occupied |
| Single Unit, Detached | 343,552 (83.7%) | 66,929 (16.3%) |
| Single Unit, Attached | 6,609 (34.7%) | 12,431 (65.3%) |
| 2 Unit Apartments | 1,850 (11.1%) | 14,759 (88.9%) |
| 3 or 4 Unit Apartments | 1,015 (5.3%) | 18,291 (94.7%) |
| 5 to 9 Unit Apartments | 865 (4.1%) | 20,375 (95.9%) |
| 10 or more Apartments | 2,374 (3.5%) | 64,850 (96.5%) |
| Mobile Home / Other | 45,374 (73.1%) | 16,670 (26.9%) |
| Total | 401,639 (65.2%) | 214,305 (34.8%) |
Housing Structures by Number of Rooms in Area Code 509
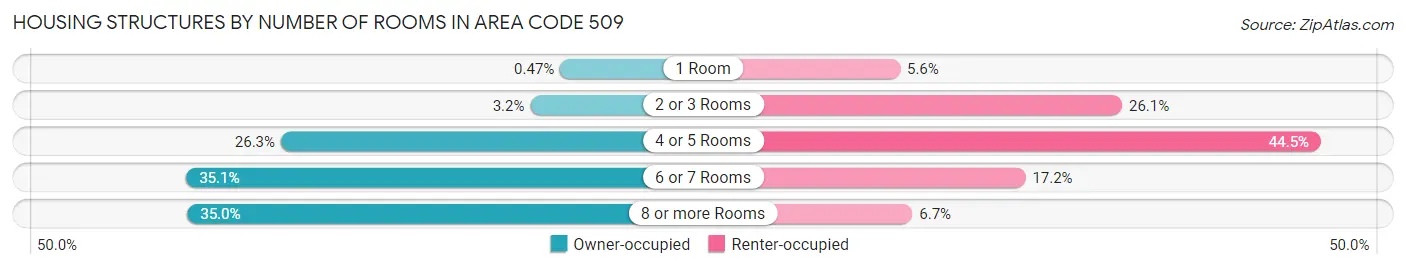
| Number of Rooms | Owner-occupied | Renter-occupied |
| 1 Room | 1,869 (0.5%) | 11,924 (5.6%) |
| 2 or 3 Rooms | 12,979 (3.2%) | 55,902 (26.1%) |
| 4 or 5 Rooms | 105,635 (26.3%) | 95,327 (44.5%) |
| 6 or 7 Rooms | 140,790 (35.0%) | 36,783 (17.2%) |
| 8 or more Rooms | 140,366 (34.9%) | 14,369 (6.7%) |
| Total | 401,639 (100.0%) | 214,305 (100.0%) |
Housing Structure by Heating Type in Area Code 509
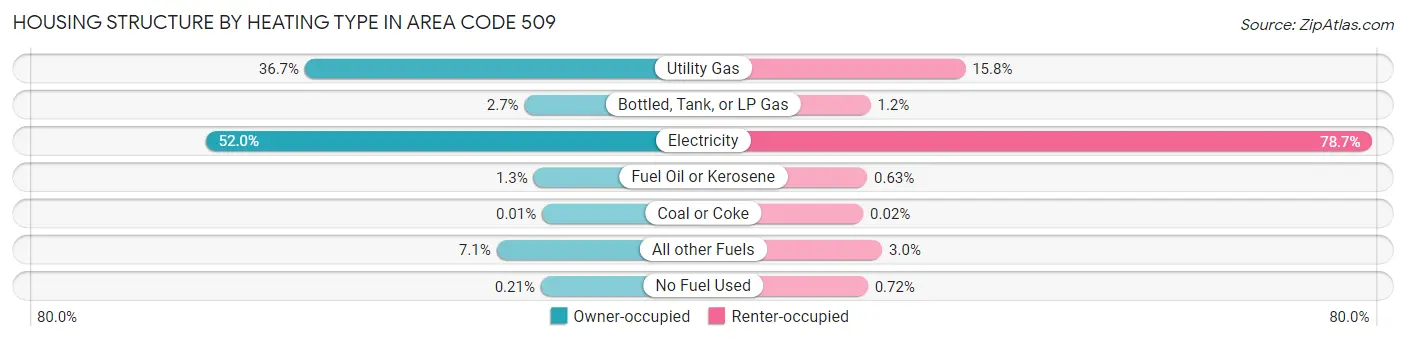
| Heating Type | Owner-occupied | Renter-occupied |
| Utility Gas | 147,268 (36.7%) | 33,866 (15.8%) |
| Bottled, Tank, or LP Gas | 10,977 (2.7%) | 2,489 (1.2%) |
| Electricity | 208,903 (52.0%) | 168,700 (78.7%) |
| Fuel Oil or Kerosene | 5,298 (1.3%) | 1,359 (0.6%) |
| Coal or Coke | 41 (0.0%) | 39 (0.0%) |
| All other Fuels | 28,321 (7.0%) | 6,315 (2.9%) |
| No Fuel Used | 831 (0.2%) | 1,537 (0.7%) |
| Total | 401,639 (100.0%) | 214,305 (100.0%) |
Household Vehicle Usage in Area Code 509
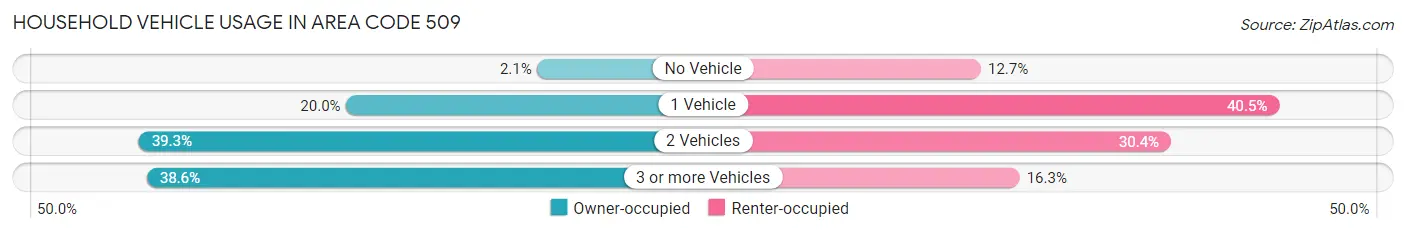
| Vehicles per Household | Owner-occupied | Renter-occupied |
| No Vehicle | 8,495 (2.1%) | 27,245 (12.7%) |
| 1 Vehicle | 80,157 (20.0%) | 86,873 (40.5%) |
| 2 Vehicles | 157,991 (39.3%) | 65,208 (30.4%) |
| 3 or more Vehicles | 154,996 (38.6%) | 34,979 (16.3%) |
| Total | 401,639 (100.0%) | 214,305 (100.0%) |
Real Estate & Mortgages in Area Code 509
Real Estate and Mortgage Overview in Area Code 509
| Characteristic | Without Mortgage | With Mortgage |
| Housing Units | 157,030 | 244,609 |
| Median Property Value | $53,540,199 | $63,049,300 |
| Median Household Income | $12,471,378 | $62,268 |
| Monthly Housing Costs | $106,906 | $19,537 |
| Real Estate Taxes | $430,268 | $6,934 |
Property Value by Mortgage Status in Area Code 509
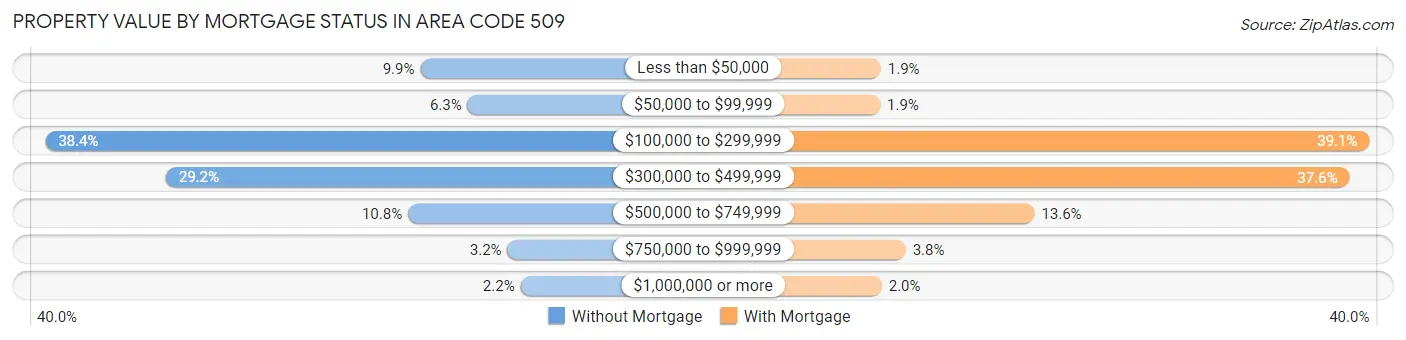
| Property Value | Without Mortgage | With Mortgage |
| Less than $50,000 | 15,466 (9.9%) | 4,714 (1.9%) |
| $50,000 to $99,999 | 9,822 (6.2%) | 4,564 (1.9%) |
| $100,000 to $299,999 | 60,354 (38.4%) | 95,728 (39.1%) |
| $300,000 to $499,999 | 45,914 (29.2%) | 92,037 (37.6%) |
| $500,000 to $749,999 | 16,951 (10.8%) | 33,347 (13.6%) |
| $750,000 to $999,999 | 5,039 (3.2%) | 9,337 (3.8%) |
| $1,000,000 or more | 3,484 (2.2%) | 4,882 (2.0%) |
| Total | 157,030 (100.0%) | 244,609 (100.0%) |
Household Income by Mortgage Status in Area Code 509
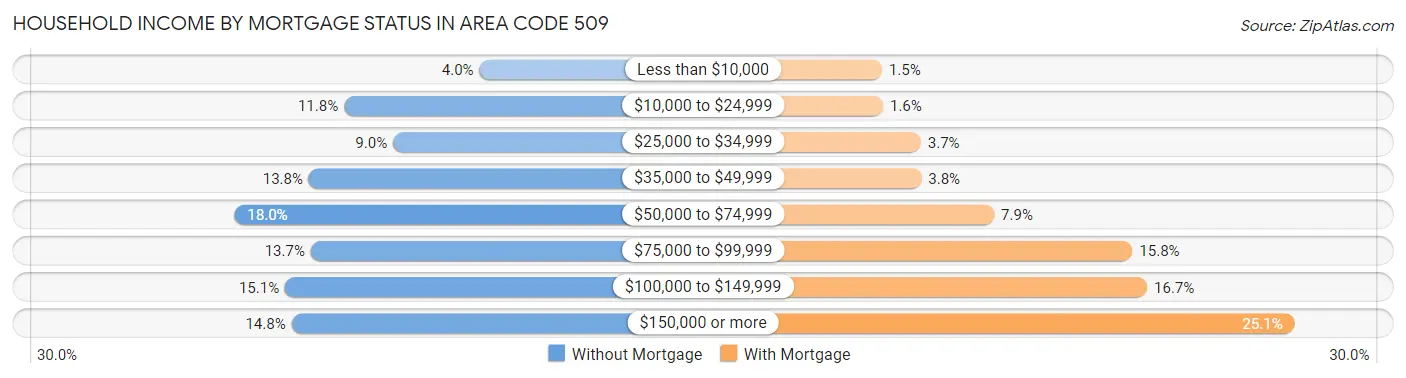
| Household Income | Without Mortgage | With Mortgage |
| Less than $10,000 | 6,291 (4.0%) | 3,705 (1.5%) |
| $10,000 to $24,999 | 18,449 (11.7%) | 3,836 (1.6%) |
| $25,000 to $34,999 | 14,058 (8.9%) | 9,114 (3.7%) |
| $35,000 to $49,999 | 21,607 (13.8%) | 9,201 (3.8%) |
| $50,000 to $74,999 | 28,286 (18.0%) | 19,366 (7.9%) |
| $75,000 to $99,999 | 21,432 (13.7%) | 38,703 (15.8%) |
| $100,000 to $149,999 | 23,744 (15.1%) | 40,759 (16.7%) |
| $150,000 or more | 23,163 (14.7%) | 61,362 (25.1%) |
| Total | 157,030 (100.0%) | 244,609 (100.0%) |
Property Value to Household Income Ratio in Area Code 509
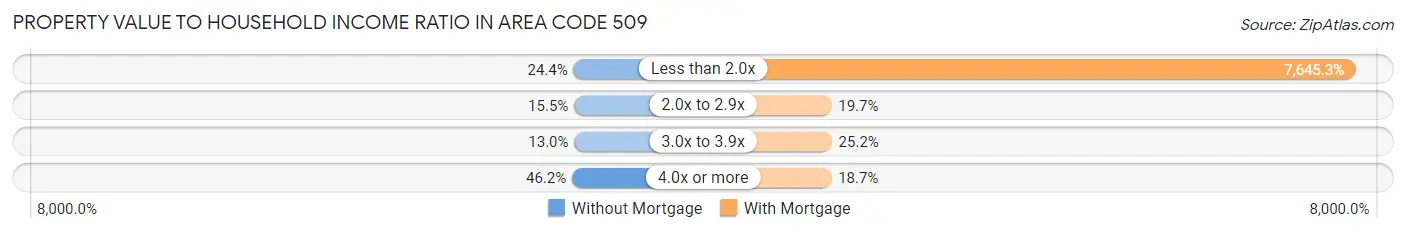
| Value-to-Income Ratio | Without Mortgage | With Mortgage |
| Less than 2.0x | 38,381 (24.4%) | 18,701,138 (7,645.3%) |
| 2.0x to 2.9x | 24,257 (15.4%) | 48,176 (19.7%) |
| 3.0x to 3.9x | 20,402 (13.0%) | 61,586 (25.2%) |
| 4.0x or more | 72,599 (46.2%) | 45,673 (18.7%) |
| Total | 157,030 (100.0%) | 244,609 (100.0%) |
Real Estate Taxes by Mortgage Status in Area Code 509
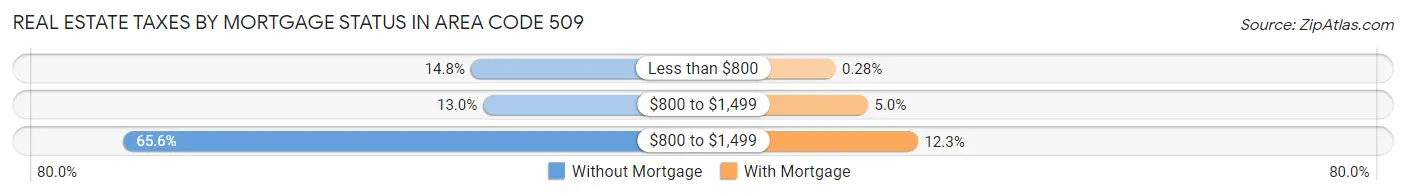
| Property Taxes | Without Mortgage | With Mortgage |
| Less than $800 | 23,256 (14.8%) | 684 (0.3%) |
| $800 to $1,499 | 20,430 (13.0%) | 12,331 (5.0%) |
| $800 to $1,499 | 102,951 (65.6%) | 30,179 (12.3%) |
| Total | 157,030 (100.0%) | 244,609 (100.0%) |
Health & Disability in Area Code 509
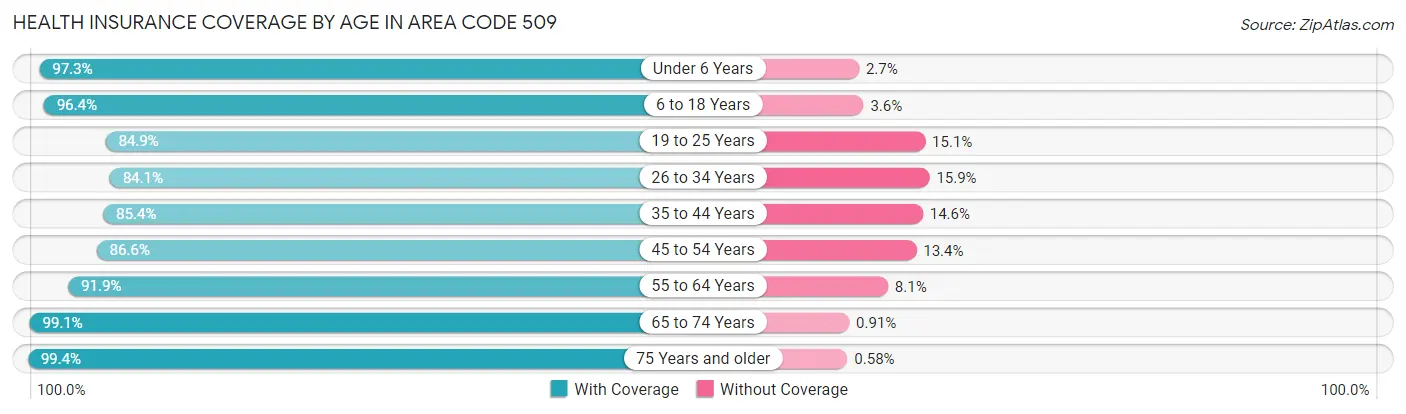
Health Insurance Coverage by Age in Area Code 509
| Age Bracket | With Coverage | Without Coverage |
| Under 6 Years | 122,040 (97.3%) | 3,442 (2.7%) |
| 6 to 18 Years | 291,653 (96.4%) | 10,841 (3.6%) |
| 19 to 25 Years | 139,190 (84.9%) | 24,709 (15.1%) |
| 26 to 34 Years | 166,418 (84.1%) | 31,417 (15.9%) |
| 35 to 44 Years | 172,003 (85.4%) | 29,490 (14.6%) |
| 45 to 54 Years | 157,317 (86.6%) | 24,381 (13.4%) |
| 55 to 64 Years | 182,901 (91.9%) | 16,193 (8.1%) |
| 65 to 74 Years | 160,338 (99.1%) | 1,479 (0.9%) |
| 75 Years and older | 102,552 (99.4%) | 597 (0.6%) |
| Total | 1,494,412 (91.3%) | 142,549 (8.7%) |
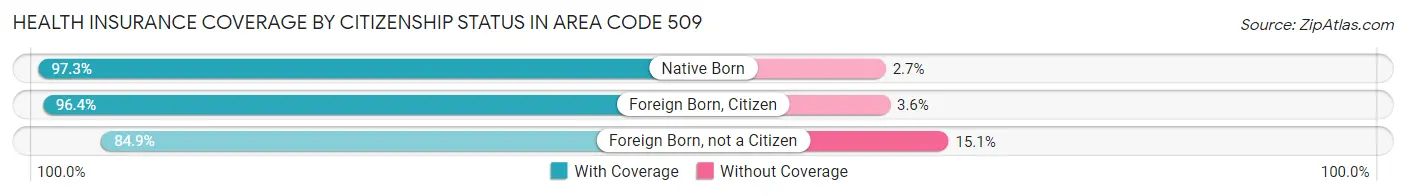
Health Insurance Coverage by Citizenship Status in Area Code 509
| Citizenship Status | With Coverage | Without Coverage |
| Native Born | 122,040 (97.3%) | 3,442 (2.7%) |
| Foreign Born, Citizen | 291,653 (96.4%) | 10,841 (3.6%) |
| Foreign Born, not a Citizen | 139,190 (84.9%) | 24,709 (15.1%) |
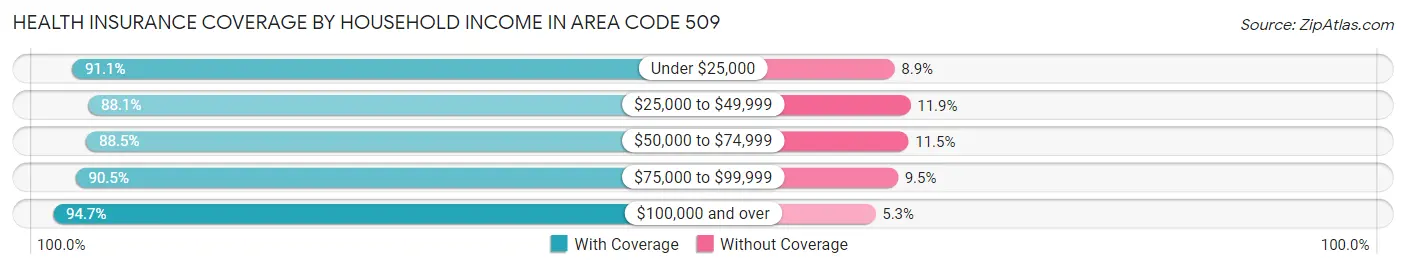
Health Insurance Coverage by Household Income in Area Code 509
| Household Income | With Coverage | Without Coverage |
| Under $25,000 | 152,180 (91.1%) | 14,891 (8.9%) |
| $25,000 to $49,999 | 242,575 (88.1%) | 32,755 (11.9%) |
| $50,000 to $74,999 | 250,167 (88.5%) | 32,560 (11.5%) |
| $75,000 to $99,999 | 224,662 (90.5%) | 23,689 (9.5%) |
| $100,000 and over | 602,020 (94.7%) | 33,979 (5.3%) |
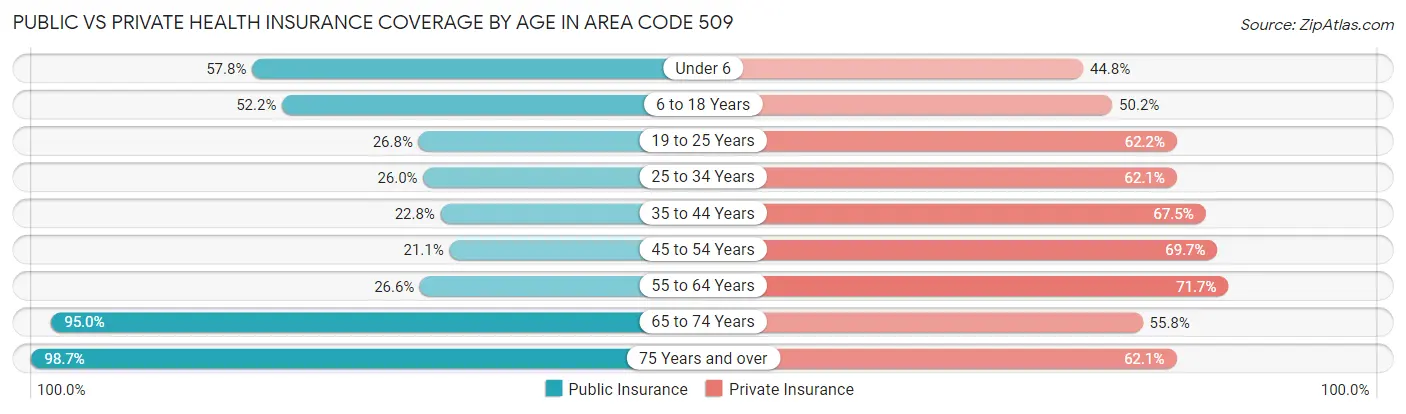
Public vs Private Health Insurance Coverage by Age in Area Code 509
| Age Bracket | Public Insurance | Private Insurance |
| Under 6 | 72,464 (57.8%) | 56,194 (44.8%) |
| 6 to 18 Years | 157,828 (52.2%) | 151,800 (50.2%) |
| 19 to 25 Years | 43,985 (26.8%) | 101,892 (62.2%) |
| 25 to 34 Years | 51,374 (26.0%) | 122,931 (62.1%) |
| 35 to 44 Years | 45,889 (22.8%) | 136,032 (67.5%) |
| 45 to 54 Years | 38,367 (21.1%) | 126,648 (69.7%) |
| 55 to 64 Years | 52,893 (26.6%) | 142,832 (71.7%) |
| 65 to 74 Years | 153,768 (95.0%) | 90,348 (55.8%) |
| 75 Years and over | 101,840 (98.7%) | 64,022 (62.1%) |
| Total | 718,408 (43.9%) | 992,699 (60.6%) |
Disability Status by Sex by Age in Area Code 509
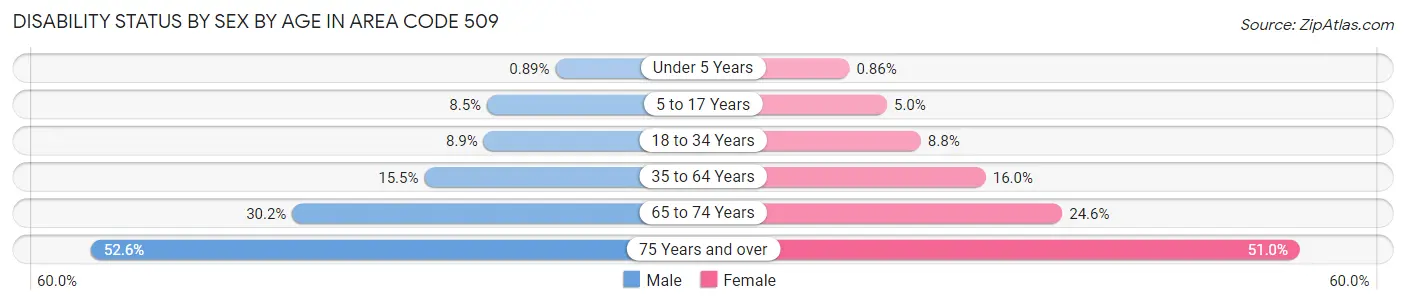
| Age Bracket | Male | Female |
| Under 5 Years | 469 (0.9%) | 439 (0.9%) |
| 5 to 17 Years | 13,071 (8.5%) | 7,374 (5.0%) |
| 18 to 34 Years | 17,524 (8.9%) | 16,649 (8.8%) |
| 35 to 64 Years | 45,280 (15.5%) | 46,501 (16.0%) |
| 65 to 74 Years | 23,822 (30.2%) | 20,368 (24.6%) |
| 75 Years and over | 23,564 (52.6%) | 29,769 (51.0%) |
Disability Class by Sex by Age in Area Code 509
Disability Class: Hearing Difficulty
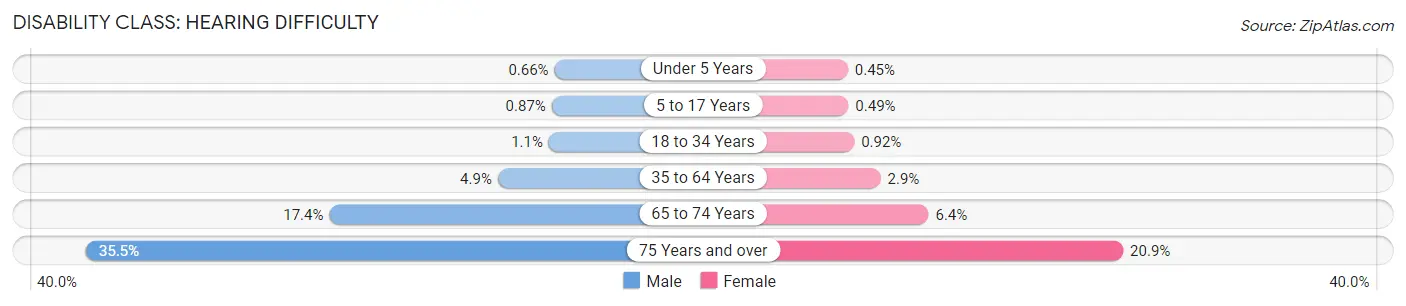
| Age Bracket | Male | Female |
| Under 5 Years | 347 (0.7%) | 227 (0.4%) |
| 5 to 17 Years | 1,340 (0.9%) | 723 (0.5%) |
| 18 to 34 Years | 2,139 (1.1%) | 1,747 (0.9%) |
| 35 to 64 Years | 14,253 (4.9%) | 8,356 (2.9%) |
| 65 to 74 Years | 13,708 (17.4%) | 5,343 (6.4%) |
| 75 Years and over | 15,877 (35.4%) | 12,192 (20.9%) |
Disability Class: Vision Difficulty
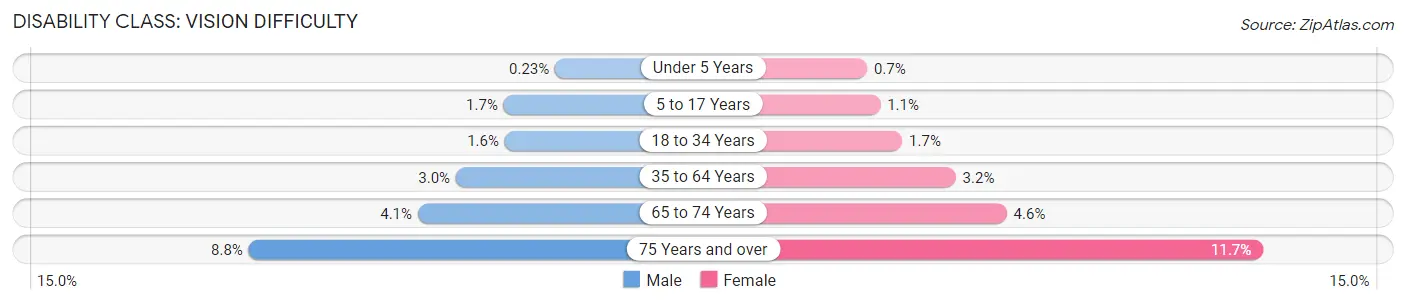
| Age Bracket | Male | Female |
| Under 5 Years | 122 (0.2%) | 357 (0.7%) |
| 5 to 17 Years | 2,551 (1.7%) | 1,562 (1.1%) |
| 18 to 34 Years | 3,211 (1.6%) | 3,181 (1.7%) |
| 35 to 64 Years | 8,748 (3.0%) | 9,202 (3.2%) |
| 65 to 74 Years | 3,198 (4.1%) | 3,803 (4.6%) |
| 75 Years and over | 3,925 (8.8%) | 6,845 (11.7%) |
Disability Class: Cognitive Difficulty
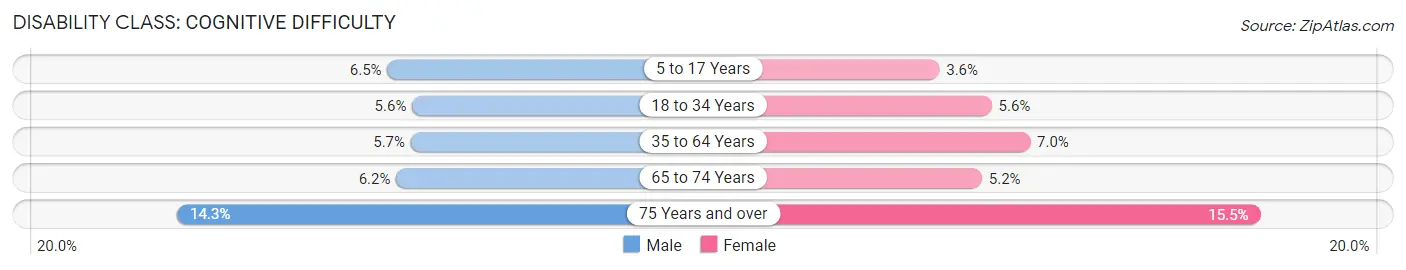
| Age Bracket | Male | Female |
| 5 to 17 Years | 10,030 (6.5%) | 5,300 (3.6%) |
| 18 to 34 Years | 11,069 (5.6%) | 10,507 (5.6%) |
| 35 to 64 Years | 16,542 (5.7%) | 20,253 (7.0%) |
| 65 to 74 Years | 4,888 (6.2%) | 4,314 (5.2%) |
| 75 Years and over | 6,424 (14.3%) | 9,071 (15.5%) |
Disability Class: Ambulatory Difficulty
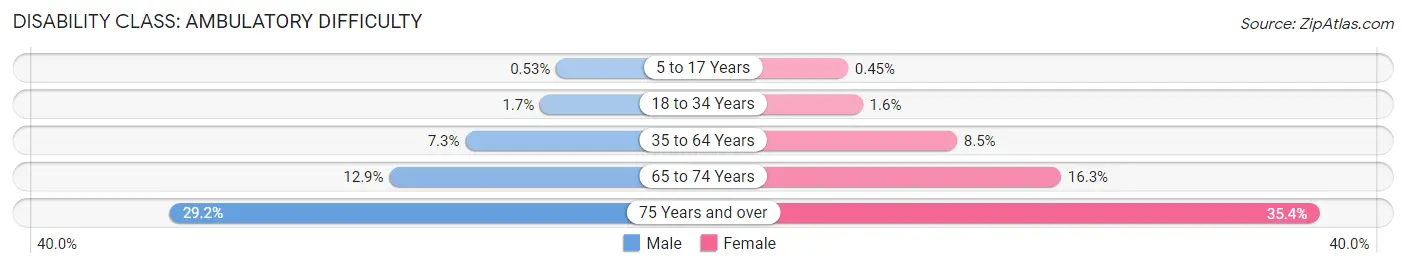
| Age Bracket | Male | Female |
| 5 to 17 Years | 813 (0.5%) | 653 (0.4%) |
| 18 to 34 Years | 3,422 (1.7%) | 2,932 (1.5%) |
| 35 to 64 Years | 21,295 (7.3%) | 24,746 (8.5%) |
| 65 to 74 Years | 10,188 (12.9%) | 13,493 (16.3%) |
| 75 Years and over | 13,086 (29.2%) | 20,673 (35.4%) |
Disability Class: Self-Care Difficulty
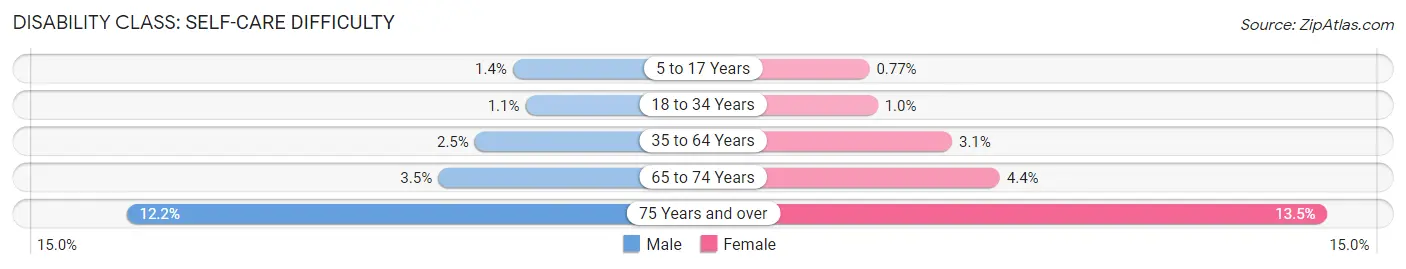
| Age Bracket | Male | Female |
| 5 to 17 Years | 2,162 (1.4%) | 1,122 (0.8%) |
| 18 to 34 Years | 2,097 (1.1%) | 1,881 (1.0%) |
| 35 to 64 Years | 7,228 (2.5%) | 8,902 (3.1%) |
| 65 to 74 Years | 2,752 (3.5%) | 3,646 (4.4%) |
| 75 Years and over | 5,448 (12.2%) | 7,887 (13.5%) |
Technology Access in Area Code 509
Computing Device Access in Area Code 509
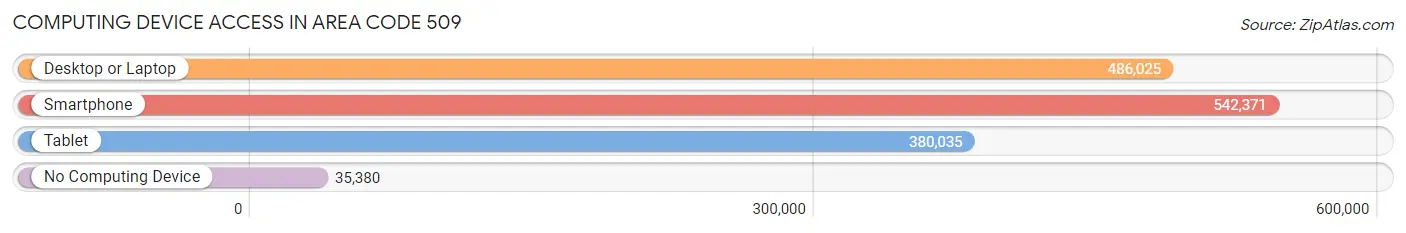
| Device Type | # Households | % Households |
| Desktop or Laptop | 486,025 | 78.9% |
| Smartphone | 542,371 | 88.1% |
| Tablet | 380,035 | 61.7% |
| No Computing Device | 35,380 | 5.7% |
| Total | 615,944 | 100.0% |
Internet Access in Area Code 509
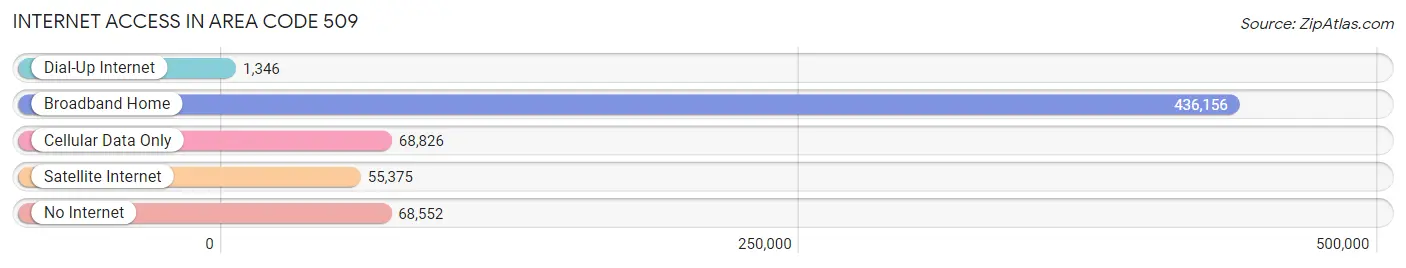
| Internet Type | # Households | % Households |
| Dial-Up Internet | 1,346 | 0.2% |
| Broadband Home | 436,156 | 70.8% |
| Cellular Data Only | 68,826 | 11.2% |
| Satellite Internet | 55,375 | 9.0% |
| No Internet | 68,552 | 11.1% |
| Total | 615,944 | 100.0% |
Area Code 509 Summary
Geography
Area code 509 is located in the state of Washington in the Pacific Time Zone. It covers the eastern part of the state, including Spokane, Yakima, Walla Walla, and the Tri-Cities.
Social
Area code 509 is home to a diverse population of people from all walks of life. The area is known for its outdoor activities, such as skiing, hiking, and camping. It is also home to a vibrant music and arts scene, with many local venues and festivals.
Economics
Area code 509 is home to a variety of industries, including agriculture, manufacturing, and technology. The area is also home to several universities and colleges, providing educational opportunities for students.
Demographics
Area code 509 is home to a population of over 1.7 million people. The population is diverse, with a mix of races and ethnicities. The median household income is around $50,000, and the unemployment rate is around 4%.
Common Questions
What is the Total Population of Area Code 509?
Total Population of Area Code 509 is 1,658,251.
What is the Total Male Population of Area Code 509?
Total Male Population of Area Code 509 is 835,818.
What is the Total Female Population of Area Code 509?
Total Female Population of Area Code 509 is 822,433.
What is the Ratio of Males per 100 Females in Area Code 509?
There are 101.63 Males per 100 Females in Area Code 509.
What is the Ratio of Females per 100 Males in Area Code 509?
There are 98.40 Females per 100 Males in Area Code 509.
What is the Median Population Age in Area Code 509?
Median Population Age in Area Code 509 is 43.2 Years.
What is the Average Family Size in Area Code 509
Average Family Size in Area Code 509 is 3.0 People.
What is the Average Household Size in Area Code 509
Average Household Size in Area Code 509 is 2.5 People.
What is Per Capita Income in Area Code 509?
Per Capita income in Area Code 509 is $34,238.
What is the Median Family Income in Area Code 509?
Median Family Income in Area Code 509 is $81,234.
What is the Median Household income in Area Code 509?
Median Household Income in Area Code 509 is $67,513.
What is Income or Wage Gap in Area Code 509?
Income or Wage Gap in Area Code 509 is 29.2%.
Women in Area Code 509 earn 70.8 cents for every dollar earned by a man.
What is Family Income Deficit in Area Code 509?
Family Income Deficit in Area Code 509 is $10,753.
Families that are below poverty line in Area Code 509 earn $10,753 less on average than the poverty threshold level.
What is Inequality or Gini Index in Area Code 509?
Inequality or Gini Index in Area Code 509 is 94.10.
How Large is the Labor Force in Area Code 509?
There are 728,171 People in the Labor Forcein in Area Code 509.
What is the Percentage of People in the Labor Force in Area Code 509?
56.0% of People are in the Labor Force in Area Code 509.
What is the Unemployment Rate in Area Code 509?
Unemployment Rate in Area Code 509 is 6.9%.