Yakima County, WA
Yakima County Map
Yakima County Overview
256,143
TOTAL POPULATION
128,661
MALE POPULATION
127,482
FEMALE POPULATION
100.92
MALES / 100 FEMALES
99.08
FEMALES / 100 MALES
33.0
MEDIAN AGE
3.5
AVG FAMILY SIZE
3.0
AVG HOUSEHOLD SIZE
$27,448
PER CAPITA INCOME
$73,344
AVG FAMILY INCOME
$64,910
AVG HOUSEHOLD INCOME
25.4%
WAGE / INCOME GAP [ % ]
74.6¢/ $1
WAGE / INCOME GAP [ $ ]
$10,734
FAMILY INCOME DEFICIT
0.42
INEQUALITY / GINI INDEX
117,423
LABOR FORCE [ PEOPLE ]
62.1%
PERCENT IN LABOR FORCE
7.2%
UNEMPLOYMENT RATE
Yakima County Area Codes
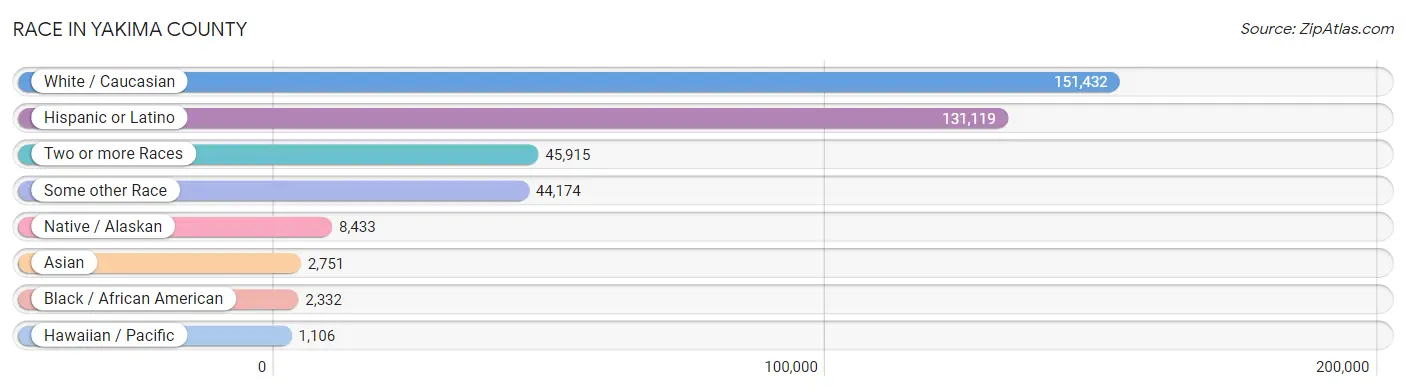
Race in Yakima County
The most populous races in Yakima County are White / Caucasian (151,432 | 59.1%), Hispanic or Latino (131,119 | 51.2%), and Two or more Races (45,915 | 17.9%).
| Race | # Population | % Population |
| Asian | 2,751 | 1.1% |
| Black / African American | 2,332 | 0.9% |
| Hawaiian / Pacific | 1,106 | 0.4% |
| Hispanic or Latino | 131,119 | 51.2% |
| Native / Alaskan | 8,433 | 3.3% |
| White / Caucasian | 151,432 | 59.1% |
| Two or more Races | 45,915 | 17.9% |
| Some other Race | 44,174 | 17.2% |
| Total | 256,143 | 100.0% |
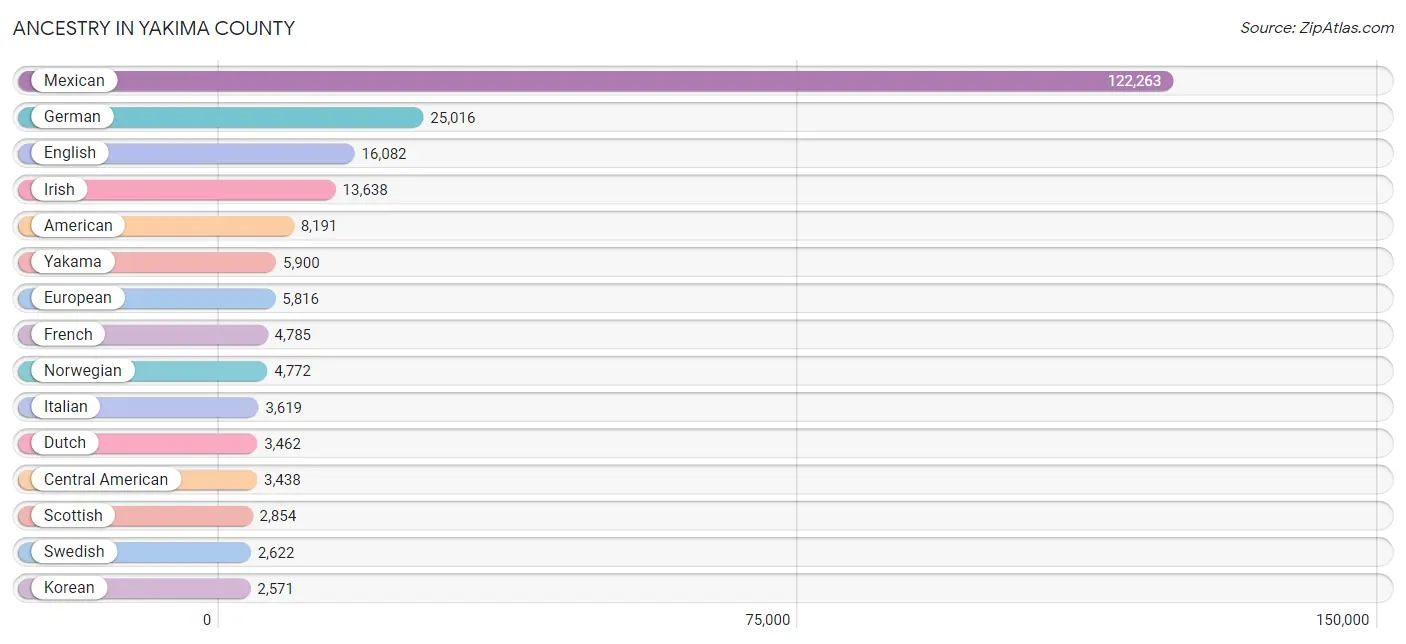
Ancestry in Yakima County
The most populous ancestries reported in Yakima County are Mexican (122,263 | 47.7%), German (25,016 | 9.8%), English (16,082 | 6.3%), Irish (13,638 | 5.3%), and American (8,191 | 3.2%), together accounting for 72.3% of all Yakima County residents.
| Ancestry | # Population | % Population |
| African | 795 | 0.3% |
| Alaska Native | 97 | 0.0% |
| Alaskan Athabascan | 87 | 0.0% |
| Albanian | 1 | 0.0% |
| Aleut | 6 | 0.0% |
| American | 8,191 | 3.2% |
| Apache | 136 | 0.1% |
| Arab | 331 | 0.1% |
| Armenian | 131 | 0.1% |
| Australian | 29 | 0.0% |
| Austrian | 197 | 0.1% |
| Basque | 61 | 0.0% |
| Belgian | 140 | 0.1% |
| Belizean | 24 | 0.0% |
| Bhutanese | 871 | 0.3% |
| Blackfeet | 918 | 0.4% |
| Bolivian | 121 | 0.1% |
| Brazilian | 98 | 0.0% |
| British | 1,559 | 0.6% |
| Bulgarian | 87 | 0.0% |
| Burmese | 465 | 0.2% |
| Cambodian | 10 | 0.0% |
| Canadian | 589 | 0.2% |
| Celtic | 24 | 0.0% |
| Central American | 3,438 | 1.3% |
| Central American Indian | 253 | 0.1% |
| Cherokee | 1,076 | 0.4% |
| Chickasaw | 291 | 0.1% |
| Chilean | 67 | 0.0% |
| Chippewa | 325 | 0.1% |
| Choctaw | 123 | 0.1% |
| Colombian | 169 | 0.1% |
| Colville | 227 | 0.1% |
| Costa Rican | 469 | 0.2% |
| Cree | 13 | 0.0% |
| Creek | 117 | 0.1% |
| Croatian | 200 | 0.1% |
| Crow | 44 | 0.0% |
| Cuban | 166 | 0.1% |
| Czech | 362 | 0.1% |
| Czechoslovakian | 142 | 0.1% |
| Danish | 749 | 0.3% |
| Delaware | 6 | 0.0% |
| Dominican | 146 | 0.1% |
| Dutch | 3,462 | 1.3% |
| Eastern European | 216 | 0.1% |
| Ecuadorian | 99 | 0.0% |
| Egyptian | 36 | 0.0% |
| English | 16,082 | 6.3% |
| Ethiopian | 59 | 0.0% |
| European | 5,816 | 2.3% |
| Fijian | 43 | 0.0% |
| Finnish | 693 | 0.3% |
| French | 4,785 | 1.9% |
| French American Indian | 89 | 0.0% |
| French Canadian | 1,289 | 0.5% |
| German | 25,016 | 9.8% |
| German Russian | 53 | 0.0% |
| Ghanaian | 5 | 0.0% |
| Greek | 574 | 0.2% |
| Guamanian / Chamorro | 157 | 0.1% |
| Guatemalan | 584 | 0.2% |
| Haitian | 37 | 0.0% |
| Honduran | 505 | 0.2% |
| Hopi | 4 | 0.0% |
| Hungarian | 406 | 0.2% |
| Icelander | 28 | 0.0% |
| Indian (Asian) | 509 | 0.2% |
| Indonesian | 61 | 0.0% |
| Inupiat | 21 | 0.0% |
| Iranian | 40 | 0.0% |
| Irish | 13,638 | 5.3% |
| Iroquois | 27 | 0.0% |
| Israeli | 41 | 0.0% |
| Italian | 3,619 | 1.4% |
| Jamaican | 94 | 0.0% |
| Japanese | 15 | 0.0% |
| Korean | 2,571 | 1.0% |
| Latvian | 67 | 0.0% |
| Lebanese | 86 | 0.0% |
| Lithuanian | 70 | 0.0% |
| Luxembourger | 25 | 0.0% |
| Macedonian | 25 | 0.0% |
| Maltese | 16 | 0.0% |
| Marshallese | 329 | 0.1% |
| Mexican | 122,263 | 47.7% |
| Mexican American Indian | 990 | 0.4% |
| Native Hawaiian | 711 | 0.3% |
| Navajo | 106 | 0.0% |
| Nicaraguan | 229 | 0.1% |
| Nigerian | 52 | 0.0% |
| Northern European | 196 | 0.1% |
| Norwegian | 4,772 | 1.9% |
| Okinawan | 2 | 0.0% |
| Osage | 4 | 0.0% |
| Paiute | 35 | 0.0% |
| Pakistani | 5 | 0.0% |
| Panamanian | 32 | 0.0% |
| Pennsylvania German | 76 | 0.0% |
| Peruvian | 52 | 0.0% |
| Pima | 9 | 0.0% |
| Polish | 1,184 | 0.5% |
| Portuguese | 254 | 0.1% |
| Potawatomi | 264 | 0.1% |
| Pueblo | 23 | 0.0% |
| Puerto Rican | 689 | 0.3% |
| Puget Sound Salish | 469 | 0.2% |
| Romanian | 22 | 0.0% |
| Russian | 1,037 | 0.4% |
| Salvadoran | 1,619 | 0.6% |
| Samoan | 160 | 0.1% |
| Scandinavian | 1,451 | 0.6% |
| Scotch-Irish | 1,321 | 0.5% |
| Scottish | 2,854 | 1.1% |
| Seminole | 38 | 0.0% |
| Shoshone | 25 | 0.0% |
| Sioux | 411 | 0.2% |
| Slovak | 27 | 0.0% |
| Slovene | 7 | 0.0% |
| South African | 3 | 0.0% |
| South American | 508 | 0.2% |
| South American Indian | 20 | 0.0% |
| Spaniard | 398 | 0.2% |
| Spanish | 863 | 0.3% |
| Spanish American Indian | 6 | 0.0% |
| Sri Lankan | 490 | 0.2% |
| Subsaharan African | 943 | 0.4% |
| Swedish | 2,622 | 1.0% |
| Swiss | 651 | 0.3% |
| Thai | 180 | 0.1% |
| Tlingit-Haida | 81 | 0.0% |
| Tsimshian | 6 | 0.0% |
| Turkish | 66 | 0.0% |
| Ukrainian | 225 | 0.1% |
| Ute | 16 | 0.0% |
| Welsh | 813 | 0.3% |
| Yakama | 5,900 | 2.3% |
| Yaqui | 49 | 0.0% |
| Yugoslavian | 27 | 0.0% |
| Yuman | 2 | 0.0% |
| Yup'ik | 22 | 0.0% | View All 141 Rows |
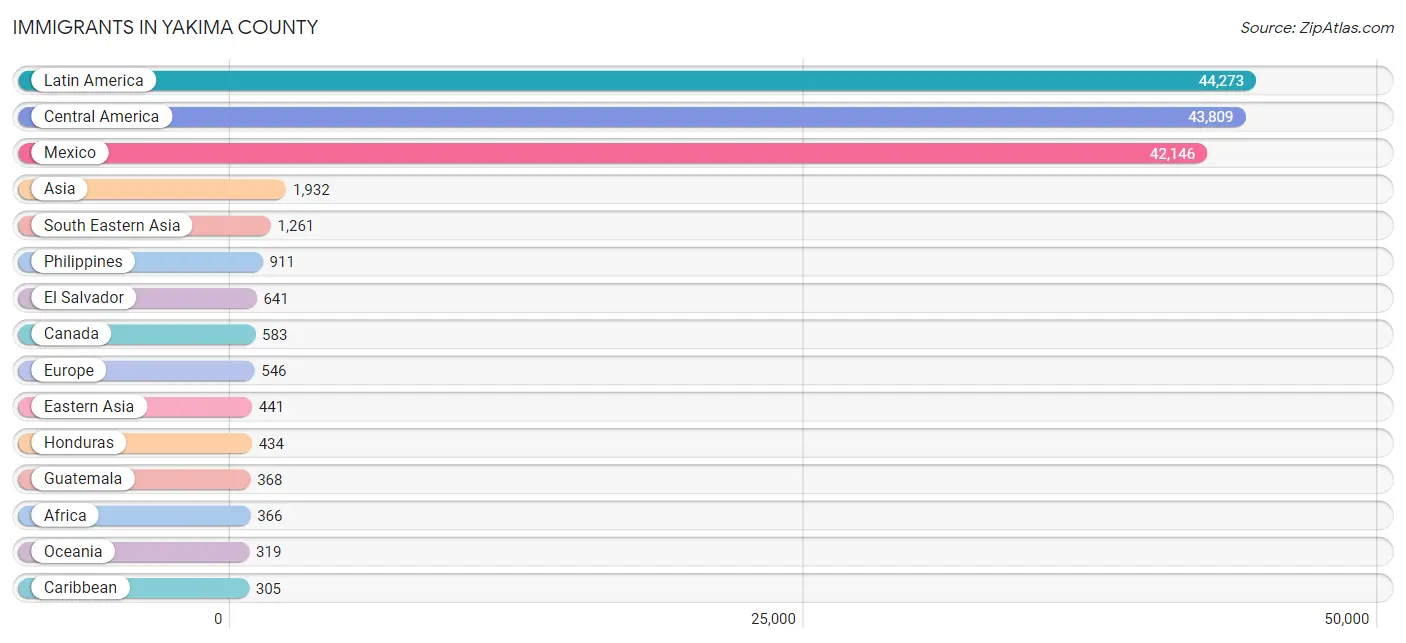
Immigrants in Yakima County
The most numerous immigrant groups reported in Yakima County came from Latin America (44,273 | 17.3%), Central America (43,809 | 17.1%), Mexico (42,146 | 16.5%), Asia (1,932 | 0.7%), and South Eastern Asia (1,261 | 0.5%), together accounting for 52.1% of all Yakima County residents.
| Immigration Origin | # Population | % Population |
| Africa | 366 | 0.1% |
| Asia | 1,932 | 0.7% |
| Australia | 8 | 0.0% |
| Bolivia | 13 | 0.0% |
| Brazil | 40 | 0.0% |
| Cambodia | 28 | 0.0% |
| Canada | 583 | 0.2% |
| Caribbean | 305 | 0.1% |
| Central America | 43,809 | 17.1% |
| Chile | 6 | 0.0% |
| China | 235 | 0.1% |
| Colombia | 66 | 0.0% |
| Costa Rica | 166 | 0.1% |
| Cuba | 124 | 0.1% |
| Czechoslovakia | 34 | 0.0% |
| Dominican Republic | 30 | 0.0% |
| Eastern Africa | 71 | 0.0% |
| Eastern Asia | 441 | 0.2% |
| Eastern Europe | 106 | 0.0% |
| Egypt | 1 | 0.0% |
| El Salvador | 641 | 0.3% |
| England | 76 | 0.0% |
| Ethiopia | 59 | 0.0% |
| Europe | 546 | 0.2% |
| Fiji | 23 | 0.0% |
| Germany | 163 | 0.1% |
| Guatemala | 368 | 0.1% |
| Haiti | 37 | 0.0% |
| Honduras | 434 | 0.2% |
| Hong Kong | 21 | 0.0% |
| India | 20 | 0.0% |
| Iran | 77 | 0.0% |
| Ireland | 40 | 0.0% |
| Italy | 9 | 0.0% |
| Jamaica | 114 | 0.0% |
| Japan | 12 | 0.0% |
| Jordan | 64 | 0.0% |
| Korea | 194 | 0.1% |
| Latin America | 44,273 | 17.3% |
| Mexico | 42,146 | 16.5% |
| Micronesia | 245 | 0.1% |
| Moldova | 10 | 0.0% |
| Nepal | 18 | 0.0% |
| Netherlands | 60 | 0.0% |
| Nicaragua | 54 | 0.0% |
| Northern Africa | 8 | 0.0% |
| Northern Europe | 152 | 0.1% |
| Oceania | 319 | 0.1% |
| Peru | 34 | 0.0% |
| Philippines | 911 | 0.4% |
| Portugal | 7 | 0.0% |
| Russia | 27 | 0.0% |
| Scotland | 12 | 0.0% |
| Singapore | 2 | 0.0% |
| South Africa | 50 | 0.0% |
| South America | 159 | 0.1% |
| South Central Asia | 115 | 0.0% |
| South Eastern Asia | 1,261 | 0.5% |
| Southern Europe | 43 | 0.0% |
| Spain | 27 | 0.0% |
| Sudan | 7 | 0.0% |
| Sweden | 24 | 0.0% |
| Switzerland | 22 | 0.0% |
| Taiwan | 45 | 0.0% |
| Thailand | 32 | 0.0% |
| Turkey | 24 | 0.0% |
| Uganda | 1 | 0.0% |
| Ukraine | 35 | 0.0% |
| Vietnam | 227 | 0.1% |
| Western Africa | 31 | 0.0% |
| Western Asia | 98 | 0.0% |
| Western Europe | 245 | 0.1% | View All 72 Rows |
Sex and Age in Yakima County
Sex and Age in Yakima County
The most populous age groups in Yakima County are 10 to 14 Years (11,230 | 8.7%) for men and 10 to 14 Years (11,024 | 8.6%) for women.
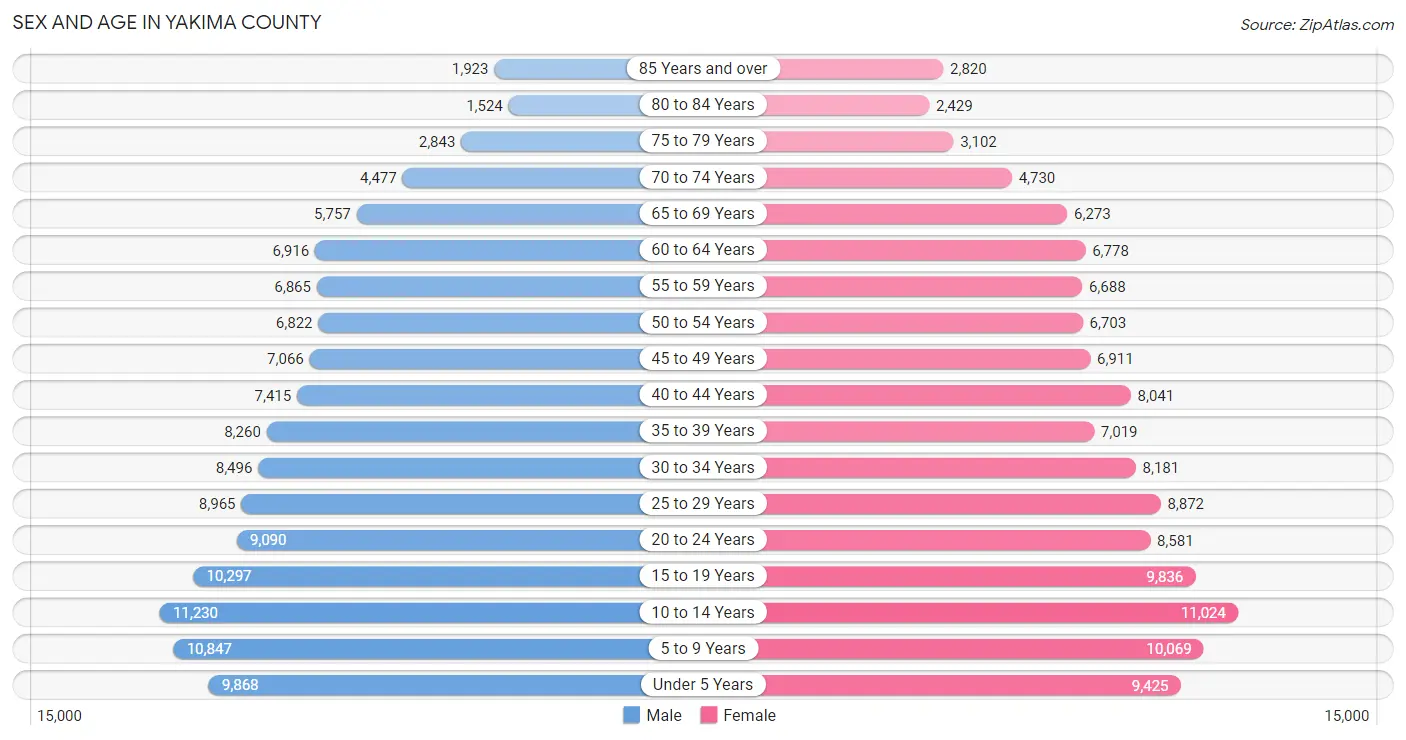
| Age Bracket | Male | Female |
| Under 5 Years | 9,868 (7.7%) | 9,425 (7.4%) |
| 5 to 9 Years | 10,847 (8.4%) | 10,069 (7.9%) |
| 10 to 14 Years | 11,230 (8.7%) | 11,024 (8.6%) |
| 15 to 19 Years | 10,297 (8.0%) | 9,836 (7.7%) |
| 20 to 24 Years | 9,090 (7.1%) | 8,581 (6.7%) |
| 25 to 29 Years | 8,965 (7.0%) | 8,872 (7.0%) |
| 30 to 34 Years | 8,496 (6.6%) | 8,181 (6.4%) |
| 35 to 39 Years | 8,260 (6.4%) | 7,019 (5.5%) |
| 40 to 44 Years | 7,415 (5.8%) | 8,041 (6.3%) |
| 45 to 49 Years | 7,066 (5.5%) | 6,911 (5.4%) |
| 50 to 54 Years | 6,822 (5.3%) | 6,703 (5.3%) |
| 55 to 59 Years | 6,865 (5.3%) | 6,688 (5.2%) |
| 60 to 64 Years | 6,916 (5.4%) | 6,778 (5.3%) |
| 65 to 69 Years | 5,757 (4.5%) | 6,273 (4.9%) |
| 70 to 74 Years | 4,477 (3.5%) | 4,730 (3.7%) |
| 75 to 79 Years | 2,843 (2.2%) | 3,102 (2.4%) |
| 80 to 84 Years | 1,524 (1.2%) | 2,429 (1.9%) |
| 85 Years and over | 1,923 (1.5%) | 2,820 (2.2%) |
| Total | 128,661 (100.0%) | 127,482 (100.0%) |
Families and Households in Yakima County
Median Family Size in Yakima County
The median family size in Yakima County is 3.48 persons per family, with married-couple families (42,367 | 69.2%) accounting for the largest median family size of 3.52 persons per family. On the other hand, single male/father families (6,035 | 9.9%) represent the smallest median family size with 3.24 persons per family.
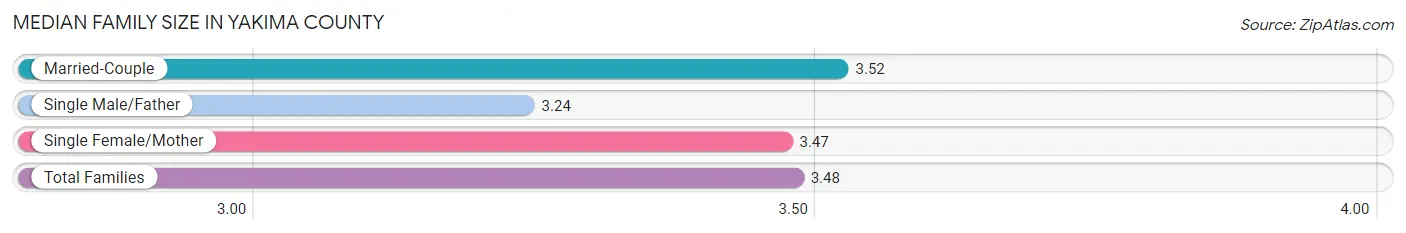
| Family Type | # Families | Family Size |
| Married-Couple | 42,367 (69.2%) | 3.52 |
| Single Male/Father | 6,035 (9.9%) | 3.24 |
| Single Female/Mother | 12,816 (20.9%) | 3.47 |
| Total Families | 61,218 (100.0%) | 3.48 |
Median Household Size in Yakima County
The median household size in Yakima County is 2.95 persons per household, with single male/father households (6,035 | 7.0%) accounting for the largest median household size of 3.78 persons per household. non-family households (24,340 | 28.4%) represent the smallest median household size with 1.23 persons per household.
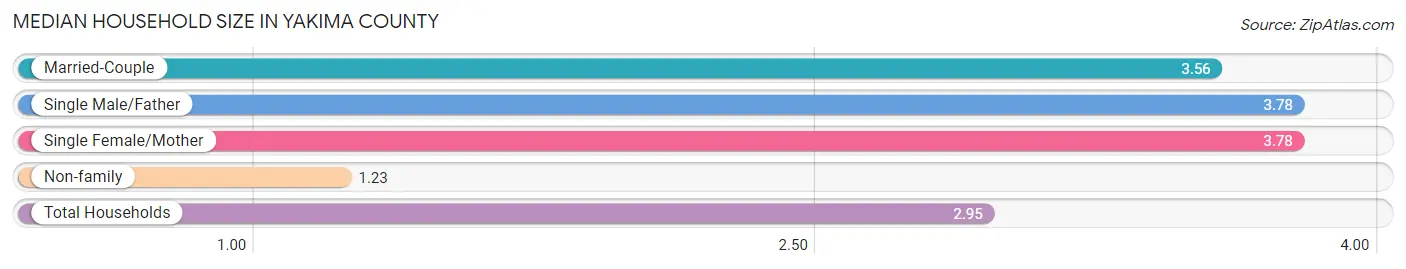
| Household Type | # Households | Household Size |
| Married-Couple | 42,367 (49.5%) | 3.56 |
| Single Male/Father | 6,035 (7.0%) | 3.78 |
| Single Female/Mother | 12,816 (15.0%) | 3.78 |
| Non-family | 24,340 (28.4%) | 1.23 |
| Total Households | 85,558 (100.0%) | 2.95 |
Household Size by Marriage Status in Yakima County
Out of a total of 85,558 households in Yakima County, 61,218 (71.6%) are family households, while 24,340 (28.4%) are nonfamily households. The most numerous type of family households are 2-person households, comprising 21,816, and the most common type of nonfamily households are 1-person households, comprising 19,894.
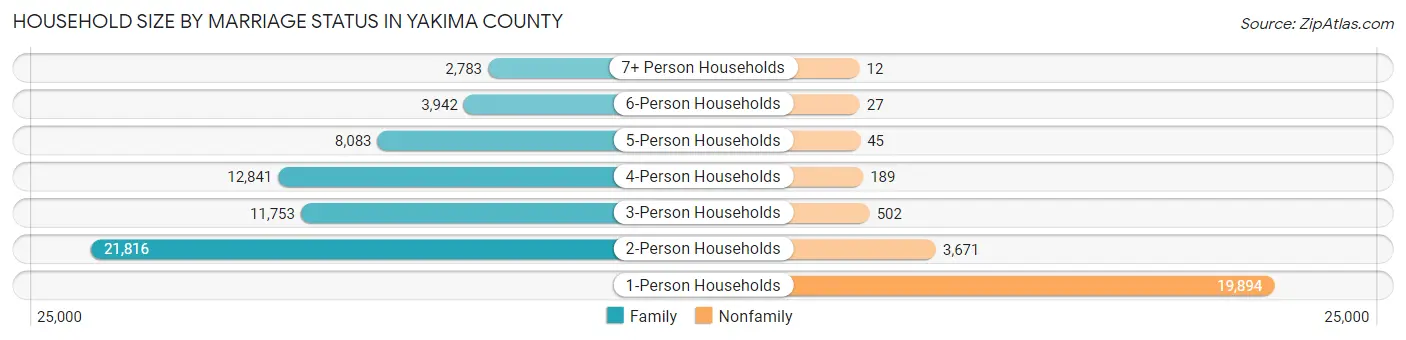
| Household Size | Family Households | Nonfamily Households |
| 1-Person Households | - | 19,894 (23.3%) |
| 2-Person Households | 21,816 (25.5%) | 3,671 (4.3%) |
| 3-Person Households | 11,753 (13.7%) | 502 (0.6%) |
| 4-Person Households | 12,841 (15.0%) | 189 (0.2%) |
| 5-Person Households | 8,083 (9.5%) | 45 (0.1%) |
| 6-Person Households | 3,942 (4.6%) | 27 (0.0%) |
| 7+ Person Households | 2,783 (3.3%) | 12 (0.0%) |
| Total | 61,218 (71.6%) | 24,340 (28.4%) |
Female Fertility in Yakima County
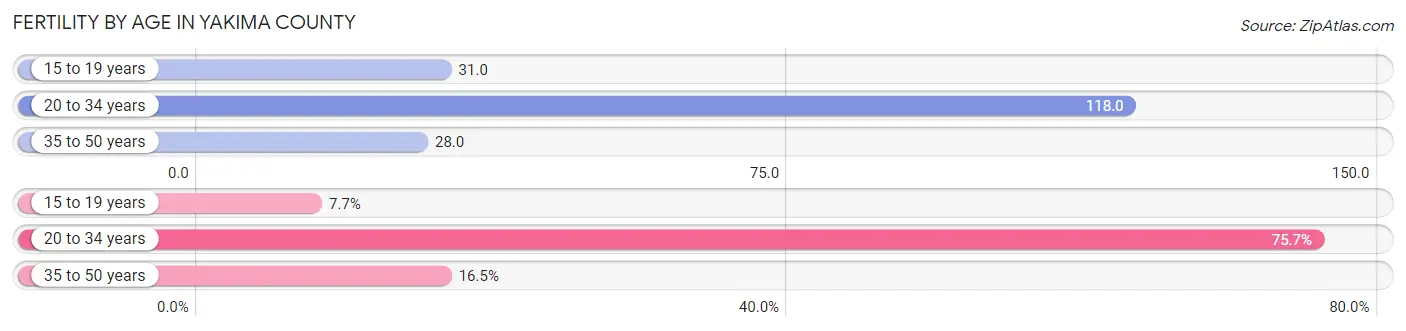
Fertility by Age in Yakima County
Average fertility rate in Yakima County is 68.0 births per 1,000 women. Women in the age bracket of 20 to 34 years have the highest fertility rate with 118.0 births per 1,000 women. Women in the age bracket of 20 to 34 years acount for 75.7% of all women with births.
| Age Bracket | Women with Births | Births / 1,000 Women |
| 15 to 19 years | 308 (7.7%) | 31.0 |
| 20 to 34 years | 3,013 (75.7%) | 118.0 |
| 35 to 50 years | 658 (16.5%) | 28.0 |
| Total | 3,979 (100.0%) | 68.0 |
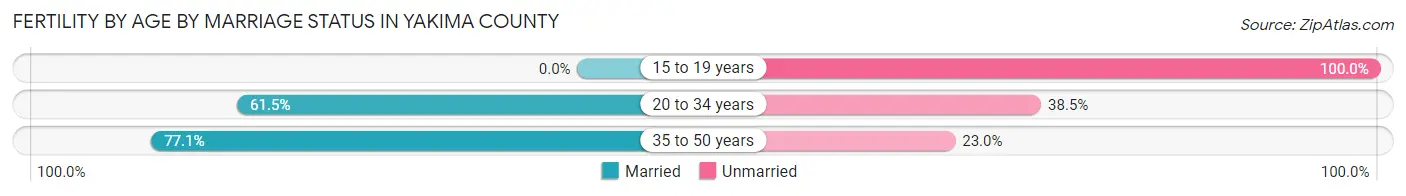
Fertility by Age by Marriage Status in Yakima County
59.3% of women with births (3,979) in Yakima County are married. The highest percentage of unmarried women with births falls into 15 to 19 years age bracket with 100.0% of them unmarried at the time of birth, while the lowest percentage of unmarried women with births belong to 35 to 50 years age bracket with 23.0% of them unmarried.
| Age Bracket | Married | Unmarried |
| 15 to 19 years | 0 (0.0%) | 308 (100.0%) |
| 20 to 34 years | 1,853 (61.5%) | 1,160 (38.5%) |
| 35 to 50 years | 507 (77.0%) | 151 (23.0%) |
| Total | 2,360 (59.3%) | 1,619 (40.7%) |
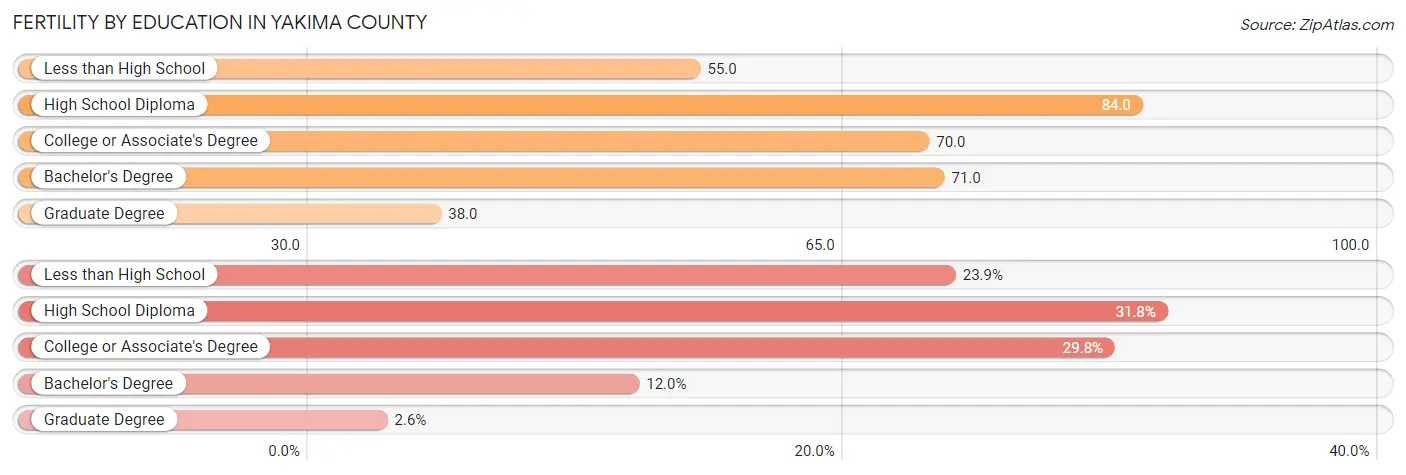
Fertility by Education in Yakima County
Average fertility rate in Yakima County is 68.0 births per 1,000 women. Women with the education attainment of high school diploma have the highest fertility rate of 84.0 births per 1,000 women, while women with the education attainment of graduate degree have the lowest fertility at 38.0 births per 1,000 women. Women with the education attainment of high school diploma represent 31.8% of all women with births.
| Educational Attainment | Women with Births | Births / 1,000 Women |
| Less than High School | 949 (23.8%) | 55.0 |
| High School Diploma | 1,265 (31.8%) | 84.0 |
| College or Associate's Degree | 1,186 (29.8%) | 70.0 |
| Bachelor's Degree | 477 (12.0%) | 71.0 |
| Graduate Degree | 102 (2.6%) | 38.0 |
| Total | 3,979 (100.0%) | 68.0 |
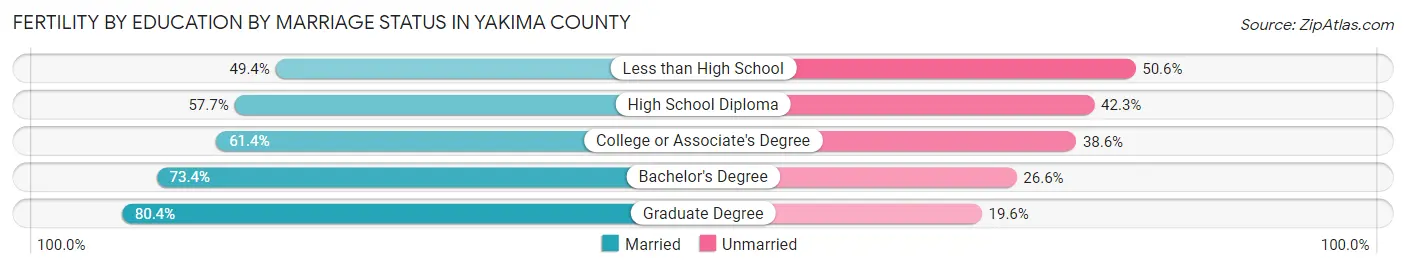
Fertility by Education by Marriage Status in Yakima County
40.7% of women with births in Yakima County are unmarried. Women with the educational attainment of graduate degree are most likely to be married with 80.4% of them married at childbirth, while women with the educational attainment of less than high school are least likely to be married with 50.6% of them unmarried at childbirth.
| Educational Attainment | Married | Unmarried |
| Less than High School | 469 (49.4%) | 480 (50.6%) |
| High School Diploma | 730 (57.7%) | 535 (42.3%) |
| College or Associate's Degree | 728 (61.4%) | 458 (38.6%) |
| Bachelor's Degree | 350 (73.4%) | 127 (26.6%) |
| Graduate Degree | 82 (80.4%) | 20 (19.6%) |
| Total | 2,360 (59.3%) | 1,619 (40.7%) |
Income in Yakima County
Income Overview in Yakima County
Per Capita Income in Yakima County is $27,448, while median incomes of families and households are $73,344 and $64,910 respectively.
| Characteristic | Number | Measure |
| Per Capita Income | 256,143 | $27,448 |
| Median Family Income | 61,218 | $73,344 |
| Mean Family Income | 61,218 | $89,266 |
| Median Household Income | 85,558 | $64,910 |
| Mean Household Income | 85,558 | $80,759 |
| Income Deficit | 61,218 | $10,734 |
| Wage / Income Gap (%) | 256,143 | 25.43% |
| Wage / Income Gap ($) | 256,143 | 74.57¢ per $1 |
| Gini / Inequality Index | 256,143 | 0.42 |
Earnings by Sex in Yakima County
Average Earnings in Yakima County are $34,577, $40,005 for men and $29,832 for women, a difference of 25.4%.
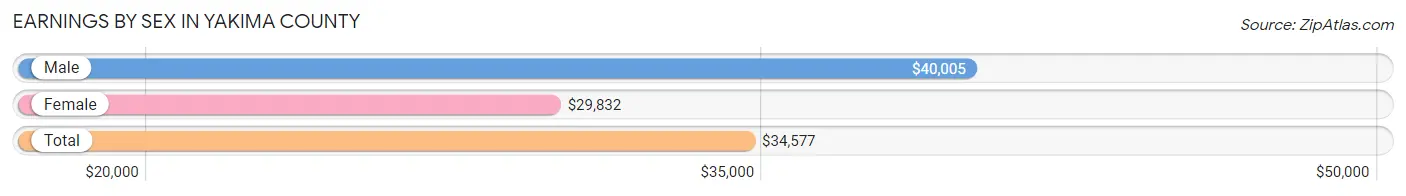
| Sex | Number | Average Earnings |
| Male | 66,390 (53.8%) | $40,005 |
| Female | 56,967 (46.2%) | $29,832 |
| Total | 123,357 (100.0%) | $34,577 |
Earnings by Sex by Income Bracket in Yakima County
The most common earnings brackets in Yakima County are $100,000+ for men (6,629 | 10.0%) and $30,000 to $34,999 for women (5,264 | 9.2%).
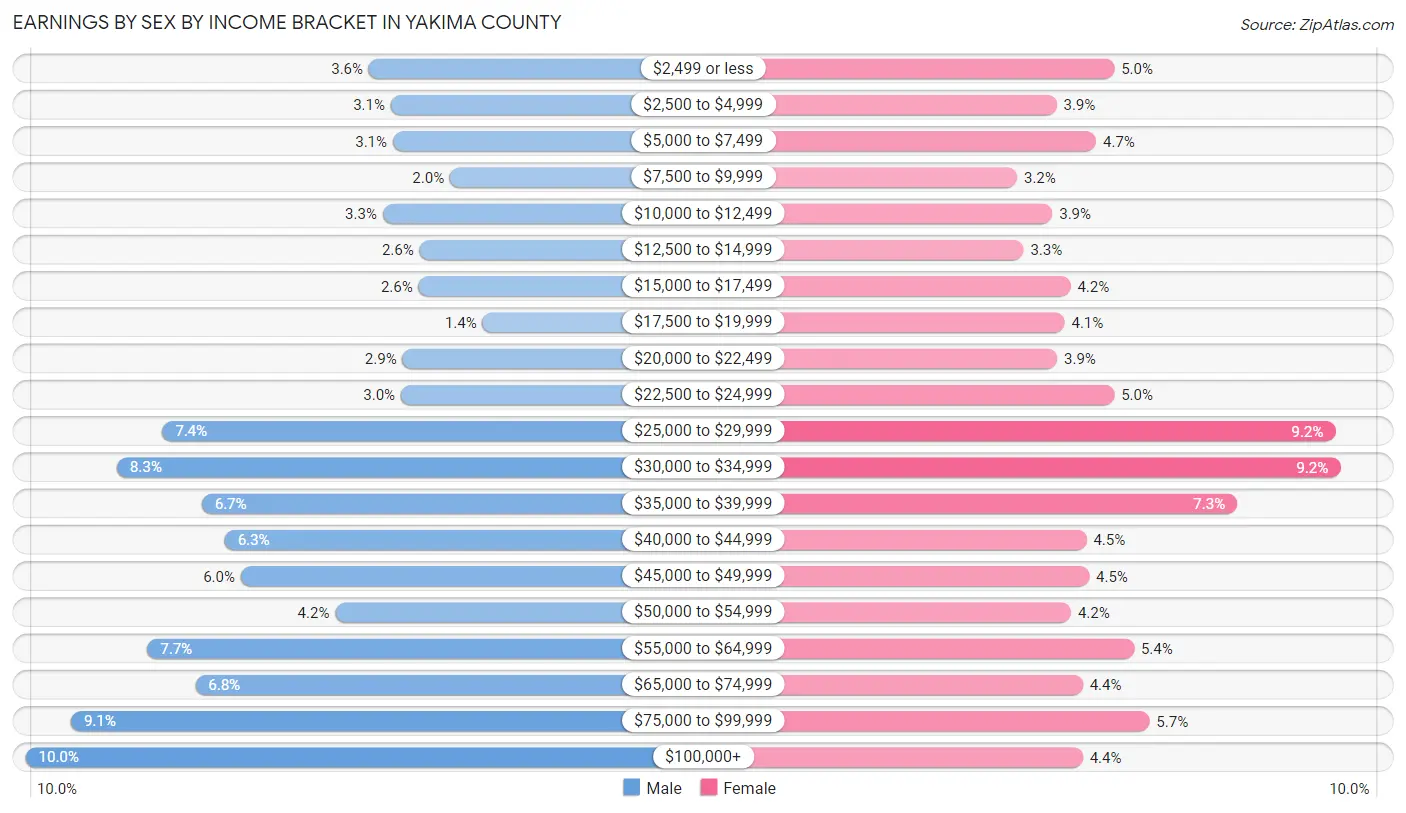
| Income | Male | Female |
| $2,499 or less | 2,355 (3.5%) | 2,853 (5.0%) |
| $2,500 to $4,999 | 2,084 (3.1%) | 2,237 (3.9%) |
| $5,000 to $7,499 | 2,061 (3.1%) | 2,662 (4.7%) |
| $7,500 to $9,999 | 1,349 (2.0%) | 1,820 (3.2%) |
| $10,000 to $12,499 | 2,187 (3.3%) | 2,195 (3.8%) |
| $12,500 to $14,999 | 1,724 (2.6%) | 1,886 (3.3%) |
| $15,000 to $17,499 | 1,738 (2.6%) | 2,389 (4.2%) |
| $17,500 to $19,999 | 943 (1.4%) | 2,327 (4.1%) |
| $20,000 to $22,499 | 1,940 (2.9%) | 2,243 (3.9%) |
| $22,500 to $24,999 | 1,960 (2.9%) | 2,853 (5.0%) |
| $25,000 to $29,999 | 4,923 (7.4%) | 5,210 (9.1%) |
| $30,000 to $34,999 | 5,489 (8.3%) | 5,264 (9.2%) |
| $35,000 to $39,999 | 4,437 (6.7%) | 4,166 (7.3%) |
| $40,000 to $44,999 | 4,149 (6.2%) | 2,555 (4.5%) |
| $45,000 to $49,999 | 3,953 (5.9%) | 2,584 (4.5%) |
| $50,000 to $54,999 | 2,778 (4.2%) | 2,393 (4.2%) |
| $55,000 to $64,999 | 5,113 (7.7%) | 3,062 (5.4%) |
| $65,000 to $74,999 | 4,516 (6.8%) | 2,520 (4.4%) |
| $75,000 to $99,999 | 6,062 (9.1%) | 3,232 (5.7%) |
| $100,000+ | 6,629 (10.0%) | 2,516 (4.4%) |
| Total | 66,390 (100.0%) | 56,967 (100.0%) |
Earnings by Sex by Educational Attainment in Yakima County
Average earnings in Yakima County are $45,036 for men and $33,324 for women, a difference of 26.0%. Men with an educational attainment of graduate degree enjoy the highest average annual earnings of $103,220, while those with less than high school education earn the least with $34,696. Women with an educational attainment of graduate degree earn the most with the average annual earnings of $72,398, while those with less than high school education have the smallest earnings of $24,264.
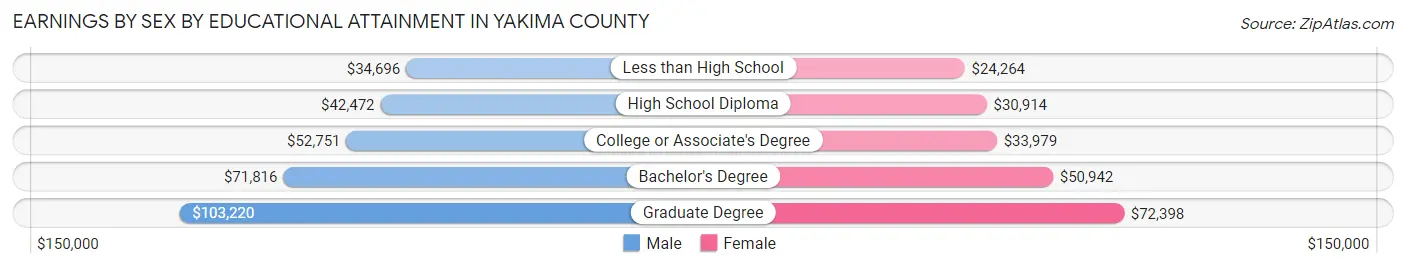
| Educational Attainment | Male Income | Female Income |
| Less than High School | $34,696 | $24,264 |
| High School Diploma | $42,472 | $30,914 |
| College or Associate's Degree | $52,751 | $33,979 |
| Bachelor's Degree | $71,816 | $50,942 |
| Graduate Degree | $103,220 | $72,398 |
| Total | $45,036 | $33,324 |
Family Income in Yakima County
Family Income Brackets in Yakima County
According to the Yakima County family income data, there are 11,570 families falling into the $50,000 to $74,999 income range, which is the most common income bracket and makes up 18.9% of all families. Conversely, the $10,000 to $14,999 income bracket is the least frequent group with only 1,286 families (2.1%) belonging to this category.
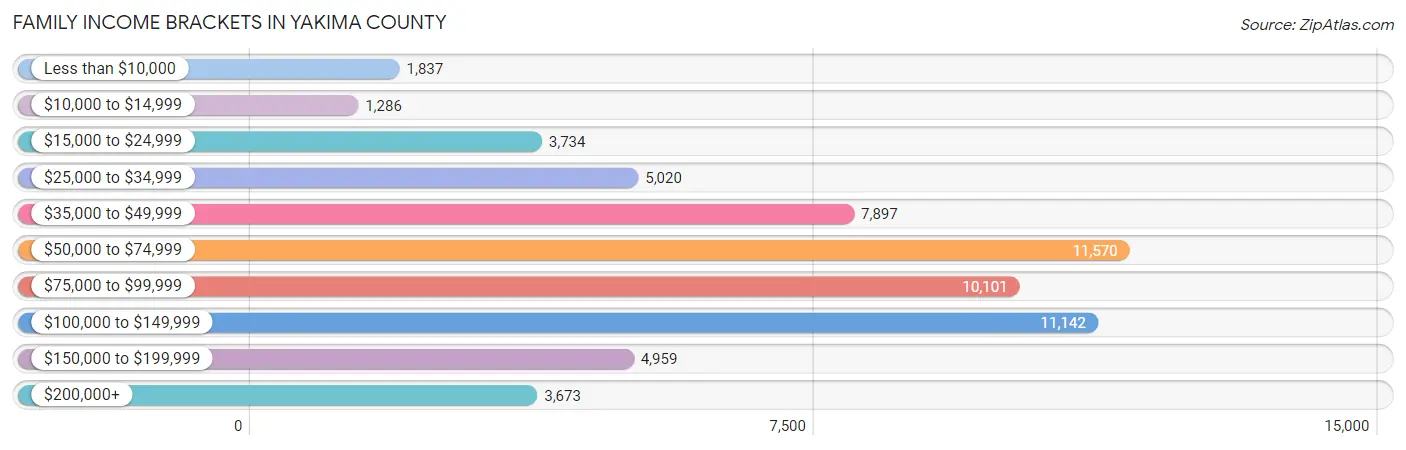
| Income Bracket | # Families | % Families |
| Less than $10,000 | 1,837 | 3.0% |
| $10,000 to $14,999 | 1,286 | 2.1% |
| $15,000 to $24,999 | 3,734 | 6.1% |
| $25,000 to $34,999 | 5,020 | 8.2% |
| $35,000 to $49,999 | 7,897 | 12.9% |
| $50,000 to $74,999 | 11,570 | 18.9% |
| $75,000 to $99,999 | 10,101 | 16.5% |
| $100,000 to $149,999 | 11,142 | 18.2% |
| $150,000 to $199,999 | 4,959 | 8.1% |
| $200,000+ | 3,673 | 6.0% |
Family Income by Famaliy Size in Yakima County
7+ person families (2,436 | 4.0%) account for the highest median family income in Yakima County with $86,229 per family, while 2-person families (23,780 | 38.8%) have the highest median income of $34,575 per family member.
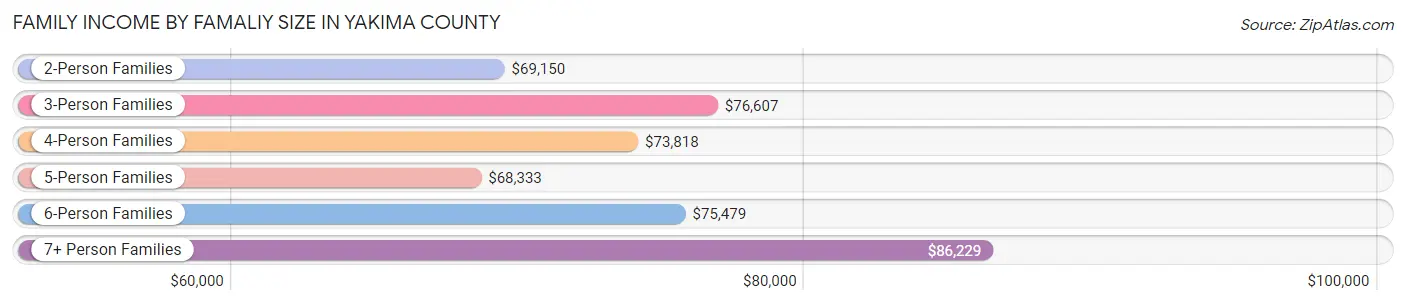
| Income Bracket | # Families | Median Income |
| 2-Person Families | 23,780 (38.8%) | $69,150 |
| 3-Person Families | 12,534 (20.5%) | $76,607 |
| 4-Person Families | 12,182 (19.9%) | $73,818 |
| 5-Person Families | 6,990 (11.4%) | $68,333 |
| 6-Person Families | 3,296 (5.4%) | $75,479 |
| 7+ Person Families | 2,436 (4.0%) | $86,229 |
| Total | 61,218 (100.0%) | $73,344 |
Family Income by Number of Earners in Yakima County
The median family income in Yakima County is $73,344, with families comprising 3+ earners (8,967) having the highest median family income of $110,260, while families with no earners (8,121) have the lowest median family income of $45,516, accounting for 14.6% and 13.3% of families, respectively.
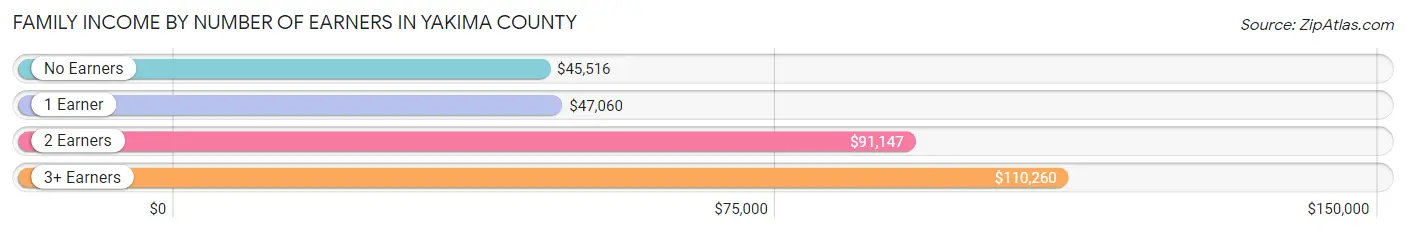
| Number of Earners | # Families | Median Income |
| No Earners | 8,121 (13.3%) | $45,516 |
| 1 Earner | 20,264 (33.1%) | $47,060 |
| 2 Earners | 23,866 (39.0%) | $91,147 |
| 3+ Earners | 8,967 (14.6%) | $110,260 |
| Total | 61,218 (100.0%) | $73,344 |
Household Income in Yakima County
Household Income Brackets in Yakima County
With 16,085 households falling in the category, the $50,000 to $74,999 income range is the most frequent in Yakima County, accounting for 18.8% of all households. In contrast, only 3,422 households (4.0%) fall into the $10,000 to $14,999 income bracket, making it the least populous group.
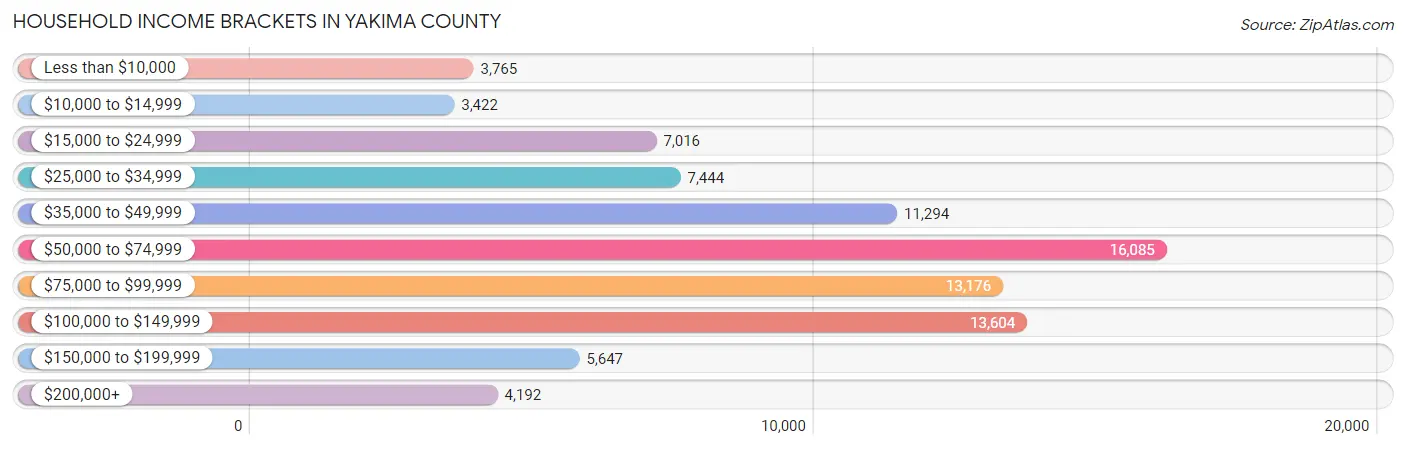
| Income Bracket | # Households | % Households |
| Less than $10,000 | 3,765 | 4.4% |
| $10,000 to $14,999 | 3,422 | 4.0% |
| $15,000 to $24,999 | 7,016 | 8.2% |
| $25,000 to $34,999 | 7,444 | 8.7% |
| $35,000 to $49,999 | 11,294 | 13.2% |
| $50,000 to $74,999 | 16,085 | 18.8% |
| $75,000 to $99,999 | 13,176 | 15.4% |
| $100,000 to $149,999 | 13,604 | 15.9% |
| $150,000 to $199,999 | 5,647 | 6.6% |
| $200,000+ | 4,192 | 4.9% |
Household Income by Householder Age in Yakima County
The median household income in Yakima County is $64,910, with the highest median household income of $75,765 found in the 45 to 64 years age bracket for the primary householder. A total of 29,764 households (34.8%) fall into this category. Meanwhile, the 15 to 24 years age bracket for the primary householder has the lowest median household income of $40,010, with 3,219 households (3.8%) in this group.
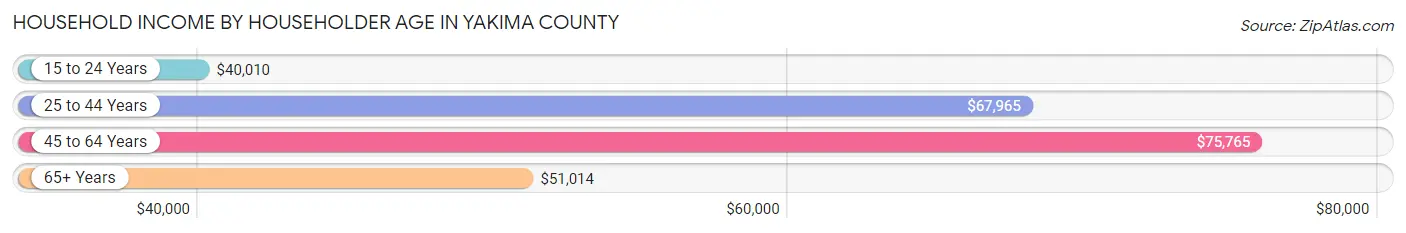
| Income Bracket | # Households | Median Income |
| 15 to 24 Years | 3,219 (3.8%) | $40,010 |
| 25 to 44 Years | 30,263 (35.4%) | $67,965 |
| 45 to 64 Years | 29,764 (34.8%) | $75,765 |
| 65+ Years | 22,312 (26.1%) | $51,014 |
| Total | 85,558 (100.0%) | $64,910 |
Poverty in Yakima County
Income Below Poverty by Sex and Age in Yakima County
With 14.4% poverty level for males and 16.7% for females among the residents of Yakima County, under 5 year old males and 18 to 24 year old females are the most vulnerable to poverty, with 2,659 males (27.1%) and 2,740 females (22.6%) in their respective age groups living below the poverty level.
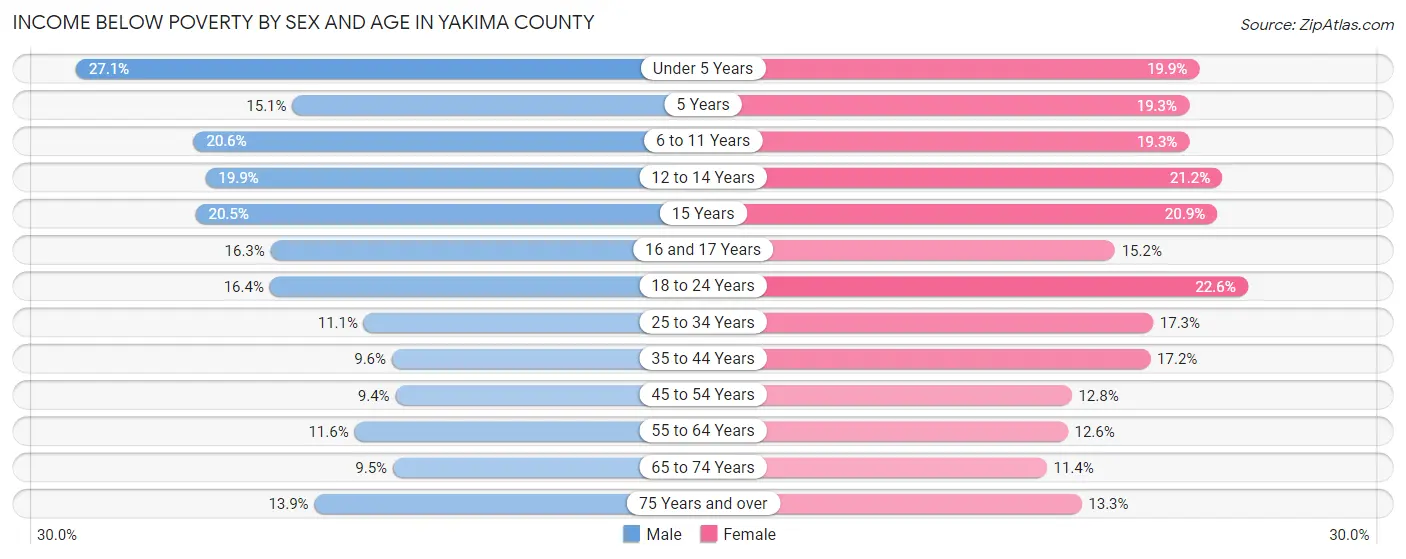
| Age Bracket | Male | Female |
| Under 5 Years | 2,659 (27.1%) | 1,844 (19.9%) |
| 5 Years | 280 (15.1%) | 378 (19.3%) |
| 6 to 11 Years | 2,757 (20.6%) | 2,344 (19.3%) |
| 12 to 14 Years | 1,229 (19.9%) | 1,420 (21.2%) |
| 15 Years | 445 (20.5%) | 505 (20.9%) |
| 16 and 17 Years | 689 (16.3%) | 569 (15.2%) |
| 18 to 24 Years | 2,085 (16.4%) | 2,740 (22.6%) |
| 25 to 34 Years | 1,900 (11.1%) | 2,945 (17.3%) |
| 35 to 44 Years | 1,464 (9.6%) | 2,583 (17.2%) |
| 45 to 54 Years | 1,284 (9.3%) | 1,732 (12.8%) |
| 55 to 64 Years | 1,598 (11.6%) | 1,685 (12.6%) |
| 65 to 74 Years | 964 (9.5%) | 1,240 (11.4%) |
| 75 Years and over | 853 (13.9%) | 1,047 (13.3%) |
| Total | 18,207 (14.4%) | 21,032 (16.7%) |
Income Above Poverty by Sex and Age in Yakima County
According to the poverty statistics in Yakima County, males aged 45 to 54 years and females aged 65 to 74 years are the age groups that are most secure financially, with 90.6% of males and 88.6% of females in these age groups living above the poverty line.
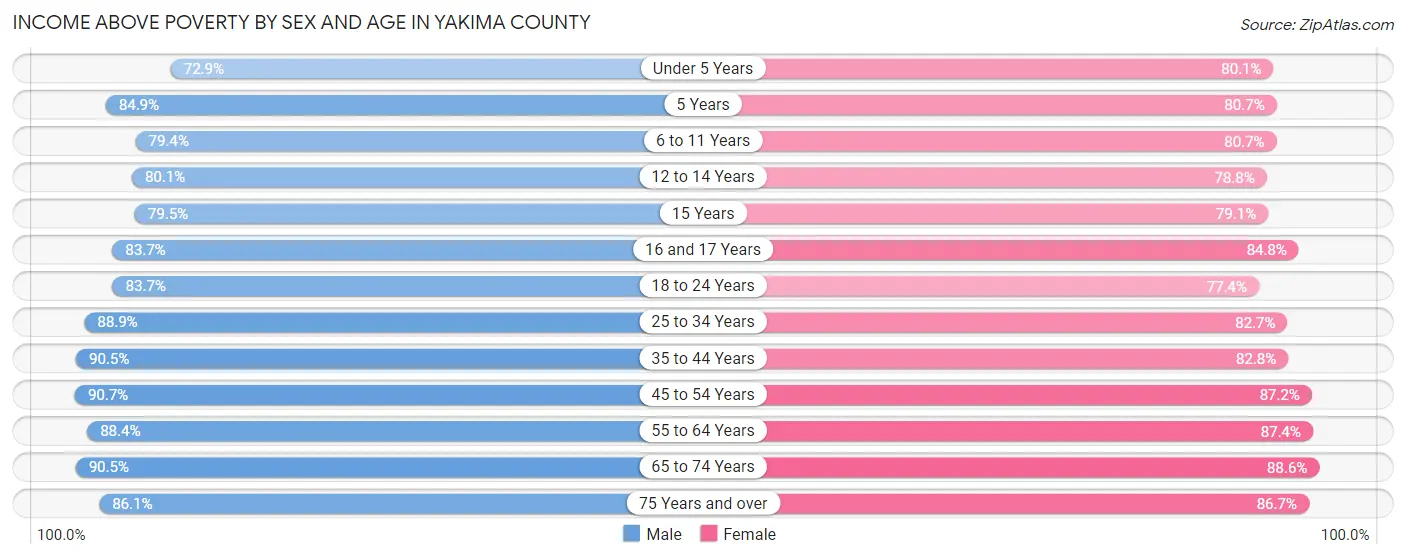
| Age Bracket | Male | Female |
| Under 5 Years | 7,138 (72.9%) | 7,423 (80.1%) |
| 5 Years | 1,576 (84.9%) | 1,579 (80.7%) |
| 6 to 11 Years | 10,629 (79.4%) | 9,774 (80.7%) |
| 12 to 14 Years | 4,938 (80.1%) | 5,289 (78.8%) |
| 15 Years | 1,728 (79.5%) | 1,911 (79.1%) |
| 16 and 17 Years | 3,539 (83.7%) | 3,175 (84.8%) |
| 18 to 24 Years | 10,666 (83.7%) | 9,388 (77.4%) |
| 25 to 34 Years | 15,204 (88.9%) | 14,055 (82.7%) |
| 35 to 44 Years | 13,869 (90.4%) | 12,463 (82.8%) |
| 45 to 54 Years | 12,443 (90.6%) | 11,807 (87.2%) |
| 55 to 64 Years | 12,147 (88.4%) | 11,722 (87.4%) |
| 65 to 74 Years | 9,191 (90.5%) | 9,641 (88.6%) |
| 75 Years and over | 5,301 (86.1%) | 6,802 (86.7%) |
| Total | 108,369 (85.6%) | 105,029 (83.3%) |
Income Below Poverty Among Married-Couple Families in Yakima County
The poverty statistics for married-couple families in Yakima County show that 6.3% or 2,658 of the total 42,367 families live below the poverty line. Families with 5 or more children have the highest poverty rate of 22.6%, comprising of 117 families. On the other hand, families with no children have the lowest poverty rate of 3.8%, which includes 863 families.
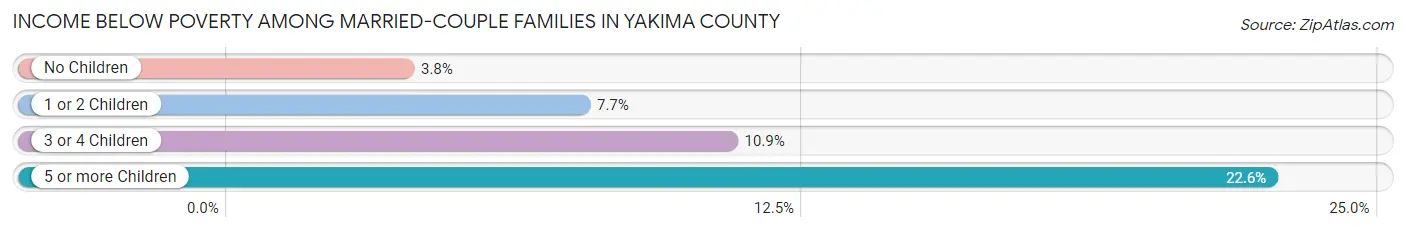
| Children | Above Poverty | Below Poverty |
| No Children | 21,680 (96.2%) | 863 (3.8%) |
| 1 or 2 Children | 12,112 (92.3%) | 1,005 (7.7%) |
| 3 or 4 Children | 5,517 (89.1%) | 673 (10.9%) |
| 5 or more Children | 400 (77.4%) | 117 (22.6%) |
| Total | 39,709 (93.7%) | 2,658 (6.3%) |
Income Below Poverty Among Single-Parent Households in Yakima County
According to the poverty data in Yakima County, 7.7% or 468 single-father households and 31.4% or 4,028 single-mother households are living below the poverty line. Among single-father households, those with 5 or more children have the highest poverty rate, with 37 households (51.4%) experiencing poverty. Likewise, among single-mother households, those with 5 or more children have the highest poverty rate, with 206 households (65.0%) falling below the poverty line.
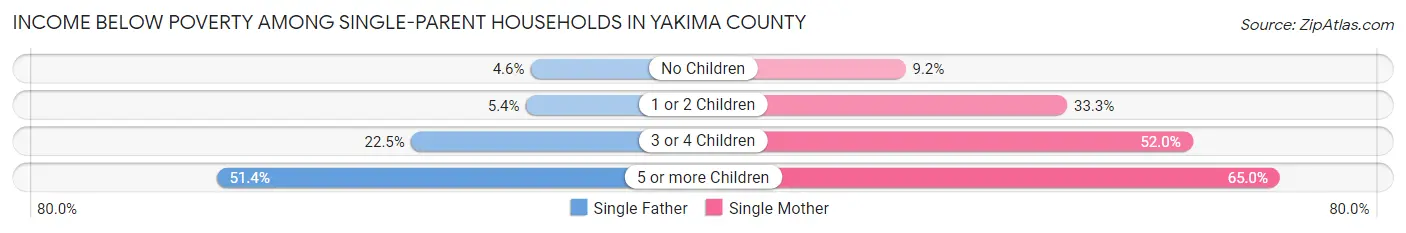
| Children | Single Father | Single Mother |
| No Children | 95 (4.6%) | 319 (9.2%) |
| 1 or 2 Children | 171 (5.4%) | 2,128 (33.3%) |
| 3 or 4 Children | 165 (22.5%) | 1,375 (52.0%) |
| 5 or more Children | 37 (51.4%) | 206 (65.0%) |
| Total | 468 (7.7%) | 4,028 (31.4%) |
Income Below Poverty Among Married-Couple vs Single-Parent Households in Yakima County
The poverty data for Yakima County shows that 2,658 of the married-couple family households (6.3%) and 4,496 of the single-parent households (23.8%) are living below the poverty level. Within the married-couple family households, those with 5 or more children have the highest poverty rate, with 117 households (22.6%) falling below the poverty line. Among the single-parent households, those with 5 or more children have the highest poverty rate, with 243 household (62.5%) living below poverty.
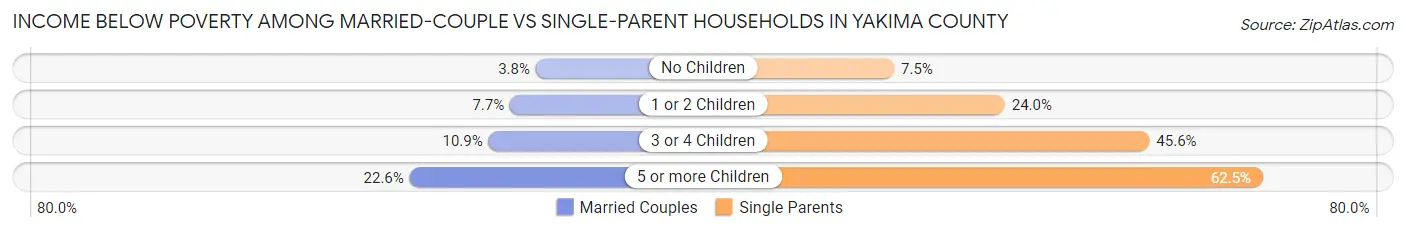
| Children | Married-Couple Families | Single-Parent Households |
| No Children | 863 (3.8%) | 414 (7.5%) |
| 1 or 2 Children | 1,005 (7.7%) | 2,299 (24.0%) |
| 3 or 4 Children | 673 (10.9%) | 1,540 (45.6%) |
| 5 or more Children | 117 (22.6%) | 243 (62.5%) |
| Total | 2,658 (6.3%) | 4,496 (23.8%) |
Employment Characteristics in Yakima County
Employment by Class of Employer in Yakima County
Among the 105,896 employed individuals in Yakima County, private company employees (72,141 | 68.1%), not-for-profit organizations (8,807 | 8.3%), and local government employees (8,746 | 8.3%) make up the most common classes of employment.
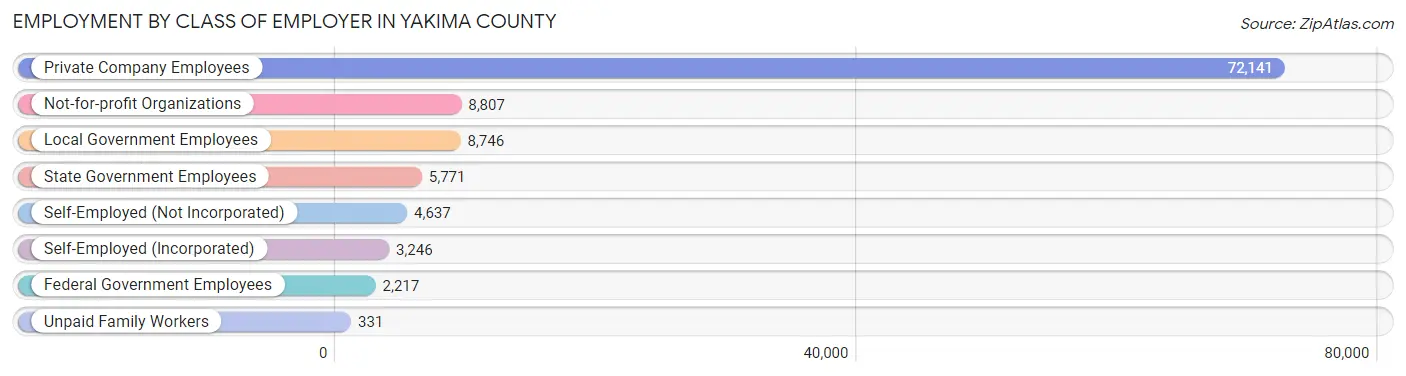
| Employer Class | # Employees | % Employees |
| Private Company Employees | 72,141 | 68.1% |
| Self-Employed (Incorporated) | 3,246 | 3.1% |
| Self-Employed (Not Incorporated) | 4,637 | 4.4% |
| Not-for-profit Organizations | 8,807 | 8.3% |
| Local Government Employees | 8,746 | 8.3% |
| State Government Employees | 5,771 | 5.4% |
| Federal Government Employees | 2,217 | 2.1% |
| Unpaid Family Workers | 331 | 0.3% |
| Total | 105,896 | 100.0% |
Employment Status by Age in Yakima County
According to the labor force statistics for Yakima County, out of the total population over 16 years of age (189,087), 62.1% or 117,423 individuals are in the labor force, with 7.2% or 8,454 of them unemployed. The age group with the highest labor force participation rate is 35 to 44 years, with 81.7% or 25,110 individuals in the labor force. Within the labor force, the 16 to 19 years age range has the highest percentage of unemployed individuals, with 21.4% or 1,297 of them being unemployed.
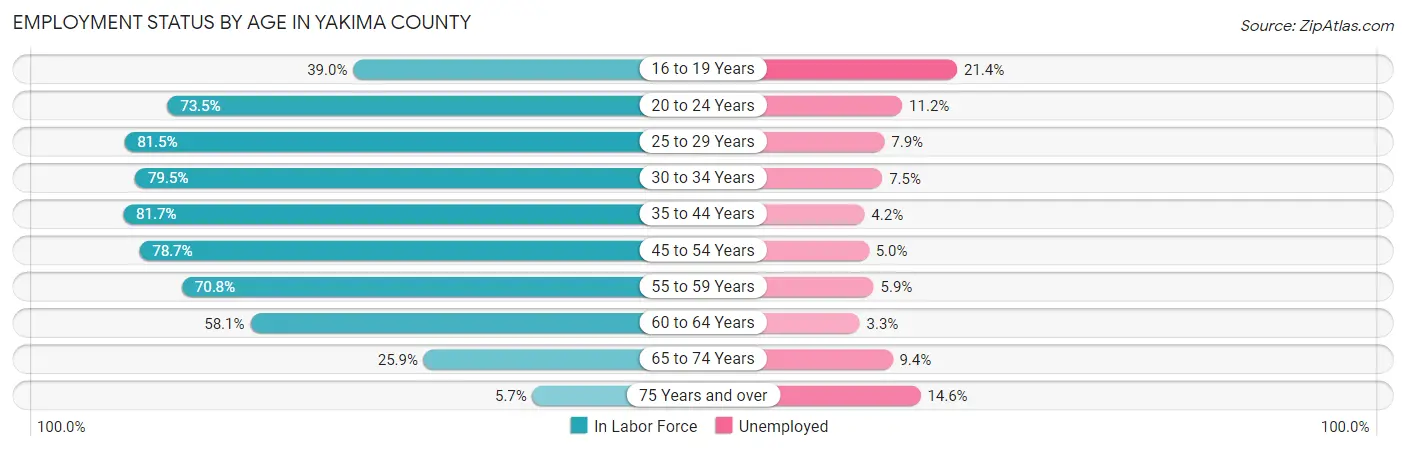
| Age Bracket | In Labor Force | Unemployed |
| 16 to 19 Years | 6,061 (39.0%) | 1,297 (21.4%) |
| 20 to 24 Years | 12,988 (73.5%) | 1,455 (11.2%) |
| 25 to 29 Years | 14,537 (81.5%) | 1,148 (7.9%) |
| 30 to 34 Years | 13,258 (79.5%) | 994 (7.5%) |
| 35 to 44 Years | 25,110 (81.7%) | 1,055 (4.2%) |
| 45 to 54 Years | 21,644 (78.7%) | 1,082 (5.0%) |
| 55 to 59 Years | 9,596 (70.8%) | 566 (5.9%) |
| 60 to 64 Years | 7,956 (58.1%) | 263 (3.3%) |
| 65 to 74 Years | 5,500 (25.9%) | 517 (9.4%) |
| 75 Years and over | 835 (5.7%) | 122 (14.6%) |
| Total | 117,423 (62.1%) | 8,454 (7.2%) |
Employment Status by Educational Attainment in Yakima County
According to labor force statistics for Yakima County, 76.8% of individuals (92,158) out of the total population between 25 and 64 years of age (119,998) are in the labor force, with 5.5% or 5,069 of them being unemployed. The group with the highest labor force participation rate are those with the educational attainment of bachelor's degree or higher, with 88.1% or 18,172 individuals in the labor force. Within the labor force, individuals with less than high school education have the highest percentage of unemployment, with 8.3% or 1,783 of them being unemployed.
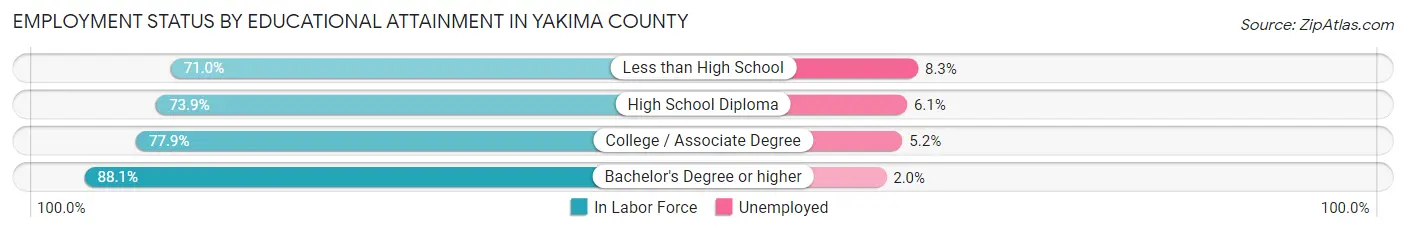
| Educational Attainment | In Labor Force | Unemployed |
| Less than High School | 21,485 (71.0%) | 2,512 (8.3%) |
| High School Diploma | 25,852 (73.9%) | 2,134 (6.1%) |
| College / Associate Degree | 26,585 (77.9%) | 1,775 (5.2%) |
| Bachelor's Degree or higher | 18,172 (88.1%) | 413 (2.0%) |
| Total | 92,158 (76.8%) | 6,600 (5.5%) |
Employment Occupations by Sex in Yakima County
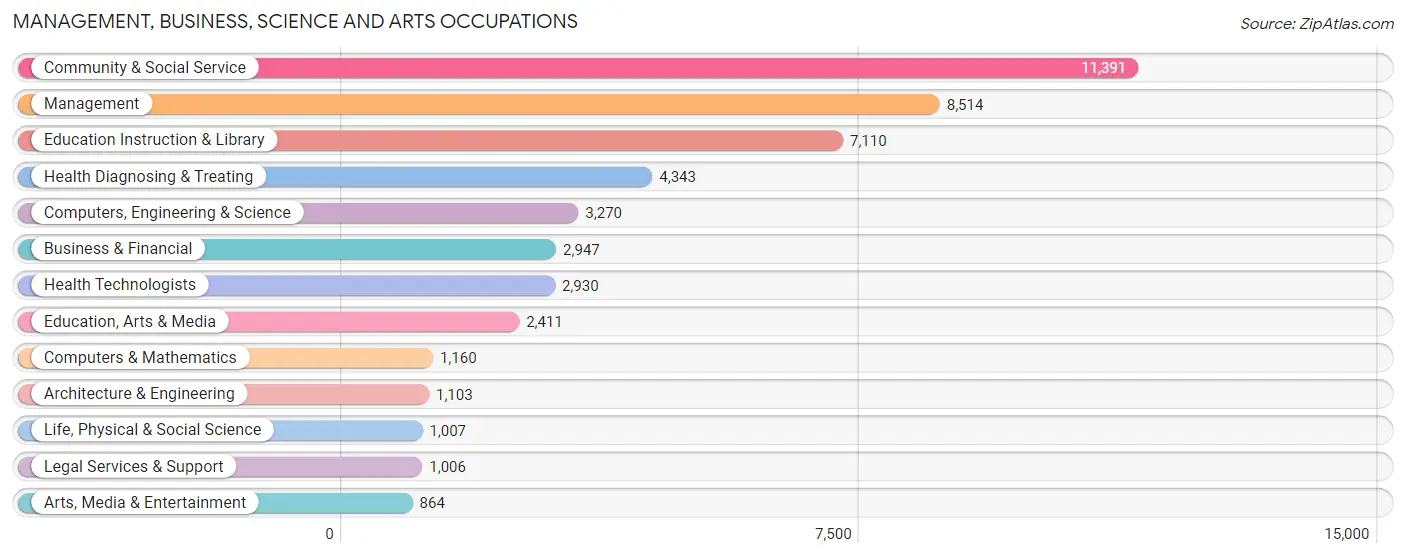
Management, Business, Science and Arts Occupations
The most common Management, Business, Science and Arts occupations in Yakima County are Community & Social Service (11,391 | 10.5%), Management (8,514 | 7.8%), Education Instruction & Library (7,110 | 6.5%), Health Diagnosing & Treating (4,343 | 4.0%), and Computers, Engineering & Science (3,270 | 3.0%).
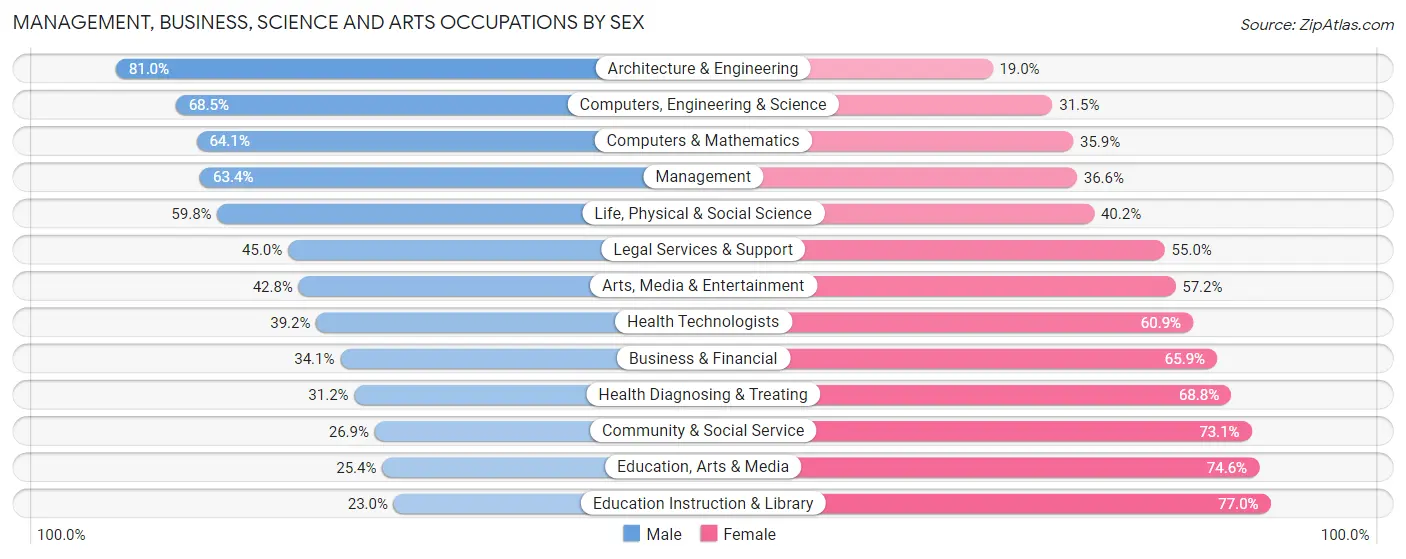
Management, Business, Science and Arts Occupations by Sex
Within the Management, Business, Science and Arts occupations in Yakima County, the most male-oriented occupations are Architecture & Engineering (81.0%), Computers, Engineering & Science (68.5%), and Computers & Mathematics (64.1%), while the most female-oriented occupations are Education Instruction & Library (77.0%), Education, Arts & Media (74.6%), and Community & Social Service (73.1%).
| Occupation | Male | Female |
| Management | 5,395 (63.4%) | 3,119 (36.6%) |
| Business & Financial | 1,006 (34.1%) | 1,941 (65.9%) |
| Computers, Engineering & Science | 2,239 (68.5%) | 1,031 (31.5%) |
| Computers & Mathematics | 744 (64.1%) | 416 (35.9%) |
| Architecture & Engineering | 893 (81.0%) | 210 (19.0%) |
| Life, Physical & Social Science | 602 (59.8%) | 405 (40.2%) |
| Community & Social Service | 3,069 (26.9%) | 8,322 (73.1%) |
| Education, Arts & Media | 612 (25.4%) | 1,799 (74.6%) |
| Legal Services & Support | 453 (45.0%) | 553 (55.0%) |
| Education Instruction & Library | 1,634 (23.0%) | 5,476 (77.0%) |
| Arts, Media & Entertainment | 370 (42.8%) | 494 (57.2%) |
| Health Diagnosing & Treating | 1,355 (31.2%) | 2,988 (68.8%) |
| Health Technologists | 1,147 (39.2%) | 1,783 (60.9%) |
| Total (Category) | 13,064 (42.9%) | 17,401 (57.1%) |
| Total (Overall) | 58,856 (54.0%) | 50,046 (46.0%) |
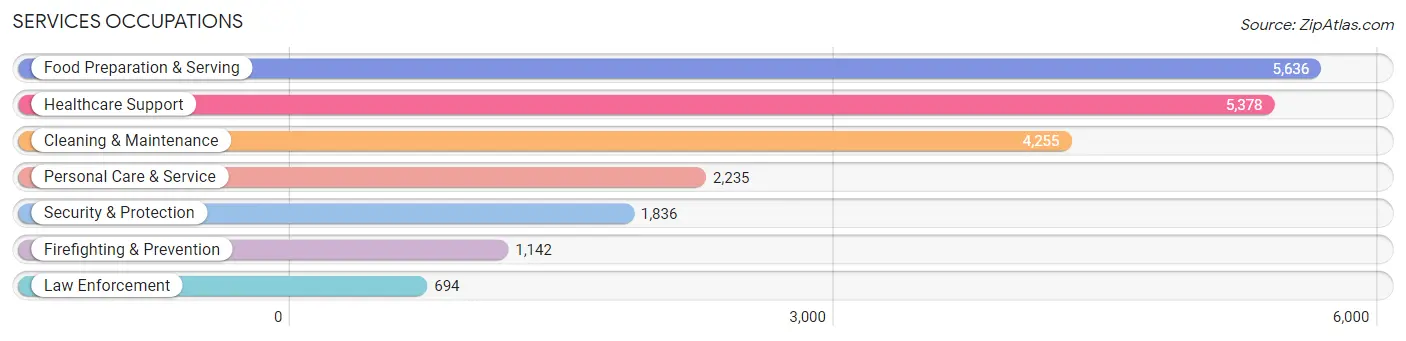
Services Occupations
The most common Services occupations in Yakima County are Food Preparation & Serving (5,636 | 5.2%), Healthcare Support (5,378 | 4.9%), Cleaning & Maintenance (4,255 | 3.9%), Personal Care & Service (2,235 | 2.1%), and Security & Protection (1,836 | 1.7%).
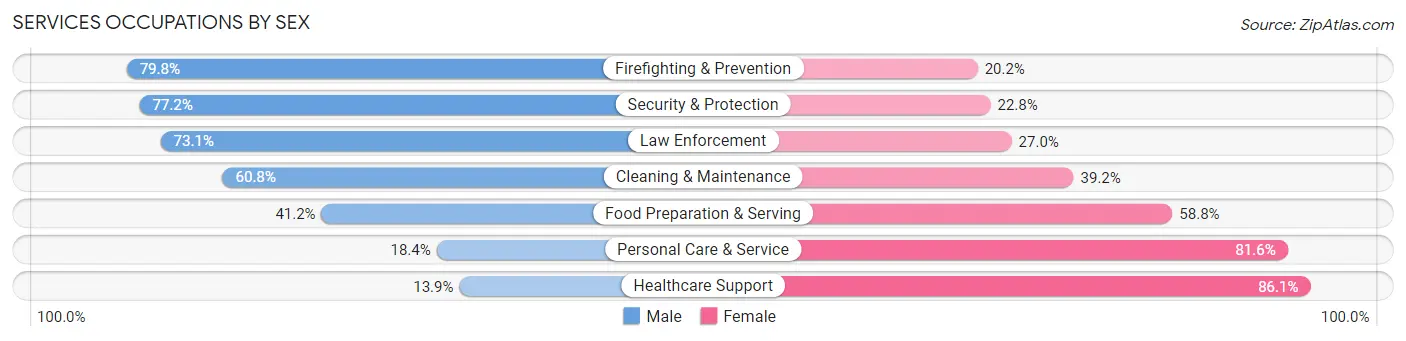
Services Occupations by Sex
Within the Services occupations in Yakima County, the most male-oriented occupations are Firefighting & Prevention (79.8%), Security & Protection (77.2%), and Law Enforcement (73.1%), while the most female-oriented occupations are Healthcare Support (86.1%), Personal Care & Service (81.6%), and Food Preparation & Serving (58.8%).
| Occupation | Male | Female |
| Healthcare Support | 749 (13.9%) | 4,629 (86.1%) |
| Security & Protection | 1,418 (77.2%) | 418 (22.8%) |
| Firefighting & Prevention | 911 (79.8%) | 231 (20.2%) |
| Law Enforcement | 507 (73.1%) | 187 (27.0%) |
| Food Preparation & Serving | 2,323 (41.2%) | 3,313 (58.8%) |
| Cleaning & Maintenance | 2,586 (60.8%) | 1,669 (39.2%) |
| Personal Care & Service | 412 (18.4%) | 1,823 (81.6%) |
| Total (Category) | 7,488 (38.7%) | 11,852 (61.3%) |
| Total (Overall) | 58,856 (54.0%) | 50,046 (46.0%) |
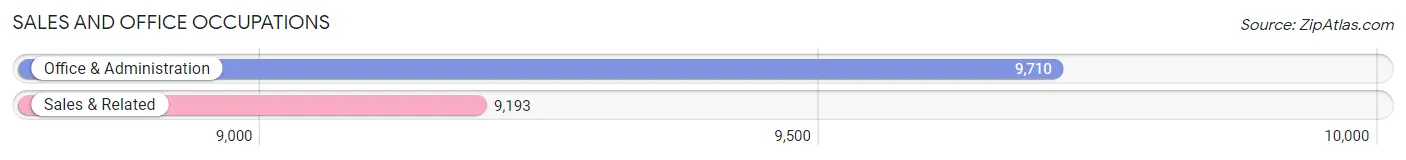
Sales and Office Occupations
The most common Sales and Office occupations in Yakima County are Office & Administration (9,710 | 8.9%), and Sales & Related (9,193 | 8.4%).
Sales and Office Occupations by Sex
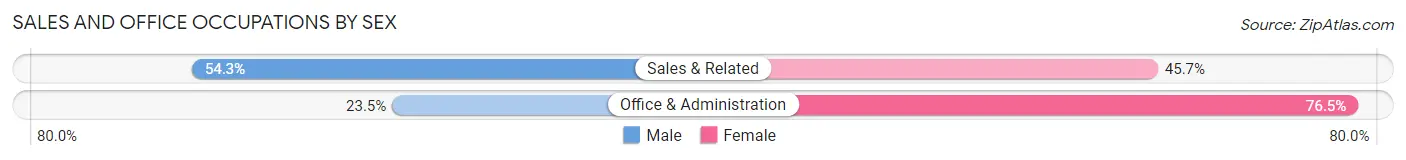
| Occupation | Male | Female |
| Sales & Related | 4,988 (54.3%) | 4,205 (45.7%) |
| Office & Administration | 2,278 (23.5%) | 7,432 (76.5%) |
| Total (Category) | 7,266 (38.4%) | 11,637 (61.6%) |
| Total (Overall) | 58,856 (54.0%) | 50,046 (46.0%) |
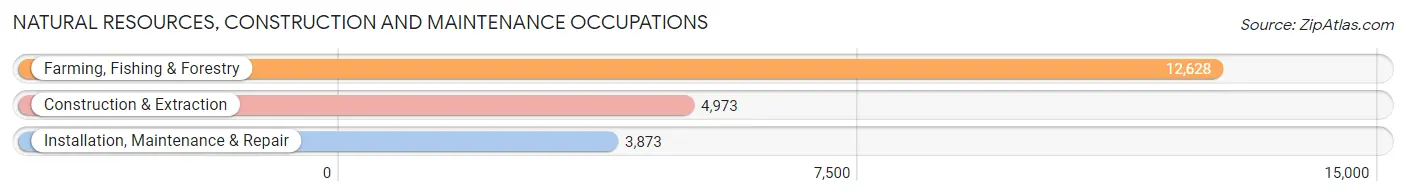
Natural Resources, Construction and Maintenance Occupations
The most common Natural Resources, Construction and Maintenance occupations in Yakima County are Farming, Fishing & Forestry (12,628 | 11.6%), Construction & Extraction (4,973 | 4.6%), and Installation, Maintenance & Repair (3,873 | 3.6%).
Natural Resources, Construction and Maintenance Occupations by Sex
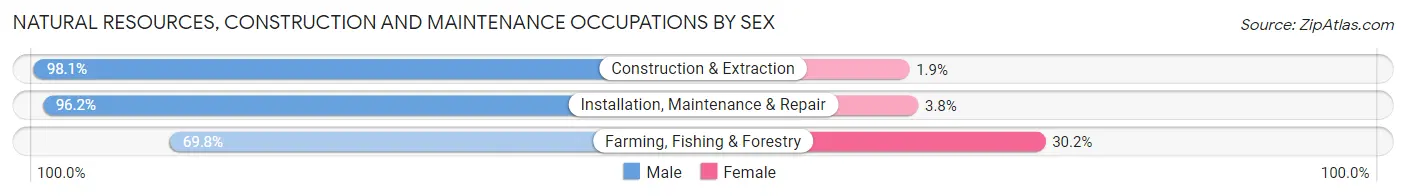
| Occupation | Male | Female |
| Farming, Fishing & Forestry | 8,810 (69.8%) | 3,818 (30.2%) |
| Construction & Extraction | 4,877 (98.1%) | 96 (1.9%) |
| Installation, Maintenance & Repair | 3,727 (96.2%) | 146 (3.8%) |
| Total (Category) | 17,414 (81.1%) | 4,060 (18.9%) |
| Total (Overall) | 58,856 (54.0%) | 50,046 (46.0%) |
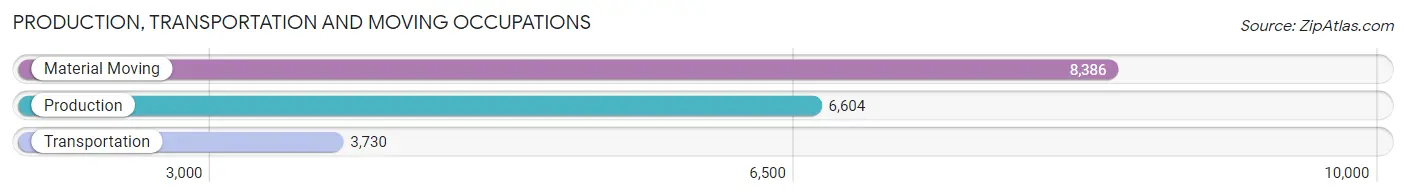
Production, Transportation and Moving Occupations
The most common Production, Transportation and Moving occupations in Yakima County are Material Moving (8,386 | 7.7%), Production (6,604 | 6.1%), and Transportation (3,730 | 3.4%).
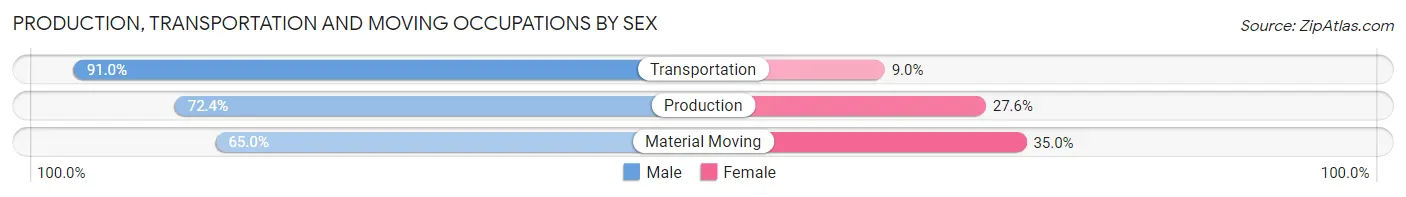
Production, Transportation and Moving Occupations by Sex
| Occupation | Male | Female |
| Production | 4,783 (72.4%) | 1,821 (27.6%) |
| Transportation | 3,393 (91.0%) | 337 (9.0%) |
| Material Moving | 5,448 (65.0%) | 2,938 (35.0%) |
| Total (Category) | 13,624 (72.8%) | 5,096 (27.2%) |
| Total (Overall) | 58,856 (54.0%) | 50,046 (46.0%) |
Employment Industries by Sex in Yakima County
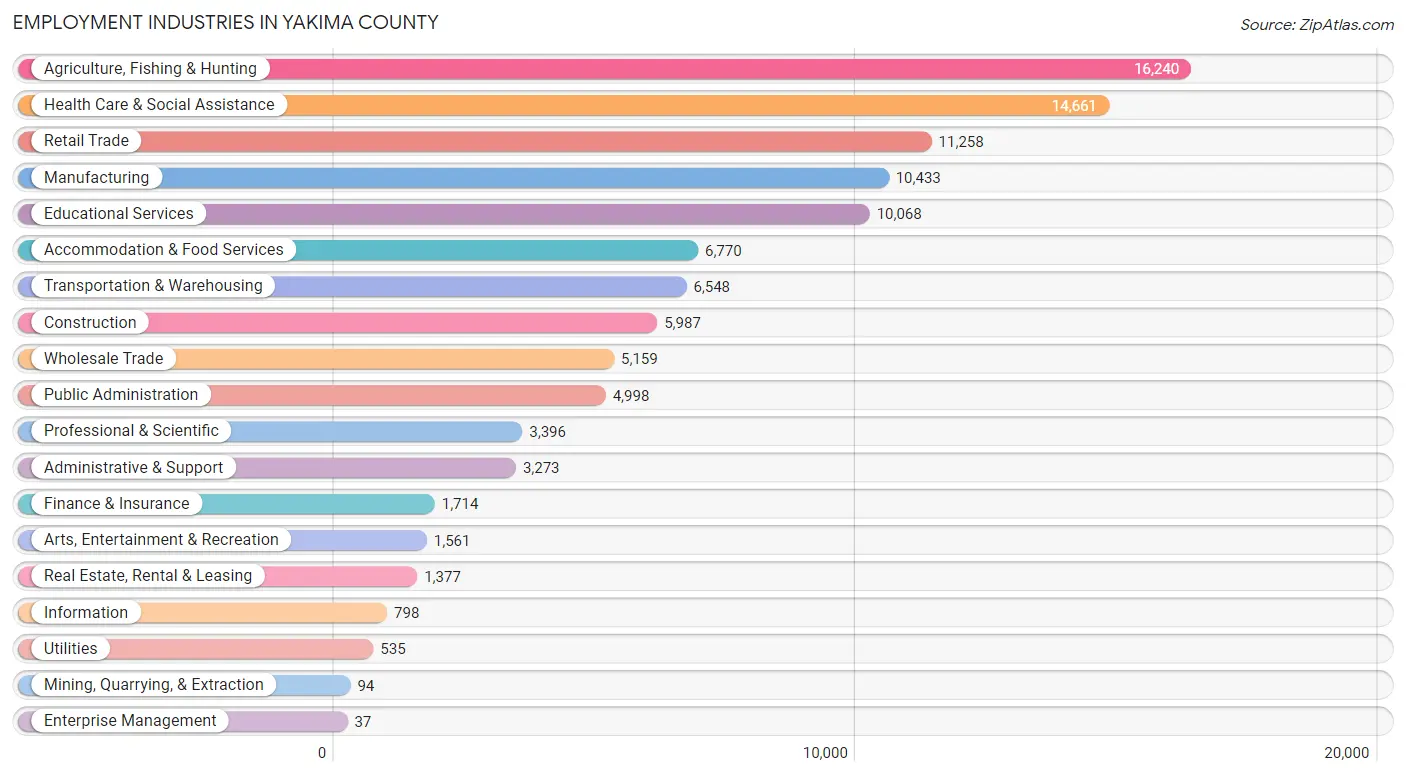
Employment Industries in Yakima County
The major employment industries in Yakima County include Agriculture, Fishing & Hunting (16,240 | 14.9%), Health Care & Social Assistance (14,661 | 13.5%), Retail Trade (11,258 | 10.3%), Manufacturing (10,433 | 9.6%), and Educational Services (10,068 | 9.2%).
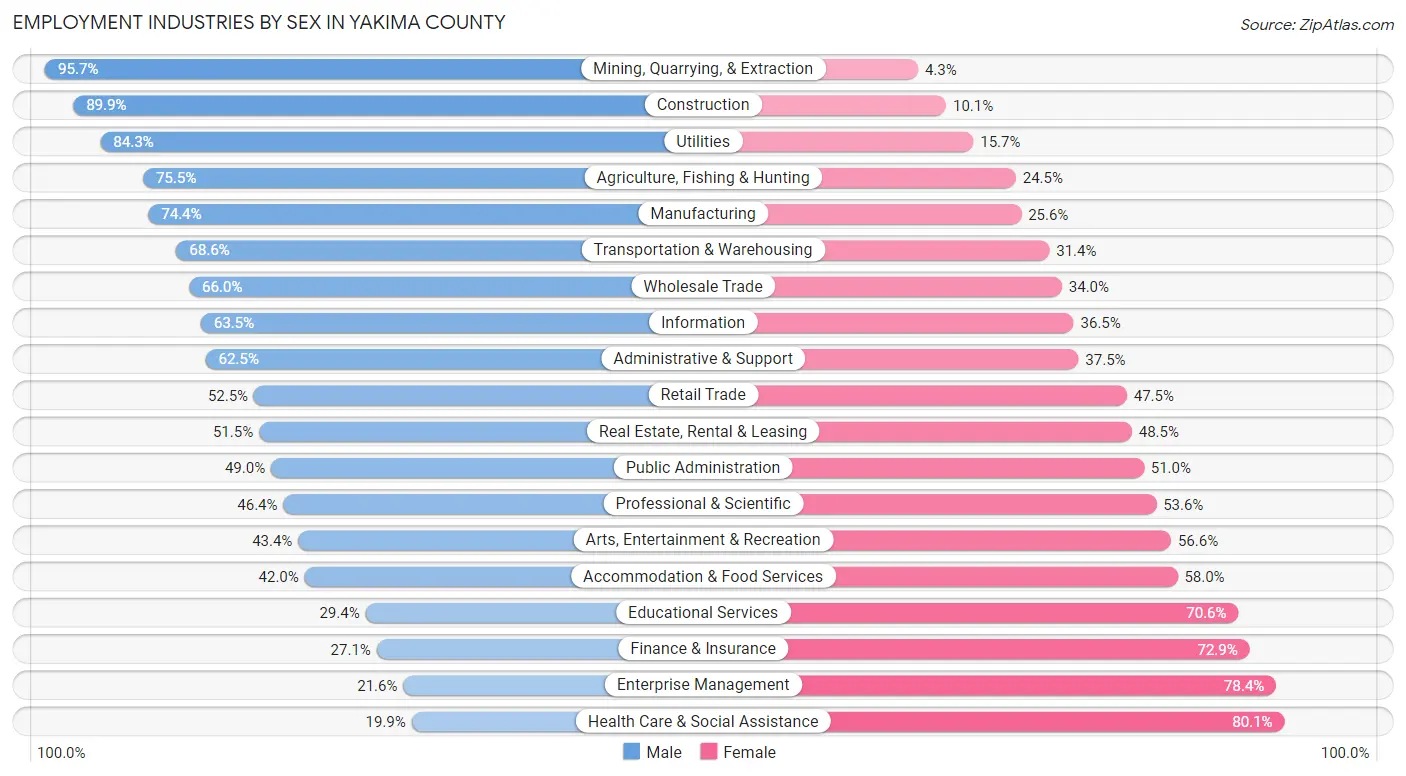
Employment Industries by Sex in Yakima County
The Yakima County industries that see more men than women are Mining, Quarrying, & Extraction (95.7%), Construction (89.9%), and Utilities (84.3%), whereas the industries that tend to have a higher number of women are Health Care & Social Assistance (80.1%), Enterprise Management (78.4%), and Finance & Insurance (72.9%).
| Industry | Male | Female |
| Agriculture, Fishing & Hunting | 12,259 (75.5%) | 3,981 (24.5%) |
| Mining, Quarrying, & Extraction | 90 (95.7%) | 4 (4.3%) |
| Construction | 5,384 (89.9%) | 603 (10.1%) |
| Manufacturing | 7,760 (74.4%) | 2,673 (25.6%) |
| Wholesale Trade | 3,403 (66.0%) | 1,756 (34.0%) |
| Retail Trade | 5,914 (52.5%) | 5,344 (47.5%) |
| Transportation & Warehousing | 4,490 (68.6%) | 2,058 (31.4%) |
| Utilities | 451 (84.3%) | 84 (15.7%) |
| Information | 507 (63.5%) | 291 (36.5%) |
| Finance & Insurance | 465 (27.1%) | 1,249 (72.9%) |
| Real Estate, Rental & Leasing | 709 (51.5%) | 668 (48.5%) |
| Professional & Scientific | 1,577 (46.4%) | 1,819 (53.6%) |
| Enterprise Management | 8 (21.6%) | 29 (78.4%) |
| Administrative & Support | 2,047 (62.5%) | 1,226 (37.5%) |
| Educational Services | 2,964 (29.4%) | 7,104 (70.6%) |
| Health Care & Social Assistance | 2,918 (19.9%) | 11,743 (80.1%) |
| Arts, Entertainment & Recreation | 677 (43.4%) | 884 (56.6%) |
| Accommodation & Food Services | 2,846 (42.0%) | 3,924 (58.0%) |
| Public Administration | 2,449 (49.0%) | 2,549 (51.0%) |
| Total | 58,856 (54.0%) | 50,046 (46.0%) |
Education in Yakima County
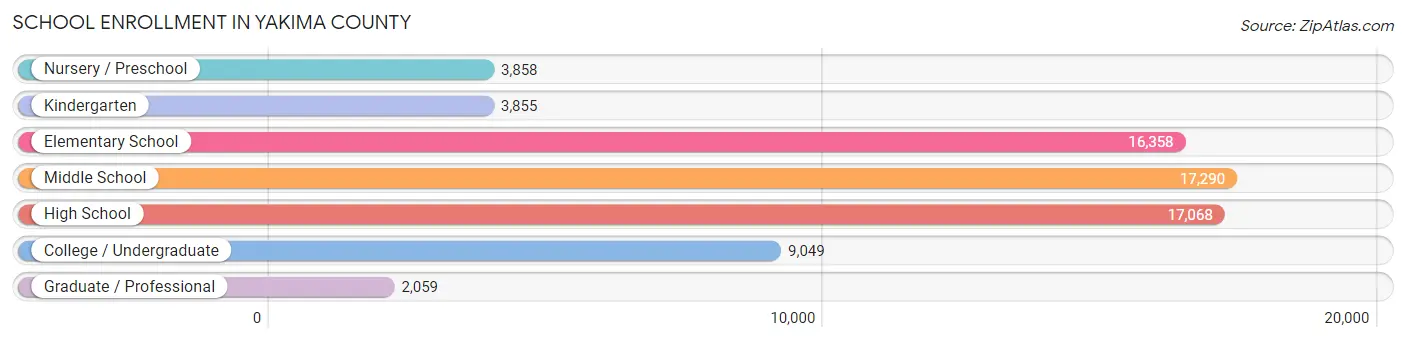
School Enrollment in Yakima County
The most common levels of schooling among the 69,537 students in Yakima County are middle school (17,290 | 24.9%), high school (17,068 | 24.5%), and elementary school (16,358 | 23.5%).
| School Level | # Students | % Students |
| Nursery / Preschool | 3,858 | 5.6% |
| Kindergarten | 3,855 | 5.5% |
| Elementary School | 16,358 | 23.5% |
| Middle School | 17,290 | 24.9% |
| High School | 17,068 | 24.5% |
| College / Undergraduate | 9,049 | 13.0% |
| Graduate / Professional | 2,059 | 3.0% |
| Total | 69,537 | 100.0% |
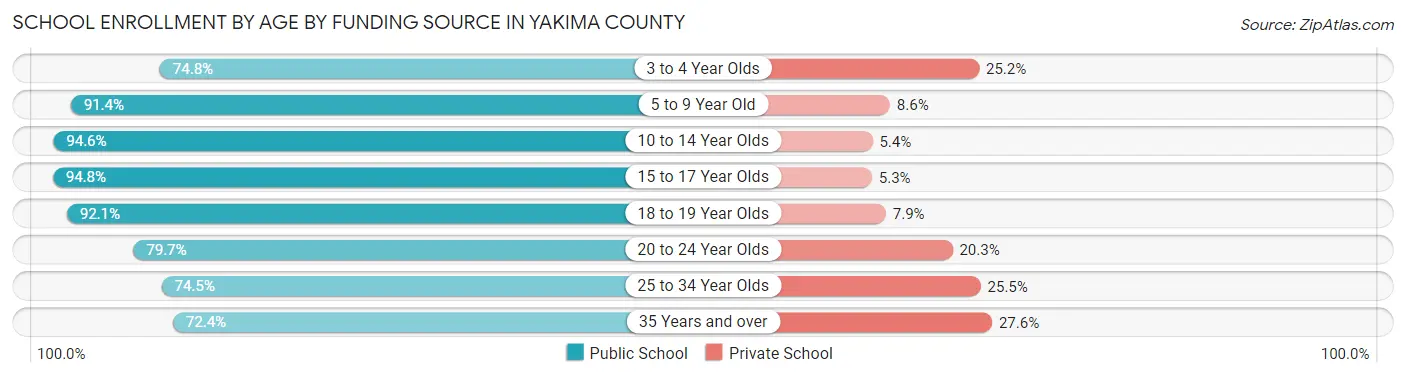
School Enrollment by Age by Funding Source in Yakima County
Out of a total of 69,537 students who are enrolled in schools in Yakima County, 6,745 (9.7%) attend a private institution, while the remaining 62,792 (90.3%) are enrolled in public schools. The age group of 35 years and over has the highest likelihood of being enrolled in private schools, with 601 (27.6% in the age bracket) enrolled. Conversely, the age group of 15 to 17 year olds has the lowest likelihood of being enrolled in a private school, with 11,499 (94.8% in the age bracket) attending a public institution.
| Age Bracket | Public School | Private School |
| 3 to 4 Year Olds | 1,931 (74.8%) | 651 (25.2%) |
| 5 to 9 Year Old | 17,608 (91.4%) | 1,659 (8.6%) |
| 10 to 14 Year Olds | 20,310 (94.6%) | 1,150 (5.4%) |
| 15 to 17 Year Olds | 11,499 (94.8%) | 637 (5.2%) |
| 18 to 19 Year Olds | 3,953 (92.1%) | 337 (7.9%) |
| 20 to 24 Year Olds | 3,600 (79.7%) | 915 (20.3%) |
| 25 to 34 Year Olds | 2,318 (74.5%) | 794 (25.5%) |
| 35 Years and over | 1,574 (72.4%) | 601 (27.6%) |
| Total | 62,792 (90.3%) | 6,745 (9.7%) |
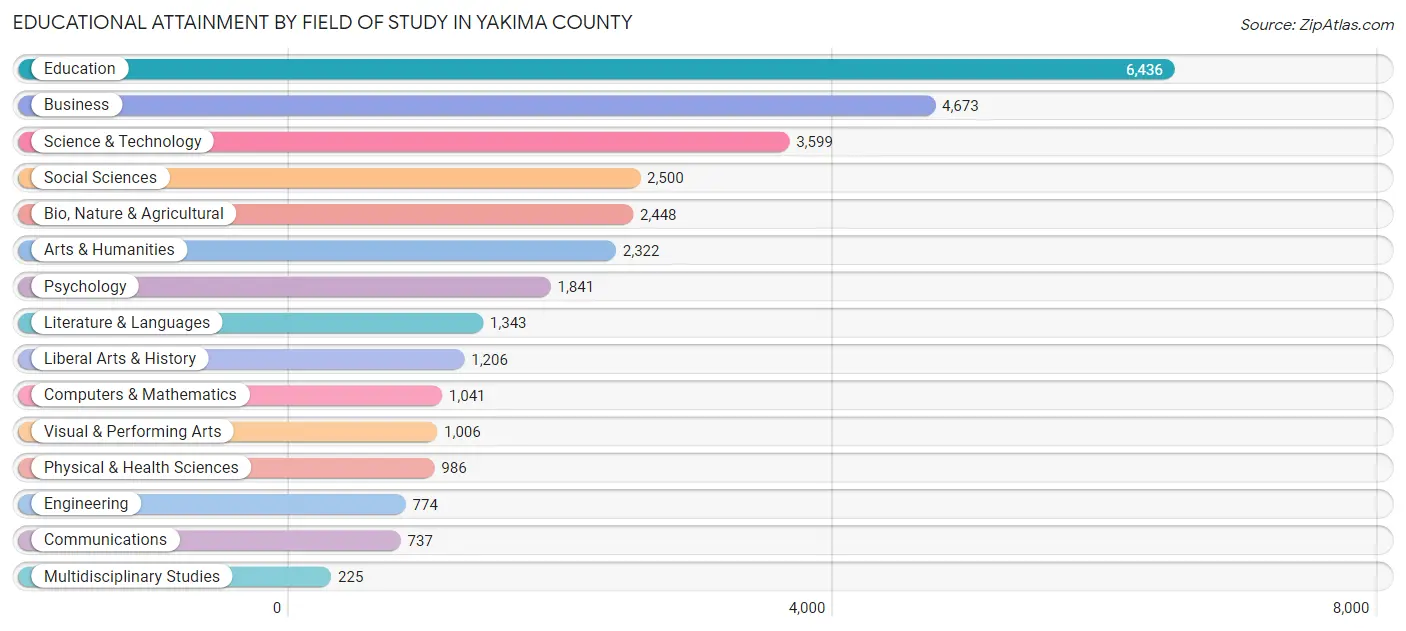
Educational Attainment by Field of Study in Yakima County
Education (6,436 | 20.7%), business (4,673 | 15.0%), science & technology (3,599 | 11.6%), social sciences (2,500 | 8.0%), and bio, nature & agricultural (2,448 | 7.9%) are the most common fields of study among 31,137 individuals in Yakima County who have obtained a bachelor's degree or higher.
| Field of Study | # Graduates | % Graduates |
| Computers & Mathematics | 1,041 | 3.3% |
| Bio, Nature & Agricultural | 2,448 | 7.9% |
| Physical & Health Sciences | 986 | 3.2% |
| Psychology | 1,841 | 5.9% |
| Social Sciences | 2,500 | 8.0% |
| Engineering | 774 | 2.5% |
| Multidisciplinary Studies | 225 | 0.7% |
| Science & Technology | 3,599 | 11.6% |
| Business | 4,673 | 15.0% |
| Education | 6,436 | 20.7% |
| Literature & Languages | 1,343 | 4.3% |
| Liberal Arts & History | 1,206 | 3.9% |
| Visual & Performing Arts | 1,006 | 3.2% |
| Communications | 737 | 2.4% |
| Arts & Humanities | 2,322 | 7.5% |
| Total | 31,137 | 100.0% |
Transportation & Commute in Yakima County
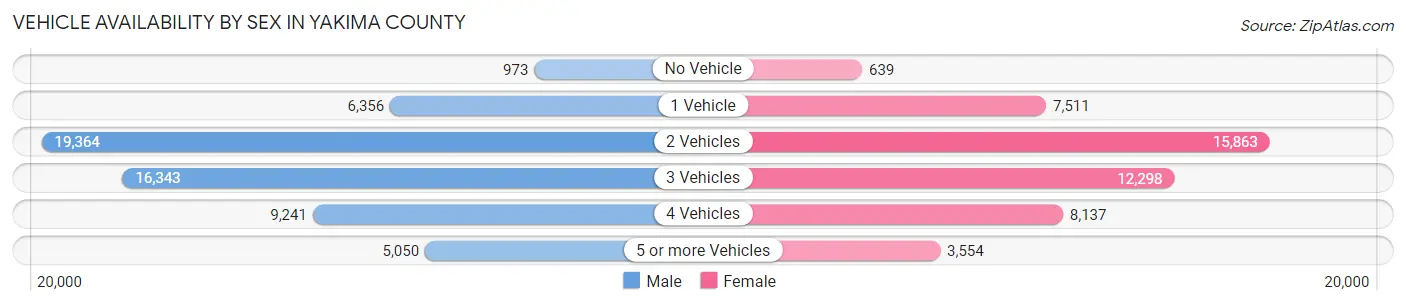
Vehicle Availability by Sex in Yakima County
The most prevalent vehicle ownership categories in Yakima County are males with 2 vehicles (19,364, accounting for 33.8%) and females with 2 vehicles (15,863, making up 40.3%).
| Vehicles Available | Male | Female |
| No Vehicle | 973 (1.7%) | 639 (1.3%) |
| 1 Vehicle | 6,356 (11.1%) | 7,511 (15.7%) |
| 2 Vehicles | 19,364 (33.8%) | 15,863 (33.1%) |
| 3 Vehicles | 16,343 (28.5%) | 12,298 (25.6%) |
| 4 Vehicles | 9,241 (16.1%) | 8,137 (17.0%) |
| 5 or more Vehicles | 5,050 (8.8%) | 3,554 (7.4%) |
| Total | 57,327 (100.0%) | 48,002 (100.0%) |
Commute Time in Yakima County
The most frequently occuring commute durations in Yakima County are 15 to 19 minutes (21,681 commuters, 21.6%), 10 to 14 minutes (19,090 commuters, 19.1%), and 5 to 9 minutes (14,458 commuters, 14.4%).
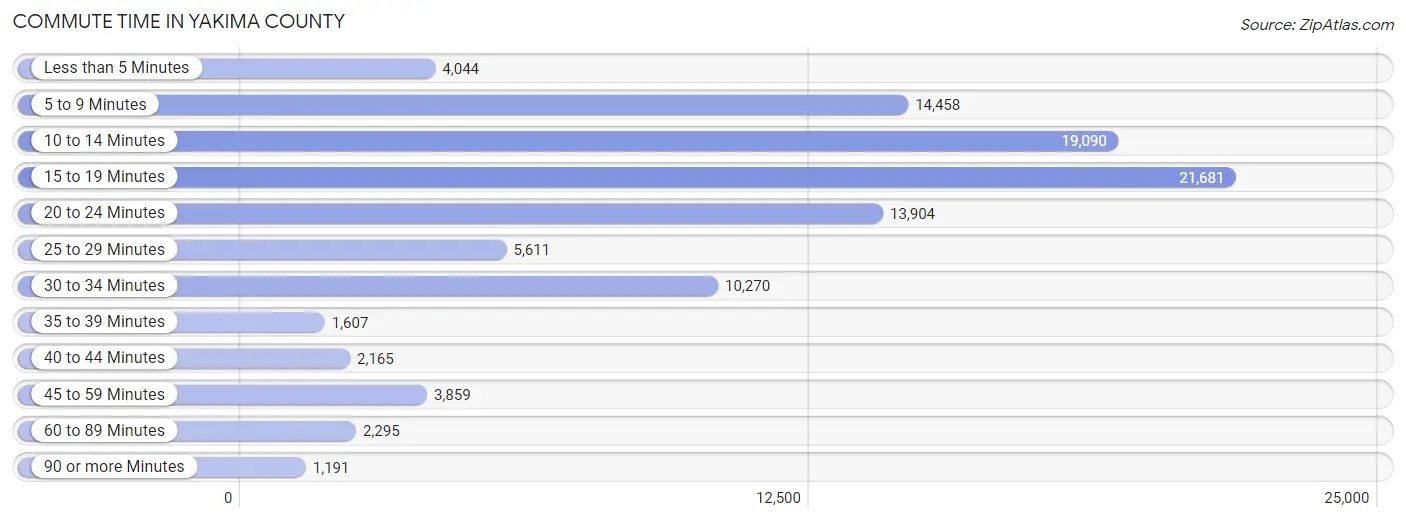
| Commute Time | # Commuters | % Commuters |
| Less than 5 Minutes | 4,044 | 4.0% |
| 5 to 9 Minutes | 14,458 | 14.4% |
| 10 to 14 Minutes | 19,090 | 19.1% |
| 15 to 19 Minutes | 21,681 | 21.6% |
| 20 to 24 Minutes | 13,904 | 13.9% |
| 25 to 29 Minutes | 5,611 | 5.6% |
| 30 to 34 Minutes | 10,270 | 10.2% |
| 35 to 39 Minutes | 1,607 | 1.6% |
| 40 to 44 Minutes | 2,165 | 2.2% |
| 45 to 59 Minutes | 3,859 | 3.8% |
| 60 to 89 Minutes | 2,295 | 2.3% |
| 90 or more Minutes | 1,191 | 1.2% |
Commute Time by Sex in Yakima County
The most common commute times in Yakima County are 15 to 19 minutes (11,611 commuters, 21.0%) for males and 15 to 19 minutes (10,070 commuters, 22.4%) for females.
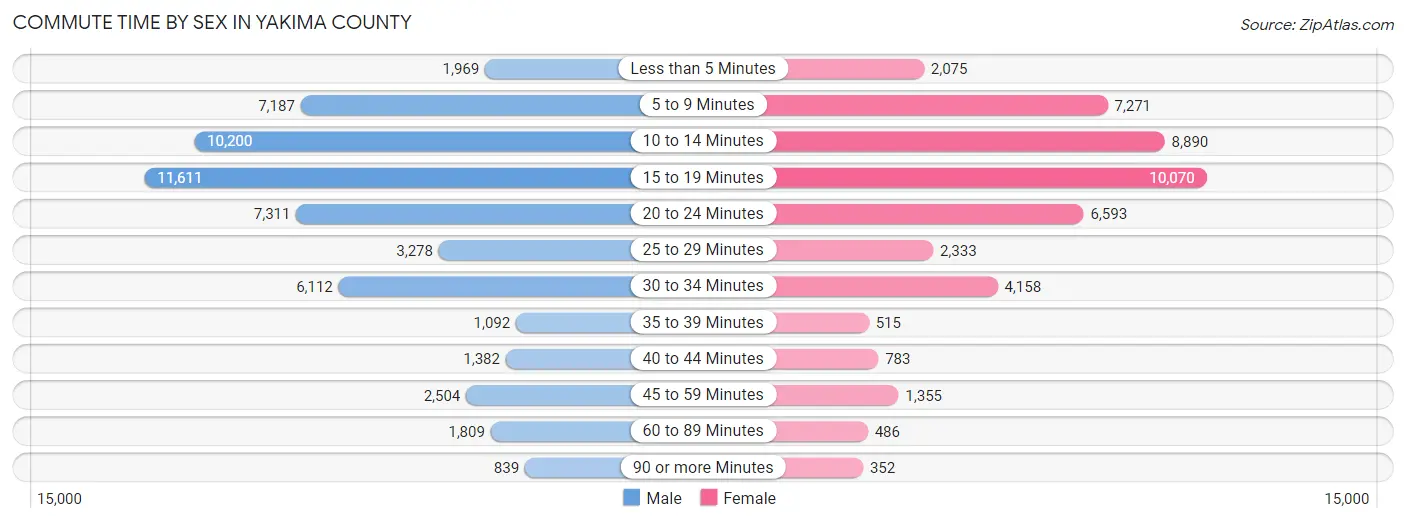
| Commute Time | Male | Female |
| Less than 5 Minutes | 1,969 (3.6%) | 2,075 (4.6%) |
| 5 to 9 Minutes | 7,187 (13.0%) | 7,271 (16.2%) |
| 10 to 14 Minutes | 10,200 (18.4%) | 8,890 (19.8%) |
| 15 to 19 Minutes | 11,611 (21.0%) | 10,070 (22.4%) |
| 20 to 24 Minutes | 7,311 (13.2%) | 6,593 (14.7%) |
| 25 to 29 Minutes | 3,278 (5.9%) | 2,333 (5.2%) |
| 30 to 34 Minutes | 6,112 (11.1%) | 4,158 (9.3%) |
| 35 to 39 Minutes | 1,092 (2.0%) | 515 (1.1%) |
| 40 to 44 Minutes | 1,382 (2.5%) | 783 (1.7%) |
| 45 to 59 Minutes | 2,504 (4.5%) | 1,355 (3.0%) |
| 60 to 89 Minutes | 1,809 (3.3%) | 486 (1.1%) |
| 90 or more Minutes | 839 (1.5%) | 352 (0.8%) |
Time of Departure to Work by Sex in Yakima County
The most frequent times of departure to work in Yakima County are 7:00 AM to 7:29 AM (7,130, 12.9%) for males and 7:30 AM to 7:59 AM (7,512, 16.7%) for females.
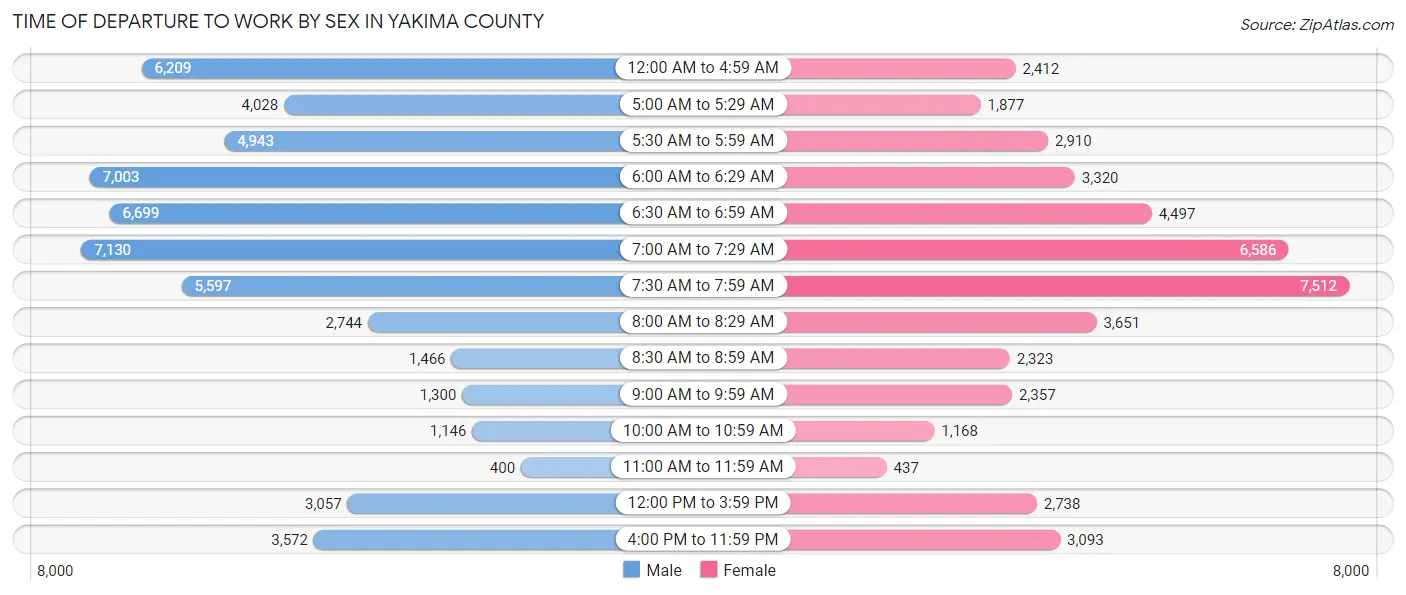
| Time of Departure | Male | Female |
| 12:00 AM to 4:59 AM | 6,209 (11.2%) | 2,412 (5.4%) |
| 5:00 AM to 5:29 AM | 4,028 (7.3%) | 1,877 (4.2%) |
| 5:30 AM to 5:59 AM | 4,943 (8.9%) | 2,910 (6.5%) |
| 6:00 AM to 6:29 AM | 7,003 (12.7%) | 3,320 (7.4%) |
| 6:30 AM to 6:59 AM | 6,699 (12.1%) | 4,497 (10.0%) |
| 7:00 AM to 7:29 AM | 7,130 (12.9%) | 6,586 (14.7%) |
| 7:30 AM to 7:59 AM | 5,597 (10.1%) | 7,512 (16.7%) |
| 8:00 AM to 8:29 AM | 2,744 (5.0%) | 3,651 (8.1%) |
| 8:30 AM to 8:59 AM | 1,466 (2.6%) | 2,323 (5.2%) |
| 9:00 AM to 9:59 AM | 1,300 (2.4%) | 2,357 (5.2%) |
| 10:00 AM to 10:59 AM | 1,146 (2.1%) | 1,168 (2.6%) |
| 11:00 AM to 11:59 AM | 400 (0.7%) | 437 (1.0%) |
| 12:00 PM to 3:59 PM | 3,057 (5.5%) | 2,738 (6.1%) |
| 4:00 PM to 11:59 PM | 3,572 (6.5%) | 3,093 (6.9%) |
| Total | 55,294 (100.0%) | 44,881 (100.0%) |
Housing Occupancy in Yakima County
Occupancy by Ownership in Yakima County
Of the total 85,558 dwellings in Yakima County, owner-occupied units account for 53,324 (62.3%), while renter-occupied units make up 32,234 (37.7%).
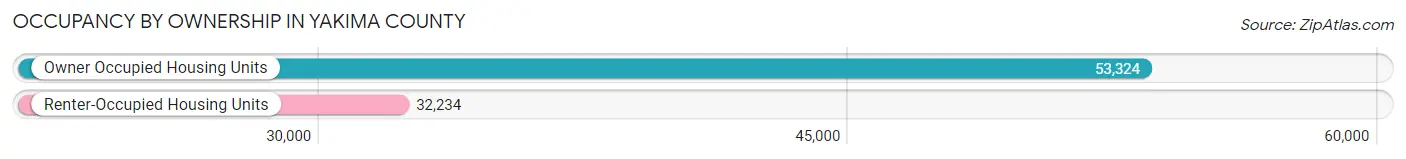
| Occupancy | # Housing Units | % Housing Units |
| Owner Occupied Housing Units | 53,324 | 62.3% |
| Renter-Occupied Housing Units | 32,234 | 37.7% |
| Total Occupied Housing Units | 85,558 | 100.0% |
Occupancy by Household Size in Yakima County
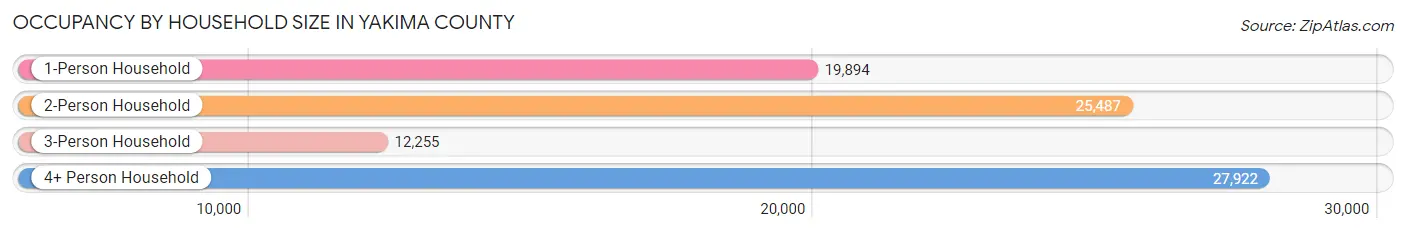
| Household Size | # Housing Units | % Housing Units |
| 1-Person Household | 19,894 | 23.3% |
| 2-Person Household | 25,487 | 29.8% |
| 3-Person Household | 12,255 | 14.3% |
| 4+ Person Household | 27,922 | 32.6% |
| Total Housing Units | 85,558 | 100.0% |
Occupancy by Ownership by Household Size in Yakima County
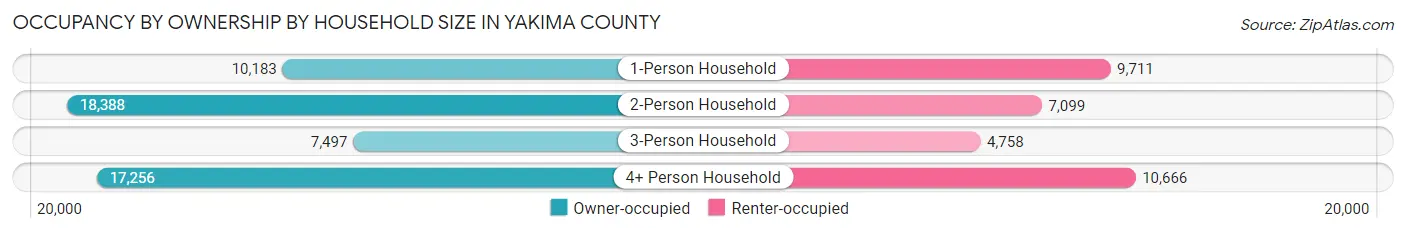
| Household Size | Owner-occupied | Renter-occupied |
| 1-Person Household | 10,183 (51.2%) | 9,711 (48.8%) |
| 2-Person Household | 18,388 (72.2%) | 7,099 (27.9%) |
| 3-Person Household | 7,497 (61.2%) | 4,758 (38.8%) |
| 4+ Person Household | 17,256 (61.8%) | 10,666 (38.2%) |
| Total Housing Units | 53,324 (62.3%) | 32,234 (37.7%) |
Occupancy by Educational Attainment in Yakima County
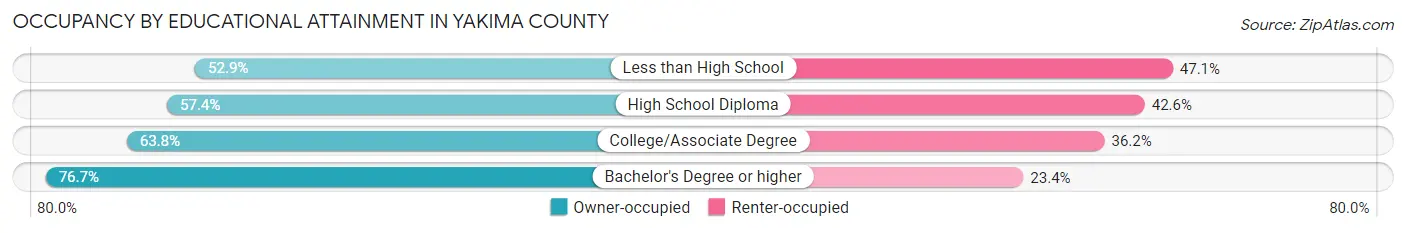
| Household Size | Owner-occupied | Renter-occupied |
| Less than High School | 9,812 (52.9%) | 8,722 (47.1%) |
| High School Diploma | 13,297 (57.4%) | 9,871 (42.6%) |
| College/Associate Degree | 16,851 (63.8%) | 9,570 (36.2%) |
| Bachelor's Degree or higher | 13,364 (76.6%) | 4,071 (23.4%) |
Occupancy by Age of Householder in Yakima County
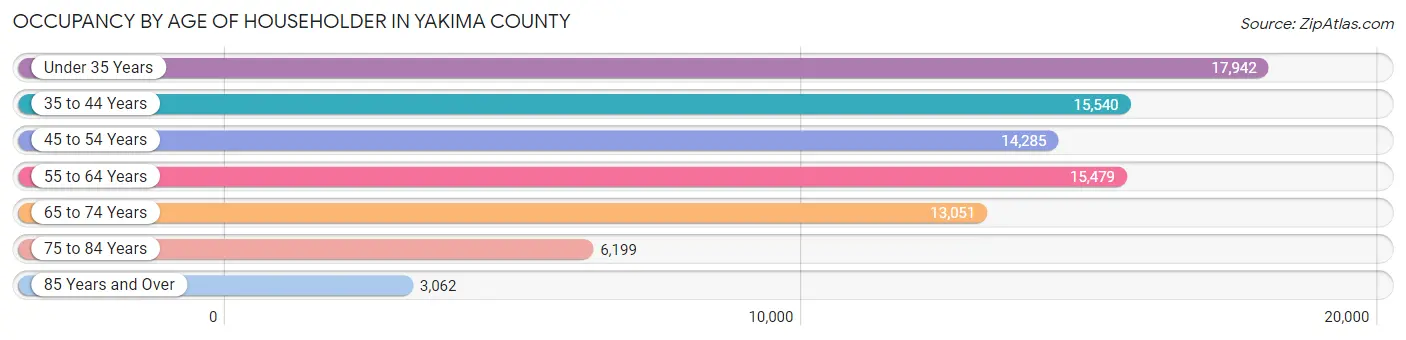
| Age Bracket | # Households | % Households |
| Under 35 Years | 17,942 | 21.0% |
| 35 to 44 Years | 15,540 | 18.2% |
| 45 to 54 Years | 14,285 | 16.7% |
| 55 to 64 Years | 15,479 | 18.1% |
| 65 to 74 Years | 13,051 | 15.2% |
| 75 to 84 Years | 6,199 | 7.2% |
| 85 Years and Over | 3,062 | 3.6% |
| Total | 85,558 | 100.0% |
Housing Finances in Yakima County
Median Income by Occupancy in Yakima County
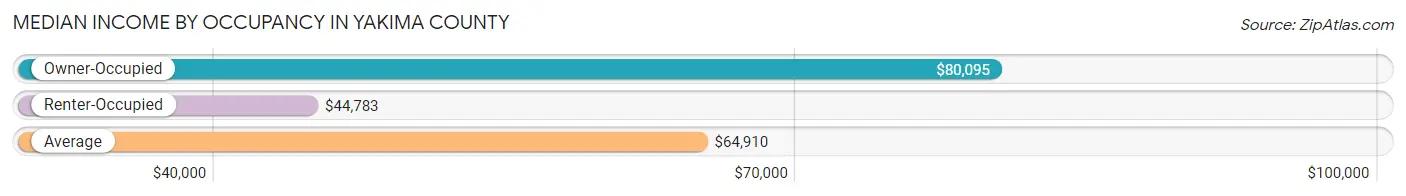
| Occupancy Type | # Households | Median Income |
| Owner-Occupied | 53,324 (62.3%) | $80,095 |
| Renter-Occupied | 32,234 (37.7%) | $44,783 |
| Average | 85,558 (100.0%) | $64,910 |
Occupancy by Householder Income Bracket in Yakima County
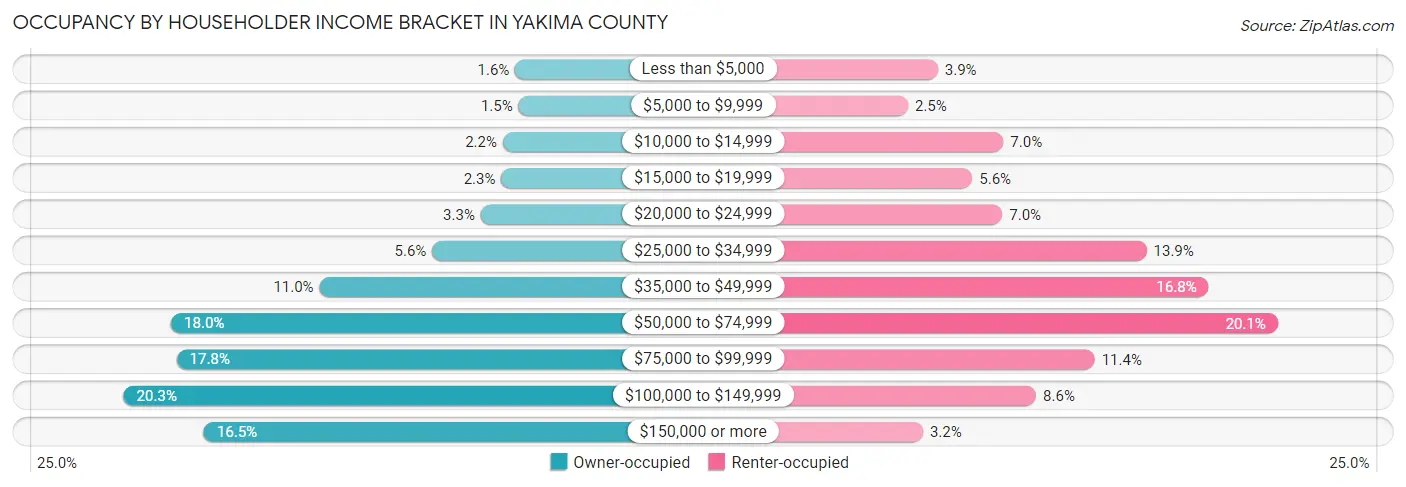
| Income Bracket | Owner-occupied | Renter-occupied |
| Less than $5,000 | 875 (1.6%) | 1,265 (3.9%) |
| $5,000 to $9,999 | 789 (1.5%) | 806 (2.5%) |
| $10,000 to $14,999 | 1,187 (2.2%) | 2,269 (7.0%) |
| $15,000 to $19,999 | 1,225 (2.3%) | 1,793 (5.6%) |
| $20,000 to $24,999 | 1,749 (3.3%) | 2,253 (7.0%) |
| $25,000 to $34,999 | 2,979 (5.6%) | 4,469 (13.9%) |
| $35,000 to $49,999 | 5,842 (11.0%) | 5,420 (16.8%) |
| $50,000 to $74,999 | 9,611 (18.0%) | 6,480 (20.1%) |
| $75,000 to $99,999 | 9,470 (17.8%) | 3,672 (11.4%) |
| $100,000 to $149,999 | 10,818 (20.3%) | 2,772 (8.6%) |
| $150,000 or more | 8,779 (16.5%) | 1,035 (3.2%) |
| Total | 53,324 (100.0%) | 32,234 (100.0%) |
Monthly Housing Cost Tiers in Yakima County
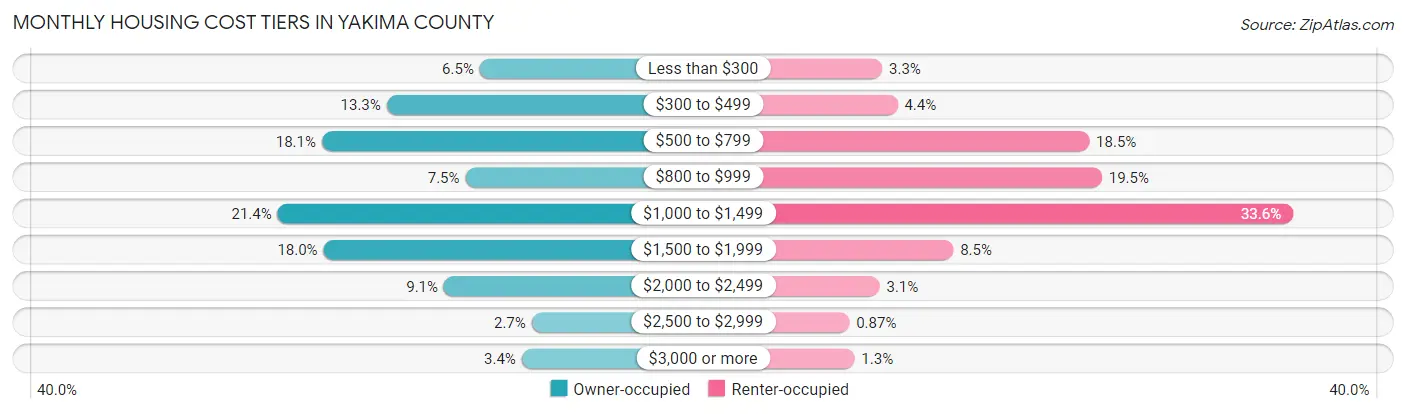
| Monthly Cost | Owner-occupied | Renter-occupied |
| Less than $300 | 3,458 (6.5%) | 1,061 (3.3%) |
| $300 to $499 | 7,116 (13.3%) | 1,425 (4.4%) |
| $500 to $799 | 9,658 (18.1%) | 5,975 (18.5%) |
| $800 to $999 | 4,020 (7.5%) | 6,276 (19.5%) |
| $1,000 to $1,499 | 11,393 (21.4%) | 10,815 (33.6%) |
| $1,500 to $1,999 | 9,591 (18.0%) | 2,751 (8.5%) |
| $2,000 to $2,499 | 4,862 (9.1%) | 999 (3.1%) |
| $2,500 to $2,999 | 1,419 (2.7%) | 282 (0.9%) |
| $3,000 or more | 1,807 (3.4%) | 403 (1.3%) |
| Total | 53,324 (100.0%) | 32,234 (100.0%) |
Physical Housing Characteristics in Yakima County
Housing Structures in Yakima County
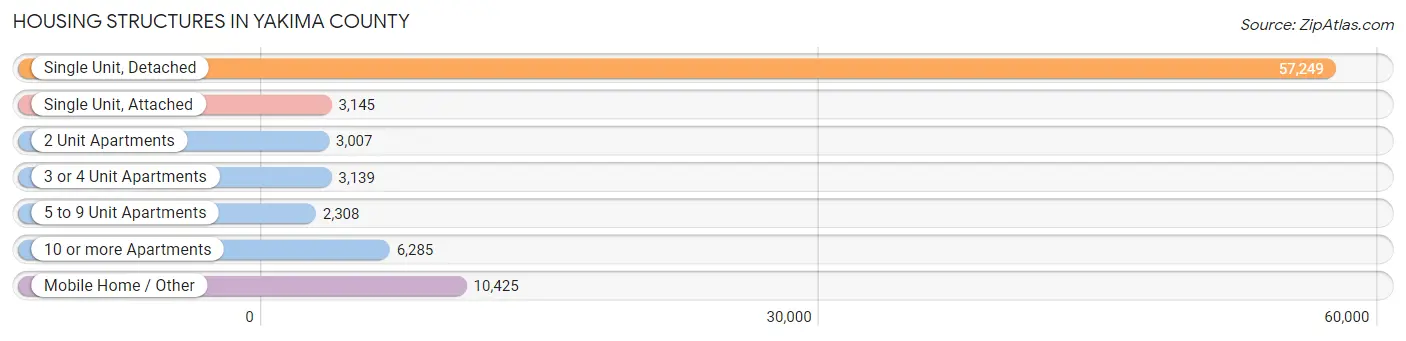
| Structure Type | # Housing Units | % Housing Units |
| Single Unit, Detached | 57,249 | 66.9% |
| Single Unit, Attached | 3,145 | 3.7% |
| 2 Unit Apartments | 3,007 | 3.5% |
| 3 or 4 Unit Apartments | 3,139 | 3.7% |
| 5 to 9 Unit Apartments | 2,308 | 2.7% |
| 10 or more Apartments | 6,285 | 7.3% |
| Mobile Home / Other | 10,425 | 12.2% |
| Total | 85,558 | 100.0% |
Housing Structures by Occupancy in Yakima County
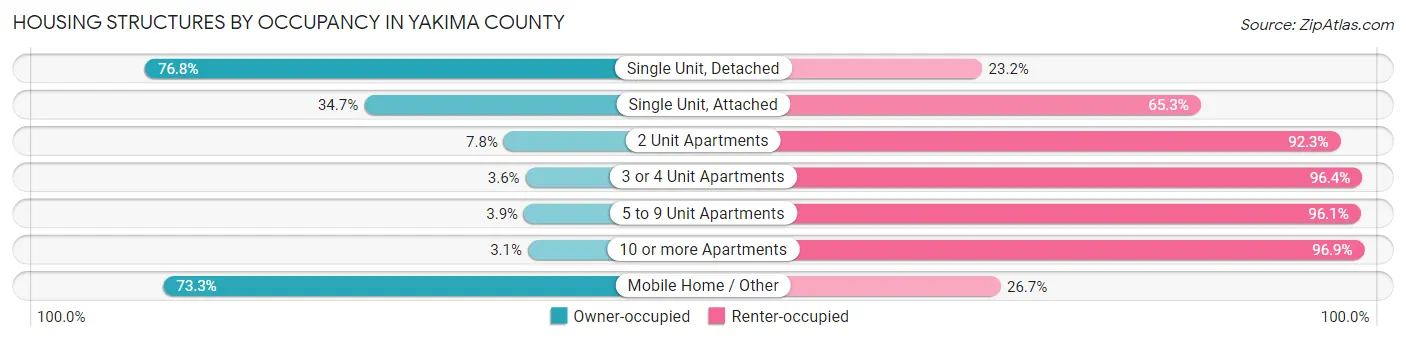
| Structure Type | Owner-occupied | Renter-occupied |
| Single Unit, Detached | 43,966 (76.8%) | 13,283 (23.2%) |
| Single Unit, Attached | 1,090 (34.7%) | 2,055 (65.3%) |
| 2 Unit Apartments | 233 (7.7%) | 2,774 (92.2%) |
| 3 or 4 Unit Apartments | 112 (3.6%) | 3,027 (96.4%) |
| 5 to 9 Unit Apartments | 89 (3.9%) | 2,219 (96.1%) |
| 10 or more Apartments | 196 (3.1%) | 6,089 (96.9%) |
| Mobile Home / Other | 7,638 (73.3%) | 2,787 (26.7%) |
| Total | 53,324 (62.3%) | 32,234 (37.7%) |
Housing Structures by Number of Rooms in Yakima County
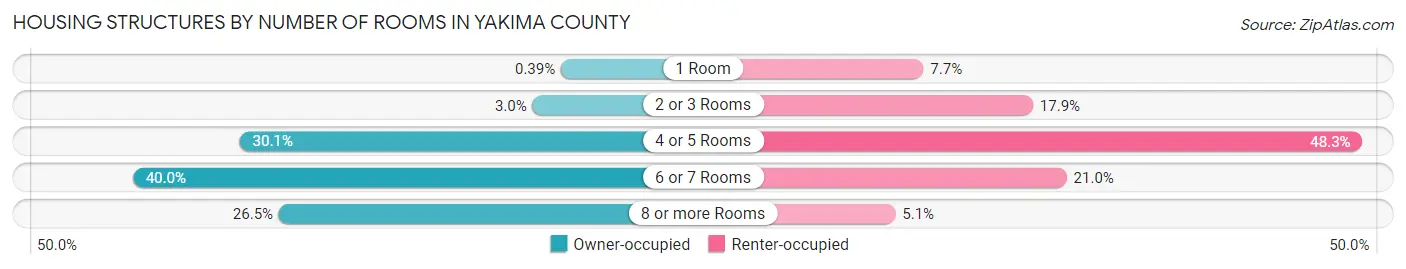
| Number of Rooms | Owner-occupied | Renter-occupied |
| 1 Room | 208 (0.4%) | 2,490 (7.7%) |
| 2 or 3 Rooms | 1,611 (3.0%) | 5,755 (17.8%) |
| 4 or 5 Rooms | 16,057 (30.1%) | 15,576 (48.3%) |
| 6 or 7 Rooms | 21,330 (40.0%) | 6,761 (21.0%) |
| 8 or more Rooms | 14,118 (26.5%) | 1,652 (5.1%) |
| Total | 53,324 (100.0%) | 32,234 (100.0%) |
Housing Structure by Heating Type in Yakima County
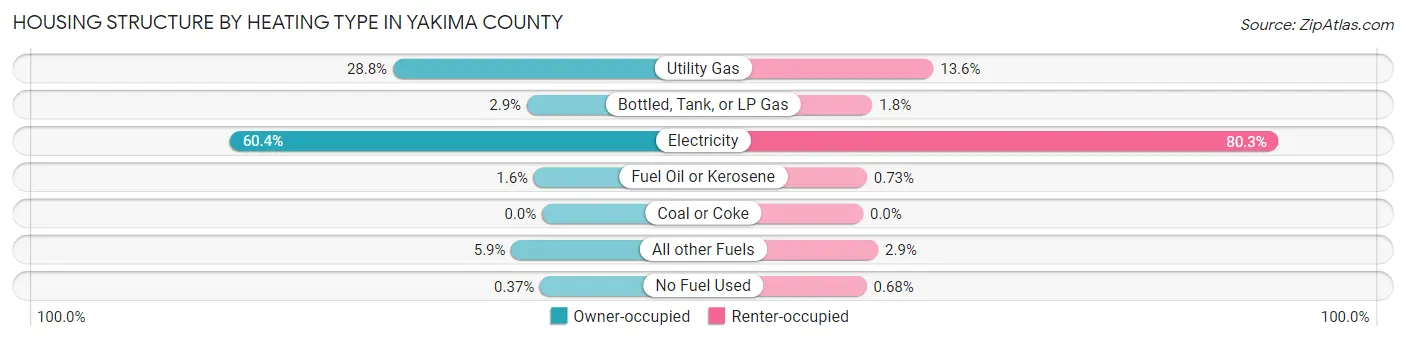
| Heating Type | Owner-occupied | Renter-occupied |
| Utility Gas | 15,370 (28.8%) | 4,377 (13.6%) |
| Bottled, Tank, or LP Gas | 1,566 (2.9%) | 584 (1.8%) |
| Electricity | 32,179 (60.4%) | 25,876 (80.3%) |
| Fuel Oil or Kerosene | 844 (1.6%) | 236 (0.7%) |
| Coal or Coke | 0 (0.0%) | 0 (0.0%) |
| All other Fuels | 3,170 (5.9%) | 941 (2.9%) |
| No Fuel Used | 195 (0.4%) | 220 (0.7%) |
| Total | 53,324 (100.0%) | 32,234 (100.0%) |
Household Vehicle Usage in Yakima County
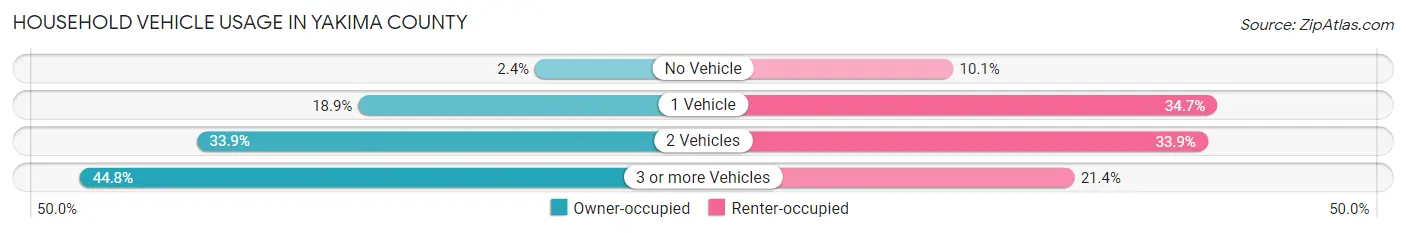
| Vehicles per Household | Owner-occupied | Renter-occupied |
| No Vehicle | 1,259 (2.4%) | 3,239 (10.1%) |
| 1 Vehicle | 10,057 (18.9%) | 11,198 (34.7%) |
| 2 Vehicles | 18,096 (33.9%) | 10,913 (33.9%) |
| 3 or more Vehicles | 23,912 (44.8%) | 6,884 (21.4%) |
| Total | 53,324 (100.0%) | 32,234 (100.0%) |
Real Estate & Mortgages in Yakima County
Real Estate and Mortgage Overview in Yakima County
| Characteristic | Without Mortgage | With Mortgage |
| Housing Units | 21,869 | 31,455 |
| Median Property Value | $216,100 | $275,300 |
| Median Household Income | $62,974 | $6,168 |
| Monthly Housing Costs | $517 | $1,760 |
| Real Estate Taxes | $1,900 | $1,467 |
Property Value by Mortgage Status in Yakima County
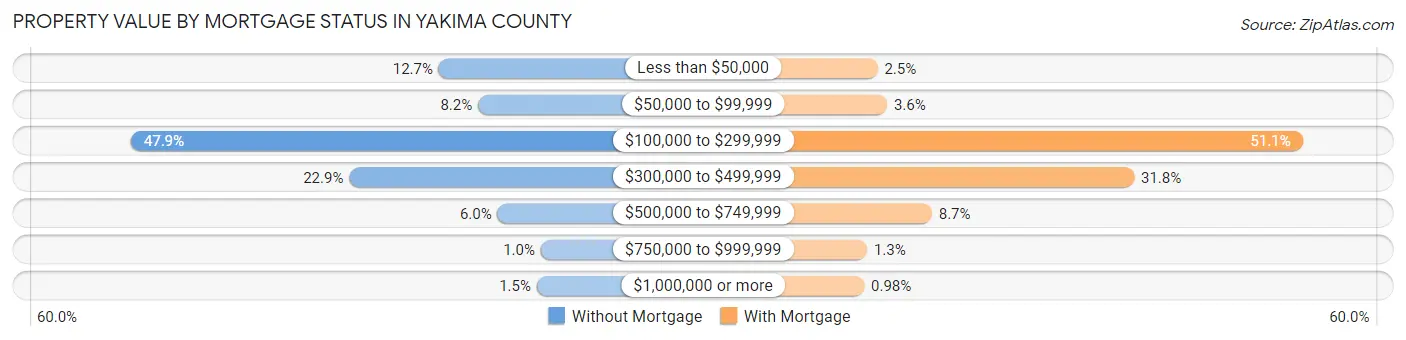
| Property Value | Without Mortgage | With Mortgage |
| Less than $50,000 | 2,768 (12.7%) | 786 (2.5%) |
| $50,000 to $99,999 | 1,788 (8.2%) | 1,129 (3.6%) |
| $100,000 to $299,999 | 10,465 (47.8%) | 16,069 (51.1%) |
| $300,000 to $499,999 | 5,008 (22.9%) | 10,013 (31.8%) |
| $500,000 to $749,999 | 1,301 (5.9%) | 2,739 (8.7%) |
| $750,000 to $999,999 | 220 (1.0%) | 411 (1.3%) |
| $1,000,000 or more | 319 (1.5%) | 308 (1.0%) |
| Total | 21,869 (100.0%) | 31,455 (100.0%) |
Household Income by Mortgage Status in Yakima County
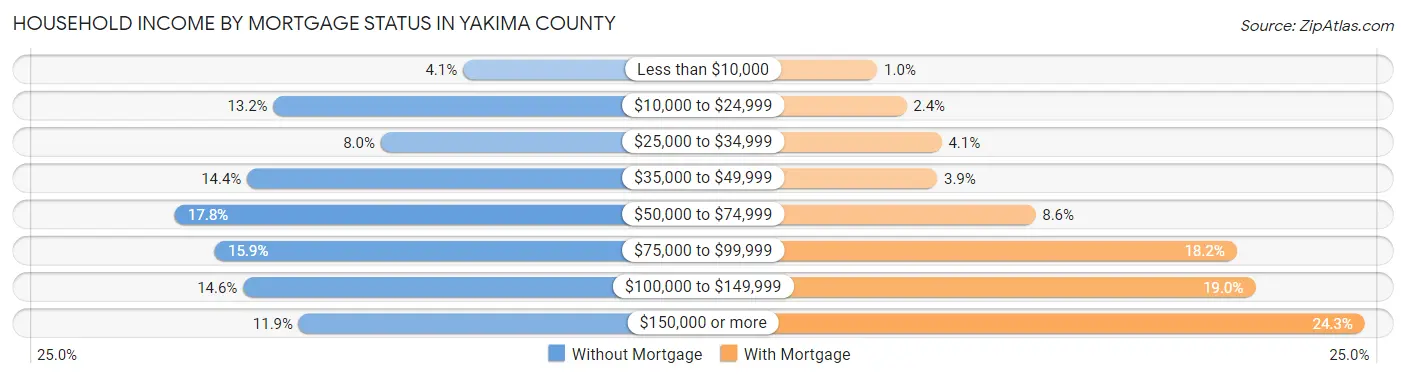
| Household Income | Without Mortgage | With Mortgage |
| Less than $10,000 | 902 (4.1%) | 325 (1.0%) |
| $10,000 to $24,999 | 2,875 (13.2%) | 762 (2.4%) |
| $25,000 to $34,999 | 1,758 (8.0%) | 1,286 (4.1%) |
| $35,000 to $49,999 | 3,149 (14.4%) | 1,221 (3.9%) |
| $50,000 to $74,999 | 3,901 (17.8%) | 2,693 (8.6%) |
| $75,000 to $99,999 | 3,483 (15.9%) | 5,710 (18.1%) |
| $100,000 to $149,999 | 3,190 (14.6%) | 5,987 (19.0%) |
| $150,000 or more | 2,611 (11.9%) | 7,628 (24.2%) |
| Total | 21,869 (100.0%) | 31,455 (100.0%) |
Property Value to Household Income Ratio in Yakima County
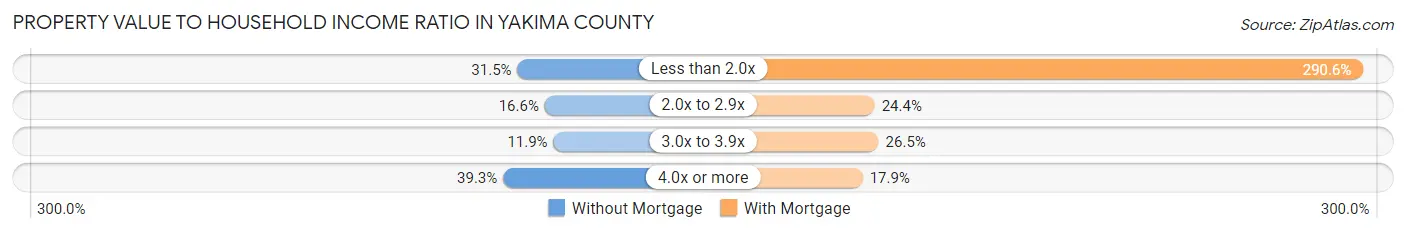
| Value-to-Income Ratio | Without Mortgage | With Mortgage |
| Less than 2.0x | 6,887 (31.5%) | 91,393 (290.5%) |
| 2.0x to 2.9x | 3,634 (16.6%) | 7,677 (24.4%) |
| 3.0x to 3.9x | 2,595 (11.9%) | 8,349 (26.5%) |
| 4.0x or more | 8,595 (39.3%) | 5,618 (17.9%) |
| Total | 21,869 (100.0%) | 31,455 (100.0%) |
Real Estate Taxes by Mortgage Status in Yakima County
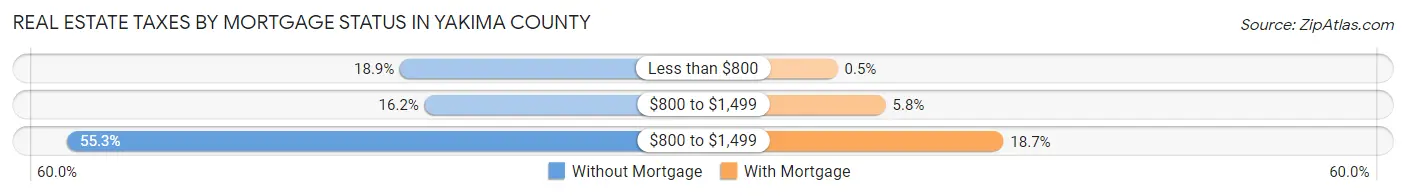
| Property Taxes | Without Mortgage | With Mortgage |
| Less than $800 | 4,123 (18.9%) | 157 (0.5%) |
| $800 to $1,499 | 3,534 (16.2%) | 1,813 (5.8%) |
| $800 to $1,499 | 12,103 (55.3%) | 5,872 (18.7%) |
| Total | 21,869 (100.0%) | 31,455 (100.0%) |
Health & Disability in Yakima County
Health Insurance Coverage by Age in Yakima County
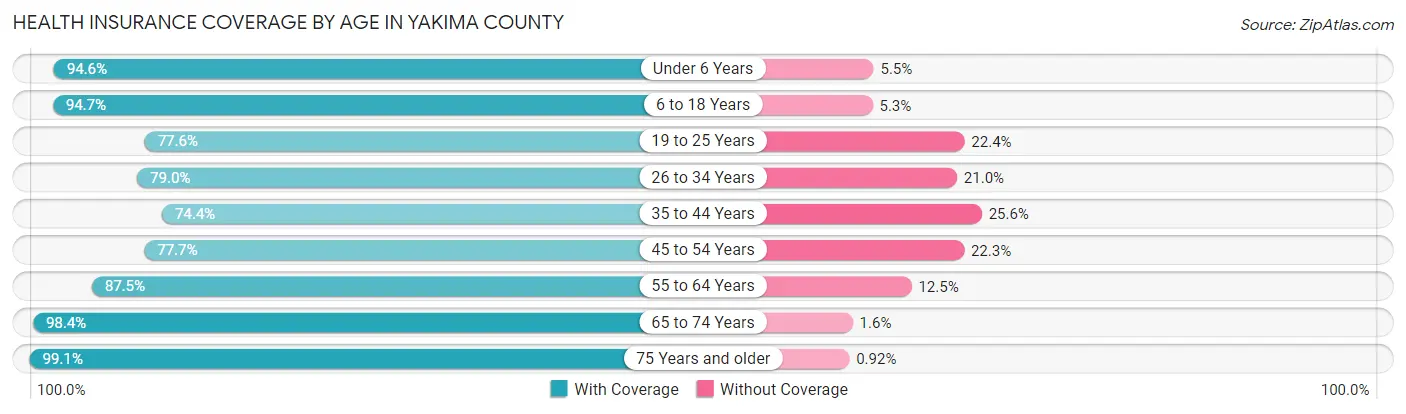
| Age Bracket | With Coverage | Without Coverage |
| Under 6 Years | 21,963 (94.6%) | 1,265 (5.4%) |
| 6 to 18 Years | 53,093 (94.7%) | 2,956 (5.3%) |
| 19 to 25 Years | 18,610 (77.6%) | 5,372 (22.4%) |
| 26 to 34 Years | 24,343 (79.0%) | 6,470 (21.0%) |
| 35 to 44 Years | 22,576 (74.4%) | 7,777 (25.6%) |
| 45 to 54 Years | 21,179 (77.7%) | 6,087 (22.3%) |
| 55 to 64 Years | 23,751 (87.5%) | 3,401 (12.5%) |
| 65 to 74 Years | 20,707 (98.4%) | 329 (1.6%) |
| 75 Years and older | 13,874 (99.1%) | 129 (0.9%) |
| Total | 220,096 (86.7%) | 33,786 (13.3%) |
Health Insurance Coverage by Citizenship Status in Yakima County
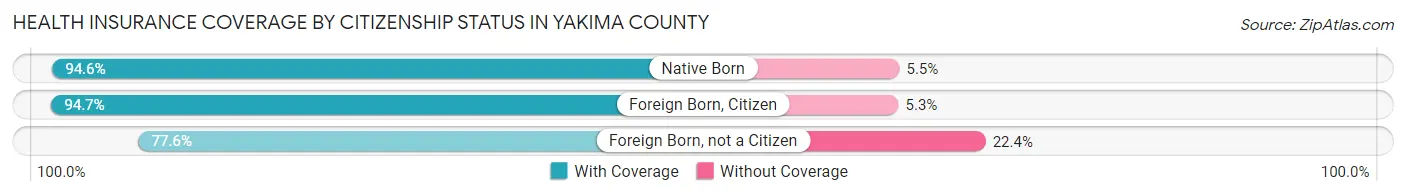
| Citizenship Status | With Coverage | Without Coverage |
| Native Born | 21,963 (94.6%) | 1,265 (5.4%) |
| Foreign Born, Citizen | 53,093 (94.7%) | 2,956 (5.3%) |
| Foreign Born, not a Citizen | 18,610 (77.6%) | 5,372 (22.4%) |
Health Insurance Coverage by Household Income in Yakima County
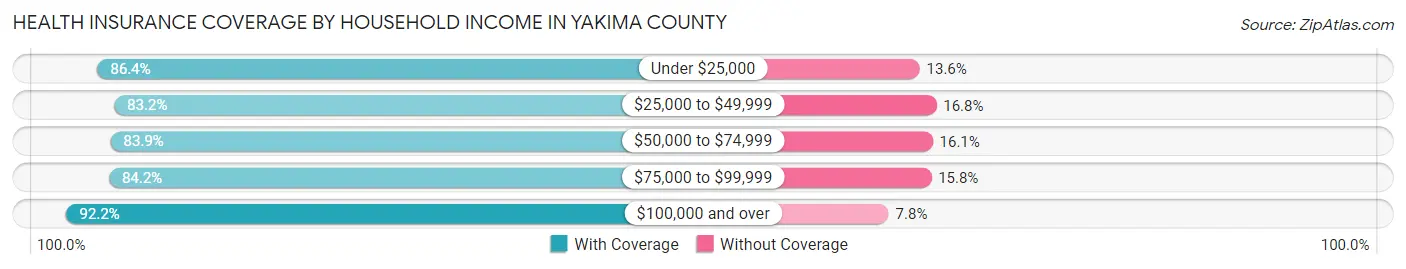
| Household Income | With Coverage | Without Coverage |
| Under $25,000 | 23,999 (86.4%) | 3,792 (13.6%) |
| $25,000 to $49,999 | 41,683 (83.2%) | 8,400 (16.8%) |
| $50,000 to $74,999 | 41,879 (83.9%) | 8,027 (16.1%) |
| $75,000 to $99,999 | 36,470 (84.2%) | 6,851 (15.8%) |
| $100,000 and over | 74,642 (92.2%) | 6,349 (7.8%) |
Public vs Private Health Insurance Coverage by Age in Yakima County
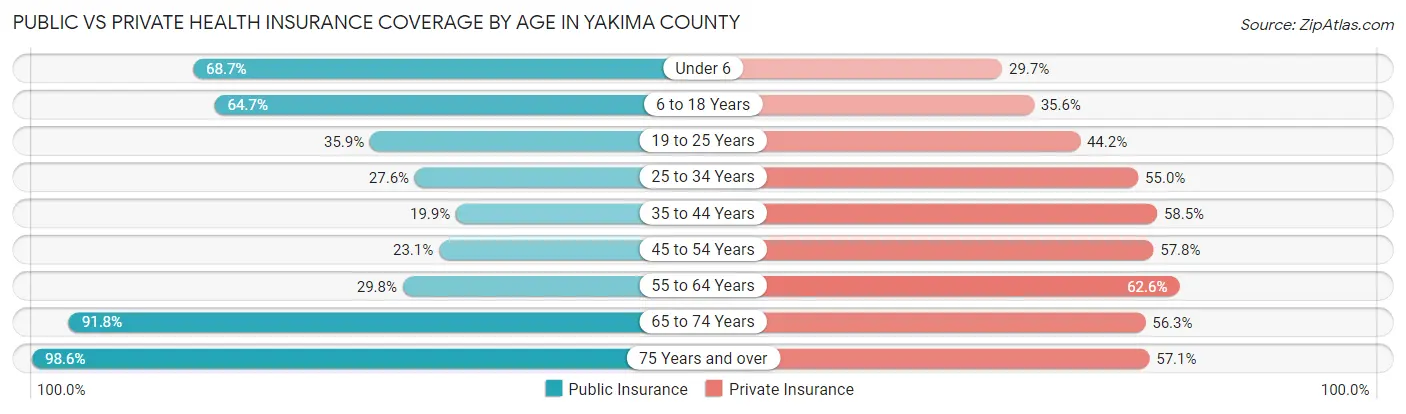
| Age Bracket | Public Insurance | Private Insurance |
| Under 6 | 15,959 (68.7%) | 6,909 (29.7%) |
| 6 to 18 Years | 36,286 (64.7%) | 19,967 (35.6%) |
| 19 to 25 Years | 8,605 (35.9%) | 10,602 (44.2%) |
| 25 to 34 Years | 8,489 (27.6%) | 16,951 (55.0%) |
| 35 to 44 Years | 6,046 (19.9%) | 17,757 (58.5%) |
| 45 to 54 Years | 6,289 (23.1%) | 15,766 (57.8%) |
| 55 to 64 Years | 8,090 (29.8%) | 17,006 (62.6%) |
| 65 to 74 Years | 19,307 (91.8%) | 11,850 (56.3%) |
| 75 Years and over | 13,808 (98.6%) | 7,991 (57.1%) |
| Total | 122,879 (48.4%) | 124,799 (49.2%) |
Disability Status by Sex by Age in Yakima County
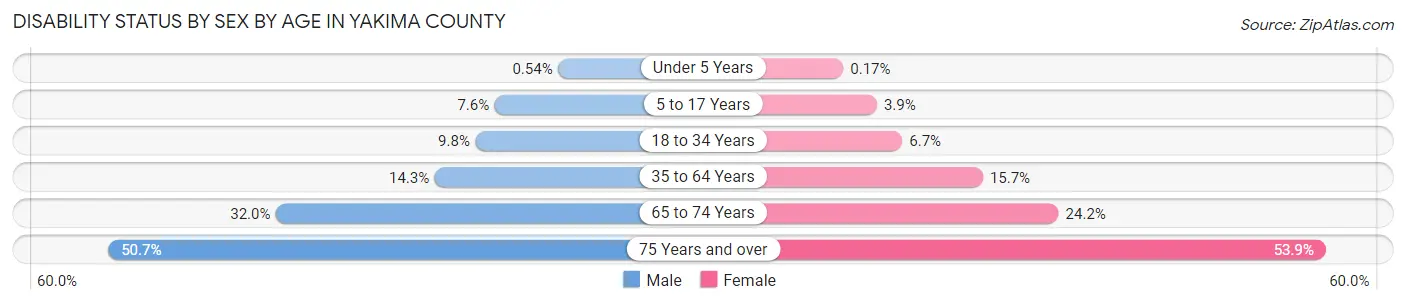
| Age Bracket | Male | Female |
| Under 5 Years | 53 (0.5%) | 16 (0.2%) |
| 5 to 17 Years | 2,166 (7.6%) | 1,069 (3.9%) |
| 18 to 34 Years | 2,914 (9.8%) | 1,969 (6.7%) |
| 35 to 64 Years | 6,111 (14.3%) | 6,600 (15.7%) |
| 65 to 74 Years | 3,247 (32.0%) | 2,628 (24.1%) |
| 75 Years and over | 3,119 (50.7%) | 4,230 (53.9%) |
Disability Class by Sex by Age in Yakima County
Disability Class: Hearing Difficulty
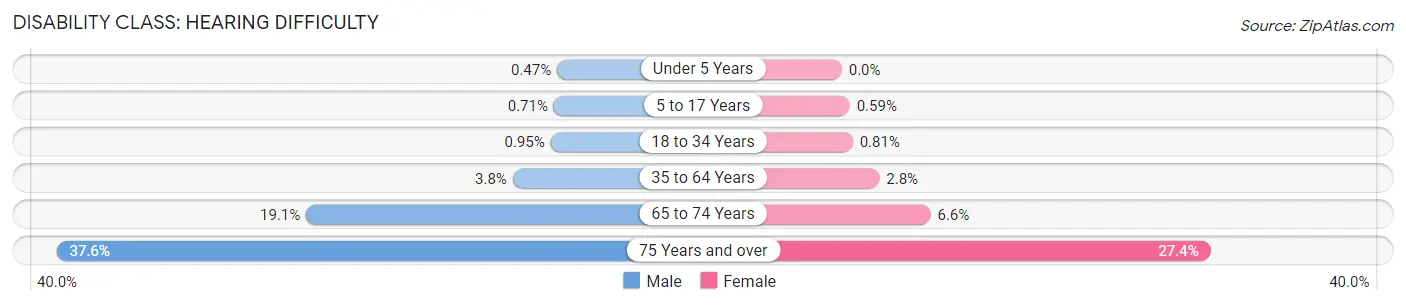
| Age Bracket | Male | Female |
| Under 5 Years | 46 (0.5%) | 0 (0.0%) |
| 5 to 17 Years | 201 (0.7%) | 162 (0.6%) |
| 18 to 34 Years | 285 (0.9%) | 238 (0.8%) |
| 35 to 64 Years | 1,607 (3.8%) | 1,172 (2.8%) |
| 65 to 74 Years | 1,940 (19.1%) | 717 (6.6%) |
| 75 Years and over | 2,315 (37.6%) | 2,148 (27.4%) |
Disability Class: Vision Difficulty
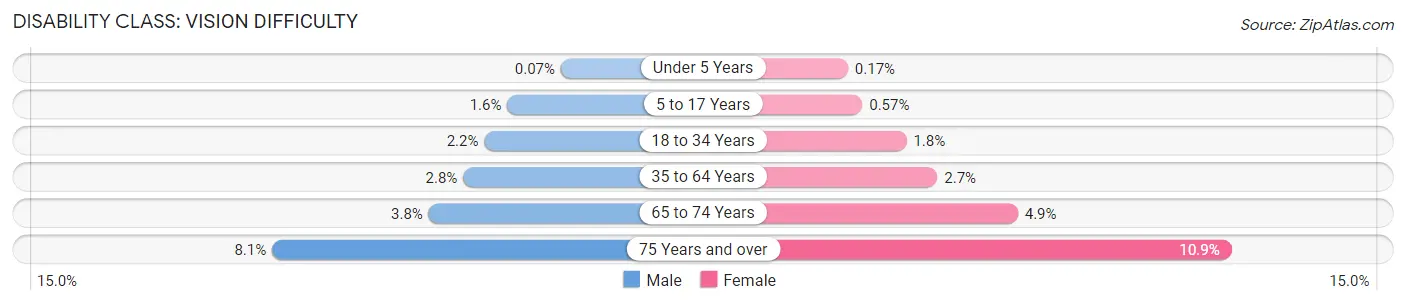
| Age Bracket | Male | Female |
| Under 5 Years | 7 (0.1%) | 16 (0.2%) |
| 5 to 17 Years | 445 (1.6%) | 155 (0.6%) |
| 18 to 34 Years | 656 (2.2%) | 526 (1.8%) |
| 35 to 64 Years | 1,192 (2.8%) | 1,116 (2.7%) |
| 65 to 74 Years | 381 (3.7%) | 533 (4.9%) |
| 75 Years and over | 499 (8.1%) | 852 (10.8%) |
Disability Class: Cognitive Difficulty
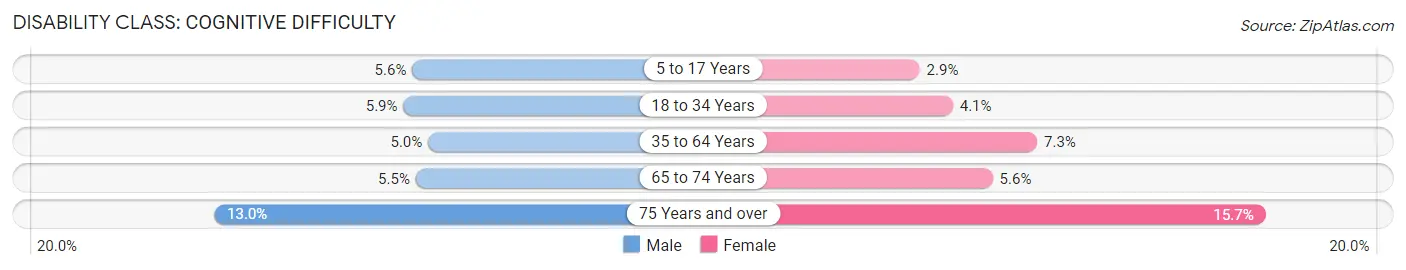
| Age Bracket | Male | Female |
| 5 to 17 Years | 1,597 (5.6%) | 787 (2.9%) |
| 18 to 34 Years | 1,774 (5.9%) | 1,202 (4.1%) |
| 35 to 64 Years | 2,147 (5.0%) | 3,045 (7.2%) |
| 65 to 74 Years | 556 (5.5%) | 609 (5.6%) |
| 75 Years and over | 798 (13.0%) | 1,235 (15.7%) |
Disability Class: Ambulatory Difficulty
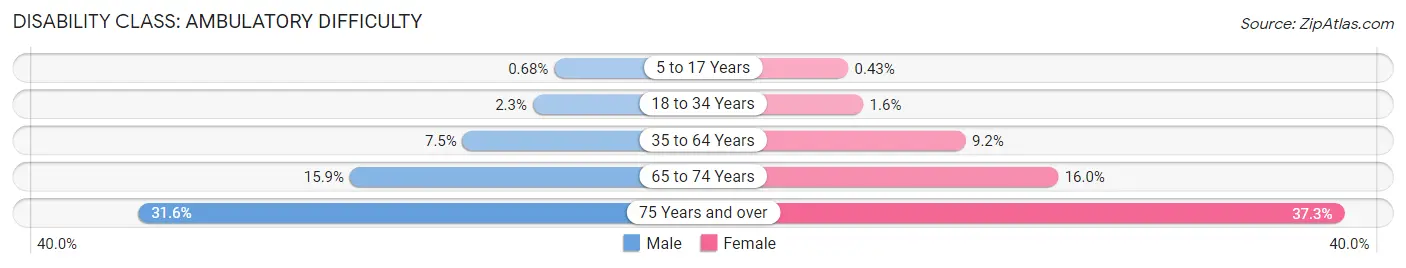
| Age Bracket | Male | Female |
| 5 to 17 Years | 193 (0.7%) | 116 (0.4%) |
| 18 to 34 Years | 677 (2.3%) | 453 (1.5%) |
| 35 to 64 Years | 3,198 (7.5%) | 3,842 (9.1%) |
| 65 to 74 Years | 1,610 (15.9%) | 1,744 (16.0%) |
| 75 Years and over | 1,942 (31.6%) | 2,928 (37.3%) |
Disability Class: Self-Care Difficulty
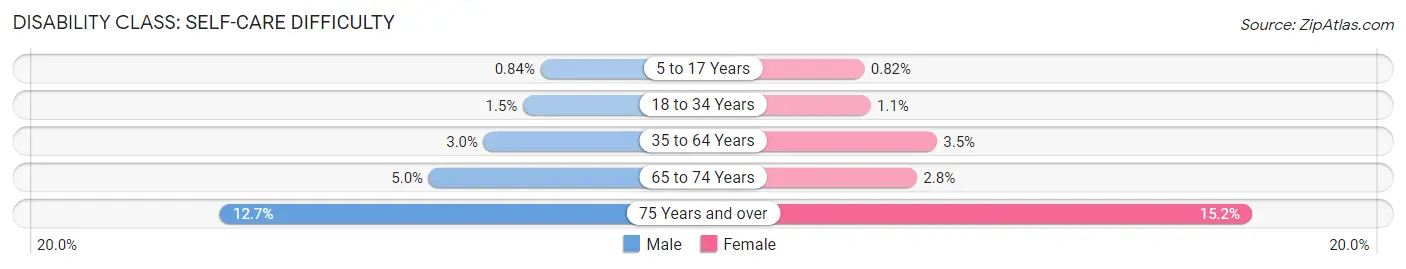
| Age Bracket | Male | Female |
| 5 to 17 Years | 240 (0.8%) | 224 (0.8%) |
| 18 to 34 Years | 444 (1.5%) | 308 (1.1%) |
| 35 to 64 Years | 1,260 (2.9%) | 1,476 (3.5%) |
| 65 to 74 Years | 507 (5.0%) | 301 (2.8%) |
| 75 Years and over | 784 (12.7%) | 1,195 (15.2%) |
Technology Access in Yakima County
Computing Device Access in Yakima County
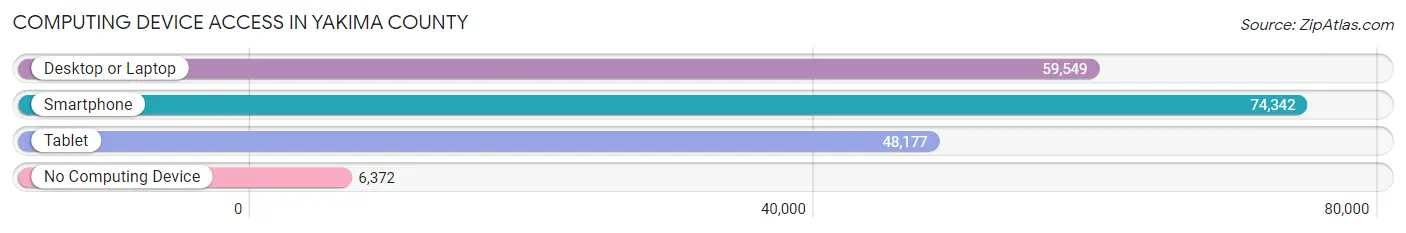
| Device Type | # Households | % Households |
| Desktop or Laptop | 59,549 | 69.6% |
| Smartphone | 74,342 | 86.9% |
| Tablet | 48,177 | 56.3% |
| No Computing Device | 6,372 | 7.4% |
| Total | 85,558 | 100.0% |
Internet Access in Yakima County
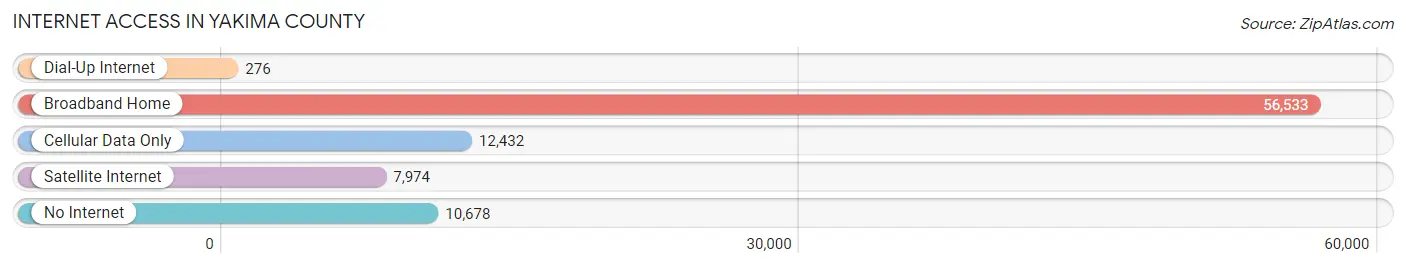
| Internet Type | # Households | % Households |
| Dial-Up Internet | 276 | 0.3% |
| Broadband Home | 56,533 | 66.1% |
| Cellular Data Only | 12,432 | 14.5% |
| Satellite Internet | 7,974 | 9.3% |
| No Internet | 10,678 | 12.5% |
| Total | 85,558 | 100.0% |
Yakima County Summary
Yakima County is located in the south-central region of Washington State, and is the second largest county in the state. It is bordered by the Columbia River to the north, the Cascade Mountains to the west, and the Yakima River to the east. The county seat is Yakima, and the county is home to over 250,000 people.
History
The area that is now Yakima County was originally inhabited by the Yakama Nation, a Native American tribe. The first European settlers arrived in the area in the mid-1800s, and the county was officially established in 1865. The county was named after the Yakama Nation, and the city of Yakima was founded in 1883.
The area quickly became an agricultural hub, and the Yakima Valley was known for its production of apples, hops, and other fruits and vegetables. The area also became a major transportation hub, with the Northern Pacific Railway running through the county.
In the early 1900s, the area experienced a population boom, as people from all over the world moved to the area to work in the agricultural industry. This influx of people led to the development of many small towns and cities throughout the county.
Geography
Yakima County covers an area of 4,312 square miles, making it the second largest county in Washington State. The county is located in the south-central region of the state, and is bordered by the Columbia River to the north, the Cascade Mountains to the west, and the Yakima River to the east.
The county is divided into two distinct regions: the Yakima Valley and the Cascade Mountains. The Yakima Valley is a flat, fertile plain that is home to most of the county’s population and agricultural production. The Cascade Mountains are a rugged, mountainous region that is home to several national forests and parks.
Economy
Yakima County’s economy is largely based on agriculture, with the Yakima Valley being one of the most productive agricultural regions in the state. The county is home to over 1,000 farms, and produces a variety of fruits and vegetables, including apples, hops, cherries, and grapes.
The county is also home to several manufacturing companies, including Boeing, Microsoft, and Amazon. The county is also home to several wineries, breweries, and distilleries, as well as a growing tourism industry.
Demographics
As of the 2010 census, Yakima County had a population of 243,231. The population is made up of a diverse mix of ethnicities, with the largest groups being Hispanic (44.3%), White (37.2%), and Native American (7.2%).
The median household income in the county is $45,845, and the median home value is $179,400. The unemployment rate in the county is 6.2%, which is slightly higher than the national average.
Conclusion
Yakima County is a diverse and vibrant region of Washington State. It is home to a thriving agricultural industry, as well as several manufacturing and tourism businesses. The county is also home to a diverse population, with a mix of ethnicities and backgrounds. Yakima County is an important part of the state’s economy, and its future looks bright.
Common Questions
What is the Total Population of Yakima County?
Total Population of Yakima County is 256,143.
What is the Total Male Population of Yakima County?
Total Male Population of Yakima County is 128,661.
What is the Total Female Population of Yakima County?
Total Female Population of Yakima County is 127,482.
What is the Ratio of Males per 100 Females in Yakima County?
There are 100.92 Males per 100 Females in Yakima County.
What is the Ratio of Females per 100 Males in Yakima County?
There are 99.08 Females per 100 Males in Yakima County.
What is the Median Population Age in Yakima County?
Median Population Age in Yakima County is 33.0 Years.
What is the Average Family Size in Yakima County
Average Family Size in Yakima County is 3.5 People.
What is the Average Household Size in Yakima County
Average Household Size in Yakima County is 3.0 People.
What is Per Capita Income in Yakima County?
Per Capita income in Yakima County is $27,448.
What is the Median Family Income in Yakima County?
Median Family Income in Yakima County is $73,344.
What is the Median Household income in Yakima County?
Median Household Income in Yakima County is $64,910.
What is Income or Wage Gap in Yakima County?
Income or Wage Gap in Yakima County is 25.4%.
Women in Yakima County earn 74.6 cents for every dollar earned by a man.
What is Family Income Deficit in Yakima County?
Family Income Deficit in Yakima County is $10,734.
Families that are below poverty line in Yakima County earn $10,734 less on average than the poverty threshold level.
What is Inequality or Gini Index in Yakima County?
Inequality or Gini Index in Yakima County is 0.42.
How Large is the Labor Force in Yakima County?
There are 117,423 People in the Labor Forcein in Yakima County.
What is the Percentage of People in the Labor Force in Yakima County?
62.1% of People are in the Labor Force in Yakima County.
What is the Unemployment Rate in Yakima County?
Unemployment Rate in Yakima County is 7.2%.