Whitman County, WA
Whitman County Map
Whitman County Overview
47,141
TOTAL POPULATION
23,954
MALE POPULATION
23,187
FEMALE POPULATION
103.31
MALES / 100 FEMALES
96.80
FEMALES / 100 MALES
26.0
MEDIAN AGE
2.9
AVG FAMILY SIZE
2.3
AVG HOUSEHOLD SIZE
$30,287
PER CAPITA INCOME
$87,926
AVG FAMILY INCOME
$49,345
AVG HOUSEHOLD INCOME
43.4%
WAGE / INCOME GAP [ % ]
56.6¢/ $1
WAGE / INCOME GAP [ $ ]
$11,658
FAMILY INCOME DEFICIT
0.53
INEQUALITY / GINI INDEX
24,605
LABOR FORCE [ PEOPLE ]
60.5%
PERCENT IN LABOR FORCE
6.7%
UNEMPLOYMENT RATE
Whitman County Area Codes
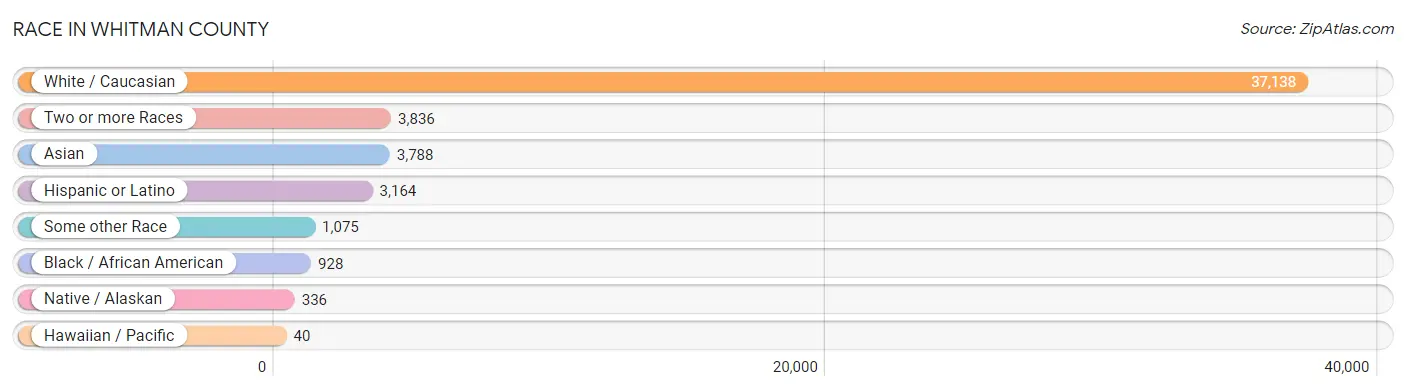
Race in Whitman County
The most populous races in Whitman County are White / Caucasian (37,138 | 78.8%), Two or more Races (3,836 | 8.1%), and Asian (3,788 | 8.0%).
| Race | # Population | % Population |
| Asian | 3,788 | 8.0% |
| Black / African American | 928 | 2.0% |
| Hawaiian / Pacific | 40 | 0.1% |
| Hispanic or Latino | 3,164 | 6.7% |
| Native / Alaskan | 336 | 0.7% |
| White / Caucasian | 37,138 | 78.8% |
| Two or more Races | 3,836 | 8.1% |
| Some other Race | 1,075 | 2.3% |
| Total | 47,141 | 100.0% |
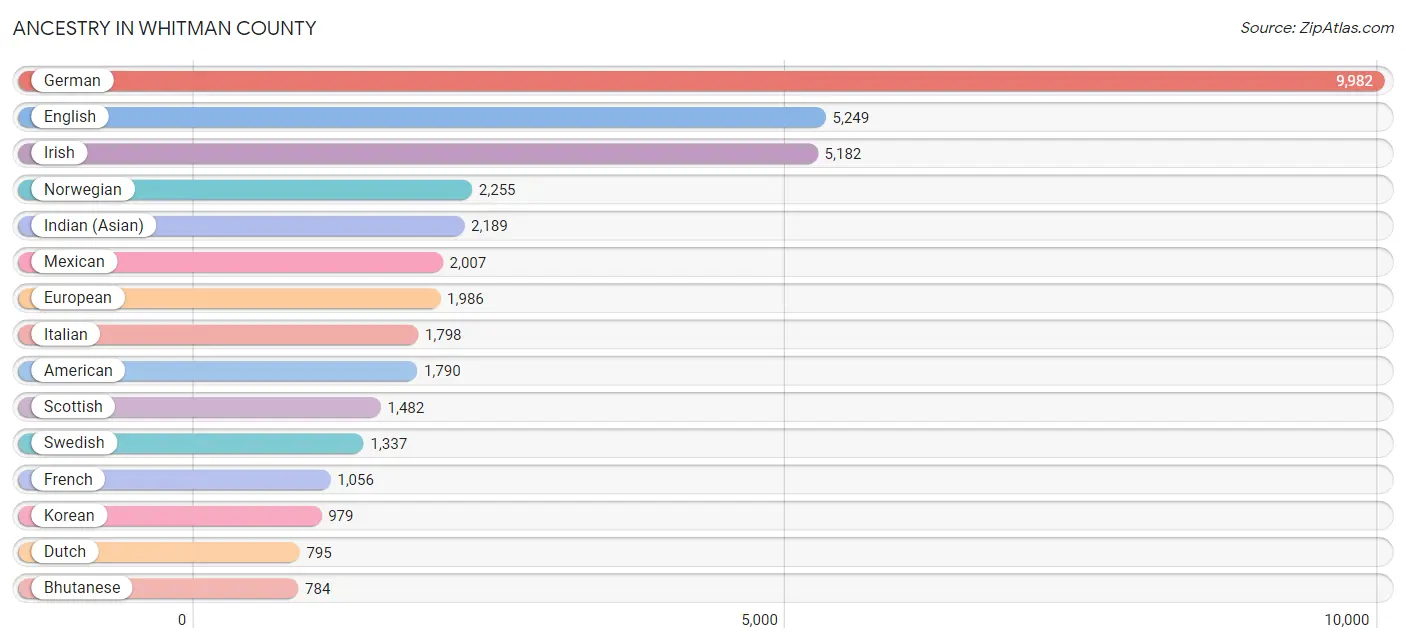
Ancestry in Whitman County
The most populous ancestries reported in Whitman County are German (9,982 | 21.2%), English (5,249 | 11.1%), Irish (5,182 | 11.0%), Norwegian (2,255 | 4.8%), and Indian (Asian) (2,189 | 4.6%), together accounting for 52.7% of all Whitman County residents.
| Ancestry | # Population | % Population |
| African | 131 | 0.3% |
| Albanian | 19 | 0.0% |
| Aleut | 10 | 0.0% |
| Alsatian | 13 | 0.0% |
| American | 1,790 | 3.8% |
| Apache | 105 | 0.2% |
| Arab | 213 | 0.4% |
| Arapaho | 5 | 0.0% |
| Argentinean | 50 | 0.1% |
| Armenian | 156 | 0.3% |
| Australian | 33 | 0.1% |
| Austrian | 113 | 0.2% |
| Bangladeshi | 28 | 0.1% |
| Basque | 96 | 0.2% |
| Belgian | 42 | 0.1% |
| Bhutanese | 784 | 1.7% |
| Blackfeet | 63 | 0.1% |
| Bolivian | 46 | 0.1% |
| Brazilian | 97 | 0.2% |
| British | 606 | 1.3% |
| Bulgarian | 10 | 0.0% |
| Burmese | 475 | 1.0% |
| Cajun | 9 | 0.0% |
| Canadian | 123 | 0.3% |
| Celtic | 13 | 0.0% |
| Central American | 205 | 0.4% |
| Central American Indian | 2 | 0.0% |
| Cherokee | 134 | 0.3% |
| Chilean | 85 | 0.2% |
| Chippewa | 50 | 0.1% |
| Choctaw | 24 | 0.1% |
| Colombian | 16 | 0.0% |
| Colville | 32 | 0.1% |
| Cree | 25 | 0.1% |
| Croatian | 41 | 0.1% |
| Cuban | 22 | 0.1% |
| Cypriot | 24 | 0.1% |
| Czech | 272 | 0.6% |
| Czechoslovakian | 20 | 0.0% |
| Danish | 365 | 0.8% |
| Delaware | 1 | 0.0% |
| Dominican | 11 | 0.0% |
| Dutch | 795 | 1.7% |
| Eastern European | 103 | 0.2% |
| Ecuadorian | 94 | 0.2% |
| Egyptian | 15 | 0.0% |
| English | 5,249 | 11.1% |
| Ethiopian | 11 | 0.0% |
| European | 1,986 | 4.2% |
| Filipino | 56 | 0.1% |
| Finnish | 127 | 0.3% |
| French | 1,056 | 2.2% |
| French American Indian | 18 | 0.0% |
| French Canadian | 404 | 0.9% |
| German | 9,982 | 21.2% |
| German Russian | 6 | 0.0% |
| Greek | 179 | 0.4% |
| Guamanian / Chamorro | 16 | 0.0% |
| Guatemalan | 123 | 0.3% |
| Guyanese | 13 | 0.0% |
| Haitian | 27 | 0.1% |
| Honduran | 52 | 0.1% |
| Hopi | 12 | 0.0% |
| Hungarian | 178 | 0.4% |
| Icelander | 14 | 0.0% |
| Indian (Asian) | 2,189 | 4.6% |
| Inupiat | 21 | 0.0% |
| Iranian | 161 | 0.3% |
| Irish | 5,182 | 11.0% |
| Iroquois | 6 | 0.0% |
| Italian | 1,798 | 3.8% |
| Japanese | 64 | 0.1% |
| Kenyan | 97 | 0.2% |
| Korean | 979 | 2.1% |
| Laotian | 67 | 0.1% |
| Latvian | 40 | 0.1% |
| Lebanese | 49 | 0.1% |
| Lithuanian | 60 | 0.1% |
| Macedonian | 2 | 0.0% |
| Mexican | 2,007 | 4.3% |
| Mexican American Indian | 30 | 0.1% |
| Native Hawaiian | 346 | 0.7% |
| Nicaraguan | 9 | 0.0% |
| Nigerian | 50 | 0.1% |
| Northern European | 380 | 0.8% |
| Norwegian | 2,255 | 4.8% |
| Pakistani | 141 | 0.3% |
| Palestinian | 23 | 0.1% |
| Panamanian | 14 | 0.0% |
| Pennsylvania German | 20 | 0.0% |
| Peruvian | 44 | 0.1% |
| Polish | 630 | 1.3% |
| Portuguese | 139 | 0.3% |
| Potawatomi | 42 | 0.1% |
| Pueblo | 56 | 0.1% |
| Puerto Rican | 167 | 0.4% |
| Puget Sound Salish | 22 | 0.1% |
| Romanian | 38 | 0.1% |
| Russian | 422 | 0.9% |
| Salvadoran | 2 | 0.0% |
| Samoan | 3 | 0.0% |
| Scandinavian | 307 | 0.6% |
| Scotch-Irish | 311 | 0.7% |
| Scottish | 1,482 | 3.1% |
| Senegalese | 5 | 0.0% |
| Serbian | 14 | 0.0% |
| Sioux | 77 | 0.2% |
| Slovak | 119 | 0.3% |
| Slovene | 8 | 0.0% |
| Somali | 27 | 0.1% |
| South African | 20 | 0.0% |
| South American | 336 | 0.7% |
| Spaniard | 266 | 0.6% |
| Spanish | 53 | 0.1% |
| Sri Lankan | 337 | 0.7% |
| Subsaharan African | 364 | 0.8% |
| Swedish | 1,337 | 2.8% |
| Swiss | 260 | 0.5% |
| Thai | 779 | 1.7% |
| Tlingit-Haida | 34 | 0.1% |
| Tohono O'Odham | 6 | 0.0% |
| Tsimshian | 12 | 0.0% |
| Turkish | 22 | 0.1% |
| Ukrainian | 170 | 0.4% |
| Vietnamese | 51 | 0.1% |
| Welsh | 417 | 0.9% |
| West Indian | 9 | 0.0% |
| Yugoslavian | 31 | 0.1% | View All 128 Rows |
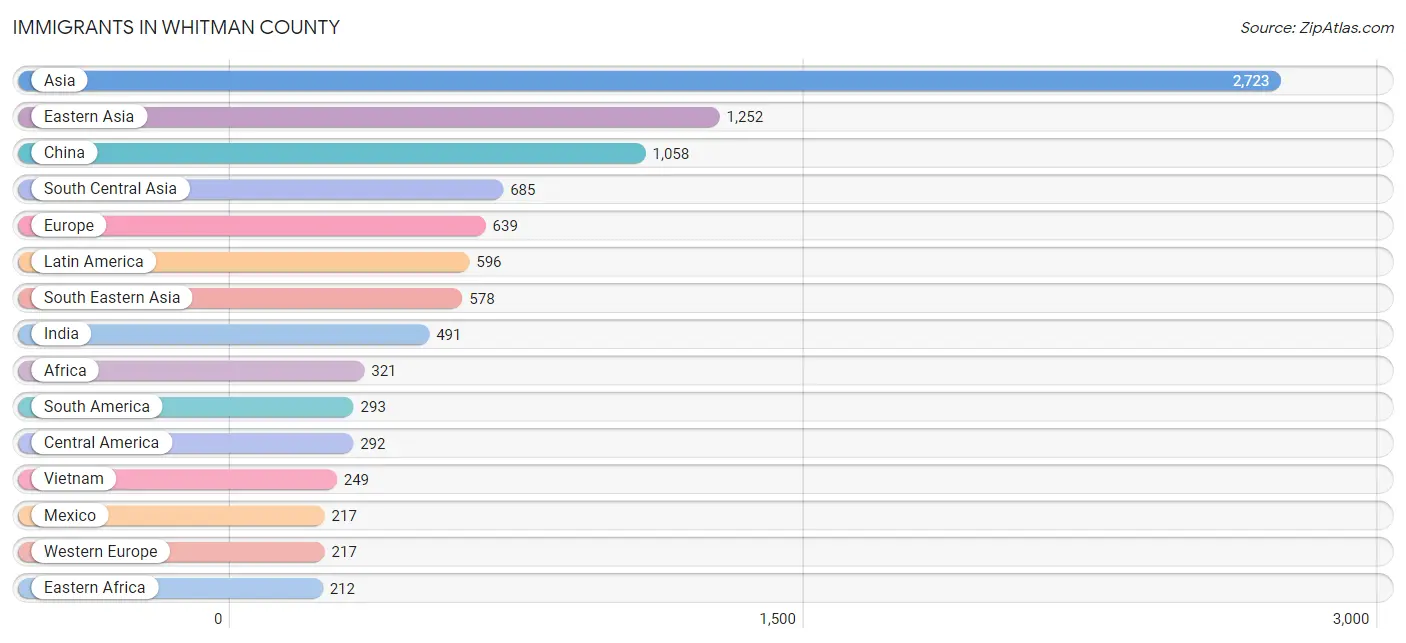
Immigrants in Whitman County
The most numerous immigrant groups reported in Whitman County came from Asia (2,723 | 5.8%), Eastern Asia (1,252 | 2.7%), China (1,058 | 2.2%), South Central Asia (685 | 1.5%), and Europe (639 | 1.4%), together accounting for 13.5% of all Whitman County residents.
| Immigration Origin | # Population | % Population |
| Africa | 321 | 0.7% |
| Argentina | 7 | 0.0% |
| Asia | 2,723 | 5.8% |
| Austria | 9 | 0.0% |
| Bangladesh | 51 | 0.1% |
| Belarus | 21 | 0.0% |
| Brazil | 104 | 0.2% |
| Cambodia | 3 | 0.0% |
| Canada | 168 | 0.4% |
| Caribbean | 11 | 0.0% |
| Central America | 292 | 0.6% |
| China | 1,058 | 2.2% |
| Colombia | 31 | 0.1% |
| Dominican Republic | 11 | 0.0% |
| Eastern Africa | 212 | 0.4% |
| Eastern Asia | 1,252 | 2.7% |
| Eastern Europe | 129 | 0.3% |
| Egypt | 15 | 0.0% |
| England | 13 | 0.0% |
| Ethiopia | 11 | 0.0% |
| Europe | 639 | 1.4% |
| Fiji | 18 | 0.0% |
| France | 60 | 0.1% |
| Germany | 148 | 0.3% |
| Guatemala | 9 | 0.0% |
| Honduras | 52 | 0.1% |
| Hong Kong | 7 | 0.0% |
| India | 491 | 1.0% |
| Indonesia | 51 | 0.1% |
| Iran | 102 | 0.2% |
| Ireland | 3 | 0.0% |
| Israel | 30 | 0.1% |
| Japan | 64 | 0.1% |
| Kazakhstan | 8 | 0.0% |
| Kenya | 136 | 0.3% |
| Korea | 130 | 0.3% |
| Latin America | 596 | 1.3% |
| Latvia | 1 | 0.0% |
| Liberia | 2 | 0.0% |
| Mexico | 217 | 0.5% |
| Nepal | 17 | 0.0% |
| Nigeria | 12 | 0.0% |
| Northern Africa | 15 | 0.0% |
| Northern Europe | 190 | 0.4% |
| Oceania | 18 | 0.0% |
| Panama | 14 | 0.0% |
| Peru | 44 | 0.1% |
| Philippines | 147 | 0.3% |
| Portugal | 13 | 0.0% |
| Romania | 7 | 0.0% |
| Russia | 100 | 0.2% |
| Saudi Arabia | 125 | 0.3% |
| Scotland | 17 | 0.0% |
| Singapore | 9 | 0.0% |
| South America | 293 | 0.6% |
| South Central Asia | 685 | 1.5% |
| South Eastern Asia | 578 | 1.2% |
| Southern Europe | 103 | 0.2% |
| Spain | 90 | 0.2% |
| Sweden | 12 | 0.0% |
| Taiwan | 112 | 0.2% |
| Thailand | 108 | 0.2% |
| Turkey | 22 | 0.1% |
| Uganda | 65 | 0.1% |
| Uruguay | 46 | 0.1% |
| Venezuela | 61 | 0.1% |
| Vietnam | 249 | 0.5% |
| Western Africa | 94 | 0.2% |
| Western Asia | 208 | 0.4% |
| Western Europe | 217 | 0.5% | View All 70 Rows |
Sex and Age in Whitman County
Sex and Age in Whitman County
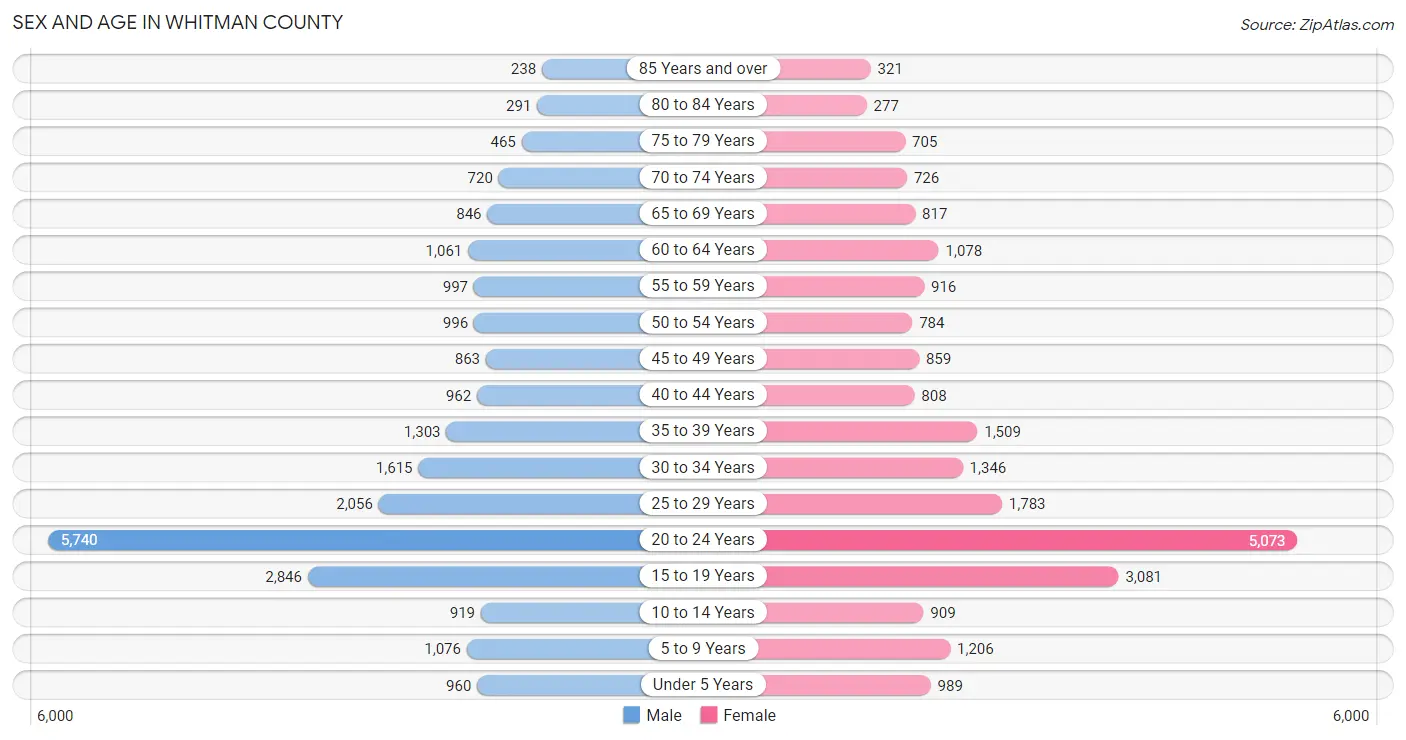
The most populous age groups in Whitman County are 20 to 24 Years (5,740 | 24.0%) for men and 20 to 24 Years (5,073 | 21.9%) for women.
| Age Bracket | Male | Female |
| Under 5 Years | 960 (4.0%) | 989 (4.3%) |
| 5 to 9 Years | 1,076 (4.5%) | 1,206 (5.2%) |
| 10 to 14 Years | 919 (3.8%) | 909 (3.9%) |
| 15 to 19 Years | 2,846 (11.9%) | 3,081 (13.3%) |
| 20 to 24 Years | 5,740 (24.0%) | 5,073 (21.9%) |
| 25 to 29 Years | 2,056 (8.6%) | 1,783 (7.7%) |
| 30 to 34 Years | 1,615 (6.7%) | 1,346 (5.8%) |
| 35 to 39 Years | 1,303 (5.4%) | 1,509 (6.5%) |
| 40 to 44 Years | 962 (4.0%) | 808 (3.5%) |
| 45 to 49 Years | 863 (3.6%) | 859 (3.7%) |
| 50 to 54 Years | 996 (4.2%) | 784 (3.4%) |
| 55 to 59 Years | 997 (4.2%) | 916 (4.0%) |
| 60 to 64 Years | 1,061 (4.4%) | 1,078 (4.6%) |
| 65 to 69 Years | 846 (3.5%) | 817 (3.5%) |
| 70 to 74 Years | 720 (3.0%) | 726 (3.1%) |
| 75 to 79 Years | 465 (1.9%) | 705 (3.0%) |
| 80 to 84 Years | 291 (1.2%) | 277 (1.2%) |
| 85 Years and over | 238 (1.0%) | 321 (1.4%) |
| Total | 23,954 (100.0%) | 23,187 (100.0%) |
Families and Households in Whitman County
Median Family Size in Whitman County
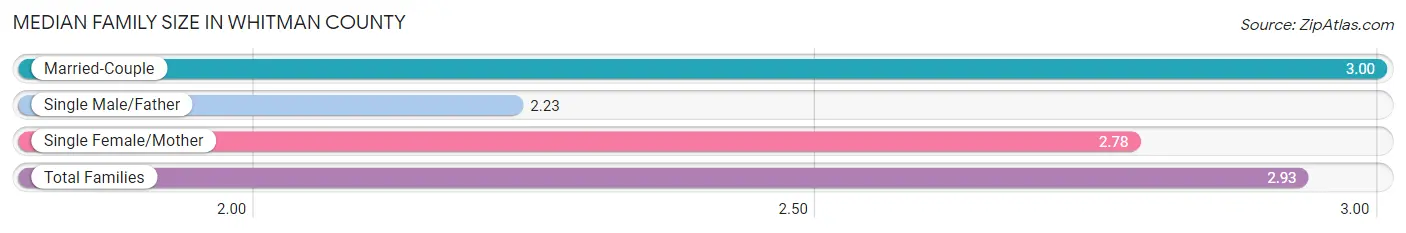
The median family size in Whitman County is 2.93 persons per family, with married-couple families (7,021 | 81.5%) accounting for the largest median family size of 3 persons per family. On the other hand, single male/father families (497 | 5.8%) represent the smallest median family size with 2.23 persons per family.
| Family Type | # Families | Family Size |
| Married-Couple | 7,021 (81.5%) | 3.00 |
| Single Male/Father | 497 (5.8%) | 2.23 |
| Single Female/Mother | 1,101 (12.8%) | 2.78 |
| Total Families | 8,619 (100.0%) | 2.93 |
Median Household Size in Whitman County
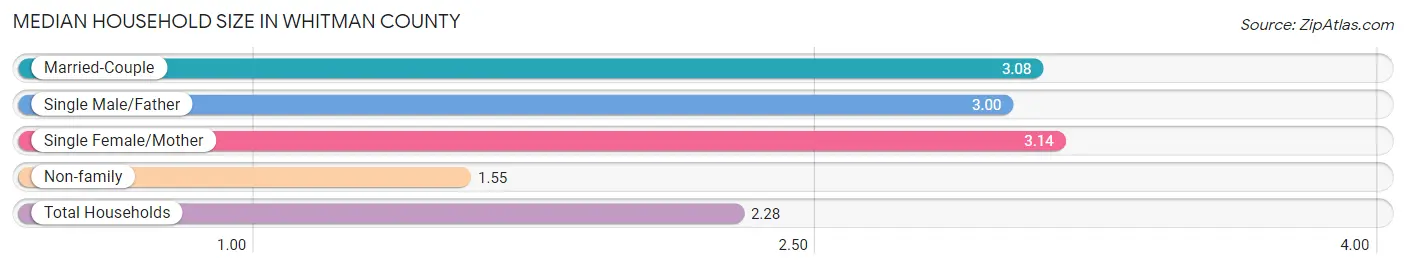
The median household size in Whitman County is 2.28 persons per household, with single female/mother households (1,101 | 6.1%) accounting for the largest median household size of 3.14 persons per household. non-family households (9,344 | 52.0%) represent the smallest median household size with 1.55 persons per household.
| Household Type | # Households | Household Size |
| Married-Couple | 7,021 (39.1%) | 3.08 |
| Single Male/Father | 497 (2.8%) | 3.00 |
| Single Female/Mother | 1,101 (6.1%) | 3.14 |
| Non-family | 9,344 (52.0%) | 1.55 |
| Total Households | 17,963 (100.0%) | 2.28 |
Household Size by Marriage Status in Whitman County
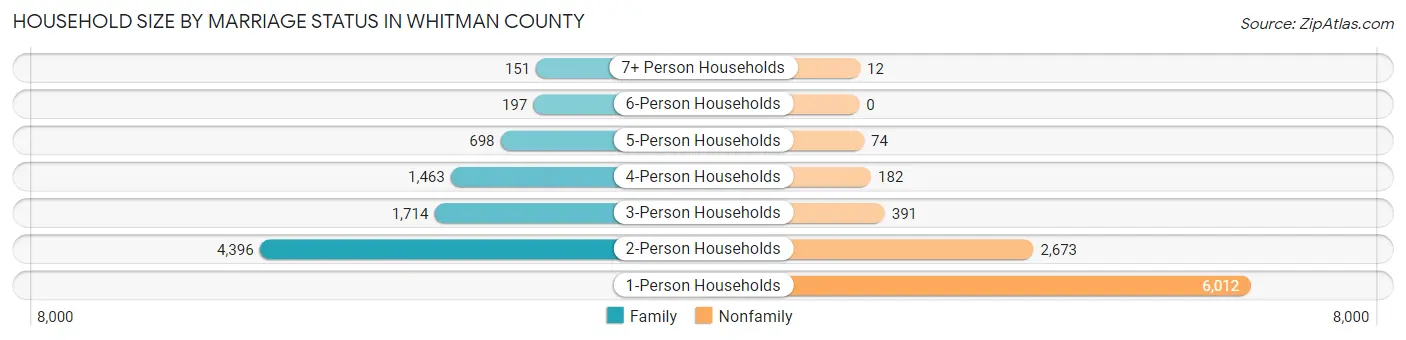
Out of a total of 17,963 households in Whitman County, 8,619 (48.0%) are family households, while 9,344 (52.0%) are nonfamily households. The most numerous type of family households are 2-person households, comprising 4,396, and the most common type of nonfamily households are 1-person households, comprising 6,012.
| Household Size | Family Households | Nonfamily Households |
| 1-Person Households | - | 6,012 (33.5%) |
| 2-Person Households | 4,396 (24.5%) | 2,673 (14.9%) |
| 3-Person Households | 1,714 (9.5%) | 391 (2.2%) |
| 4-Person Households | 1,463 (8.1%) | 182 (1.0%) |
| 5-Person Households | 698 (3.9%) | 74 (0.4%) |
| 6-Person Households | 197 (1.1%) | 0 (0.0%) |
| 7+ Person Households | 151 (0.8%) | 12 (0.1%) |
| Total | 8,619 (48.0%) | 9,344 (52.0%) |
Female Fertility in Whitman County
Fertility by Age in Whitman County
Average fertility rate in Whitman County is 26.0 births per 1,000 women. Women in the age bracket of 35 to 50 years have the highest fertility rate with 36.0 births per 1,000 women. Women in the age bracket of 20 to 34 years acount for 68.5% of all women with births.
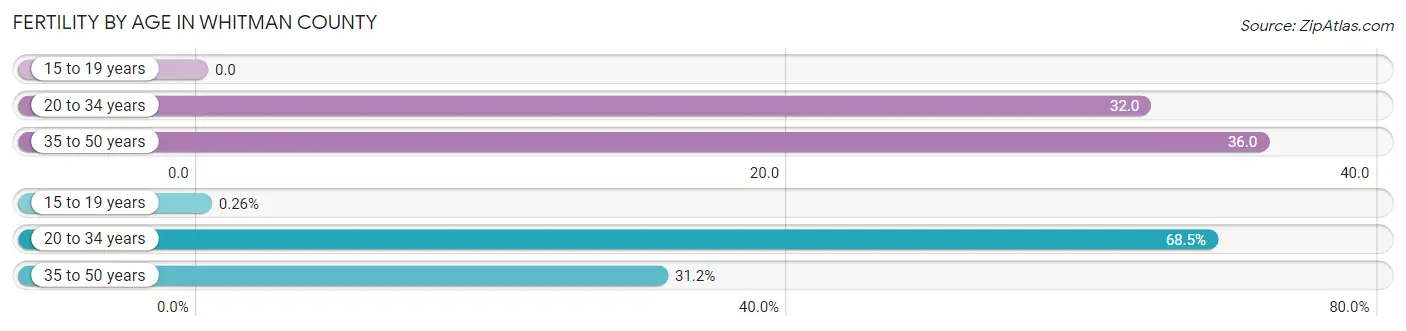
| Age Bracket | Women with Births | Births / 1,000 Women |
| 15 to 19 years | 1 (0.3%) | 0.0 |
| 20 to 34 years | 259 (68.5%) | 32.0 |
| 35 to 50 years | 118 (31.2%) | 36.0 |
| Total | 378 (100.0%) | 26.0 |
Fertility by Age by Marriage Status in Whitman County
89.2% of women with births (378) in Whitman County are married. The highest percentage of unmarried women with births falls into 35 to 50 years age bracket with 17.8% of them unmarried at the time of birth, while the lowest percentage of unmarried women with births belong to 15 to 19 years age bracket with 0.0% of them unmarried.
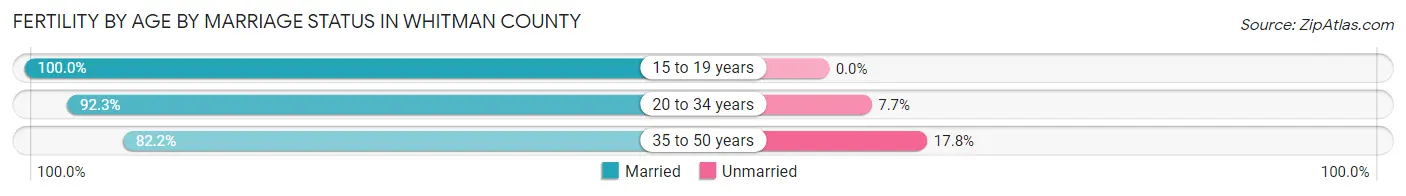
| Age Bracket | Married | Unmarried |
| 15 to 19 years | 1 (100.0%) | 0 (0.0%) |
| 20 to 34 years | 239 (92.3%) | 20 (7.7%) |
| 35 to 50 years | 97 (82.2%) | 21 (17.8%) |
| Total | 337 (89.1%) | 41 (10.8%) |
Fertility by Education in Whitman County
Average fertility rate in Whitman County is 26.0 births per 1,000 women. Women with the education attainment of graduate degree have the highest fertility rate of 65.0 births per 1,000 women, while women with the education attainment of college or associate's degree have the lowest fertility at 13.0 births per 1,000 women. Women with the education attainment of bachelor's degree represent 31.5% of all women with births.
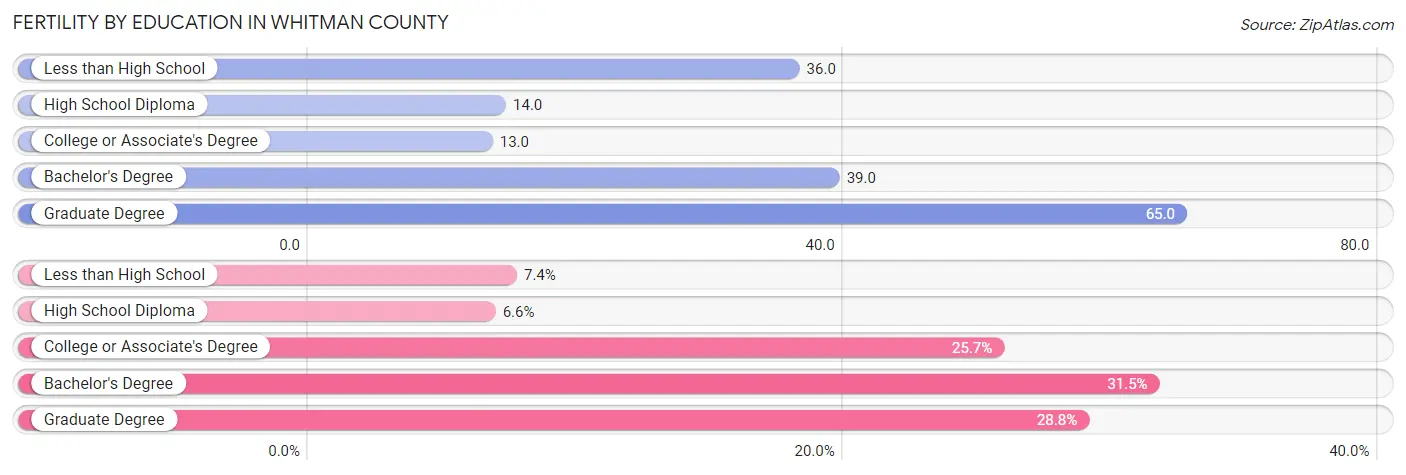
| Educational Attainment | Women with Births | Births / 1,000 Women |
| Less than High School | 28 (7.4%) | 36.0 |
| High School Diploma | 25 (6.6%) | 14.0 |
| College or Associate's Degree | 97 (25.7%) | 13.0 |
| Bachelor's Degree | 119 (31.5%) | 39.0 |
| Graduate Degree | 109 (28.8%) | 65.0 |
| Total | 378 (100.0%) | 26.0 |
Fertility by Education by Marriage Status in Whitman County
10.8% of women with births in Whitman County are unmarried. Women with the educational attainment of bachelor's degree are most likely to be married with 100.0% of them married at childbirth, while women with the educational attainment of less than high school are least likely to be married with 75.0% of them unmarried at childbirth.
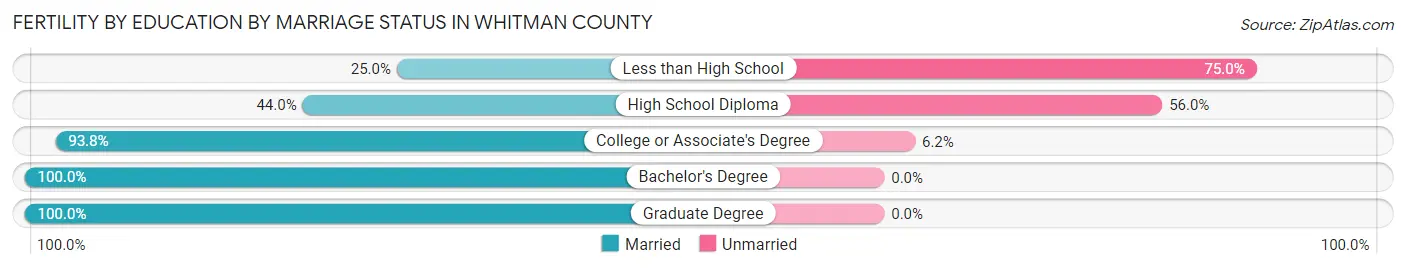
| Educational Attainment | Married | Unmarried |
| Less than High School | 7 (25.0%) | 21 (75.0%) |
| High School Diploma | 11 (44.0%) | 14 (56.0%) |
| College or Associate's Degree | 91 (93.8%) | 6 (6.2%) |
| Bachelor's Degree | 119 (100.0%) | 0 (0.0%) |
| Graduate Degree | 109 (100.0%) | 0 (0.0%) |
| Total | 337 (89.1%) | 41 (10.8%) |
Income in Whitman County
Income Overview in Whitman County
Per Capita Income in Whitman County is $30,287, while median incomes of families and households are $87,926 and $49,345 respectively.
| Characteristic | Number | Measure |
| Per Capita Income | 47,141 | $30,287 |
| Median Family Income | 8,619 | $87,926 |
| Mean Family Income | 8,619 | $109,405 |
| Median Household Income | 17,963 | $49,345 |
| Mean Household Income | 17,963 | $75,687 |
| Income Deficit | 8,619 | $11,658 |
| Wage / Income Gap (%) | 47,141 | 43.36% |
| Wage / Income Gap ($) | 47,141 | 56.64¢ per $1 |
| Gini / Inequality Index | 47,141 | 0.53 |
Earnings by Sex in Whitman County
Average Earnings in Whitman County are $23,259, $29,299 for men and $16,596 for women, a difference of 43.4%.
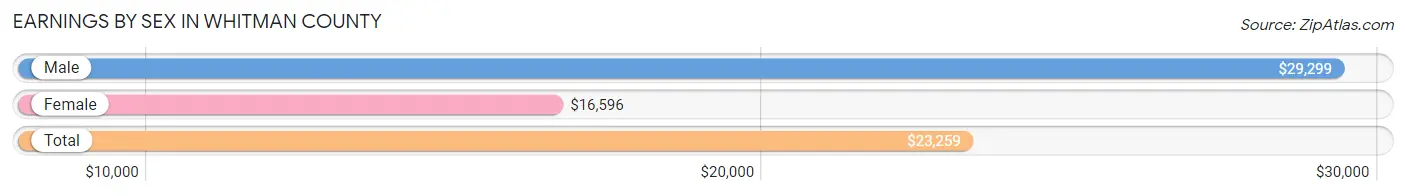
| Sex | Number | Average Earnings |
| Male | 15,406 (53.1%) | $29,299 |
| Female | 13,604 (46.9%) | $16,596 |
| Total | 29,010 (100.0%) | $23,259 |
Earnings by Sex by Income Bracket in Whitman County
The most common earnings brackets in Whitman County are $100,000+ for men (1,885 | 12.2%) and $2,500 to $4,999 for women (1,678 | 12.3%).
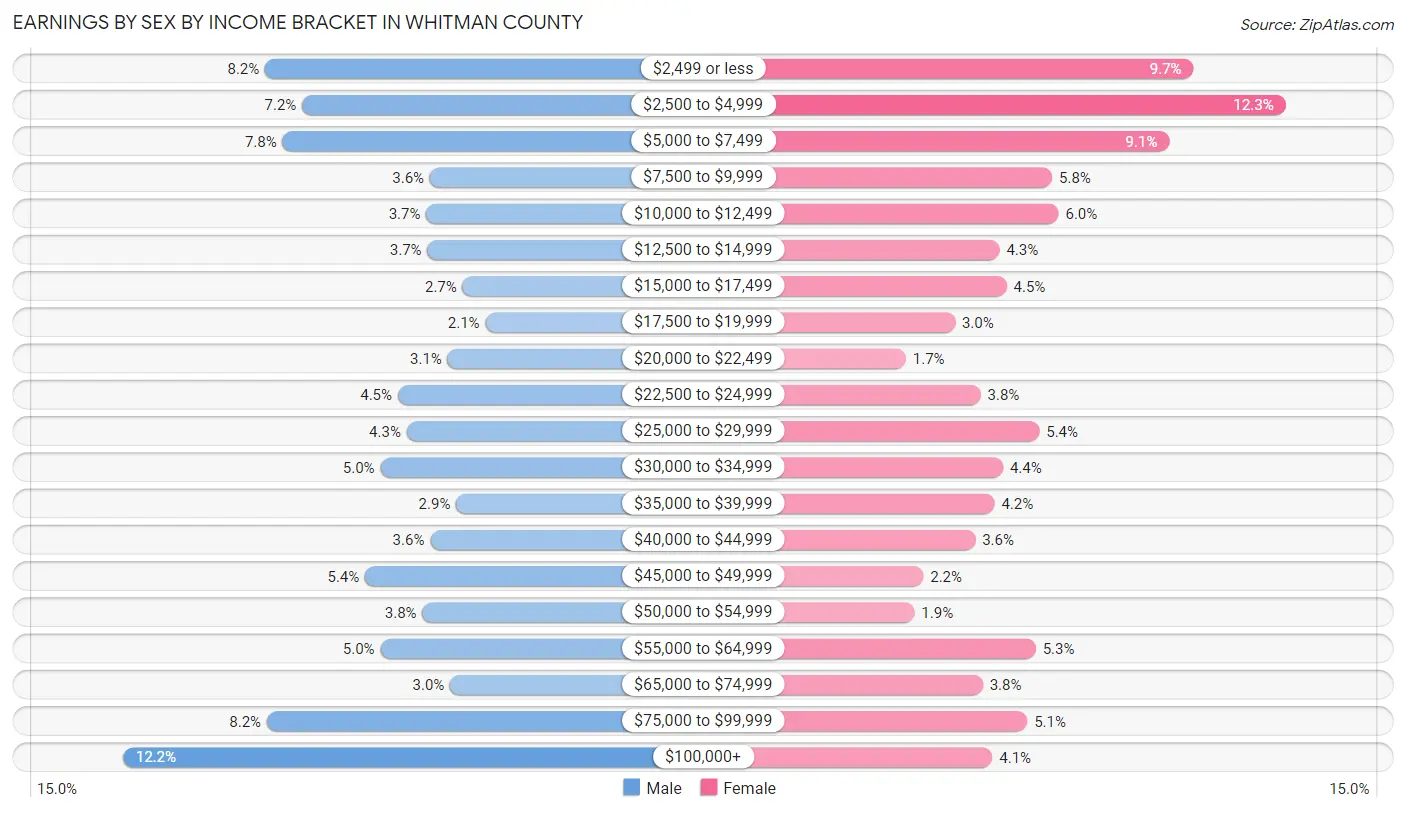
| Income | Male | Female |
| $2,499 or less | 1,269 (8.2%) | 1,325 (9.7%) |
| $2,500 to $4,999 | 1,110 (7.2%) | 1,678 (12.3%) |
| $5,000 to $7,499 | 1,194 (7.7%) | 1,232 (9.1%) |
| $7,500 to $9,999 | 556 (3.6%) | 785 (5.8%) |
| $10,000 to $12,499 | 571 (3.7%) | 809 (5.9%) |
| $12,500 to $14,999 | 567 (3.7%) | 583 (4.3%) |
| $15,000 to $17,499 | 414 (2.7%) | 611 (4.5%) |
| $17,500 to $19,999 | 316 (2.1%) | 414 (3.0%) |
| $20,000 to $22,499 | 479 (3.1%) | 226 (1.7%) |
| $22,500 to $24,999 | 695 (4.5%) | 511 (3.8%) |
| $25,000 to $29,999 | 657 (4.3%) | 736 (5.4%) |
| $30,000 to $34,999 | 771 (5.0%) | 597 (4.4%) |
| $35,000 to $39,999 | 442 (2.9%) | 565 (4.2%) |
| $40,000 to $44,999 | 555 (3.6%) | 491 (3.6%) |
| $45,000 to $49,999 | 836 (5.4%) | 293 (2.1%) |
| $50,000 to $54,999 | 588 (3.8%) | 259 (1.9%) |
| $55,000 to $64,999 | 771 (5.0%) | 723 (5.3%) |
| $65,000 to $74,999 | 468 (3.0%) | 519 (3.8%) |
| $75,000 to $99,999 | 1,262 (8.2%) | 690 (5.1%) |
| $100,000+ | 1,885 (12.2%) | 557 (4.1%) |
| Total | 15,406 (100.0%) | 13,604 (100.0%) |
Earnings by Sex by Educational Attainment in Whitman County
Average earnings in Whitman County are $51,111 for men and $35,758 for women, a difference of 30.0%. Men with an educational attainment of graduate degree enjoy the highest average annual earnings of $77,294, while those with less than high school education earn the least with $36,500. Women with an educational attainment of graduate degree earn the most with the average annual earnings of $51,797, while those with college or associate's degree education have the smallest earnings of $29,696.
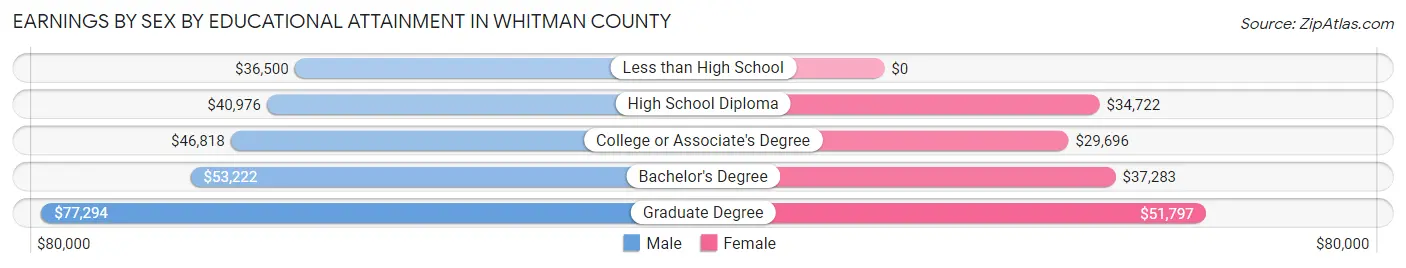
| Educational Attainment | Male Income | Female Income |
| Less than High School | $36,500 | $0 |
| High School Diploma | $40,976 | $34,722 |
| College or Associate's Degree | $46,818 | $29,696 |
| Bachelor's Degree | $53,222 | $37,283 |
| Graduate Degree | $77,294 | $51,797 |
| Total | $51,111 | $35,758 |
Family Income in Whitman County
Family Income Brackets in Whitman County
According to the Whitman County family income data, there are 1,638 families falling into the $75,000 to $99,999 income range, which is the most common income bracket and makes up 19.0% of all families. Conversely, the $10,000 to $14,999 income bracket is the least frequent group with only 95 families (1.1%) belonging to this category.
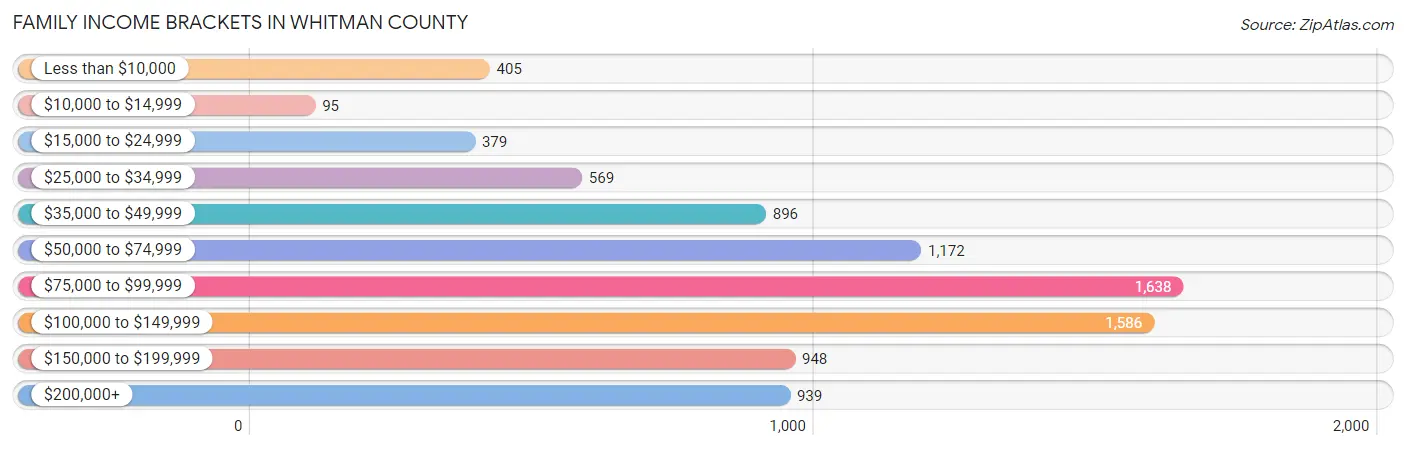
| Income Bracket | # Families | % Families |
| Less than $10,000 | 405 | 4.7% |
| $10,000 to $14,999 | 95 | 1.1% |
| $15,000 to $24,999 | 379 | 4.4% |
| $25,000 to $34,999 | 569 | 6.6% |
| $35,000 to $49,999 | 896 | 10.4% |
| $50,000 to $74,999 | 1,172 | 13.6% |
| $75,000 to $99,999 | 1,638 | 19.0% |
| $100,000 to $149,999 | 1,586 | 18.4% |
| $150,000 to $199,999 | 948 | 11.0% |
| $200,000+ | 939 | 10.9% |
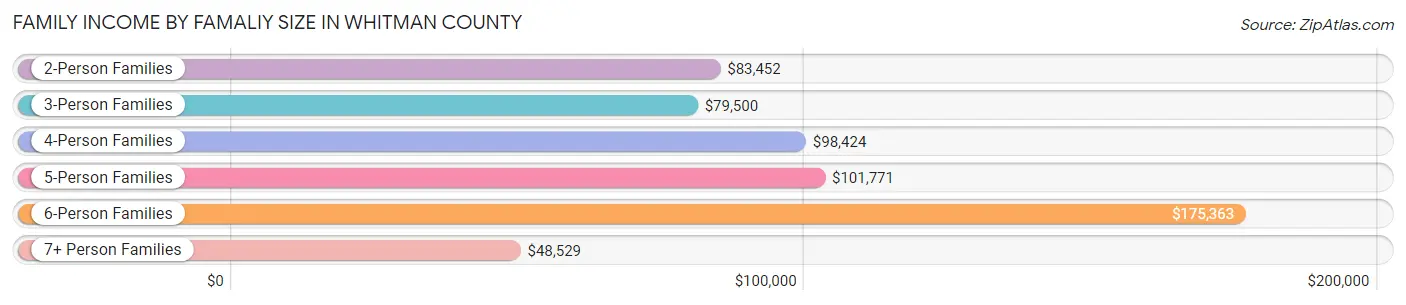
Family Income by Famaliy Size in Whitman County
6-person families (162 | 1.9%) account for the highest median family income in Whitman County with $175,363 per family, while 2-person families (4,880 | 56.6%) have the highest median income of $41,726 per family member.
| Income Bracket | # Families | Median Income |
| 2-Person Families | 4,880 (56.6%) | $83,452 |
| 3-Person Families | 1,460 (16.9%) | $79,500 |
| 4-Person Families | 1,354 (15.7%) | $98,424 |
| 5-Person Families | 617 (7.2%) | $101,771 |
| 6-Person Families | 162 (1.9%) | $175,363 |
| 7+ Person Families | 146 (1.7%) | $48,529 |
| Total | 8,619 (100.0%) | $87,926 |
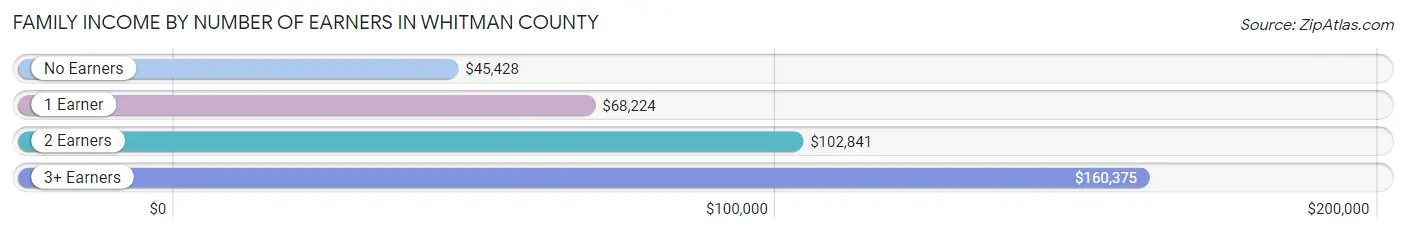
Family Income by Number of Earners in Whitman County
The median family income in Whitman County is $87,926, with families comprising 3+ earners (658) having the highest median family income of $160,375, while families with no earners (1,177) have the lowest median family income of $45,428, accounting for 7.6% and 13.7% of families, respectively.
| Number of Earners | # Families | Median Income |
| No Earners | 1,177 (13.7%) | $45,428 |
| 1 Earner | 2,731 (31.7%) | $68,224 |
| 2 Earners | 4,053 (47.0%) | $102,841 |
| 3+ Earners | 658 (7.6%) | $160,375 |
| Total | 8,619 (100.0%) | $87,926 |
Household Income in Whitman County
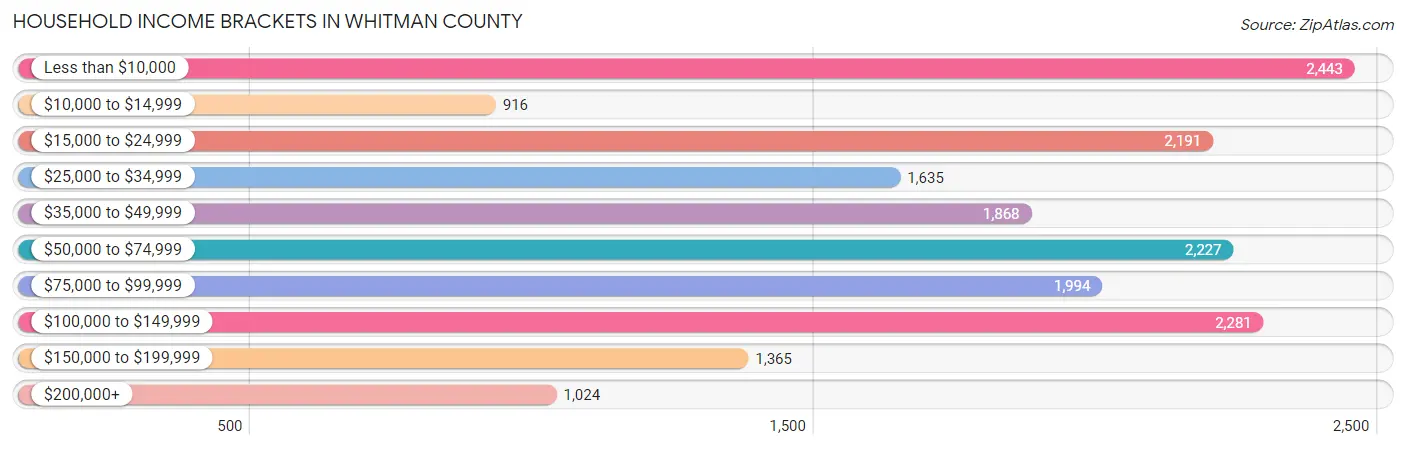
Household Income Brackets in Whitman County
With 2,443 households falling in the category, the less than $10,000 income range is the most frequent in Whitman County, accounting for 13.6% of all households. In contrast, only 916 households (5.1%) fall into the $10,000 to $14,999 income bracket, making it the least populous group.
| Income Bracket | # Households | % Households |
| Less than $10,000 | 2,443 | 13.6% |
| $10,000 to $14,999 | 916 | 5.1% |
| $15,000 to $24,999 | 2,191 | 12.2% |
| $25,000 to $34,999 | 1,635 | 9.1% |
| $35,000 to $49,999 | 1,868 | 10.4% |
| $50,000 to $74,999 | 2,227 | 12.4% |
| $75,000 to $99,999 | 1,994 | 11.1% |
| $100,000 to $149,999 | 2,281 | 12.7% |
| $150,000 to $199,999 | 1,365 | 7.6% |
| $200,000+ | 1,024 | 5.7% |
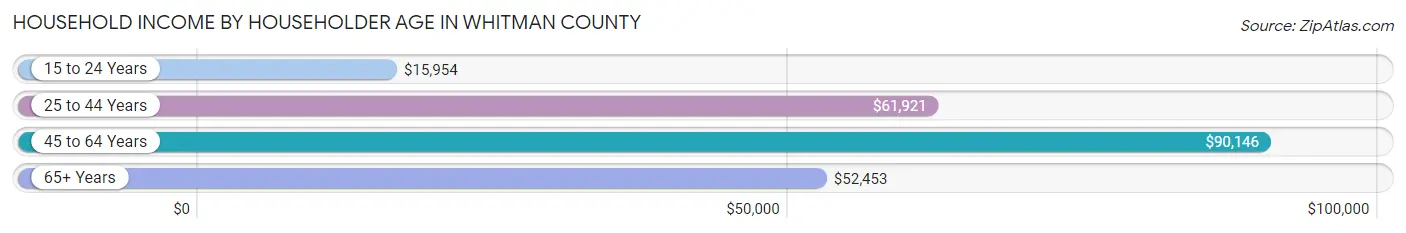
Household Income by Householder Age in Whitman County
The median household income in Whitman County is $49,345, with the highest median household income of $90,146 found in the 45 to 64 years age bracket for the primary householder. A total of 4,199 households (23.4%) fall into this category. Meanwhile, the 15 to 24 years age bracket for the primary householder has the lowest median household income of $15,954, with 4,358 households (24.3%) in this group.
| Income Bracket | # Households | Median Income |
| 15 to 24 Years | 4,358 (24.3%) | $15,954 |
| 25 to 44 Years | 6,050 (33.7%) | $61,921 |
| 45 to 64 Years | 4,199 (23.4%) | $90,146 |
| 65+ Years | 3,356 (18.7%) | $52,453 |
| Total | 17,963 (100.0%) | $49,345 |
Poverty in Whitman County
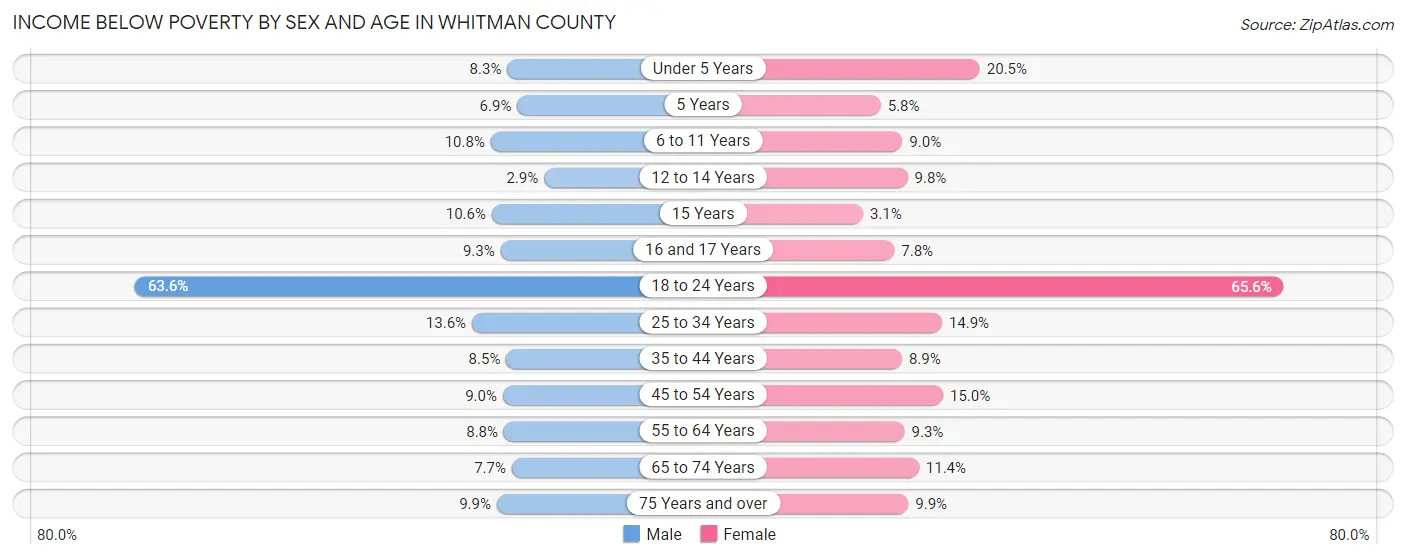
Income Below Poverty by Sex and Age in Whitman County
With 23.6% poverty level for males and 24.1% for females among the residents of Whitman County, 18 to 24 year old males and 18 to 24 year old females are the most vulnerable to poverty, with 3,454 males (63.6%) and 2,998 females (65.6%) in their respective age groups living below the poverty level.
| Age Bracket | Male | Female |
| Under 5 Years | 80 (8.3%) | 198 (20.5%) |
| 5 Years | 10 (6.9%) | 11 (5.8%) |
| 6 to 11 Years | 141 (10.8%) | 133 (9.0%) |
| 12 to 14 Years | 14 (2.9%) | 43 (9.8%) |
| 15 Years | 27 (10.6%) | 5 (3.1%) |
| 16 and 17 Years | 34 (9.3%) | 29 (7.8%) |
| 18 to 24 Years | 3,454 (63.6%) | 2,998 (65.6%) |
| 25 to 34 Years | 490 (13.6%) | 446 (14.9%) |
| 35 to 44 Years | 191 (8.5%) | 207 (8.9%) |
| 45 to 54 Years | 167 (9.0%) | 247 (15.0%) |
| 55 to 64 Years | 180 (8.8%) | 186 (9.3%) |
| 65 to 74 Years | 119 (7.6%) | 174 (11.4%) |
| 75 Years and over | 90 (9.9%) | 122 (9.9%) |
| Total | 4,997 (23.6%) | 4,799 (24.1%) |
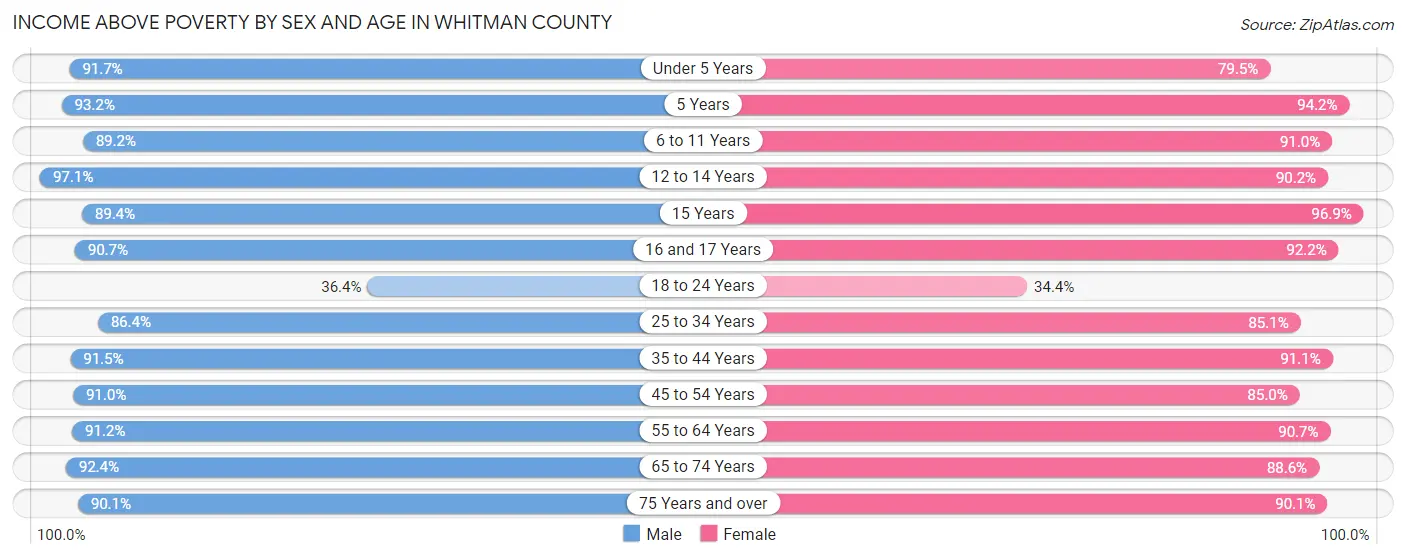
Income Above Poverty by Sex and Age in Whitman County
According to the poverty statistics in Whitman County, males aged 12 to 14 years and females aged 15 years are the age groups that are most secure financially, with 97.1% of males and 96.9% of females in these age groups living above the poverty line.
| Age Bracket | Male | Female |
| Under 5 Years | 880 (91.7%) | 768 (79.5%) |
| 5 Years | 136 (93.1%) | 179 (94.2%) |
| 6 to 11 Years | 1,166 (89.2%) | 1,345 (91.0%) |
| 12 to 14 Years | 475 (97.1%) | 397 (90.2%) |
| 15 Years | 227 (89.4%) | 154 (96.9%) |
| 16 and 17 Years | 331 (90.7%) | 343 (92.2%) |
| 18 to 24 Years | 1,976 (36.4%) | 1,572 (34.4%) |
| 25 to 34 Years | 3,119 (86.4%) | 2,553 (85.1%) |
| 35 to 44 Years | 2,062 (91.5%) | 2,110 (91.1%) |
| 45 to 54 Years | 1,691 (91.0%) | 1,396 (85.0%) |
| 55 to 64 Years | 1,859 (91.2%) | 1,808 (90.7%) |
| 65 to 74 Years | 1,436 (92.3%) | 1,347 (88.6%) |
| 75 Years and over | 821 (90.1%) | 1,113 (90.1%) |
| Total | 16,179 (76.4%) | 15,085 (75.9%) |
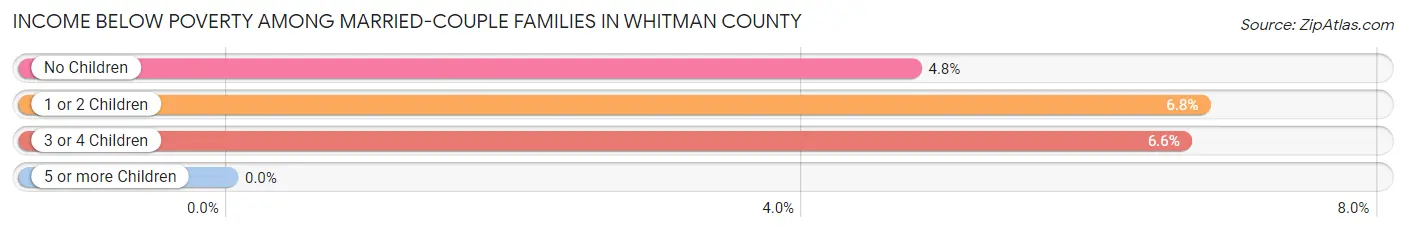
Income Below Poverty Among Married-Couple Families in Whitman County
The poverty statistics for married-couple families in Whitman County show that 5.4% or 381 of the total 7,021 families live below the poverty line. Families with 1 or 2 children have the highest poverty rate of 6.8%, comprising of 144 families. On the other hand, families with 5 or more children have the lowest poverty rate of 0.0%, which includes 0 families.
| Children | Above Poverty | Below Poverty |
| No Children | 4,061 (95.2%) | 203 (4.8%) |
| 1 or 2 Children | 1,982 (93.2%) | 144 (6.8%) |
| 3 or 4 Children | 478 (93.4%) | 34 (6.6%) |
| 5 or more Children | 119 (100.0%) | 0 (0.0%) |
| Total | 6,640 (94.6%) | 381 (5.4%) |
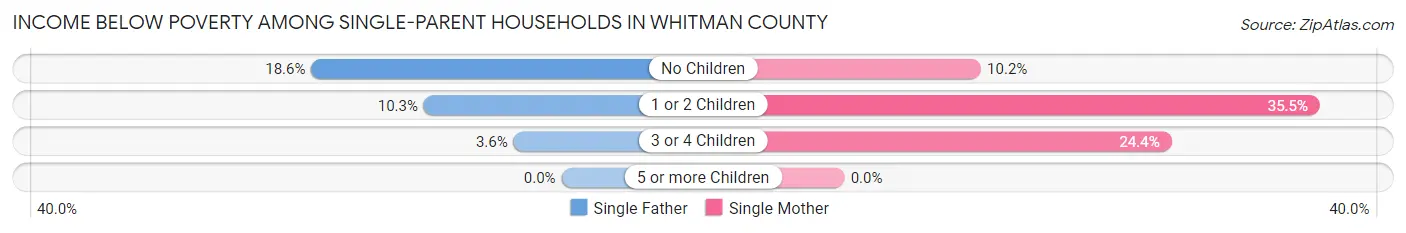
Income Below Poverty Among Single-Parent Households in Whitman County
According to the poverty data in Whitman County, 11.9% or 59 single-father households and 24.9% or 274 single-mother households are living below the poverty line. Among single-father households, those with no children have the highest poverty rate, with 22 households (18.6%) experiencing poverty. Likewise, among single-mother households, those with 1 or 2 children have the highest poverty rate, with 210 households (35.5%) falling below the poverty line.
| Children | Single Father | Single Mother |
| No Children | 22 (18.6%) | 43 (10.2%) |
| 1 or 2 Children | 36 (10.3%) | 210 (35.5%) |
| 3 or 4 Children | 1 (3.6%) | 21 (24.4%) |
| 5 or more Children | 0 (0.0%) | 0 (0.0%) |
| Total | 59 (11.9%) | 274 (24.9%) |
Income Below Poverty Among Married-Couple vs Single-Parent Households in Whitman County
The poverty data for Whitman County shows that 381 of the married-couple family households (5.4%) and 333 of the single-parent households (20.8%) are living below the poverty level. Within the married-couple family households, those with 1 or 2 children have the highest poverty rate, with 144 households (6.8%) falling below the poverty line. Among the single-parent households, those with 1 or 2 children have the highest poverty rate, with 246 household (26.1%) living below poverty.
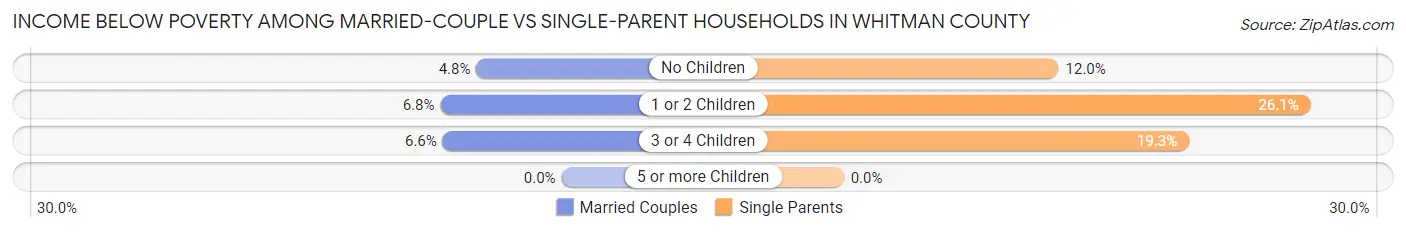
| Children | Married-Couple Families | Single-Parent Households |
| No Children | 203 (4.8%) | 65 (12.0%) |
| 1 or 2 Children | 144 (6.8%) | 246 (26.1%) |
| 3 or 4 Children | 34 (6.6%) | 22 (19.3%) |
| 5 or more Children | 0 (0.0%) | 0 (0.0%) |
| Total | 381 (5.4%) | 333 (20.8%) |
Employment Characteristics in Whitman County
Employment by Class of Employer in Whitman County
Among the 22,363 employed individuals in Whitman County, private company employees (10,914 | 48.8%), state government employees (6,062 | 27.1%), and not-for-profit organizations (1,437 | 6.4%) make up the most common classes of employment.
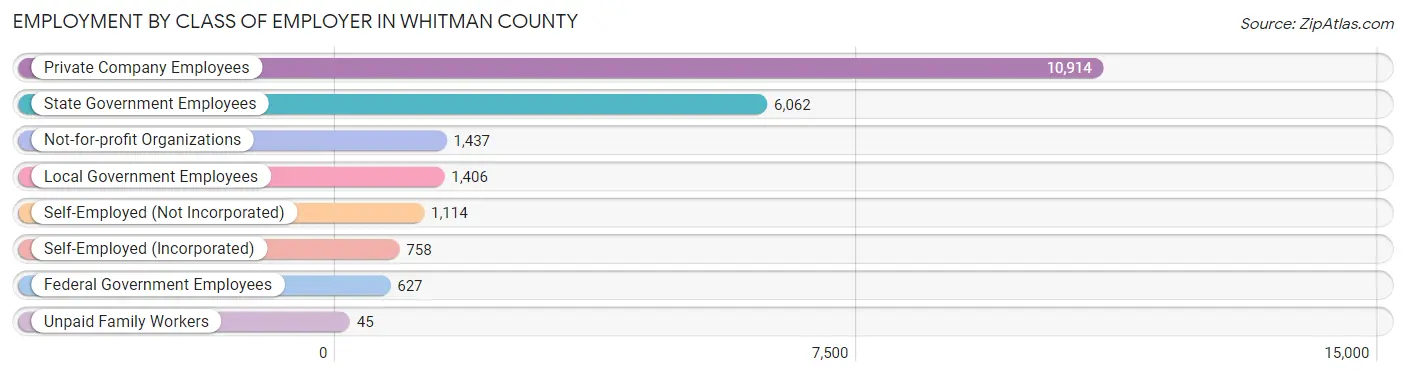
| Employer Class | # Employees | % Employees |
| Private Company Employees | 10,914 | 48.8% |
| Self-Employed (Incorporated) | 758 | 3.4% |
| Self-Employed (Not Incorporated) | 1,114 | 5.0% |
| Not-for-profit Organizations | 1,437 | 6.4% |
| Local Government Employees | 1,406 | 6.3% |
| State Government Employees | 6,062 | 27.1% |
| Federal Government Employees | 627 | 2.8% |
| Unpaid Family Workers | 45 | 0.2% |
| Total | 22,363 | 100.0% |
Employment Status by Age in Whitman County
According to the labor force statistics for Whitman County, out of the total population over 16 years of age (40,669), 60.5% or 24,605 individuals are in the labor force, with 6.7% or 1,649 of them unemployed. The age group with the highest labor force participation rate is 35 to 44 years, with 82.5% or 3,780 individuals in the labor force. Within the labor force, the 16 to 19 years age range has the highest percentage of unemployed individuals, with 25.3% or 515 of them being unemployed.
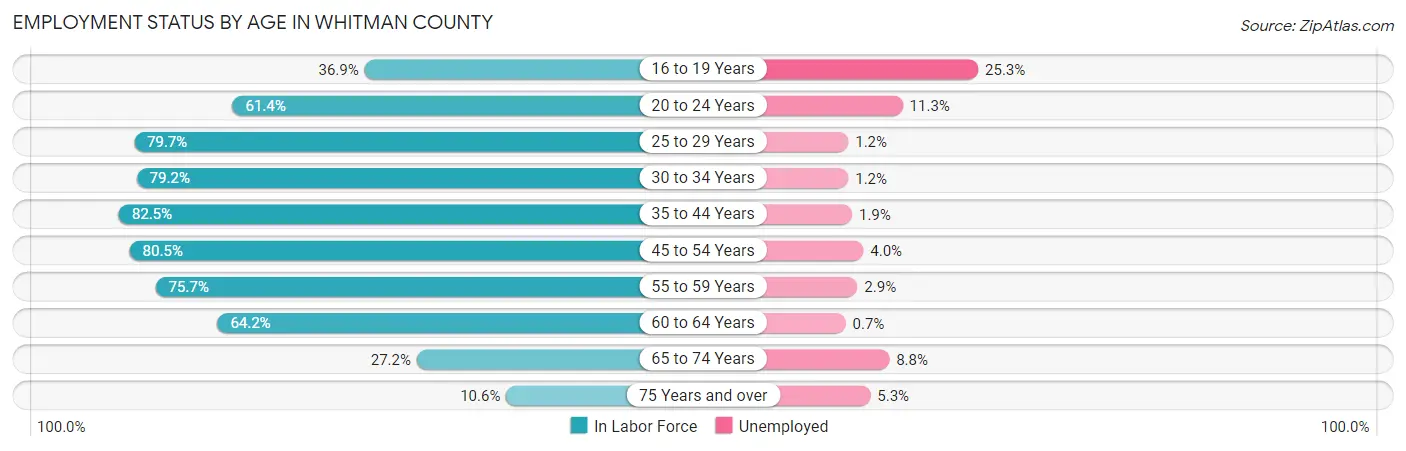
| Age Bracket | In Labor Force | Unemployed |
| 16 to 19 Years | 2,035 (36.9%) | 515 (25.3%) |
| 20 to 24 Years | 6,639 (61.4%) | 750 (11.3%) |
| 25 to 29 Years | 3,060 (79.7%) | 37 (1.2%) |
| 30 to 34 Years | 2,345 (79.2%) | 28 (1.2%) |
| 35 to 44 Years | 3,780 (82.5%) | 72 (1.9%) |
| 45 to 54 Years | 2,819 (80.5%) | 113 (4.0%) |
| 55 to 59 Years | 1,448 (75.7%) | 42 (2.9%) |
| 60 to 64 Years | 1,373 (64.2%) | 10 (0.7%) |
| 65 to 74 Years | 846 (27.2%) | 74 (8.8%) |
| 75 Years and over | 243 (10.6%) | 13 (5.3%) |
| Total | 24,605 (60.5%) | 1,649 (6.7%) |
Employment Status by Educational Attainment in Whitman County
According to labor force statistics for Whitman County, 78.3% of individuals (14,827) out of the total population between 25 and 64 years of age (18,936) are in the labor force, with 2.0% or 297 of them being unemployed. The group with the highest labor force participation rate are those with the educational attainment of bachelor's degree or higher, with 83.3% or 8,417 individuals in the labor force. Within the labor force, individuals with less than high school education have the highest percentage of unemployment, with 14.4% or 44 of them being unemployed.
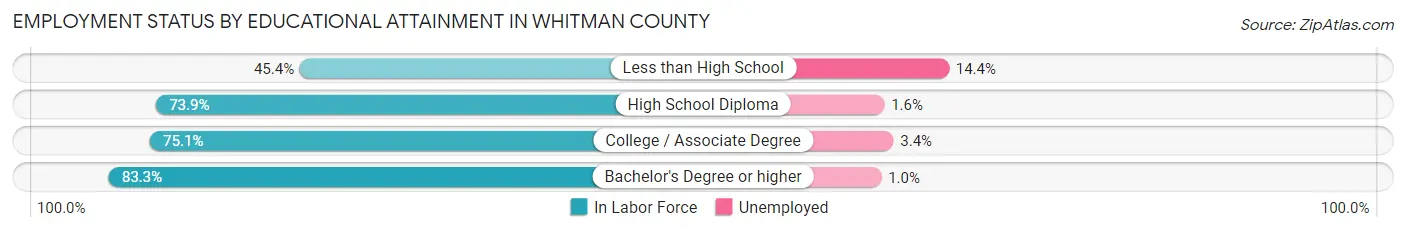
| Educational Attainment | In Labor Force | Unemployed |
| Less than High School | 305 (45.4%) | 97 (14.4%) |
| High School Diploma | 1,678 (73.9%) | 36 (1.6%) |
| College / Associate Degree | 4,422 (75.1%) | 200 (3.4%) |
| Bachelor's Degree or higher | 8,417 (83.3%) | 101 (1.0%) |
| Total | 14,827 (78.3%) | 379 (2.0%) |
Employment Occupations by Sex in Whitman County
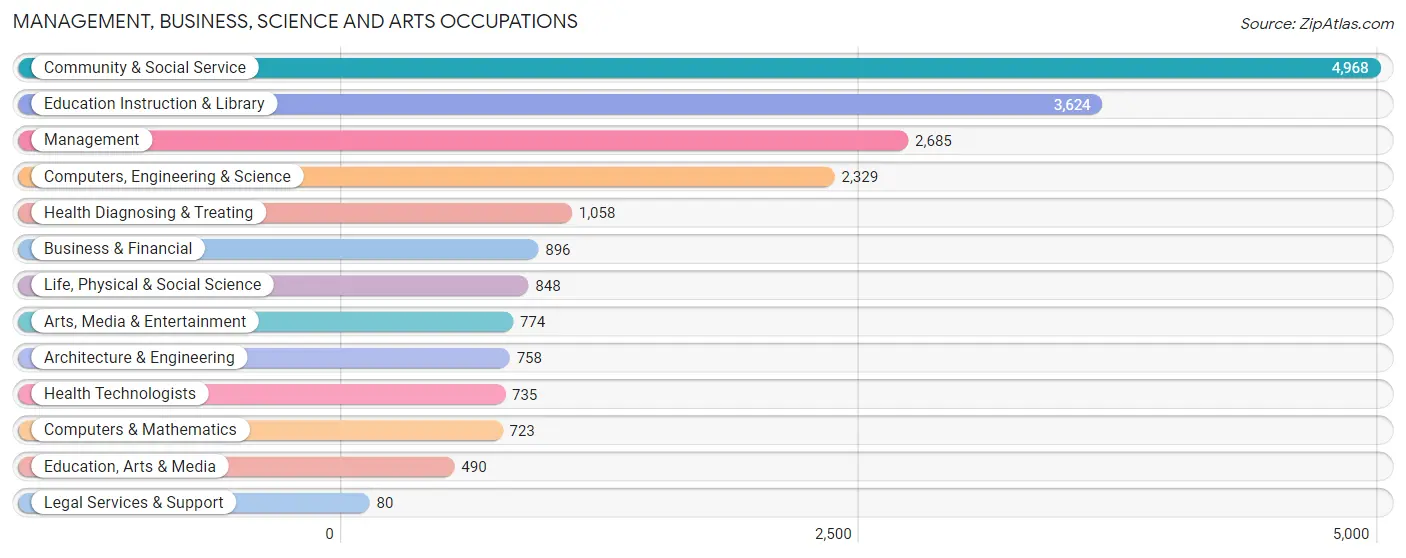
Management, Business, Science and Arts Occupations
The most common Management, Business, Science and Arts occupations in Whitman County are Community & Social Service (4,968 | 21.7%), Education Instruction & Library (3,624 | 15.9%), Management (2,685 | 11.7%), Computers, Engineering & Science (2,329 | 10.2%), and Health Diagnosing & Treating (1,058 | 4.6%).
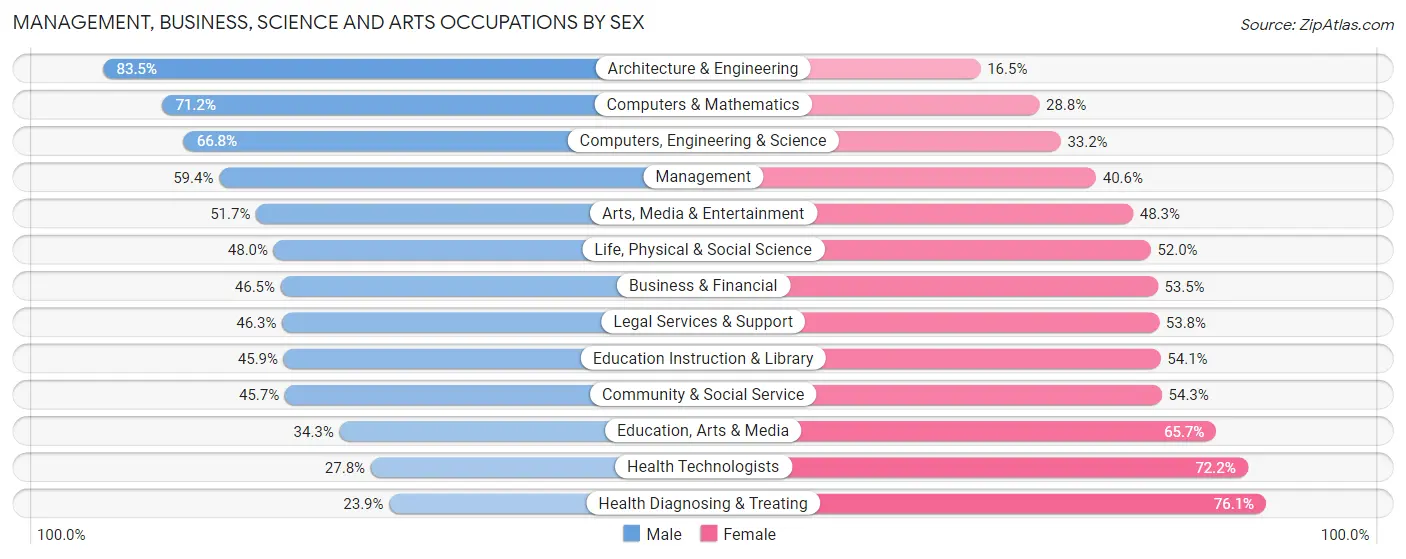
Management, Business, Science and Arts Occupations by Sex
Within the Management, Business, Science and Arts occupations in Whitman County, the most male-oriented occupations are Architecture & Engineering (83.5%), Computers & Mathematics (71.2%), and Computers, Engineering & Science (66.8%), while the most female-oriented occupations are Health Diagnosing & Treating (76.1%), Health Technologists (72.2%), and Education, Arts & Media (65.7%).
| Occupation | Male | Female |
| Management | 1,595 (59.4%) | 1,090 (40.6%) |
| Business & Financial | 417 (46.5%) | 479 (53.5%) |
| Computers, Engineering & Science | 1,555 (66.8%) | 774 (33.2%) |
| Computers & Mathematics | 515 (71.2%) | 208 (28.8%) |
| Architecture & Engineering | 633 (83.5%) | 125 (16.5%) |
| Life, Physical & Social Science | 407 (48.0%) | 441 (52.0%) |
| Community & Social Service | 2,269 (45.7%) | 2,699 (54.3%) |
| Education, Arts & Media | 168 (34.3%) | 322 (65.7%) |
| Legal Services & Support | 37 (46.3%) | 43 (53.7%) |
| Education Instruction & Library | 1,664 (45.9%) | 1,960 (54.1%) |
| Arts, Media & Entertainment | 400 (51.7%) | 374 (48.3%) |
| Health Diagnosing & Treating | 253 (23.9%) | 805 (76.1%) |
| Health Technologists | 204 (27.8%) | 531 (72.2%) |
| Total (Category) | 6,089 (51.0%) | 5,847 (49.0%) |
| Total (Overall) | 12,185 (53.3%) | 10,662 (46.7%) |
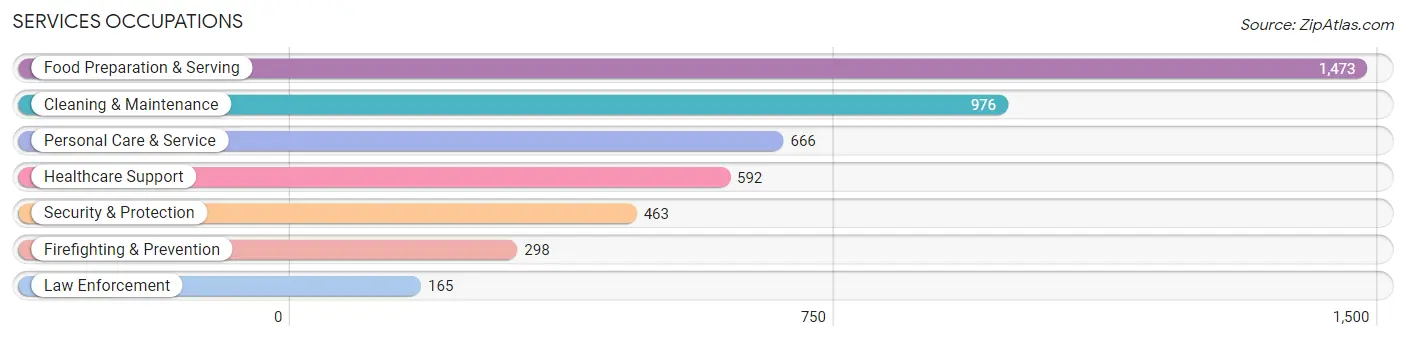
Services Occupations
The most common Services occupations in Whitman County are Food Preparation & Serving (1,473 | 6.5%), Cleaning & Maintenance (976 | 4.3%), Personal Care & Service (666 | 2.9%), Healthcare Support (592 | 2.6%), and Security & Protection (463 | 2.0%).
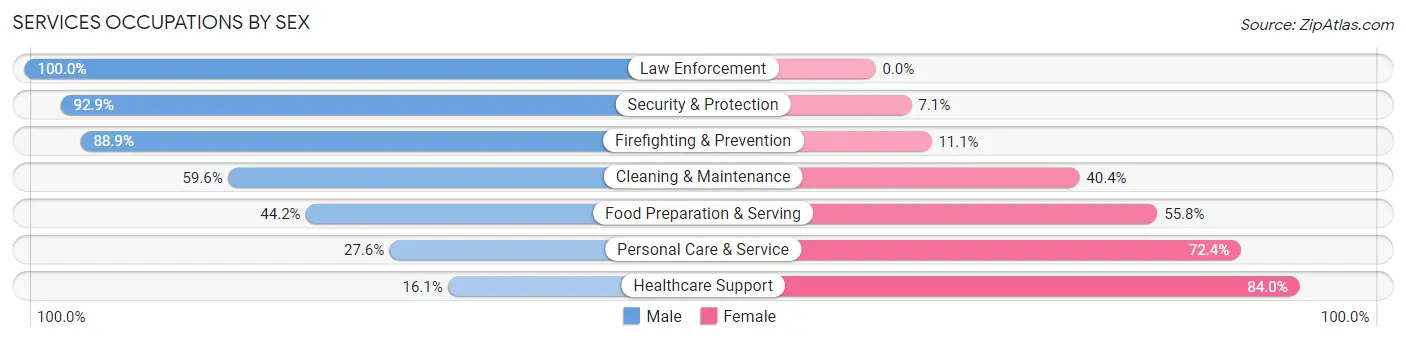
Services Occupations by Sex
Within the Services occupations in Whitman County, the most male-oriented occupations are Law Enforcement (100.0%), Security & Protection (92.9%), and Firefighting & Prevention (88.9%), while the most female-oriented occupations are Healthcare Support (84.0%), Personal Care & Service (72.4%), and Food Preparation & Serving (55.8%).
| Occupation | Male | Female |
| Healthcare Support | 95 (16.1%) | 497 (84.0%) |
| Security & Protection | 430 (92.9%) | 33 (7.1%) |
| Firefighting & Prevention | 265 (88.9%) | 33 (11.1%) |
| Law Enforcement | 165 (100.0%) | 0 (0.0%) |
| Food Preparation & Serving | 651 (44.2%) | 822 (55.8%) |
| Cleaning & Maintenance | 582 (59.6%) | 394 (40.4%) |
| Personal Care & Service | 184 (27.6%) | 482 (72.4%) |
| Total (Category) | 1,942 (46.6%) | 2,228 (53.4%) |
| Total (Overall) | 12,185 (53.3%) | 10,662 (46.7%) |
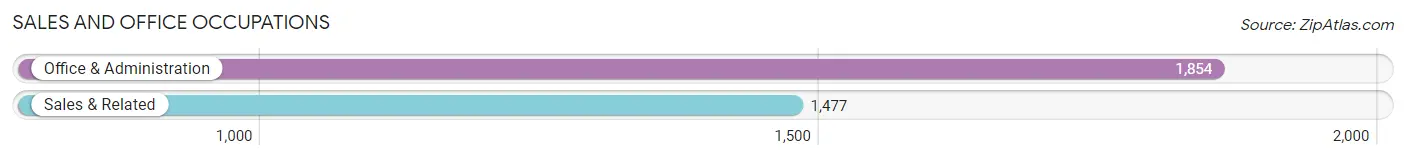
Sales and Office Occupations
The most common Sales and Office occupations in Whitman County are Office & Administration (1,854 | 8.1%), and Sales & Related (1,477 | 6.5%).
Sales and Office Occupations by Sex
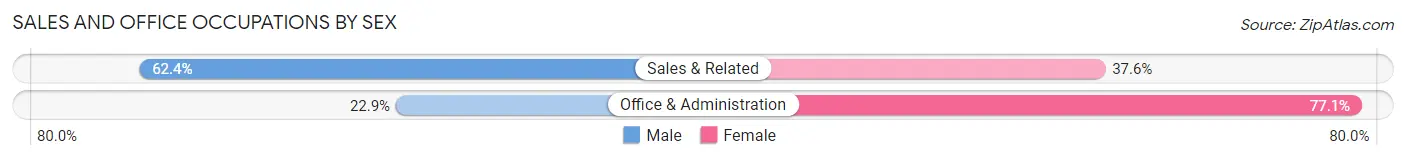
| Occupation | Male | Female |
| Sales & Related | 921 (62.4%) | 556 (37.6%) |
| Office & Administration | 424 (22.9%) | 1,430 (77.1%) |
| Total (Category) | 1,345 (40.4%) | 1,986 (59.6%) |
| Total (Overall) | 12,185 (53.3%) | 10,662 (46.7%) |
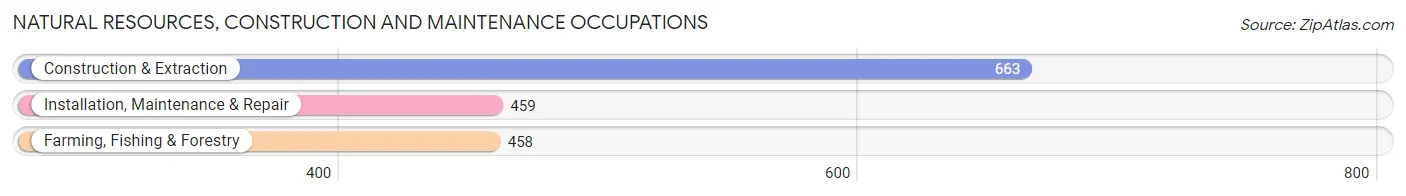
Natural Resources, Construction and Maintenance Occupations
The most common Natural Resources, Construction and Maintenance occupations in Whitman County are Construction & Extraction (663 | 2.9%), Installation, Maintenance & Repair (459 | 2.0%), and Farming, Fishing & Forestry (458 | 2.0%).
Natural Resources, Construction and Maintenance Occupations by Sex
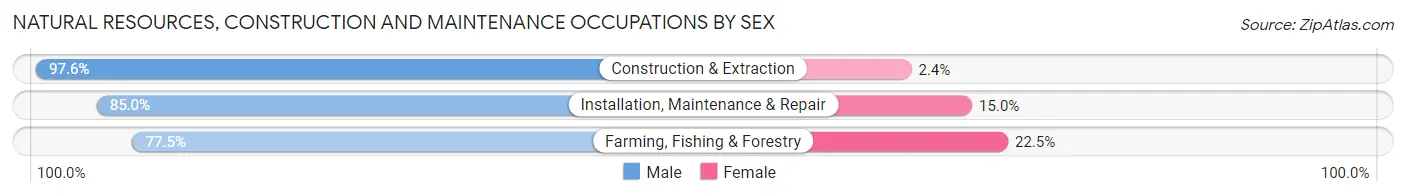
| Occupation | Male | Female |
| Farming, Fishing & Forestry | 355 (77.5%) | 103 (22.5%) |
| Construction & Extraction | 647 (97.6%) | 16 (2.4%) |
| Installation, Maintenance & Repair | 390 (85.0%) | 69 (15.0%) |
| Total (Category) | 1,392 (88.1%) | 188 (11.9%) |
| Total (Overall) | 12,185 (53.3%) | 10,662 (46.7%) |
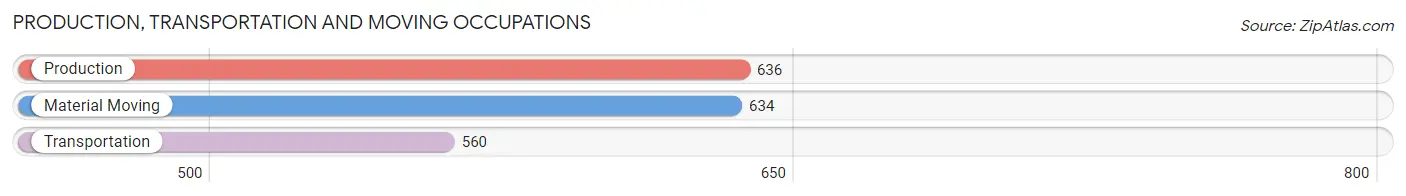
Production, Transportation and Moving Occupations
The most common Production, Transportation and Moving occupations in Whitman County are Production (636 | 2.8%), Material Moving (634 | 2.8%), and Transportation (560 | 2.5%).
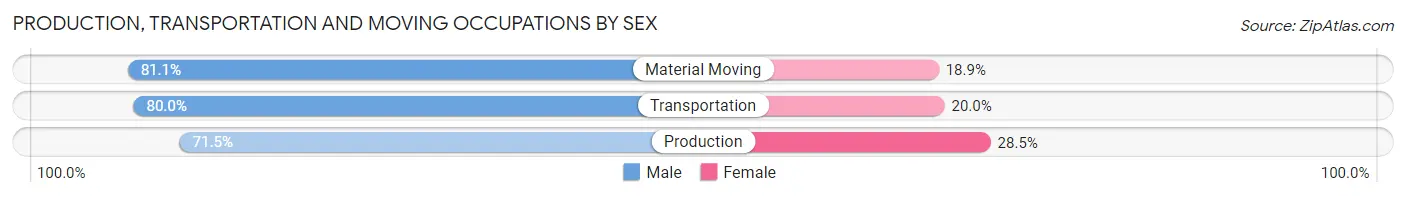
Production, Transportation and Moving Occupations by Sex
| Occupation | Male | Female |
| Production | 455 (71.5%) | 181 (28.5%) |
| Transportation | 448 (80.0%) | 112 (20.0%) |
| Material Moving | 514 (81.1%) | 120 (18.9%) |
| Total (Category) | 1,417 (77.4%) | 413 (22.6%) |
| Total (Overall) | 12,185 (53.3%) | 10,662 (46.7%) |
Employment Industries by Sex in Whitman County
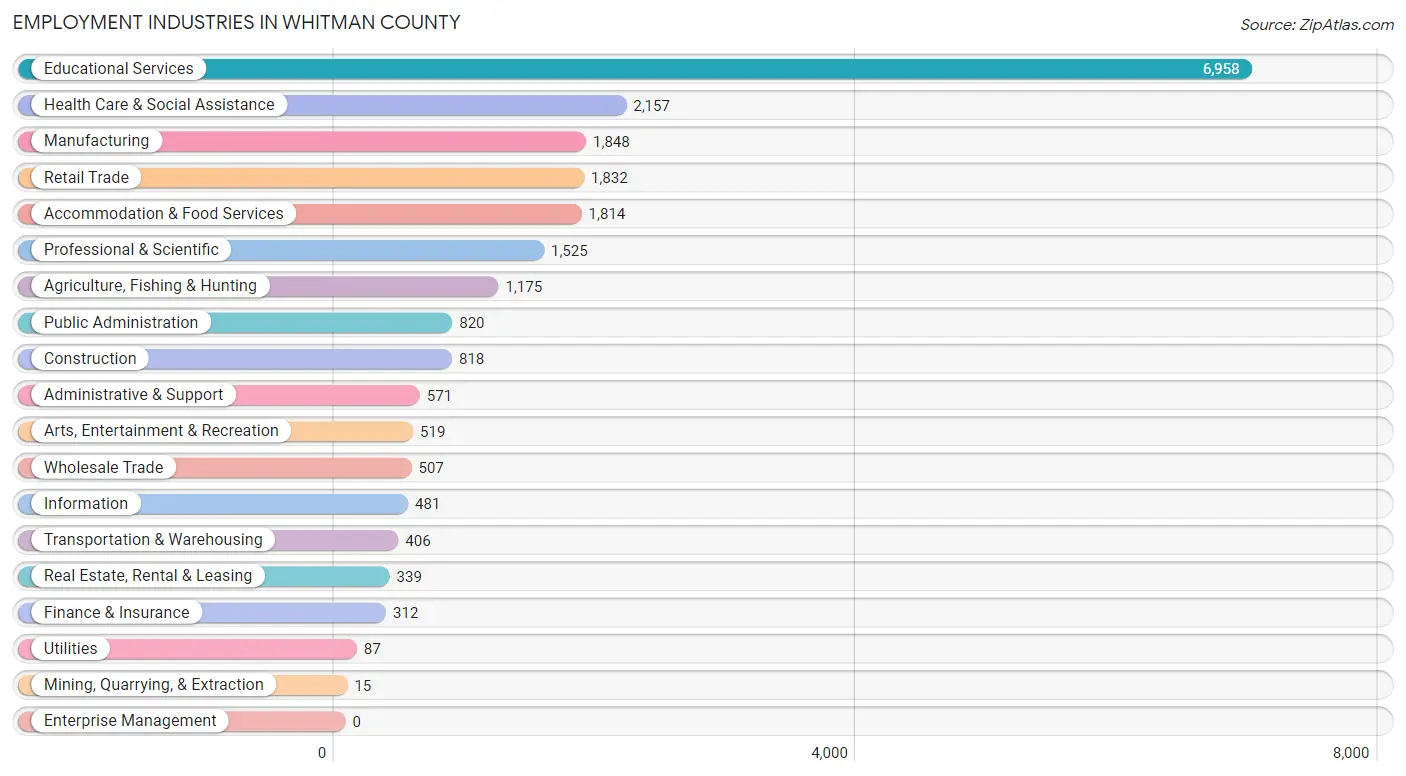
Employment Industries in Whitman County
The major employment industries in Whitman County include Educational Services (6,958 | 30.4%), Health Care & Social Assistance (2,157 | 9.4%), Manufacturing (1,848 | 8.1%), Retail Trade (1,832 | 8.0%), and Accommodation & Food Services (1,814 | 7.9%).
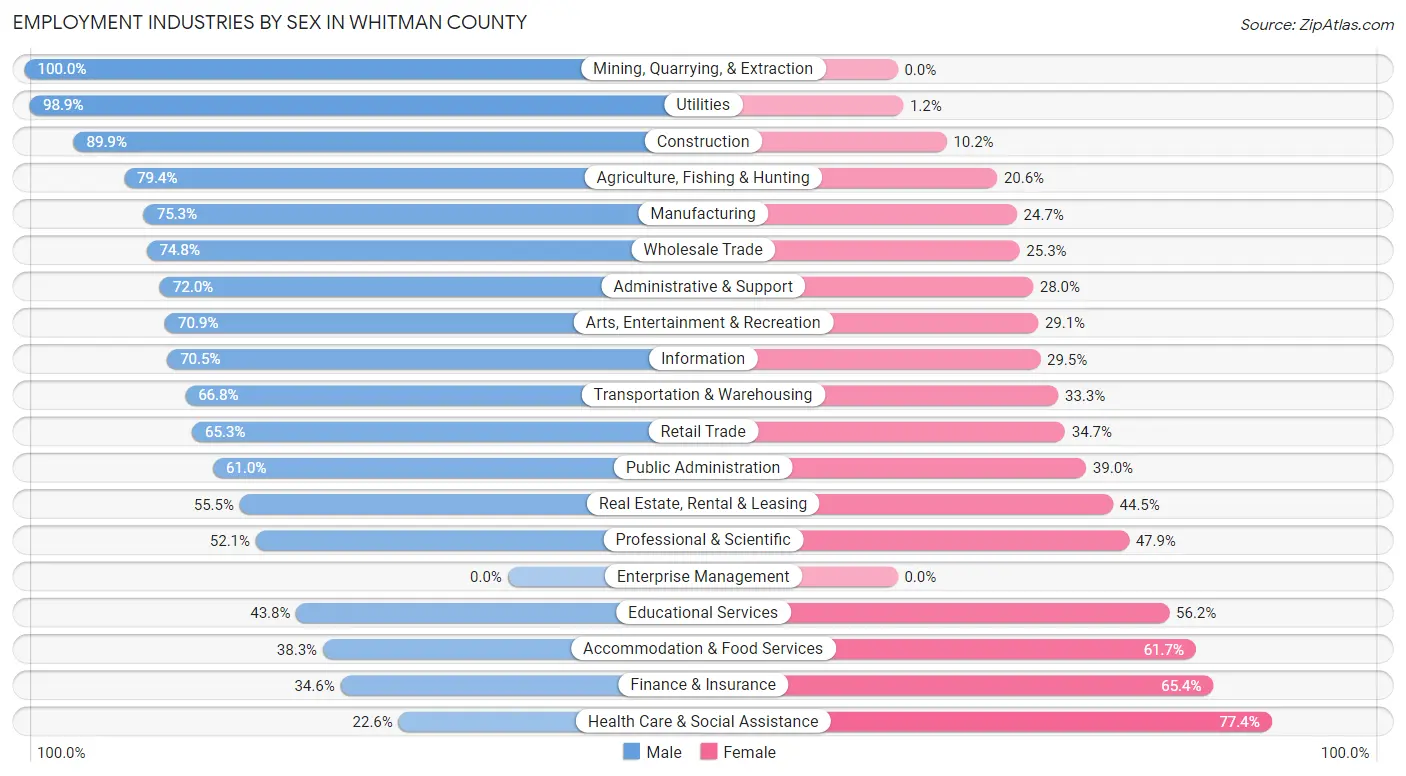
Employment Industries by Sex in Whitman County
The Whitman County industries that see more men than women are Mining, Quarrying, & Extraction (100.0%), Utilities (98.9%), and Construction (89.8%), whereas the industries that tend to have a higher number of women are Health Care & Social Assistance (77.4%), Finance & Insurance (65.4%), and Accommodation & Food Services (61.7%).
| Industry | Male | Female |
| Agriculture, Fishing & Hunting | 933 (79.4%) | 242 (20.6%) |
| Mining, Quarrying, & Extraction | 15 (100.0%) | 0 (0.0%) |
| Construction | 735 (89.8%) | 83 (10.2%) |
| Manufacturing | 1,392 (75.3%) | 456 (24.7%) |
| Wholesale Trade | 379 (74.8%) | 128 (25.3%) |
| Retail Trade | 1,197 (65.3%) | 635 (34.7%) |
| Transportation & Warehousing | 271 (66.7%) | 135 (33.3%) |
| Utilities | 86 (98.9%) | 1 (1.1%) |
| Information | 339 (70.5%) | 142 (29.5%) |
| Finance & Insurance | 108 (34.6%) | 204 (65.4%) |
| Real Estate, Rental & Leasing | 188 (55.5%) | 151 (44.5%) |
| Professional & Scientific | 795 (52.1%) | 730 (47.9%) |
| Enterprise Management | 0 (0.0%) | 0 (0.0%) |
| Administrative & Support | 411 (72.0%) | 160 (28.0%) |
| Educational Services | 3,045 (43.8%) | 3,913 (56.2%) |
| Health Care & Social Assistance | 487 (22.6%) | 1,670 (77.4%) |
| Arts, Entertainment & Recreation | 368 (70.9%) | 151 (29.1%) |
| Accommodation & Food Services | 694 (38.3%) | 1,120 (61.7%) |
| Public Administration | 500 (61.0%) | 320 (39.0%) |
| Total | 12,185 (53.3%) | 10,662 (46.7%) |
Education in Whitman County
School Enrollment in Whitman County
The most common levels of schooling among the 22,026 students in Whitman County are college / undergraduate (13,784 | 62.6%), graduate / professional (2,847 | 12.9%), and elementary school (1,795 | 8.2%).
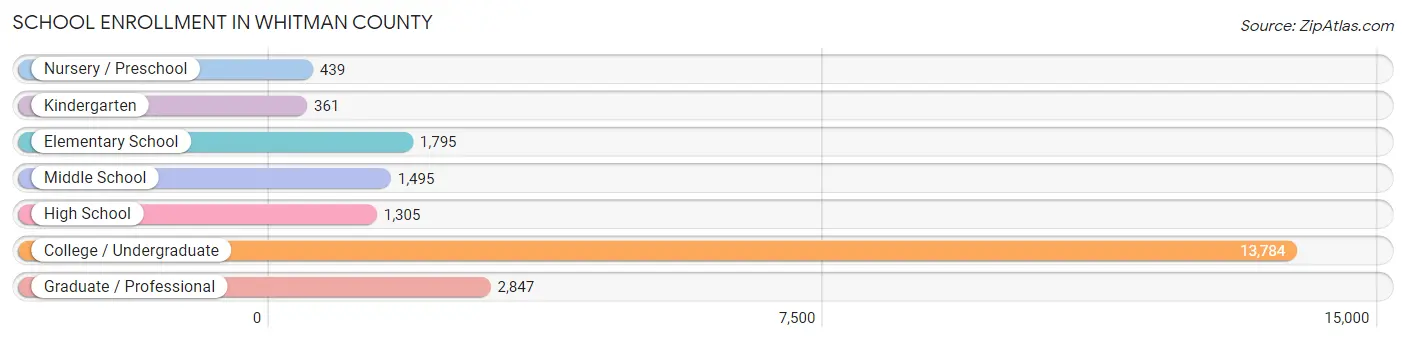
| School Level | # Students | % Students |
| Nursery / Preschool | 439 | 2.0% |
| Kindergarten | 361 | 1.6% |
| Elementary School | 1,795 | 8.2% |
| Middle School | 1,495 | 6.8% |
| High School | 1,305 | 5.9% |
| College / Undergraduate | 13,784 | 62.6% |
| Graduate / Professional | 2,847 | 12.9% |
| Total | 22,026 | 100.0% |
School Enrollment by Age by Funding Source in Whitman County
Out of a total of 22,026 students who are enrolled in schools in Whitman County, 1,101 (5.0%) attend a private institution, while the remaining 20,925 (95.0%) are enrolled in public schools. The age group of 3 to 4 year olds has the highest likelihood of being enrolled in private schools, with 172 (55.7% in the age bracket) enrolled. Conversely, the age group of 18 to 19 year olds has the lowest likelihood of being enrolled in a private school, with 4,458 (99.5% in the age bracket) attending a public institution.
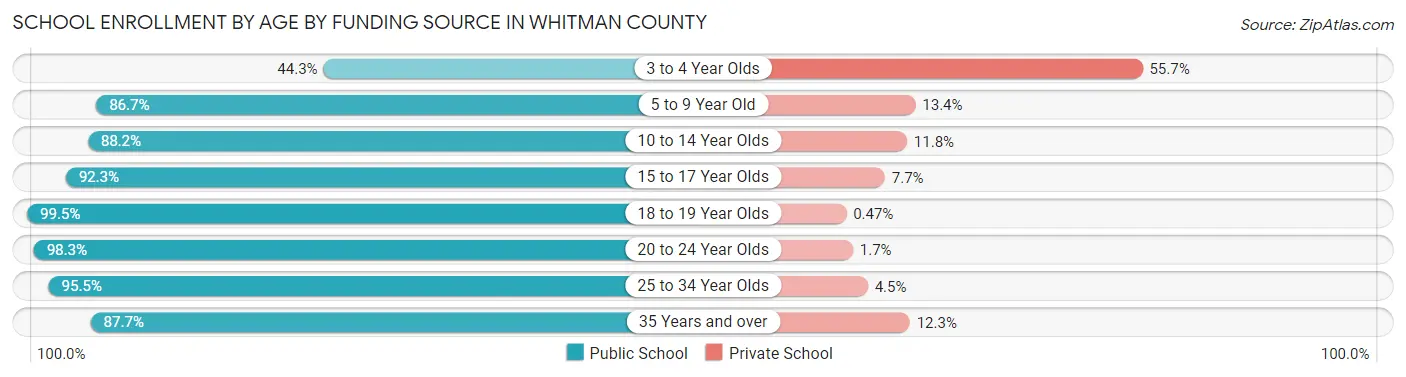
| Age Bracket | Public School | Private School |
| 3 to 4 Year Olds | 137 (44.3%) | 172 (55.7%) |
| 5 to 9 Year Old | 1,805 (86.7%) | 278 (13.4%) |
| 10 to 14 Year Olds | 1,543 (88.2%) | 206 (11.8%) |
| 15 to 17 Year Olds | 1,060 (92.3%) | 88 (7.7%) |
| 18 to 19 Year Olds | 4,458 (99.5%) | 21 (0.5%) |
| 20 to 24 Year Olds | 9,077 (98.3%) | 158 (1.7%) |
| 25 to 34 Year Olds | 2,259 (95.5%) | 106 (4.5%) |
| 35 Years and over | 577 (87.7%) | 81 (12.3%) |
| Total | 20,925 (95.0%) | 1,101 (5.0%) |
Educational Attainment by Field of Study in Whitman County
Bio, nature & agricultural (2,262 | 16.5%), business (1,430 | 10.4%), education (1,293 | 9.4%), engineering (1,279 | 9.3%), and social sciences (1,093 | 8.0%) are the most common fields of study among 13,718 individuals in Whitman County who have obtained a bachelor's degree or higher.
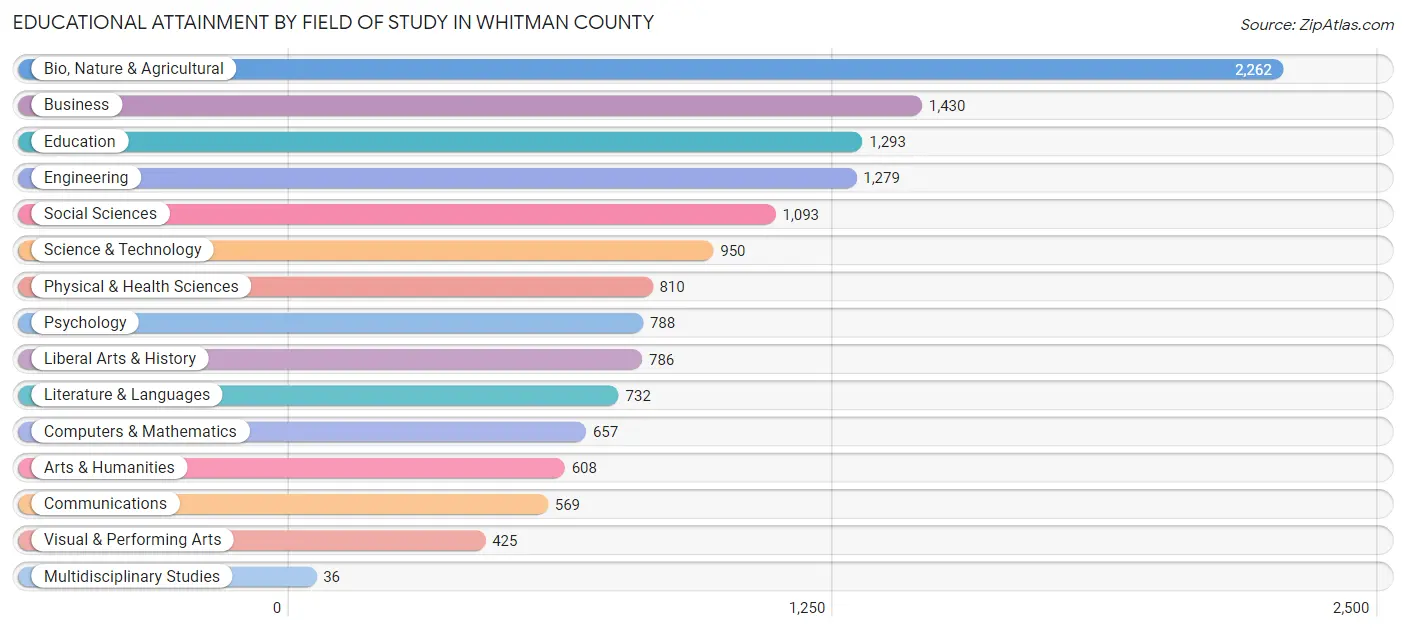
| Field of Study | # Graduates | % Graduates |
| Computers & Mathematics | 657 | 4.8% |
| Bio, Nature & Agricultural | 2,262 | 16.5% |
| Physical & Health Sciences | 810 | 5.9% |
| Psychology | 788 | 5.7% |
| Social Sciences | 1,093 | 8.0% |
| Engineering | 1,279 | 9.3% |
| Multidisciplinary Studies | 36 | 0.3% |
| Science & Technology | 950 | 6.9% |
| Business | 1,430 | 10.4% |
| Education | 1,293 | 9.4% |
| Literature & Languages | 732 | 5.3% |
| Liberal Arts & History | 786 | 5.7% |
| Visual & Performing Arts | 425 | 3.1% |
| Communications | 569 | 4.2% |
| Arts & Humanities | 608 | 4.4% |
| Total | 13,718 | 100.0% |
Transportation & Commute in Whitman County
Vehicle Availability by Sex in Whitman County
The most prevalent vehicle ownership categories in Whitman County are males with 2 vehicles (4,207, accounting for 37.4%) and females with 2 vehicles (4,012, making up 44.6%).
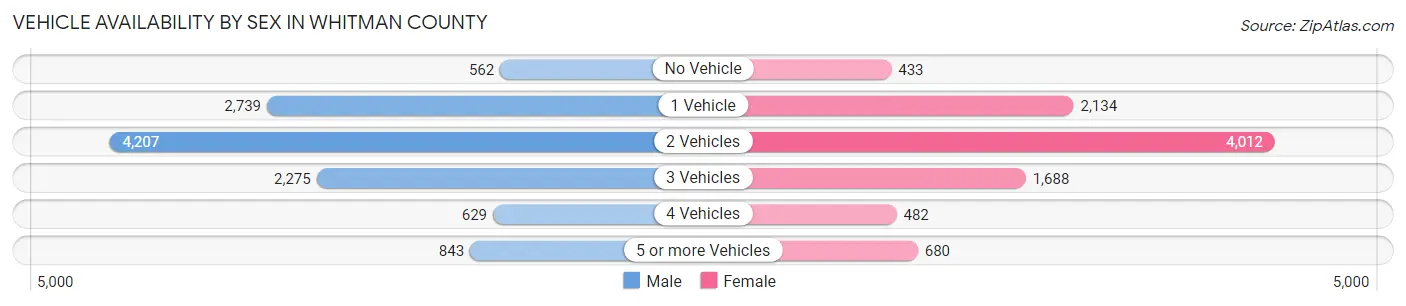
| Vehicles Available | Male | Female |
| No Vehicle | 562 (5.0%) | 433 (4.6%) |
| 1 Vehicle | 2,739 (24.3%) | 2,134 (22.6%) |
| 2 Vehicles | 4,207 (37.4%) | 4,012 (42.5%) |
| 3 Vehicles | 2,275 (20.2%) | 1,688 (17.9%) |
| 4 Vehicles | 629 (5.6%) | 482 (5.1%) |
| 5 or more Vehicles | 843 (7.5%) | 680 (7.2%) |
| Total | 11,255 (100.0%) | 9,429 (100.0%) |
Commute Time in Whitman County
The most frequently occuring commute durations in Whitman County are 10 to 14 minutes (4,827 commuters, 23.7%), 5 to 9 minutes (4,212 commuters, 20.7%), and 15 to 19 minutes (3,620 commuters, 17.8%).
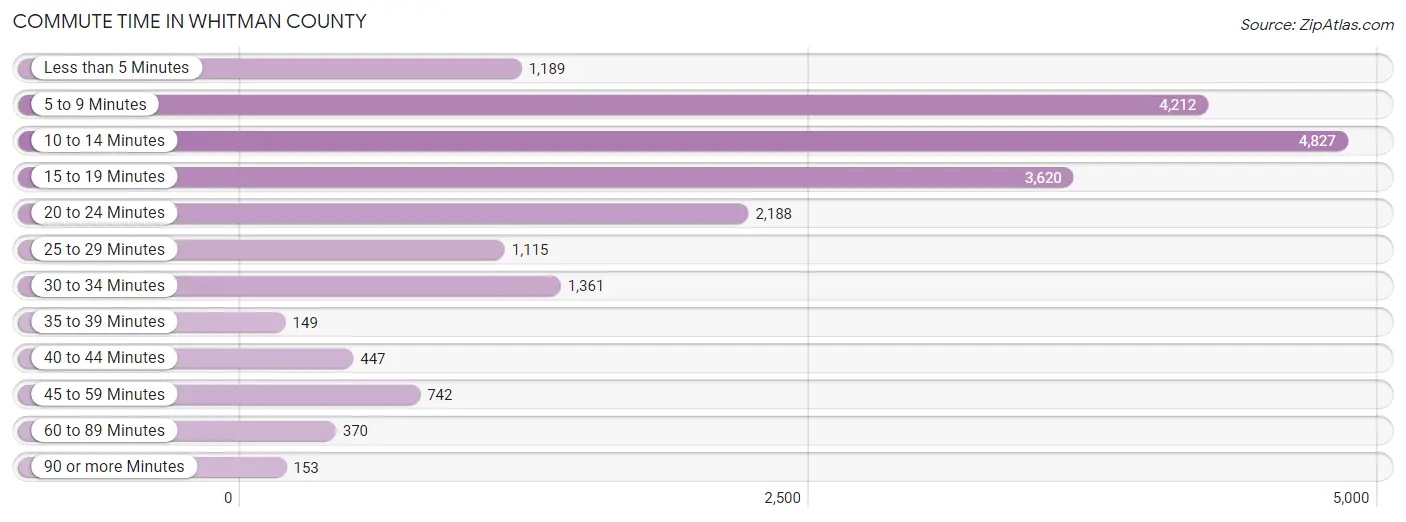
| Commute Time | # Commuters | % Commuters |
| Less than 5 Minutes | 1,189 | 5.8% |
| 5 to 9 Minutes | 4,212 | 20.7% |
| 10 to 14 Minutes | 4,827 | 23.7% |
| 15 to 19 Minutes | 3,620 | 17.8% |
| 20 to 24 Minutes | 2,188 | 10.7% |
| 25 to 29 Minutes | 1,115 | 5.5% |
| 30 to 34 Minutes | 1,361 | 6.7% |
| 35 to 39 Minutes | 149 | 0.7% |
| 40 to 44 Minutes | 447 | 2.2% |
| 45 to 59 Minutes | 742 | 3.6% |
| 60 to 89 Minutes | 370 | 1.8% |
| 90 or more Minutes | 153 | 0.7% |
Commute Time by Sex in Whitman County
The most common commute times in Whitman County are 10 to 14 minutes (2,740 commuters, 25.0%) for males and 5 to 9 minutes (2,107 commuters, 22.4%) for females.
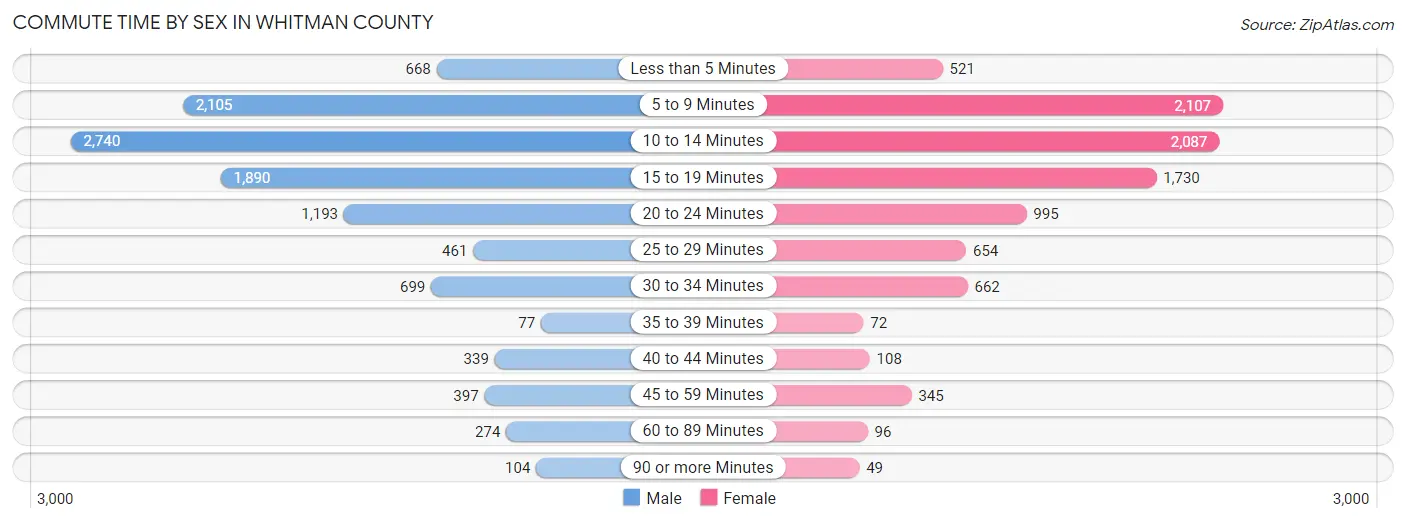
| Commute Time | Male | Female |
| Less than 5 Minutes | 668 (6.1%) | 521 (5.5%) |
| 5 to 9 Minutes | 2,105 (19.2%) | 2,107 (22.4%) |
| 10 to 14 Minutes | 2,740 (25.0%) | 2,087 (22.1%) |
| 15 to 19 Minutes | 1,890 (17.3%) | 1,730 (18.3%) |
| 20 to 24 Minutes | 1,193 (10.9%) | 995 (10.6%) |
| 25 to 29 Minutes | 461 (4.2%) | 654 (6.9%) |
| 30 to 34 Minutes | 699 (6.4%) | 662 (7.0%) |
| 35 to 39 Minutes | 77 (0.7%) | 72 (0.8%) |
| 40 to 44 Minutes | 339 (3.1%) | 108 (1.1%) |
| 45 to 59 Minutes | 397 (3.6%) | 345 (3.7%) |
| 60 to 89 Minutes | 274 (2.5%) | 96 (1.0%) |
| 90 or more Minutes | 104 (0.9%) | 49 (0.5%) |
Time of Departure to Work by Sex in Whitman County
The most frequent times of departure to work in Whitman County are 7:30 AM to 7:59 AM (1,813, 16.6%) for males and 7:30 AM to 7:59 AM (1,588, 16.9%) for females.
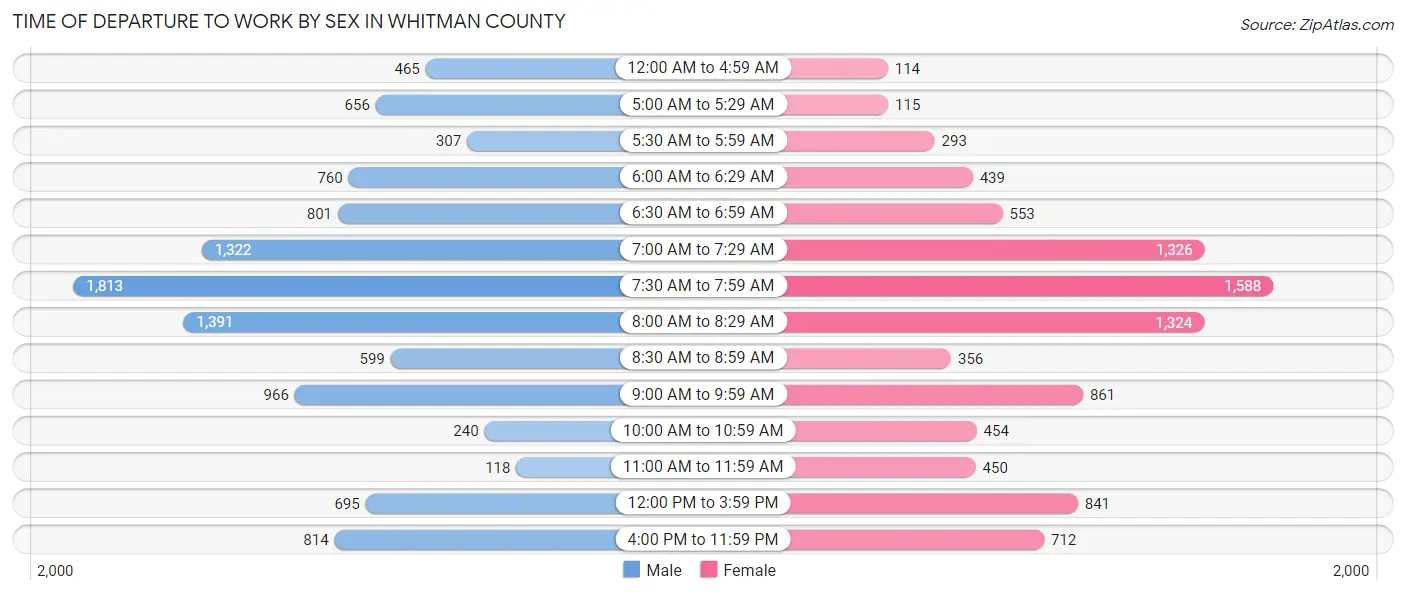
| Time of Departure | Male | Female |
| 12:00 AM to 4:59 AM | 465 (4.3%) | 114 (1.2%) |
| 5:00 AM to 5:29 AM | 656 (6.0%) | 115 (1.2%) |
| 5:30 AM to 5:59 AM | 307 (2.8%) | 293 (3.1%) |
| 6:00 AM to 6:29 AM | 760 (6.9%) | 439 (4.7%) |
| 6:30 AM to 6:59 AM | 801 (7.3%) | 553 (5.9%) |
| 7:00 AM to 7:29 AM | 1,322 (12.1%) | 1,326 (14.1%) |
| 7:30 AM to 7:59 AM | 1,813 (16.6%) | 1,588 (16.9%) |
| 8:00 AM to 8:29 AM | 1,391 (12.7%) | 1,324 (14.1%) |
| 8:30 AM to 8:59 AM | 599 (5.5%) | 356 (3.8%) |
| 9:00 AM to 9:59 AM | 966 (8.8%) | 861 (9.1%) |
| 10:00 AM to 10:59 AM | 240 (2.2%) | 454 (4.8%) |
| 11:00 AM to 11:59 AM | 118 (1.1%) | 450 (4.8%) |
| 12:00 PM to 3:59 PM | 695 (6.4%) | 841 (8.9%) |
| 4:00 PM to 11:59 PM | 814 (7.4%) | 712 (7.5%) |
| Total | 10,947 (100.0%) | 9,426 (100.0%) |
Housing Occupancy in Whitman County
Occupancy by Ownership in Whitman County
Of the total 17,963 dwellings in Whitman County, owner-occupied units account for 8,123 (45.2%), while renter-occupied units make up 9,840 (54.8%).
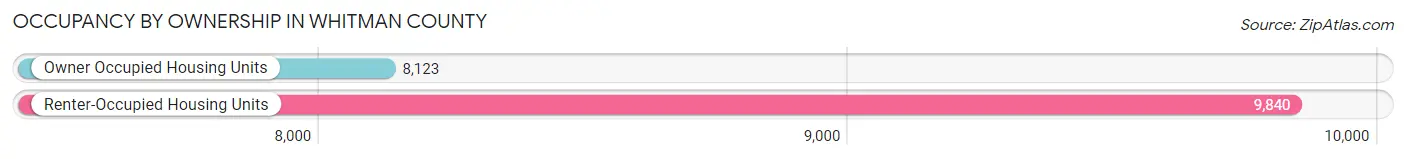
| Occupancy | # Housing Units | % Housing Units |
| Owner Occupied Housing Units | 8,123 | 45.2% |
| Renter-Occupied Housing Units | 9,840 | 54.8% |
| Total Occupied Housing Units | 17,963 | 100.0% |
Occupancy by Household Size in Whitman County
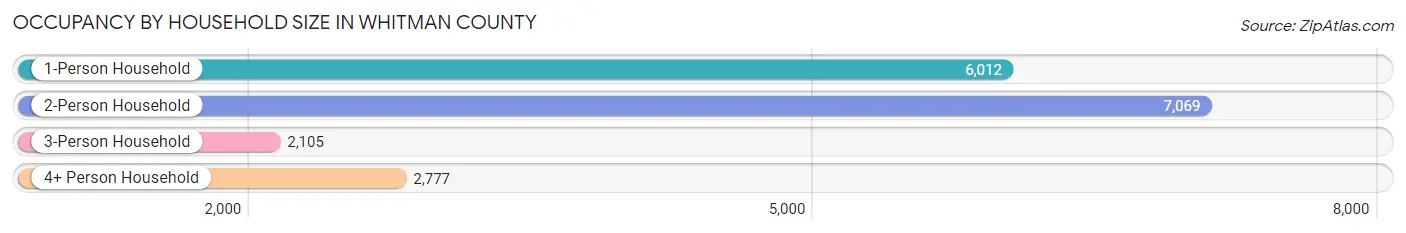
| Household Size | # Housing Units | % Housing Units |
| 1-Person Household | 6,012 | 33.5% |
| 2-Person Household | 7,069 | 39.4% |
| 3-Person Household | 2,105 | 11.7% |
| 4+ Person Household | 2,777 | 15.5% |
| Total Housing Units | 17,963 | 100.0% |
Occupancy by Ownership by Household Size in Whitman County
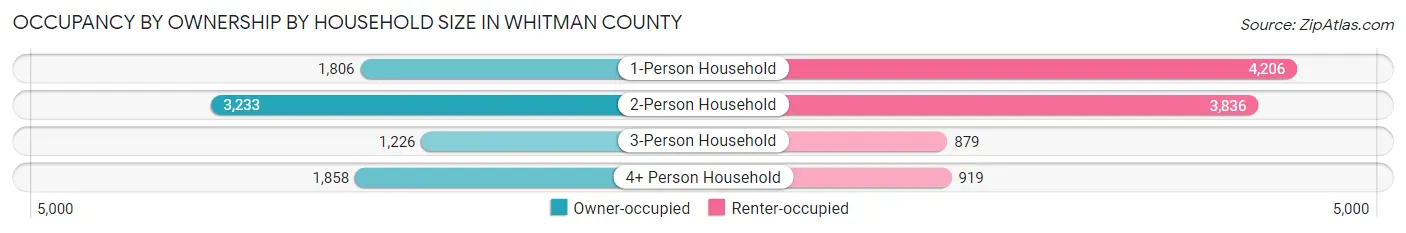
| Household Size | Owner-occupied | Renter-occupied |
| 1-Person Household | 1,806 (30.0%) | 4,206 (70.0%) |
| 2-Person Household | 3,233 (45.7%) | 3,836 (54.3%) |
| 3-Person Household | 1,226 (58.2%) | 879 (41.8%) |
| 4+ Person Household | 1,858 (66.9%) | 919 (33.1%) |
| Total Housing Units | 8,123 (45.2%) | 9,840 (54.8%) |
Occupancy by Educational Attainment in Whitman County
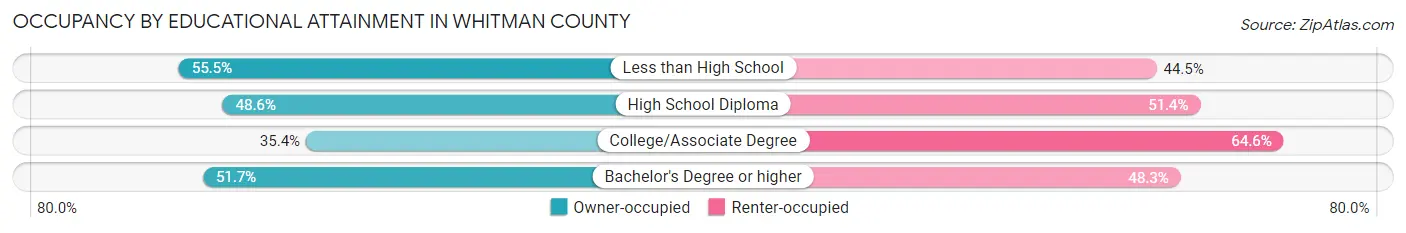
| Household Size | Owner-occupied | Renter-occupied |
| Less than High School | 246 (55.5%) | 197 (44.5%) |
| High School Diploma | 1,188 (48.6%) | 1,257 (51.4%) |
| College/Associate Degree | 2,397 (35.4%) | 4,378 (64.6%) |
| Bachelor's Degree or higher | 4,292 (51.7%) | 4,008 (48.3%) |
Occupancy by Age of Householder in Whitman County
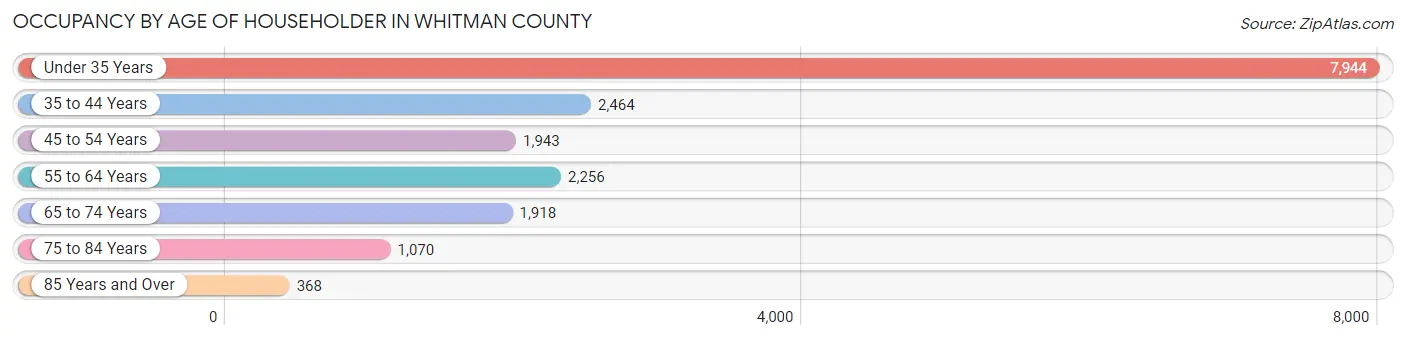
| Age Bracket | # Households | % Households |
| Under 35 Years | 7,944 | 44.2% |
| 35 to 44 Years | 2,464 | 13.7% |
| 45 to 54 Years | 1,943 | 10.8% |
| 55 to 64 Years | 2,256 | 12.6% |
| 65 to 74 Years | 1,918 | 10.7% |
| 75 to 84 Years | 1,070 | 6.0% |
| 85 Years and Over | 368 | 2.1% |
| Total | 17,963 | 100.0% |
Housing Finances in Whitman County
Median Income by Occupancy in Whitman County
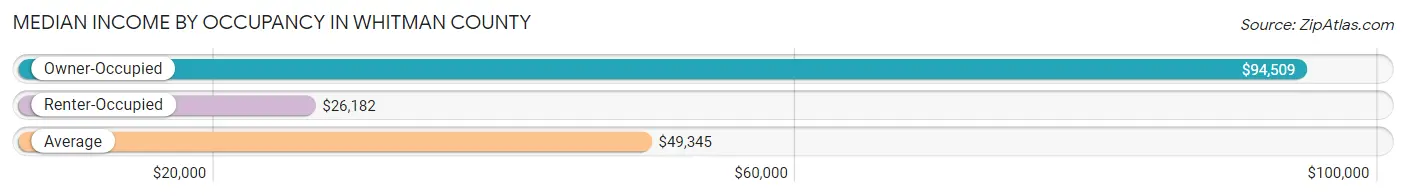
| Occupancy Type | # Households | Median Income |
| Owner-Occupied | 8,123 (45.2%) | $94,509 |
| Renter-Occupied | 9,840 (54.8%) | $26,182 |
| Average | 17,963 (100.0%) | $49,345 |
Occupancy by Householder Income Bracket in Whitman County
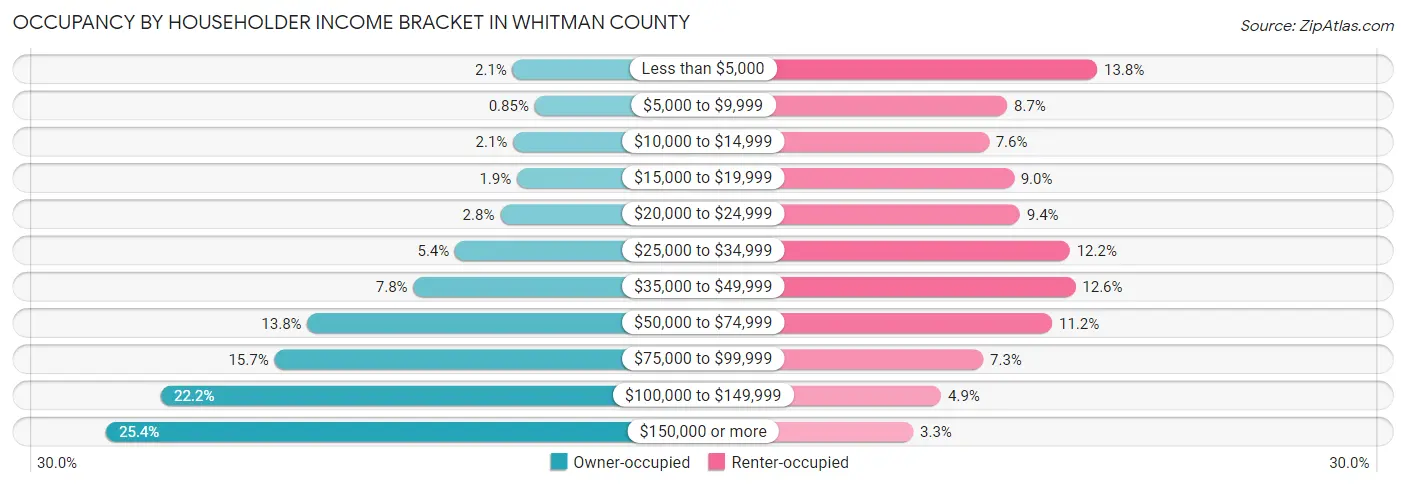
| Income Bracket | Owner-occupied | Renter-occupied |
| Less than $5,000 | 171 (2.1%) | 1,358 (13.8%) |
| $5,000 to $9,999 | 69 (0.9%) | 852 (8.7%) |
| $10,000 to $14,999 | 169 (2.1%) | 749 (7.6%) |
| $15,000 to $19,999 | 151 (1.9%) | 890 (9.0%) |
| $20,000 to $24,999 | 229 (2.8%) | 924 (9.4%) |
| $25,000 to $34,999 | 439 (5.4%) | 1,204 (12.2%) |
| $35,000 to $49,999 | 632 (7.8%) | 1,236 (12.6%) |
| $50,000 to $74,999 | 1,124 (13.8%) | 1,105 (11.2%) |
| $75,000 to $99,999 | 1,277 (15.7%) | 717 (7.3%) |
| $100,000 to $149,999 | 1,803 (22.2%) | 481 (4.9%) |
| $150,000 or more | 2,059 (25.4%) | 324 (3.3%) |
| Total | 8,123 (100.0%) | 9,840 (100.0%) |
Monthly Housing Cost Tiers in Whitman County
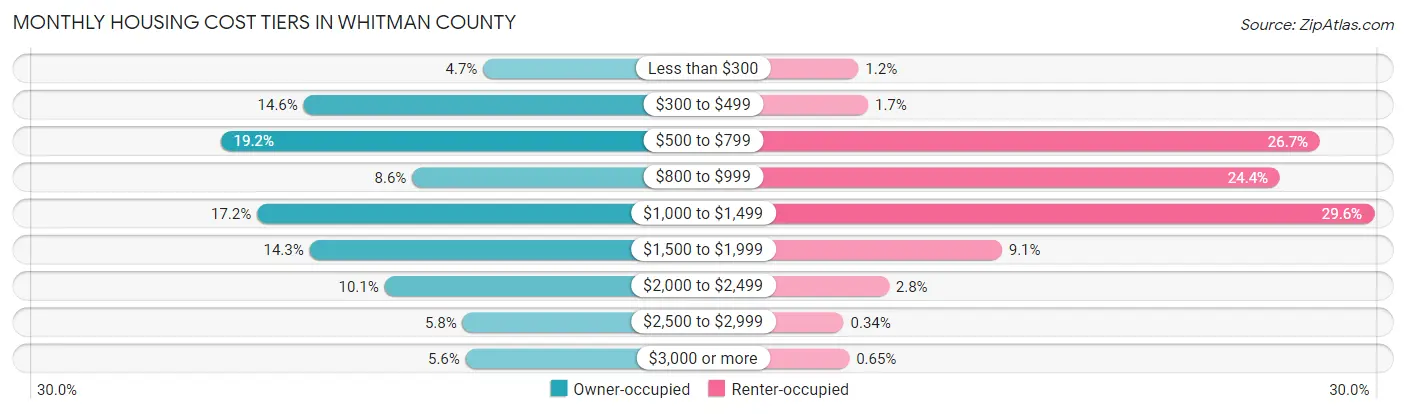
| Monthly Cost | Owner-occupied | Renter-occupied |
| Less than $300 | 379 (4.7%) | 114 (1.2%) |
| $300 to $499 | 1,185 (14.6%) | 166 (1.7%) |
| $500 to $799 | 1,557 (19.2%) | 2,622 (26.7%) |
| $800 to $999 | 698 (8.6%) | 2,405 (24.4%) |
| $1,000 to $1,499 | 1,394 (17.2%) | 2,916 (29.6%) |
| $1,500 to $1,999 | 1,158 (14.3%) | 893 (9.1%) |
| $2,000 to $2,499 | 822 (10.1%) | 279 (2.8%) |
| $2,500 to $2,999 | 472 (5.8%) | 33 (0.3%) |
| $3,000 or more | 458 (5.6%) | 64 (0.6%) |
| Total | 8,123 (100.0%) | 9,840 (100.0%) |
Physical Housing Characteristics in Whitman County
Housing Structures in Whitman County
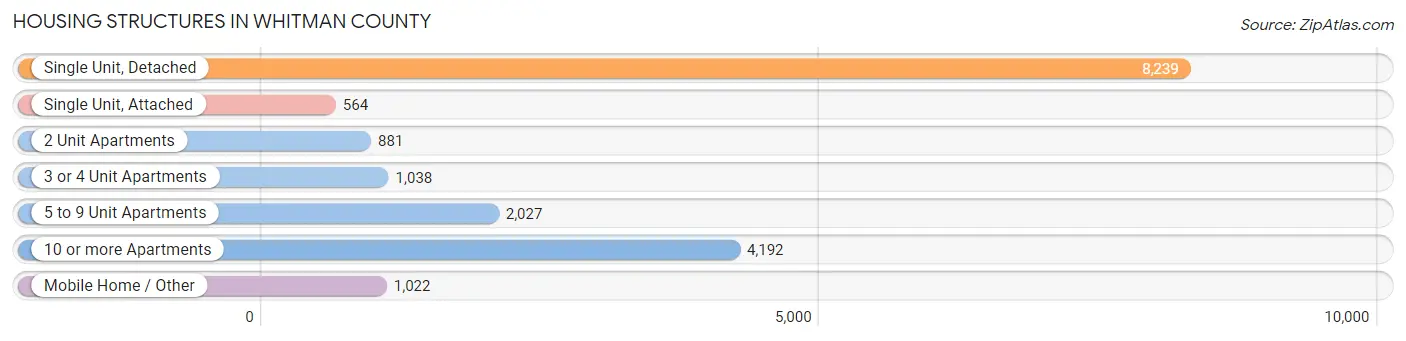
| Structure Type | # Housing Units | % Housing Units |
| Single Unit, Detached | 8,239 | 45.9% |
| Single Unit, Attached | 564 | 3.1% |
| 2 Unit Apartments | 881 | 4.9% |
| 3 or 4 Unit Apartments | 1,038 | 5.8% |
| 5 to 9 Unit Apartments | 2,027 | 11.3% |
| 10 or more Apartments | 4,192 | 23.3% |
| Mobile Home / Other | 1,022 | 5.7% |
| Total | 17,963 | 100.0% |
Housing Structures by Occupancy in Whitman County
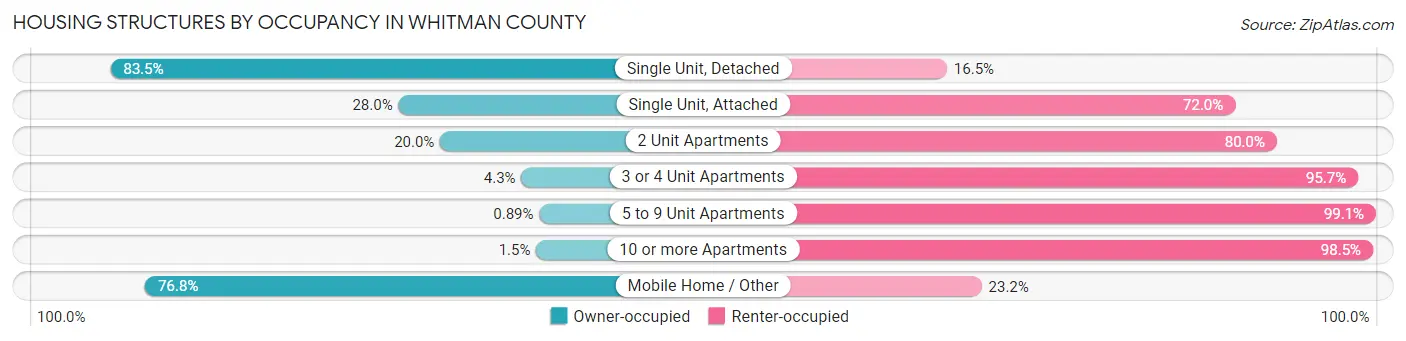
| Structure Type | Owner-occupied | Renter-occupied |
| Single Unit, Detached | 6,879 (83.5%) | 1,360 (16.5%) |
| Single Unit, Attached | 158 (28.0%) | 406 (72.0%) |
| 2 Unit Apartments | 176 (20.0%) | 705 (80.0%) |
| 3 or 4 Unit Apartments | 45 (4.3%) | 993 (95.7%) |
| 5 to 9 Unit Apartments | 18 (0.9%) | 2,009 (99.1%) |
| 10 or more Apartments | 62 (1.5%) | 4,130 (98.5%) |
| Mobile Home / Other | 785 (76.8%) | 237 (23.2%) |
| Total | 8,123 (45.2%) | 9,840 (54.8%) |
Housing Structures by Number of Rooms in Whitman County
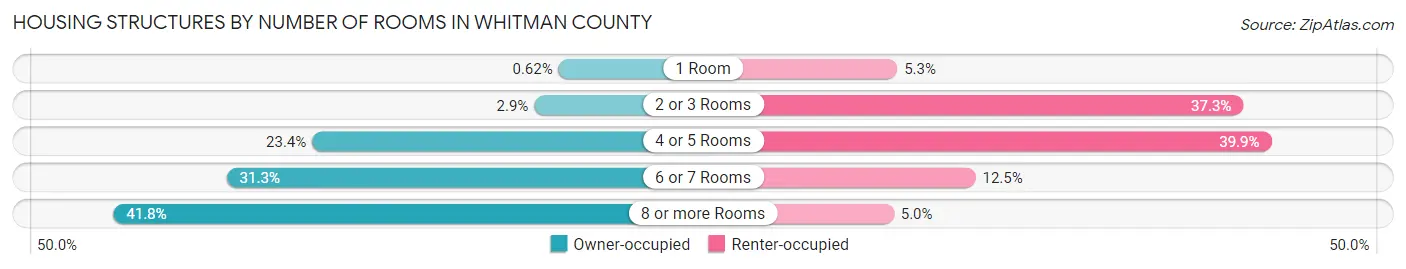
| Number of Rooms | Owner-occupied | Renter-occupied |
| 1 Room | 50 (0.6%) | 522 (5.3%) |
| 2 or 3 Rooms | 233 (2.9%) | 3,669 (37.3%) |
| 4 or 5 Rooms | 1,902 (23.4%) | 3,925 (39.9%) |
| 6 or 7 Rooms | 2,543 (31.3%) | 1,234 (12.5%) |
| 8 or more Rooms | 3,395 (41.8%) | 490 (5.0%) |
| Total | 8,123 (100.0%) | 9,840 (100.0%) |
Housing Structure by Heating Type in Whitman County
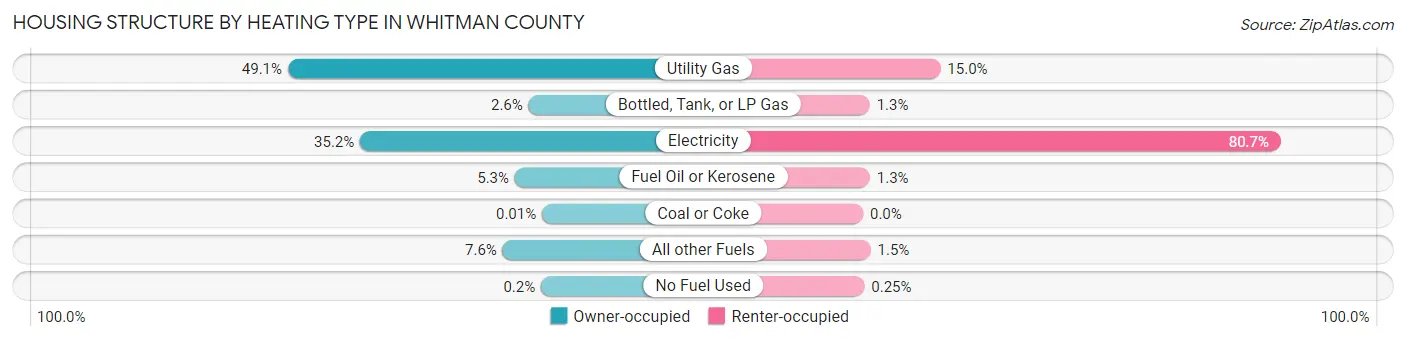
| Heating Type | Owner-occupied | Renter-occupied |
| Utility Gas | 3,991 (49.1%) | 1,471 (14.9%) |
| Bottled, Tank, or LP Gas | 212 (2.6%) | 127 (1.3%) |
| Electricity | 2,857 (35.2%) | 7,943 (80.7%) |
| Fuel Oil or Kerosene | 427 (5.3%) | 130 (1.3%) |
| Coal or Coke | 1 (0.0%) | 0 (0.0%) |
| All other Fuels | 619 (7.6%) | 144 (1.5%) |
| No Fuel Used | 16 (0.2%) | 25 (0.3%) |
| Total | 8,123 (100.0%) | 9,840 (100.0%) |
Household Vehicle Usage in Whitman County
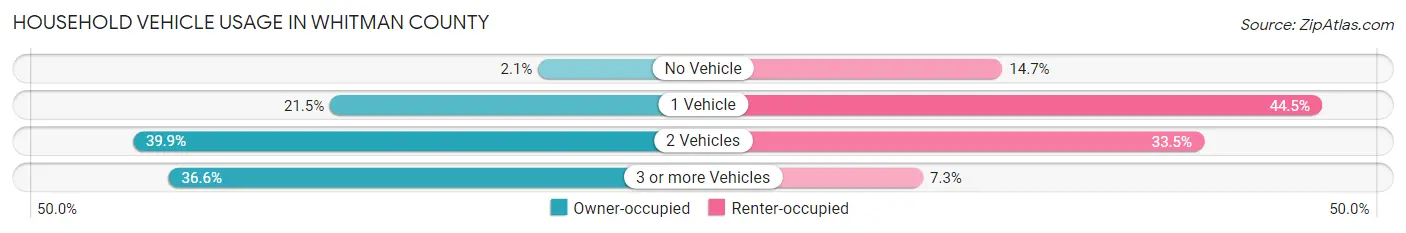
| Vehicles per Household | Owner-occupied | Renter-occupied |
| No Vehicle | 167 (2.1%) | 1,446 (14.7%) |
| 1 Vehicle | 1,746 (21.5%) | 4,380 (44.5%) |
| 2 Vehicles | 3,241 (39.9%) | 3,296 (33.5%) |
| 3 or more Vehicles | 2,969 (36.5%) | 718 (7.3%) |
| Total | 8,123 (100.0%) | 9,840 (100.0%) |
Real Estate & Mortgages in Whitman County
Real Estate and Mortgage Overview in Whitman County
| Characteristic | Without Mortgage | With Mortgage |
| Housing Units | 3,370 | 4,753 |
| Median Property Value | $250,200 | $326,400 |
| Median Household Income | $73,854 | $1,440 |
| Monthly Housing Costs | $539 | $456 |
| Real Estate Taxes | $2,228 | $103 |
Property Value by Mortgage Status in Whitman County

| Property Value | Without Mortgage | With Mortgage |
| Less than $50,000 | 396 (11.7%) | 95 (2.0%) |
| $50,000 to $99,999 | 391 (11.6%) | 243 (5.1%) |
| $100,000 to $299,999 | 1,193 (35.4%) | 1,765 (37.1%) |
| $300,000 to $499,999 | 836 (24.8%) | 1,898 (39.9%) |
| $500,000 to $749,999 | 419 (12.4%) | 651 (13.7%) |
| $750,000 to $999,999 | 97 (2.9%) | 59 (1.2%) |
| $1,000,000 or more | 38 (1.1%) | 42 (0.9%) |
| Total | 3,370 (100.0%) | 4,753 (100.0%) |
Household Income by Mortgage Status in Whitman County
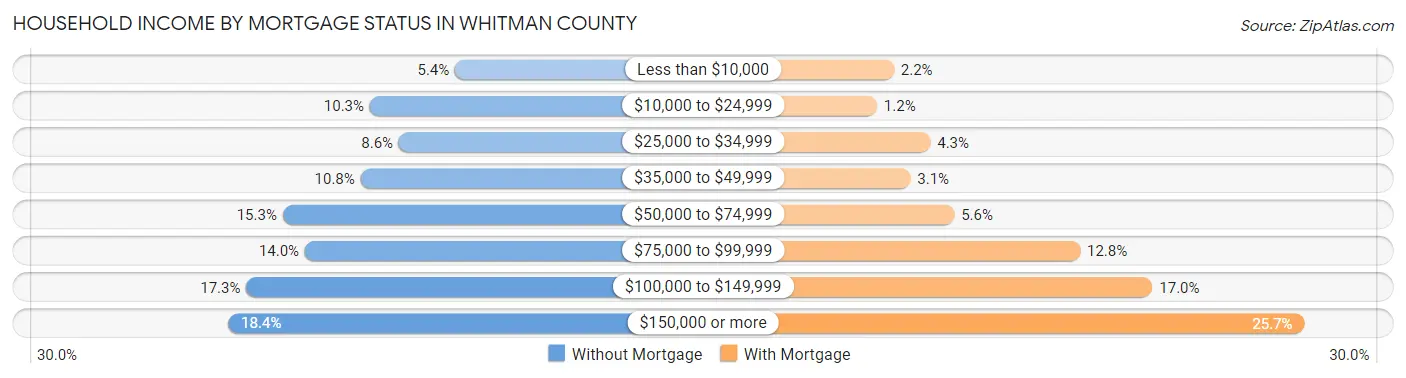
| Household Income | Without Mortgage | With Mortgage |
| Less than $10,000 | 182 (5.4%) | 104 (2.2%) |
| $10,000 to $24,999 | 346 (10.3%) | 58 (1.2%) |
| $25,000 to $34,999 | 290 (8.6%) | 203 (4.3%) |
| $35,000 to $49,999 | 364 (10.8%) | 149 (3.1%) |
| $50,000 to $74,999 | 514 (15.2%) | 268 (5.6%) |
| $75,000 to $99,999 | 471 (14.0%) | 610 (12.8%) |
| $100,000 to $149,999 | 584 (17.3%) | 806 (17.0%) |
| $150,000 or more | 619 (18.4%) | 1,219 (25.7%) |
| Total | 3,370 (100.0%) | 4,753 (100.0%) |
Property Value to Household Income Ratio in Whitman County
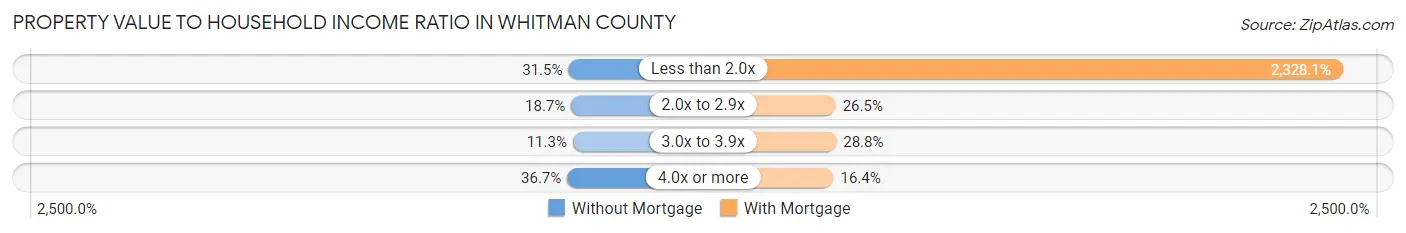
| Value-to-Income Ratio | Without Mortgage | With Mortgage |
| Less than 2.0x | 1,063 (31.5%) | 110,654 (2,328.1%) |
| 2.0x to 2.9x | 631 (18.7%) | 1,258 (26.5%) |
| 3.0x to 3.9x | 379 (11.3%) | 1,369 (28.8%) |
| 4.0x or more | 1,238 (36.7%) | 777 (16.4%) |
| Total | 3,370 (100.0%) | 4,753 (100.0%) |
Real Estate Taxes by Mortgage Status in Whitman County
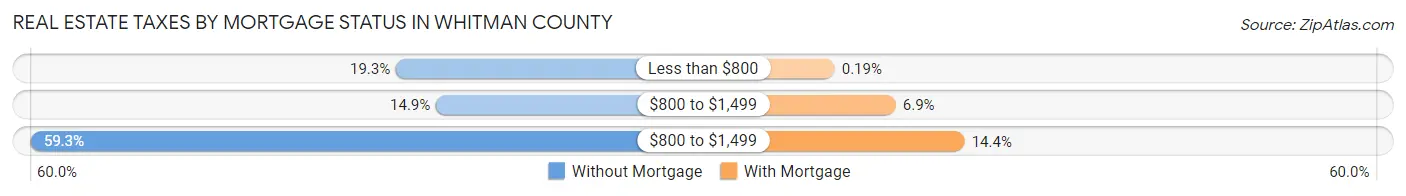
| Property Taxes | Without Mortgage | With Mortgage |
| Less than $800 | 650 (19.3%) | 9 (0.2%) |
| $800 to $1,499 | 502 (14.9%) | 327 (6.9%) |
| $800 to $1,499 | 1,999 (59.3%) | 686 (14.4%) |
| Total | 3,370 (100.0%) | 4,753 (100.0%) |
Health & Disability in Whitman County
Health Insurance Coverage by Age in Whitman County
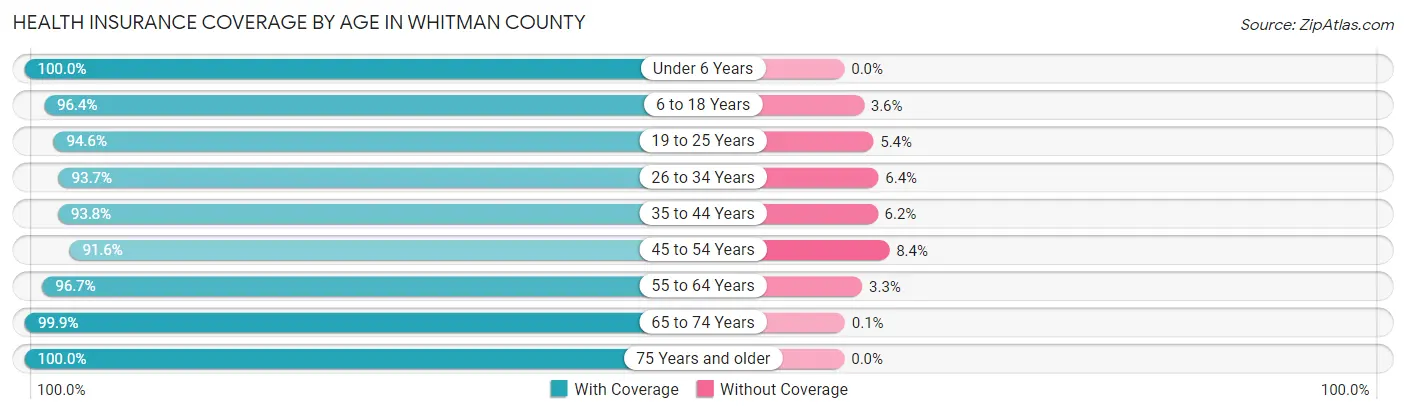
| Age Bracket | With Coverage | Without Coverage |
| Under 6 Years | 2,285 (100.0%) | 0 (0.0%) |
| 6 to 18 Years | 6,657 (96.4%) | 251 (3.6%) |
| 19 to 25 Years | 13,522 (94.6%) | 774 (5.4%) |
| 26 to 34 Years | 5,617 (93.6%) | 381 (6.4%) |
| 35 to 44 Years | 4,286 (93.8%) | 284 (6.2%) |
| 45 to 54 Years | 3,208 (91.6%) | 293 (8.4%) |
| 55 to 64 Years | 3,899 (96.7%) | 134 (3.3%) |
| 65 to 74 Years | 3,073 (99.9%) | 3 (0.1%) |
| 75 Years and older | 2,146 (100.0%) | 0 (0.0%) |
| Total | 44,693 (95.5%) | 2,120 (4.5%) |
Health Insurance Coverage by Citizenship Status in Whitman County
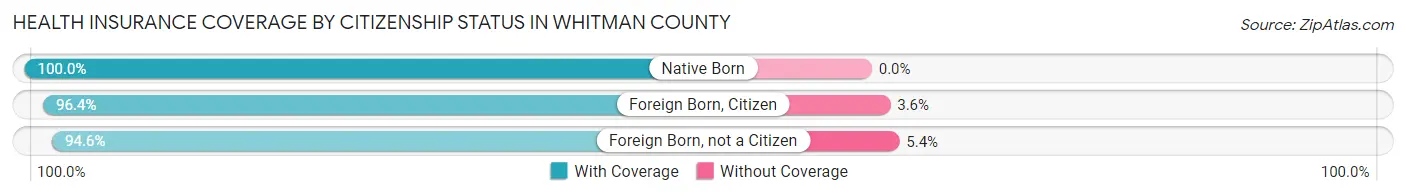
| Citizenship Status | With Coverage | Without Coverage |
| Native Born | 2,285 (100.0%) | 0 (0.0%) |
| Foreign Born, Citizen | 6,657 (96.4%) | 251 (3.6%) |
| Foreign Born, not a Citizen | 13,522 (94.6%) | 774 (5.4%) |
Health Insurance Coverage by Household Income in Whitman County
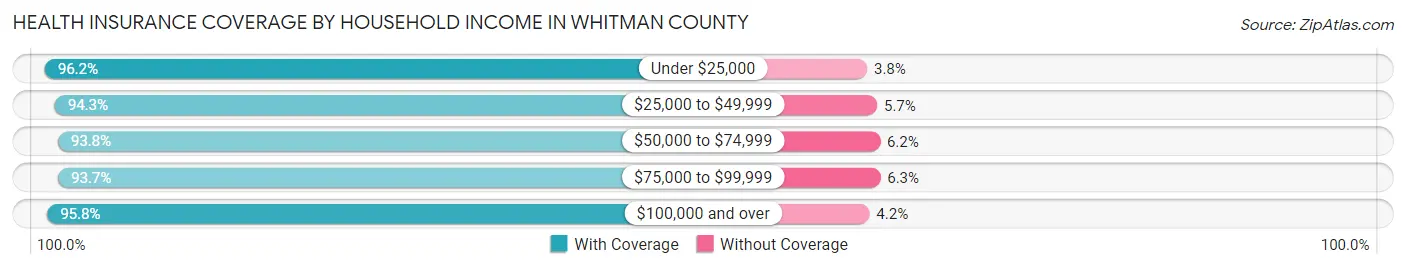
| Household Income | With Coverage | Without Coverage |
| Under $25,000 | 8,981 (96.2%) | 354 (3.8%) |
| $25,000 to $49,999 | 6,760 (94.3%) | 406 (5.7%) |
| $50,000 to $74,999 | 4,676 (93.8%) | 310 (6.2%) |
| $75,000 to $99,999 | 4,930 (93.7%) | 330 (6.3%) |
| $100,000 and over | 13,594 (95.8%) | 602 (4.2%) |
Public vs Private Health Insurance Coverage by Age in Whitman County
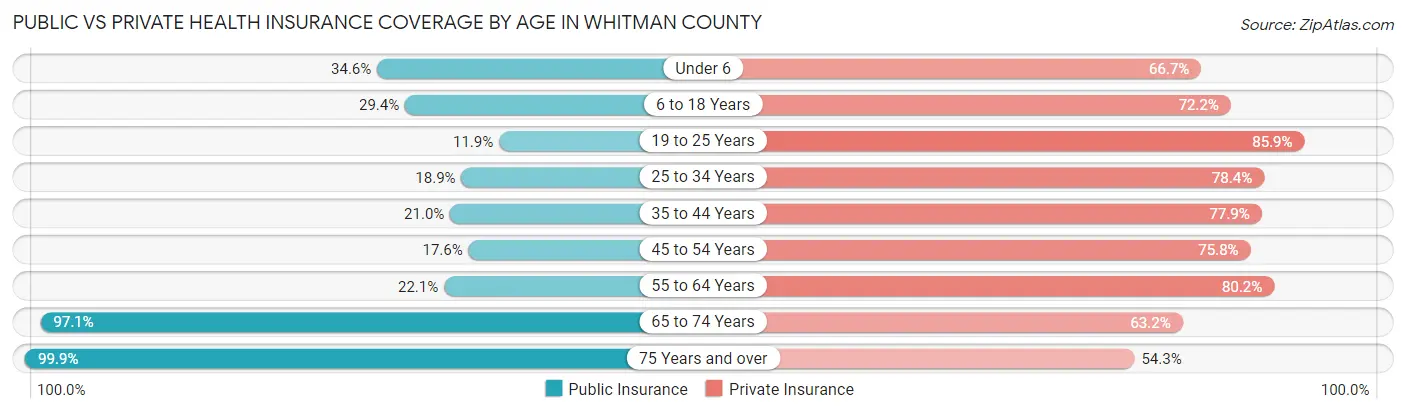
| Age Bracket | Public Insurance | Private Insurance |
| Under 6 | 790 (34.6%) | 1,524 (66.7%) |
| 6 to 18 Years | 2,030 (29.4%) | 4,986 (72.2%) |
| 19 to 25 Years | 1,705 (11.9%) | 12,273 (85.9%) |
| 25 to 34 Years | 1,135 (18.9%) | 4,700 (78.4%) |
| 35 to 44 Years | 960 (21.0%) | 3,561 (77.9%) |
| 45 to 54 Years | 616 (17.6%) | 2,655 (75.8%) |
| 55 to 64 Years | 893 (22.1%) | 3,236 (80.2%) |
| 65 to 74 Years | 2,986 (97.1%) | 1,945 (63.2%) |
| 75 Years and over | 2,144 (99.9%) | 1,166 (54.3%) |
| Total | 13,259 (28.3%) | 36,046 (77.0%) |
Disability Status by Sex by Age in Whitman County
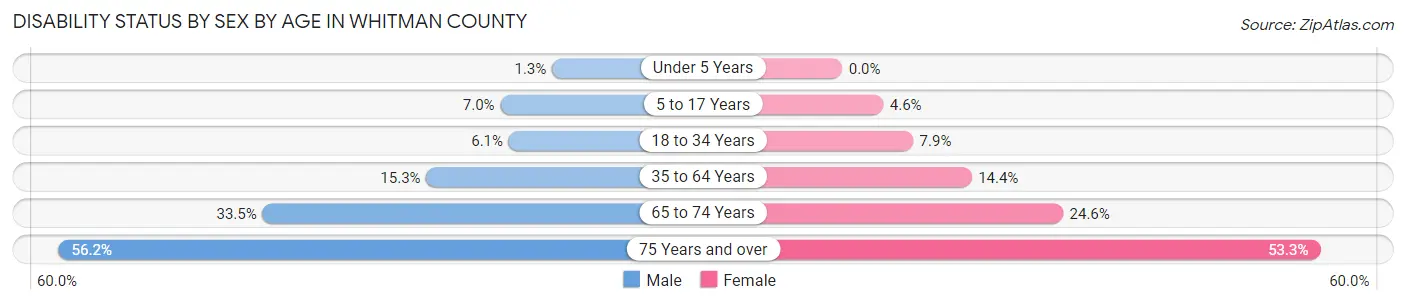
| Age Bracket | Male | Female |
| Under 5 Years | 12 (1.3%) | 0 (0.0%) |
| 5 to 17 Years | 184 (7.0%) | 121 (4.6%) |
| 18 to 34 Years | 701 (6.1%) | 846 (7.9%) |
| 35 to 64 Years | 938 (15.2%) | 858 (14.4%) |
| 65 to 74 Years | 521 (33.5%) | 374 (24.6%) |
| 75 Years and over | 512 (56.2%) | 658 (53.3%) |
Disability Class by Sex by Age in Whitman County
Disability Class: Hearing Difficulty
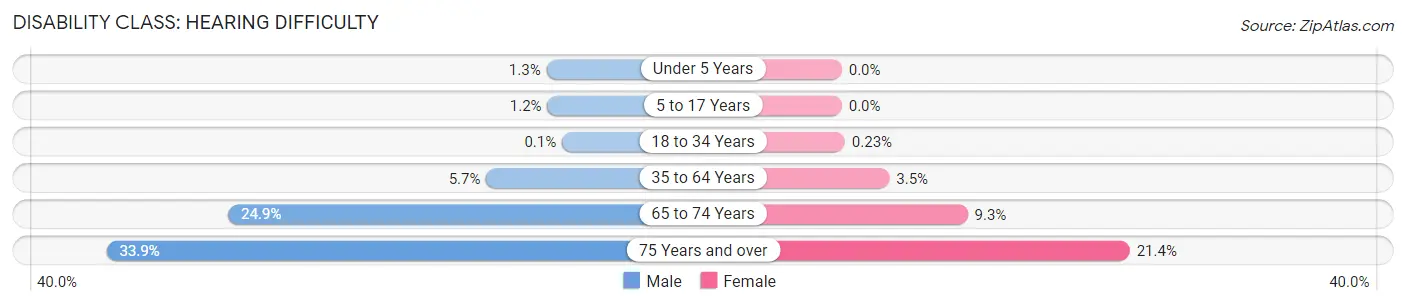
| Age Bracket | Male | Female |
| Under 5 Years | 12 (1.3%) | 0 (0.0%) |
| 5 to 17 Years | 31 (1.2%) | 0 (0.0%) |
| 18 to 34 Years | 12 (0.1%) | 25 (0.2%) |
| 35 to 64 Years | 352 (5.7%) | 210 (3.5%) |
| 65 to 74 Years | 387 (24.9%) | 142 (9.3%) |
| 75 Years and over | 309 (33.9%) | 264 (21.4%) |
Disability Class: Vision Difficulty
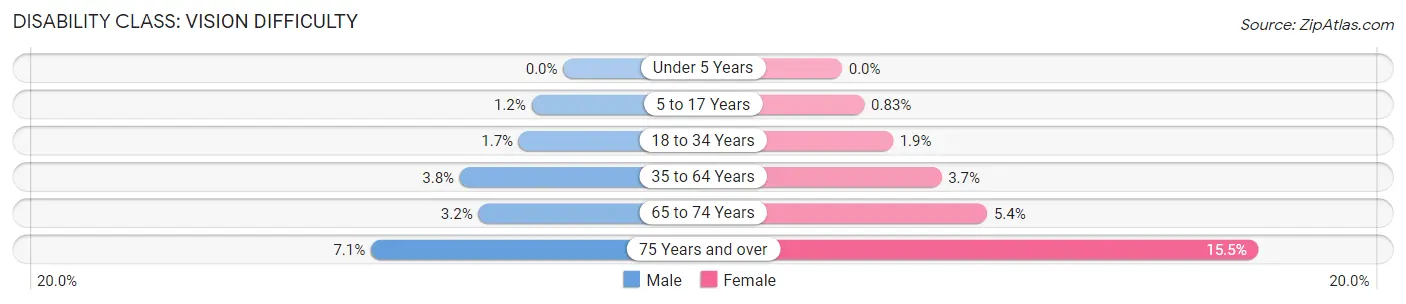
| Age Bracket | Male | Female |
| Under 5 Years | 0 (0.0%) | 0 (0.0%) |
| 5 to 17 Years | 31 (1.2%) | 22 (0.8%) |
| 18 to 34 Years | 191 (1.7%) | 203 (1.9%) |
| 35 to 64 Years | 236 (3.8%) | 220 (3.7%) |
| 65 to 74 Years | 49 (3.2%) | 82 (5.4%) |
| 75 Years and over | 65 (7.1%) | 191 (15.5%) |
Disability Class: Cognitive Difficulty
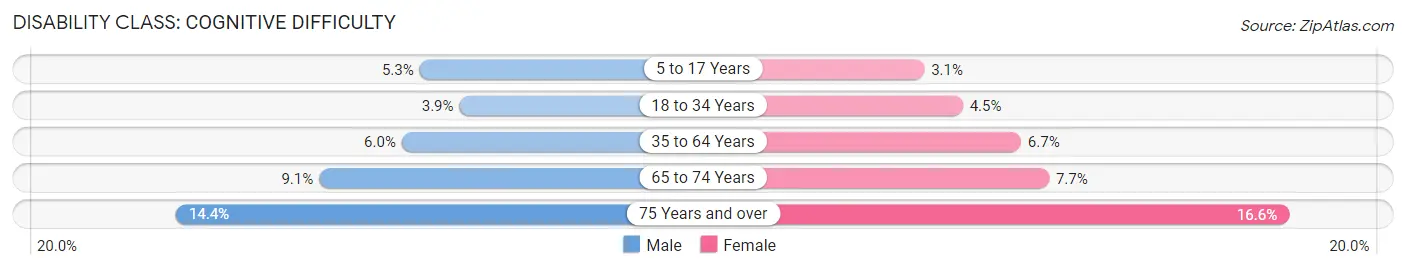
| Age Bracket | Male | Female |
| 5 to 17 Years | 140 (5.3%) | 81 (3.1%) |
| 18 to 34 Years | 446 (3.9%) | 481 (4.5%) |
| 35 to 64 Years | 369 (6.0%) | 396 (6.7%) |
| 65 to 74 Years | 141 (9.1%) | 117 (7.7%) |
| 75 Years and over | 131 (14.4%) | 205 (16.6%) |
Disability Class: Ambulatory Difficulty
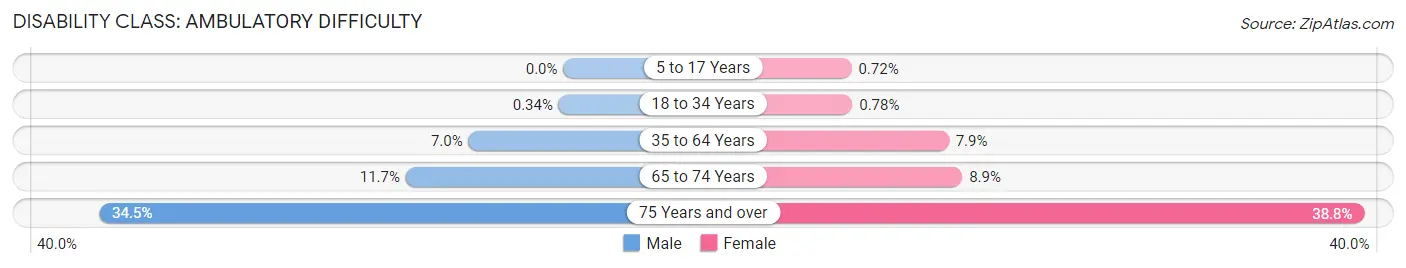
| Age Bracket | Male | Female |
| 5 to 17 Years | 0 (0.0%) | 19 (0.7%) |
| 18 to 34 Years | 39 (0.3%) | 84 (0.8%) |
| 35 to 64 Years | 433 (7.0%) | 473 (7.9%) |
| 65 to 74 Years | 182 (11.7%) | 136 (8.9%) |
| 75 Years and over | 314 (34.5%) | 479 (38.8%) |
Disability Class: Self-Care Difficulty
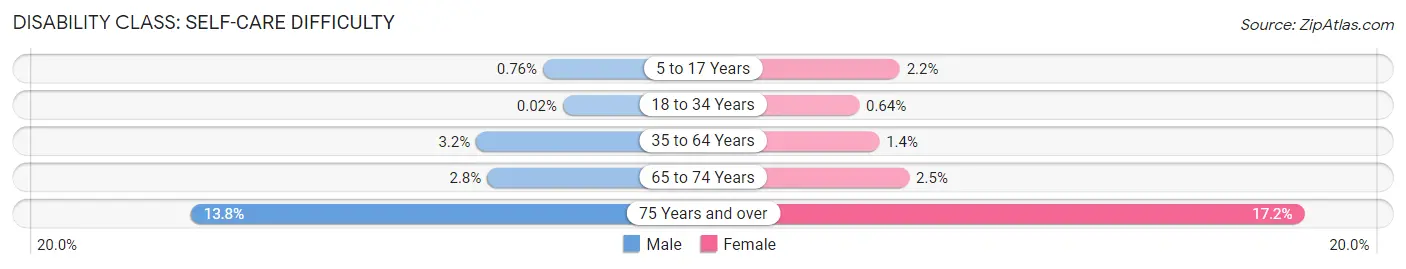
| Age Bracket | Male | Female |
| 5 to 17 Years | 20 (0.8%) | 57 (2.1%) |
| 18 to 34 Years | 2 (0.0%) | 69 (0.6%) |
| 35 to 64 Years | 199 (3.2%) | 83 (1.4%) |
| 65 to 74 Years | 44 (2.8%) | 38 (2.5%) |
| 75 Years and over | 126 (13.8%) | 212 (17.2%) |
Technology Access in Whitman County
Computing Device Access in Whitman County
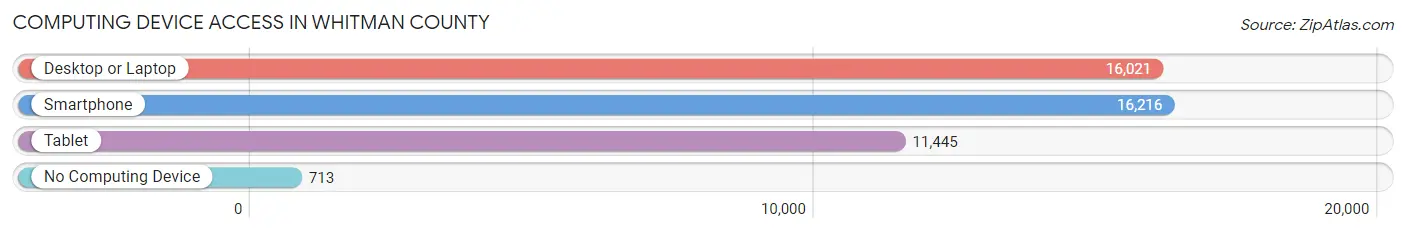
| Device Type | # Households | % Households |
| Desktop or Laptop | 16,021 | 89.2% |
| Smartphone | 16,216 | 90.3% |
| Tablet | 11,445 | 63.7% |
| No Computing Device | 713 | 4.0% |
| Total | 17,963 | 100.0% |
Internet Access in Whitman County
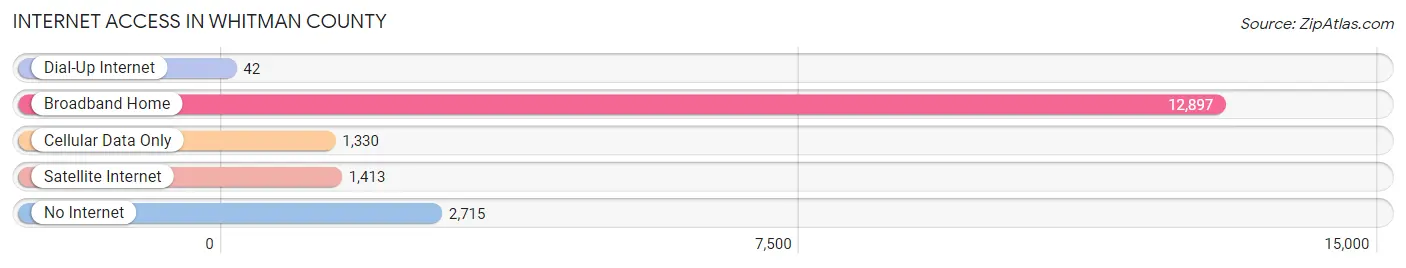
| Internet Type | # Households | % Households |
| Dial-Up Internet | 42 | 0.2% |
| Broadband Home | 12,897 | 71.8% |
| Cellular Data Only | 1,330 | 7.4% |
| Satellite Internet | 1,413 | 7.9% |
| No Internet | 2,715 | 15.1% |
| Total | 17,963 | 100.0% |
Whitman County Summary
Whitman County is located in the southeastern corner of Washington State, bordered by Idaho to the east and Oregon to the south. It is part of the Palouse region, a rolling, fertile landscape of wheat fields and small towns. The county seat is Colfax, and the largest city is Pullman. The county was named after Marcus Whitman, a missionary who was killed in 1847.
History
The area that is now Whitman County was originally inhabited by the Palouse Indians, a tribe of the Nez Perce. The first white settlers arrived in the area in the late 1840s, and the county was officially established in 1871. The county was named after Marcus Whitman, a missionary who was killed in 1847.
The county was largely agricultural, with wheat and other grains being the main crops. The county also had a thriving timber industry, and several sawmills were built in the area. The county was also home to several mining operations, including gold, silver, and copper.
In the late 19th century, the county was home to several railroads, including the Northern Pacific and the Union Pacific. The railroads helped to spur economic growth in the area, and the county's population grew rapidly.
Geography
Whitman County covers an area of 2,541 square miles, making it the second-largest county in Washington State. The county is located in the southeastern corner of the state, bordered by Idaho to the east and Oregon to the south. The county is part of the Palouse region, a rolling, fertile landscape of wheat fields and small towns. The county seat is Colfax, and the largest city is Pullman.
The county is home to several rivers, including the Snake, Palouse, and Clearwater. The county also has several lakes, including Lake Bryan, Lake Sacajawea, and Lake Wallula. The county is also home to several wildlife refuges, including the Turnbull National Wildlife Refuge and the Umatilla National Wildlife Refuge.
Economy
Agriculture is the main economic driver in Whitman County. Wheat and other grains are the main crops, and the county is also home to several dairy farms. The county is also home to several food processing plants, including a potato processing plant and a canning plant.
The county is also home to several manufacturing companies, including a paper mill and a furniture factory. The county is also home to several technology companies, including a software company and a semiconductor manufacturer.
Demographics
As of the 2010 census, the population of Whitman County was 44,776. The population is predominantly white (90.2%), with small percentages of Hispanic (3.7%), Asian (2.2%), and African American (1.2%) residents. The median household income is $45,837, and the median home value is $164,400.
The county is home to several colleges and universities, including Washington State University, Whitman College, and the University of Idaho. The county is also home to several museums, including the Whitman County Historical Museum and the Palouse Discovery Science Center.
Conclusion
Whitman County is a rural county located in the southeastern corner of Washington State. The county is part of the Palouse region, a rolling, fertile landscape of wheat fields and small towns. The county is largely agricultural, with wheat and other grains being the main crops. The county is also home to several manufacturing companies, technology companies, and colleges and universities. The population of the county is predominantly white, with small percentages of Hispanic, Asian, and African American residents.
Common Questions
What is the Total Population of Whitman County?
Total Population of Whitman County is 47,141.
What is the Total Male Population of Whitman County?
Total Male Population of Whitman County is 23,954.
What is the Total Female Population of Whitman County?
Total Female Population of Whitman County is 23,187.
What is the Ratio of Males per 100 Females in Whitman County?
There are 103.31 Males per 100 Females in Whitman County.
What is the Ratio of Females per 100 Males in Whitman County?
There are 96.80 Females per 100 Males in Whitman County.
What is the Median Population Age in Whitman County?
Median Population Age in Whitman County is 26.0 Years.
What is the Average Family Size in Whitman County
Average Family Size in Whitman County is 2.9 People.
What is the Average Household Size in Whitman County
Average Household Size in Whitman County is 2.3 People.
What is Per Capita Income in Whitman County?
Per Capita income in Whitman County is $30,287.
What is the Median Family Income in Whitman County?
Median Family Income in Whitman County is $87,926.
What is the Median Household income in Whitman County?
Median Household Income in Whitman County is $49,345.
What is Income or Wage Gap in Whitman County?
Income or Wage Gap in Whitman County is 43.4%.
Women in Whitman County earn 56.6 cents for every dollar earned by a man.
What is Family Income Deficit in Whitman County?
Family Income Deficit in Whitman County is $11,658.
Families that are below poverty line in Whitman County earn $11,658 less on average than the poverty threshold level.
What is Inequality or Gini Index in Whitman County?
Inequality or Gini Index in Whitman County is 0.53.
How Large is the Labor Force in Whitman County?
There are 24,605 People in the Labor Forcein in Whitman County.
What is the Percentage of People in the Labor Force in Whitman County?
60.5% of People are in the Labor Force in Whitman County.
What is the Unemployment Rate in Whitman County?
Unemployment Rate in Whitman County is 6.7%.