Walla Walla County, WA
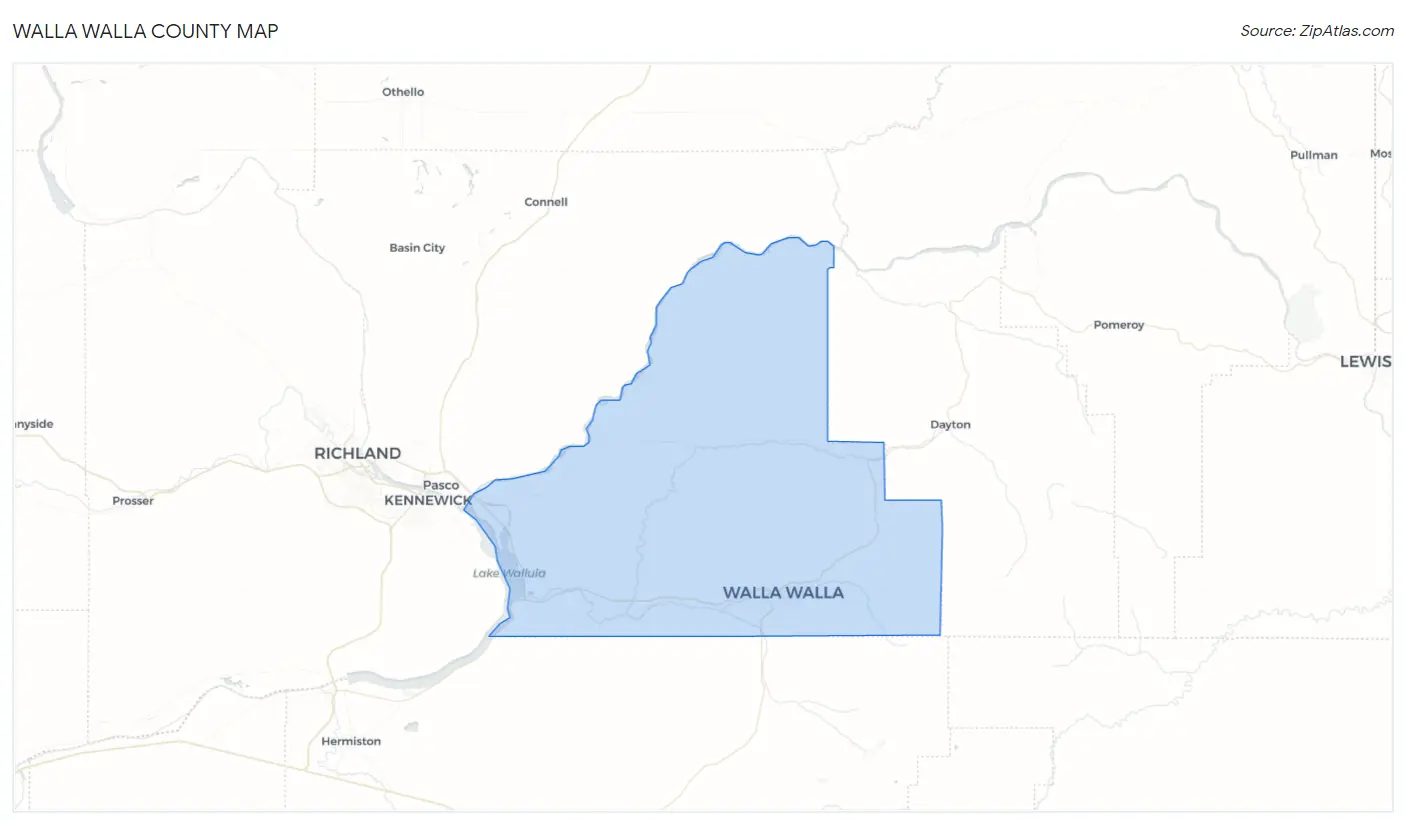
Walla Walla County Map
Walla Walla County Overview
62,150
TOTAL POPULATION
31,276
MALE POPULATION
30,874
FEMALE POPULATION
101.30
MALES / 100 FEMALES
98.71
FEMALES / 100 MALES
38.0
MEDIAN AGE
3.1
AVG FAMILY SIZE
2.5
AVG HOUSEHOLD SIZE
$34,476
PER CAPITA INCOME
$84,932
AVG FAMILY INCOME
$66,635
AVG HOUSEHOLD INCOME
40.2%
WAGE / INCOME GAP [ % ]
59.8¢/ $1
WAGE / INCOME GAP [ $ ]
$8,080
FAMILY INCOME DEFICIT
0.46
INEQUALITY / GINI INDEX
29,277
LABOR FORCE [ PEOPLE ]
57.5%
PERCENT IN LABOR FORCE
5.8%
UNEMPLOYMENT RATE
Walla Walla County Area Codes
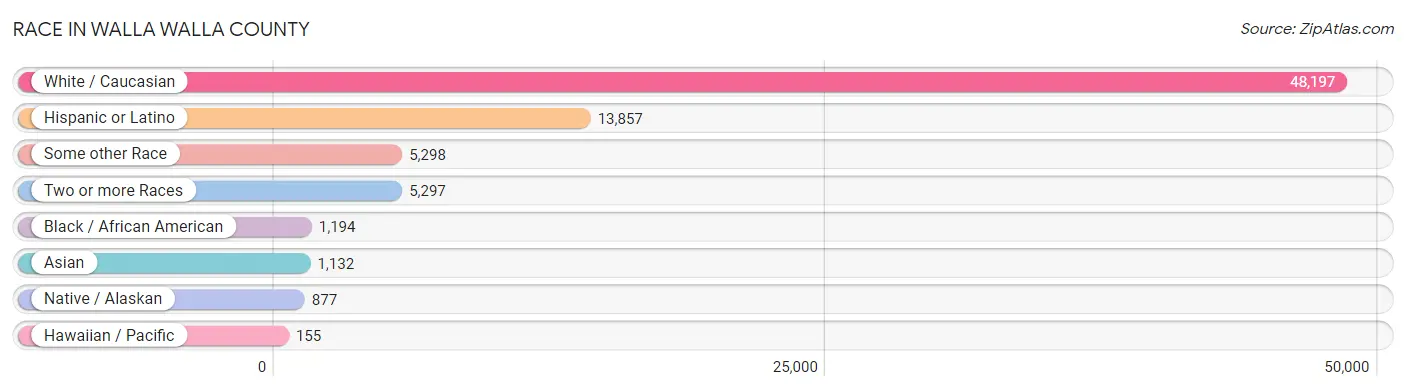
Race in Walla Walla County
The most populous races in Walla Walla County are White / Caucasian (48,197 | 77.5%), Hispanic or Latino (13,857 | 22.3%), and Some other Race (5,298 | 8.5%).
| Race | # Population | % Population |
| Asian | 1,132 | 1.8% |
| Black / African American | 1,194 | 1.9% |
| Hawaiian / Pacific | 155 | 0.3% |
| Hispanic or Latino | 13,857 | 22.3% |
| Native / Alaskan | 877 | 1.4% |
| White / Caucasian | 48,197 | 77.5% |
| Two or more Races | 5,297 | 8.5% |
| Some other Race | 5,298 | 8.5% |
| Total | 62,150 | 100.0% |
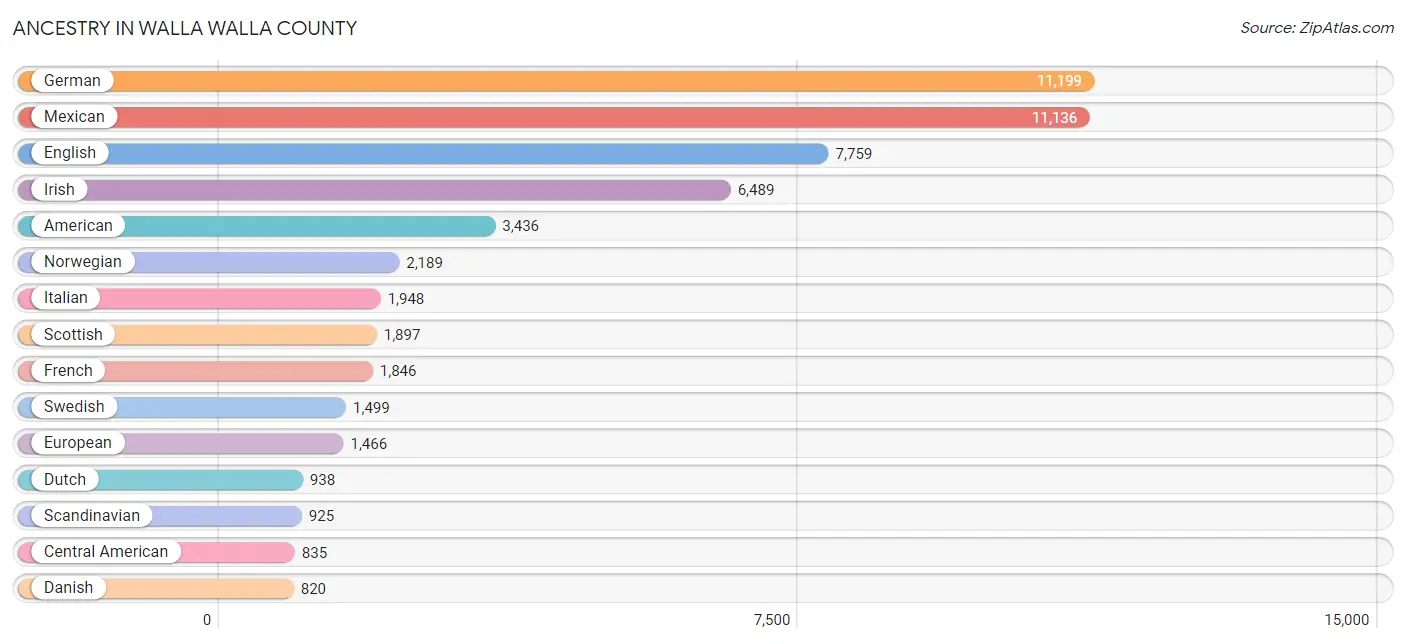
Ancestry in Walla Walla County
The most populous ancestries reported in Walla Walla County are German (11,199 | 18.0%), Mexican (11,136 | 17.9%), English (7,759 | 12.5%), Irish (6,489 | 10.4%), and American (3,436 | 5.5%), together accounting for 64.4% of all Walla Walla County residents.
| Ancestry | # Population | % Population |
| African | 48 | 0.1% |
| Alaska Native | 70 | 0.1% |
| Alaskan Athabascan | 19 | 0.0% |
| Aleut | 19 | 0.0% |
| American | 3,436 | 5.5% |
| Apache | 57 | 0.1% |
| Arab | 84 | 0.1% |
| Armenian | 30 | 0.1% |
| Australian | 59 | 0.1% |
| Austrian | 167 | 0.3% |
| Belgian | 19 | 0.0% |
| Bhutanese | 164 | 0.3% |
| Blackfeet | 96 | 0.2% |
| British | 338 | 0.5% |
| Bulgarian | 14 | 0.0% |
| Burmese | 158 | 0.3% |
| Canadian | 246 | 0.4% |
| Carpatho Rusyn | 6 | 0.0% |
| Celtic | 8 | 0.0% |
| Central American | 835 | 1.3% |
| Central American Indian | 473 | 0.8% |
| Cherokee | 523 | 0.8% |
| Chilean | 51 | 0.1% |
| Chippewa | 135 | 0.2% |
| Choctaw | 55 | 0.1% |
| Colombian | 165 | 0.3% |
| Comanche | 5 | 0.0% |
| Costa Rican | 152 | 0.2% |
| Croatian | 85 | 0.1% |
| Cuban | 52 | 0.1% |
| Czech | 68 | 0.1% |
| Czechoslovakian | 114 | 0.2% |
| Danish | 820 | 1.3% |
| Dominican | 79 | 0.1% |
| Dutch | 938 | 1.5% |
| Eastern European | 118 | 0.2% |
| Ecuadorian | 42 | 0.1% |
| Egyptian | 32 | 0.1% |
| English | 7,759 | 12.5% |
| Estonian | 13 | 0.0% |
| Ethiopian | 94 | 0.2% |
| European | 1,466 | 2.4% |
| Filipino | 101 | 0.2% |
| Finnish | 362 | 0.6% |
| French | 1,846 | 3.0% |
| French American Indian | 6 | 0.0% |
| French Canadian | 290 | 0.5% |
| German | 11,199 | 18.0% |
| Greek | 177 | 0.3% |
| Guamanian / Chamorro | 128 | 0.2% |
| Guatemalan | 114 | 0.2% |
| Guyanese | 10 | 0.0% |
| Haitian | 59 | 0.1% |
| Honduran | 44 | 0.1% |
| Hungarian | 137 | 0.2% |
| Indian (Asian) | 461 | 0.7% |
| Inupiat | 4 | 0.0% |
| Iranian | 19 | 0.0% |
| Iraqi | 7 | 0.0% |
| Irish | 6,489 | 10.4% |
| Iroquois | 22 | 0.0% |
| Israeli | 28 | 0.1% |
| Italian | 1,948 | 3.1% |
| Jamaican | 4 | 0.0% |
| Japanese | 9 | 0.0% |
| Kenyan | 4 | 0.0% |
| Korean | 427 | 0.7% |
| Laotian | 15 | 0.0% |
| Latvian | 6 | 0.0% |
| Lebanese | 22 | 0.0% |
| Liberian | 262 | 0.4% |
| Lithuanian | 65 | 0.1% |
| Luxembourger | 3 | 0.0% |
| Malaysian | 11 | 0.0% |
| Menominee | 5 | 0.0% |
| Mexican | 11,136 | 17.9% |
| Mexican American Indian | 87 | 0.1% |
| Native Hawaiian | 79 | 0.1% |
| New Zealander | 27 | 0.0% |
| Northern European | 130 | 0.2% |
| Norwegian | 2,189 | 3.5% |
| Paiute | 18 | 0.0% |
| Pakistani | 8 | 0.0% |
| Palestinian | 9 | 0.0% |
| Pennsylvania German | 39 | 0.1% |
| Peruvian | 131 | 0.2% |
| Polish | 591 | 0.9% |
| Portuguese | 215 | 0.4% |
| Potawatomi | 5 | 0.0% |
| Puerto Rican | 348 | 0.6% |
| Puget Sound Salish | 90 | 0.1% |
| Romanian | 1 | 0.0% |
| Russian | 707 | 1.1% |
| Salvadoran | 525 | 0.8% |
| Samoan | 70 | 0.1% |
| Scandinavian | 925 | 1.5% |
| Scotch-Irish | 572 | 0.9% |
| Scottish | 1,897 | 3.0% |
| Seminole | 14 | 0.0% |
| Sioux | 100 | 0.2% |
| Slavic | 36 | 0.1% |
| Slovak | 62 | 0.1% |
| South American | 392 | 0.6% |
| South American Indian | 10 | 0.0% |
| Spaniard | 316 | 0.5% |
| Spanish | 141 | 0.2% |
| Sri Lankan | 150 | 0.2% |
| Subsaharan African | 489 | 0.8% |
| Swedish | 1,499 | 2.4% |
| Swiss | 544 | 0.9% |
| Thai | 163 | 0.3% |
| Tlingit-Haida | 8 | 0.0% |
| Tsimshian | 18 | 0.0% |
| Turkish | 10 | 0.0% |
| U.S. Virgin Islander | 58 | 0.1% |
| Ugandan | 66 | 0.1% |
| Ukrainian | 308 | 0.5% |
| Venezuelan | 3 | 0.0% |
| Welsh | 669 | 1.1% |
| West Indian | 12 | 0.0% |
| Yakama | 9 | 0.0% |
| Yugoslavian | 52 | 0.1% | View All 122 Rows |
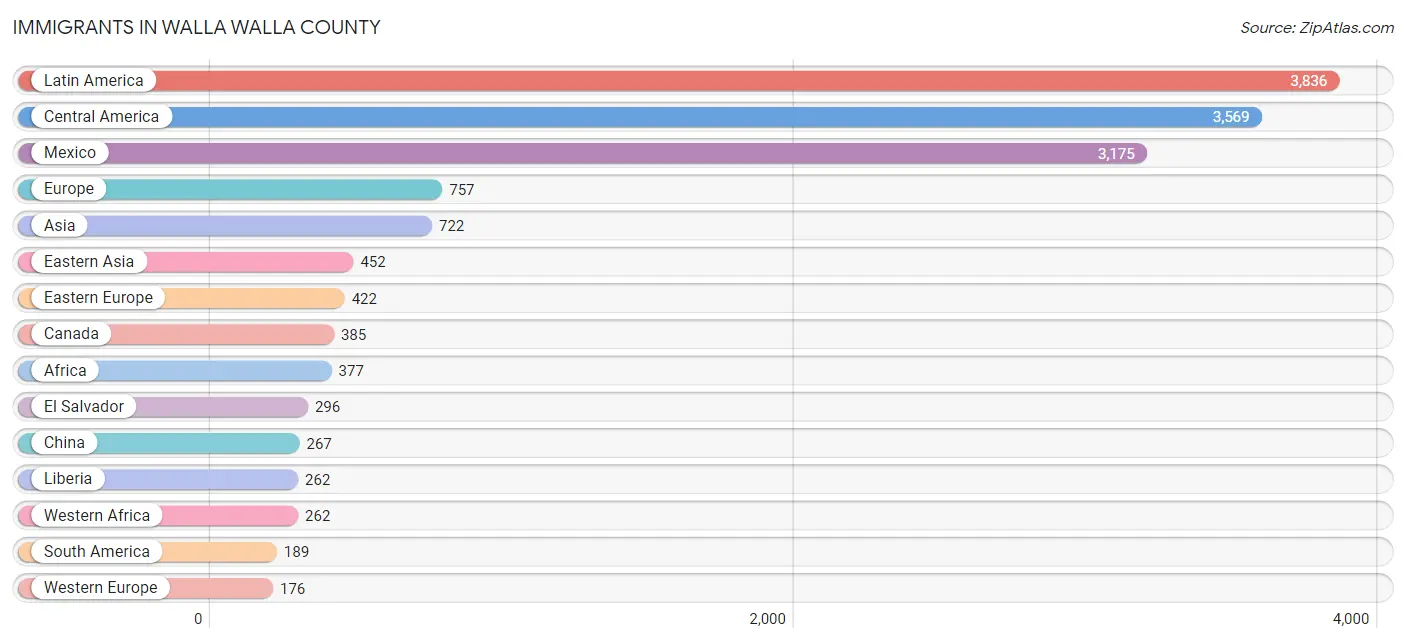
Immigrants in Walla Walla County
The most numerous immigrant groups reported in Walla Walla County came from Latin America (3,836 | 6.2%), Central America (3,569 | 5.7%), Mexico (3,175 | 5.1%), Europe (757 | 1.2%), and Asia (722 | 1.2%), together accounting for 19.4% of all Walla Walla County residents.
| Immigration Origin | # Population | % Population |
| Africa | 377 | 0.6% |
| Asia | 722 | 1.2% |
| Australia | 12 | 0.0% |
| Belarus | 8 | 0.0% |
| Bosnia and Herzegovina | 15 | 0.0% |
| Brazil | 13 | 0.0% |
| Canada | 385 | 0.6% |
| Caribbean | 78 | 0.1% |
| Central America | 3,569 | 5.7% |
| China | 267 | 0.4% |
| Colombia | 46 | 0.1% |
| Costa Rica | 31 | 0.1% |
| Dominican Republic | 46 | 0.1% |
| Eastern Africa | 106 | 0.2% |
| Eastern Asia | 452 | 0.7% |
| Eastern Europe | 422 | 0.7% |
| Ecuador | 19 | 0.0% |
| Egypt | 7 | 0.0% |
| El Salvador | 296 | 0.5% |
| England | 52 | 0.1% |
| Ethiopia | 89 | 0.1% |
| Europe | 757 | 1.2% |
| Fiji | 26 | 0.0% |
| France | 44 | 0.1% |
| Germany | 113 | 0.2% |
| Guatemala | 50 | 0.1% |
| Haiti | 32 | 0.1% |
| Honduras | 17 | 0.0% |
| Hong Kong | 13 | 0.0% |
| India | 87 | 0.1% |
| Indonesia | 9 | 0.0% |
| Iraq | 7 | 0.0% |
| Ireland | 15 | 0.0% |
| Israel | 11 | 0.0% |
| Italy | 73 | 0.1% |
| Japan | 67 | 0.1% |
| Kazakhstan | 7 | 0.0% |
| Korea | 118 | 0.2% |
| Latin America | 3,836 | 6.2% |
| Lebanon | 14 | 0.0% |
| Liberia | 262 | 0.4% |
| Mexico | 3,175 | 5.1% |
| Moldova | 5 | 0.0% |
| Nepal | 8 | 0.0% |
| Netherlands | 19 | 0.0% |
| Northern Africa | 7 | 0.0% |
| Northern Europe | 76 | 0.1% |
| Norway | 9 | 0.0% |
| Oceania | 140 | 0.2% |
| Pakistan | 10 | 0.0% |
| Peru | 102 | 0.2% |
| Philippines | 17 | 0.0% |
| Poland | 8 | 0.0% |
| Russia | 104 | 0.2% |
| Saudi Arabia | 9 | 0.0% |
| South Africa | 2 | 0.0% |
| South America | 189 | 0.3% |
| South Central Asia | 147 | 0.2% |
| South Eastern Asia | 76 | 0.1% |
| Southern Europe | 83 | 0.1% |
| Spain | 10 | 0.0% |
| Sri Lanka | 8 | 0.0% |
| Taiwan | 55 | 0.1% |
| Thailand | 13 | 0.0% |
| Ukraine | 3 | 0.0% |
| Uzbekistan | 17 | 0.0% |
| Venezuela | 9 | 0.0% |
| Vietnam | 37 | 0.1% |
| Western Africa | 262 | 0.4% |
| Western Asia | 47 | 0.1% |
| Western Europe | 176 | 0.3% | View All 71 Rows |
Sex and Age in Walla Walla County
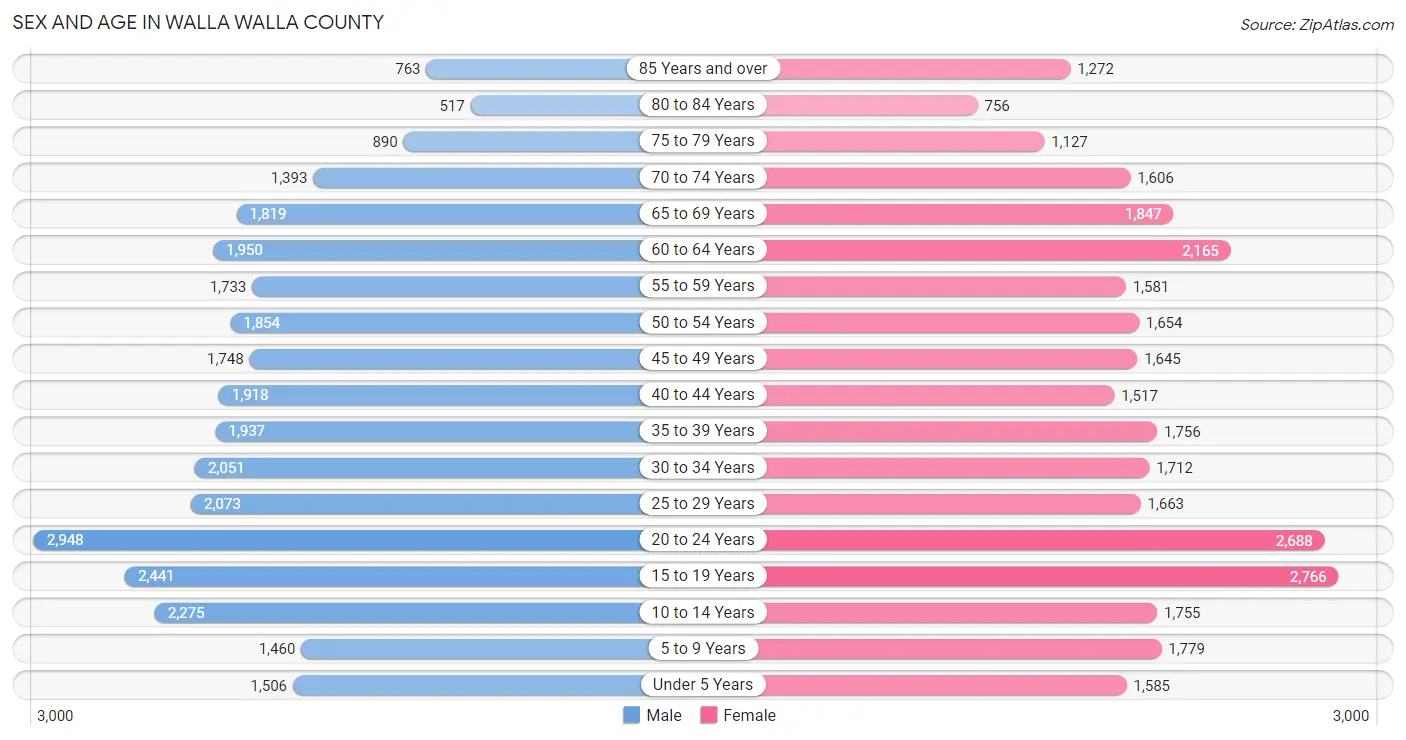
Sex and Age in Walla Walla County
The most populous age groups in Walla Walla County are 20 to 24 Years (2,948 | 9.4%) for men and 15 to 19 Years (2,766 | 9.0%) for women.
| Age Bracket | Male | Female |
| Under 5 Years | 1,506 (4.8%) | 1,585 (5.1%) |
| 5 to 9 Years | 1,460 (4.7%) | 1,779 (5.8%) |
| 10 to 14 Years | 2,275 (7.3%) | 1,755 (5.7%) |
| 15 to 19 Years | 2,441 (7.8%) | 2,766 (9.0%) |
| 20 to 24 Years | 2,948 (9.4%) | 2,688 (8.7%) |
| 25 to 29 Years | 2,073 (6.6%) | 1,663 (5.4%) |
| 30 to 34 Years | 2,051 (6.6%) | 1,712 (5.6%) |
| 35 to 39 Years | 1,937 (6.2%) | 1,756 (5.7%) |
| 40 to 44 Years | 1,918 (6.1%) | 1,517 (4.9%) |
| 45 to 49 Years | 1,748 (5.6%) | 1,645 (5.3%) |
| 50 to 54 Years | 1,854 (5.9%) | 1,654 (5.4%) |
| 55 to 59 Years | 1,733 (5.5%) | 1,581 (5.1%) |
| 60 to 64 Years | 1,950 (6.2%) | 2,165 (7.0%) |
| 65 to 69 Years | 1,819 (5.8%) | 1,847 (6.0%) |
| 70 to 74 Years | 1,393 (4.4%) | 1,606 (5.2%) |
| 75 to 79 Years | 890 (2.9%) | 1,127 (3.6%) |
| 80 to 84 Years | 517 (1.7%) | 756 (2.5%) |
| 85 Years and over | 763 (2.4%) | 1,272 (4.1%) |
| Total | 31,276 (100.0%) | 30,874 (100.0%) |
Families and Households in Walla Walla County
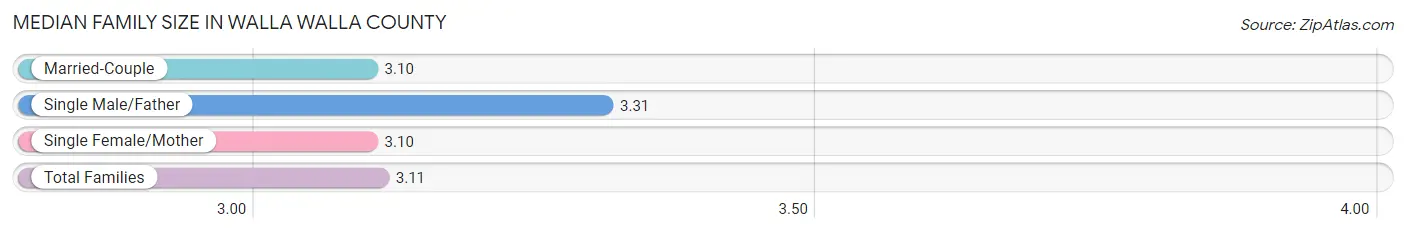
Median Family Size in Walla Walla County
The median family size in Walla Walla County is 3.11 persons per family, with single male/father families (930 | 6.4%) accounting for the largest median family size of 3.31 persons per family. On the other hand, married-couple families (11,402 | 78.5%) represent the smallest median family size with 3.10 persons per family.
| Family Type | # Families | Family Size |
| Married-Couple | 11,402 (78.5%) | 3.10 |
| Single Male/Father | 930 (6.4%) | 3.31 |
| Single Female/Mother | 2,194 (15.1%) | 3.10 |
| Total Families | 14,526 (100.0%) | 3.11 |
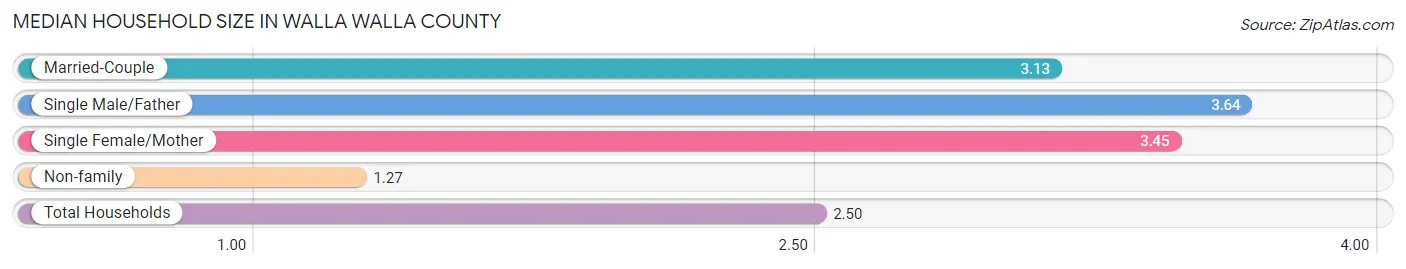
Median Household Size in Walla Walla County
The median household size in Walla Walla County is 2.50 persons per household, with single male/father households (930 | 4.1%) accounting for the largest median household size of 3.64 persons per household. non-family households (8,452 | 36.8%) represent the smallest median household size with 1.27 persons per household.
| Household Type | # Households | Household Size |
| Married-Couple | 11,402 (49.6%) | 3.13 |
| Single Male/Father | 930 (4.1%) | 3.64 |
| Single Female/Mother | 2,194 (9.6%) | 3.45 |
| Non-family | 8,452 (36.8%) | 1.27 |
| Total Households | 22,978 (100.0%) | 2.50 |
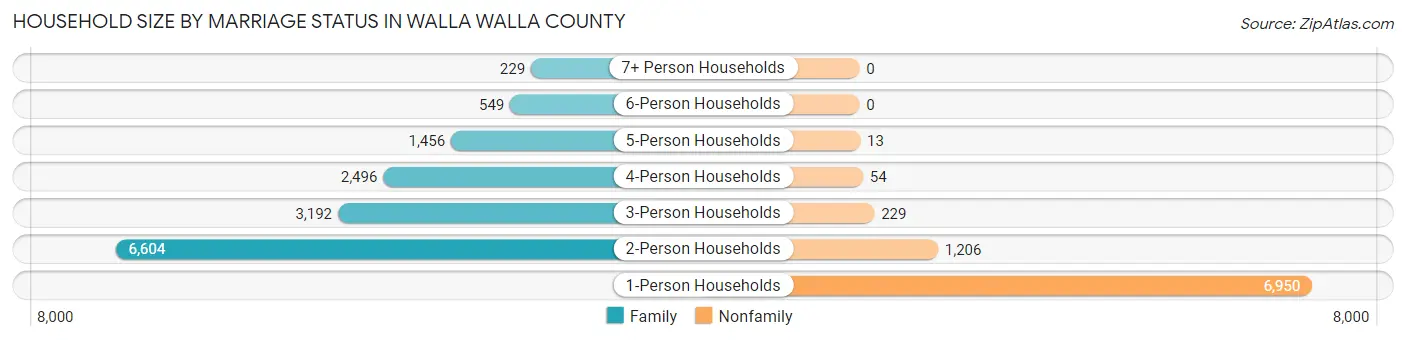
Household Size by Marriage Status in Walla Walla County
Out of a total of 22,978 households in Walla Walla County, 14,526 (63.2%) are family households, while 8,452 (36.8%) are nonfamily households. The most numerous type of family households are 2-person households, comprising 6,604, and the most common type of nonfamily households are 1-person households, comprising 6,950.
| Household Size | Family Households | Nonfamily Households |
| 1-Person Households | - | 6,950 (30.2%) |
| 2-Person Households | 6,604 (28.7%) | 1,206 (5.2%) |
| 3-Person Households | 3,192 (13.9%) | 229 (1.0%) |
| 4-Person Households | 2,496 (10.9%) | 54 (0.2%) |
| 5-Person Households | 1,456 (6.3%) | 13 (0.1%) |
| 6-Person Households | 549 (2.4%) | 0 (0.0%) |
| 7+ Person Households | 229 (1.0%) | 0 (0.0%) |
| Total | 14,526 (63.2%) | 8,452 (36.8%) |
Female Fertility in Walla Walla County
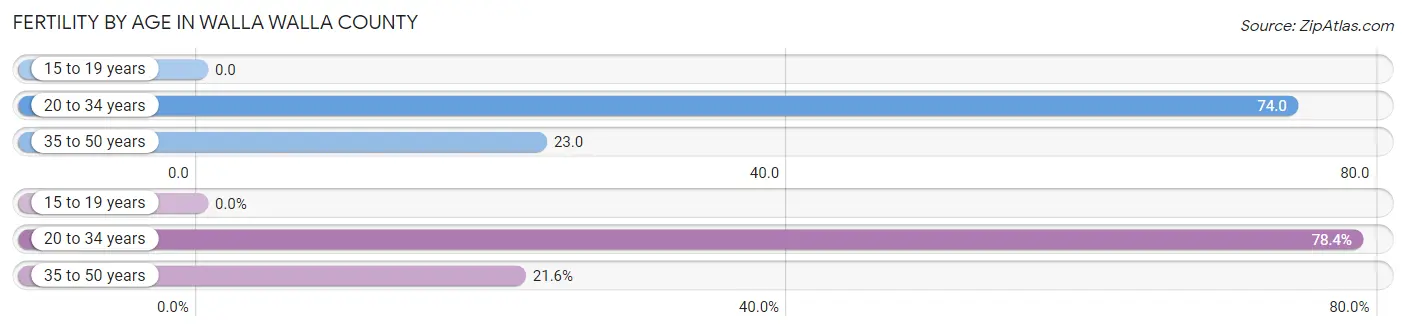
Fertility by Age in Walla Walla County
Average fertility rate in Walla Walla County is 41.0 births per 1,000 women. Women in the age bracket of 20 to 34 years have the highest fertility rate with 74.0 births per 1,000 women. Women in the age bracket of 20 to 34 years acount for 78.4% of all women with births.
| Age Bracket | Women with Births | Births / 1,000 Women |
| 15 to 19 years | 0 (0.0%) | 0.0 |
| 20 to 34 years | 451 (78.4%) | 74.0 |
| 35 to 50 years | 124 (21.6%) | 23.0 |
| Total | 575 (100.0%) | 41.0 |
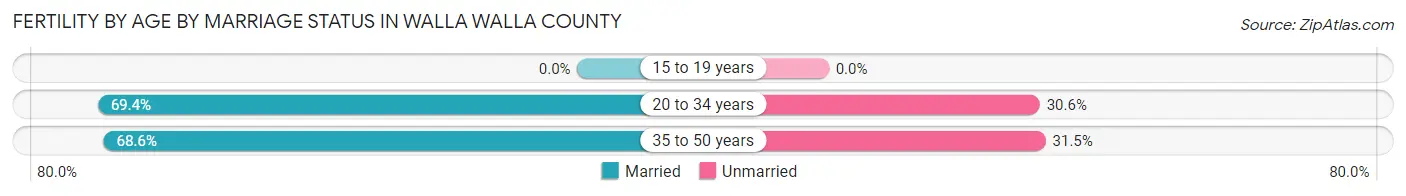
Fertility by Age by Marriage Status in Walla Walla County
69.2% of women with births (575) in Walla Walla County are married. The highest percentage of unmarried women with births falls into 35 to 50 years age bracket with 31.5% of them unmarried at the time of birth, while the lowest percentage of unmarried women with births belong to 20 to 34 years age bracket with 30.6% of them unmarried.
| Age Bracket | Married | Unmarried |
| 15 to 19 years | 0 (0.0%) | 0 (0.0%) |
| 20 to 34 years | 313 (69.4%) | 138 (30.6%) |
| 35 to 50 years | 85 (68.5%) | 39 (31.5%) |
| Total | 398 (69.2%) | 177 (30.8%) |
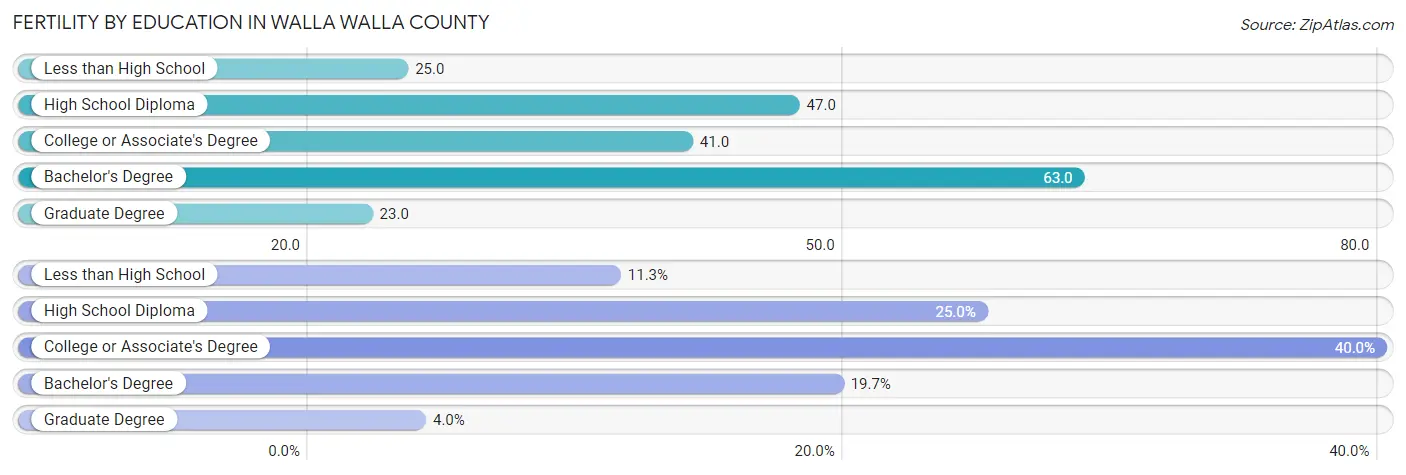
Fertility by Education in Walla Walla County
Average fertility rate in Walla Walla County is 41.0 births per 1,000 women. Women with the education attainment of bachelor's degree have the highest fertility rate of 63.0 births per 1,000 women, while women with the education attainment of graduate degree have the lowest fertility at 23.0 births per 1,000 women. Women with the education attainment of college or associate's degree represent 40.0% of all women with births.
| Educational Attainment | Women with Births | Births / 1,000 Women |
| Less than High School | 65 (11.3%) | 25.0 |
| High School Diploma | 144 (25.0%) | 47.0 |
| College or Associate's Degree | 230 (40.0%) | 41.0 |
| Bachelor's Degree | 113 (19.7%) | 63.0 |
| Graduate Degree | 23 (4.0%) | 23.0 |
| Total | 575 (100.0%) | 41.0 |
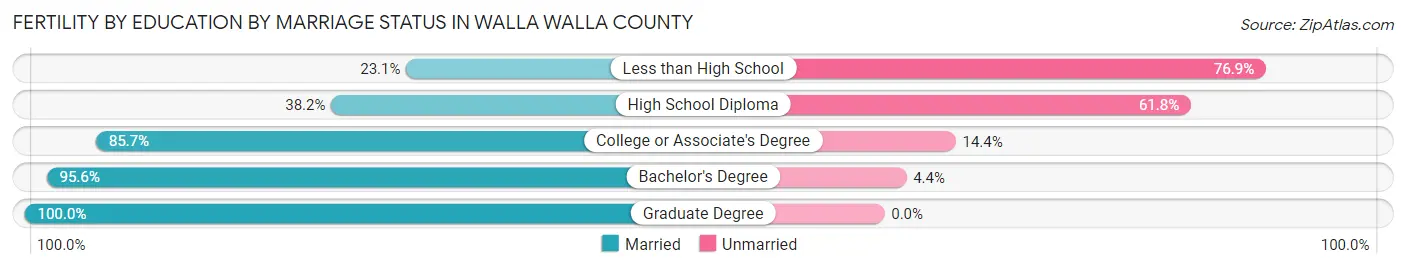
Fertility by Education by Marriage Status in Walla Walla County
30.8% of women with births in Walla Walla County are unmarried. Women with the educational attainment of graduate degree are most likely to be married with 100.0% of them married at childbirth, while women with the educational attainment of less than high school are least likely to be married with 76.9% of them unmarried at childbirth.
| Educational Attainment | Married | Unmarried |
| Less than High School | 15 (23.1%) | 50 (76.9%) |
| High School Diploma | 55 (38.2%) | 89 (61.8%) |
| College or Associate's Degree | 197 (85.7%) | 33 (14.3%) |
| Bachelor's Degree | 108 (95.6%) | 5 (4.4%) |
| Graduate Degree | 23 (100.0%) | 0 (0.0%) |
| Total | 398 (69.2%) | 177 (30.8%) |
Income in Walla Walla County
Income Overview in Walla Walla County
Per Capita Income in Walla Walla County is $34,476, while median incomes of families and households are $84,932 and $66,635 respectively.
| Characteristic | Number | Measure |
| Per Capita Income | 62,150 | $34,476 |
| Median Family Income | 14,526 | $84,932 |
| Mean Family Income | 14,526 | $109,609 |
| Median Household Income | 22,978 | $66,635 |
| Mean Household Income | 22,978 | $89,381 |
| Income Deficit | 14,526 | $8,080 |
| Wage / Income Gap (%) | 62,150 | 40.20% |
| Wage / Income Gap ($) | 62,150 | 59.80¢ per $1 |
| Gini / Inequality Index | 62,150 | 0.46 |
Earnings by Sex in Walla Walla County
Average Earnings in Walla Walla County are $34,419, $43,835 for men and $26,214 for women, a difference of 40.2%.
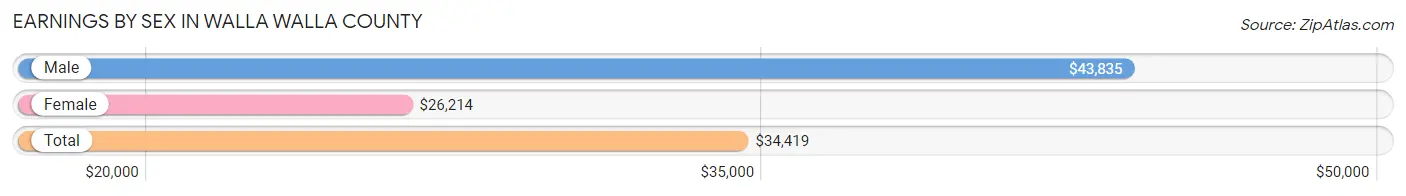
| Sex | Number | Average Earnings |
| Male | 16,564 (51.8%) | $43,835 |
| Female | 15,396 (48.2%) | $26,214 |
| Total | 31,960 (100.0%) | $34,419 |
Earnings by Sex by Income Bracket in Walla Walla County
The most common earnings brackets in Walla Walla County are $100,000+ for men (2,288 | 13.8%) and $2,499 or less for women (1,417 | 9.2%).
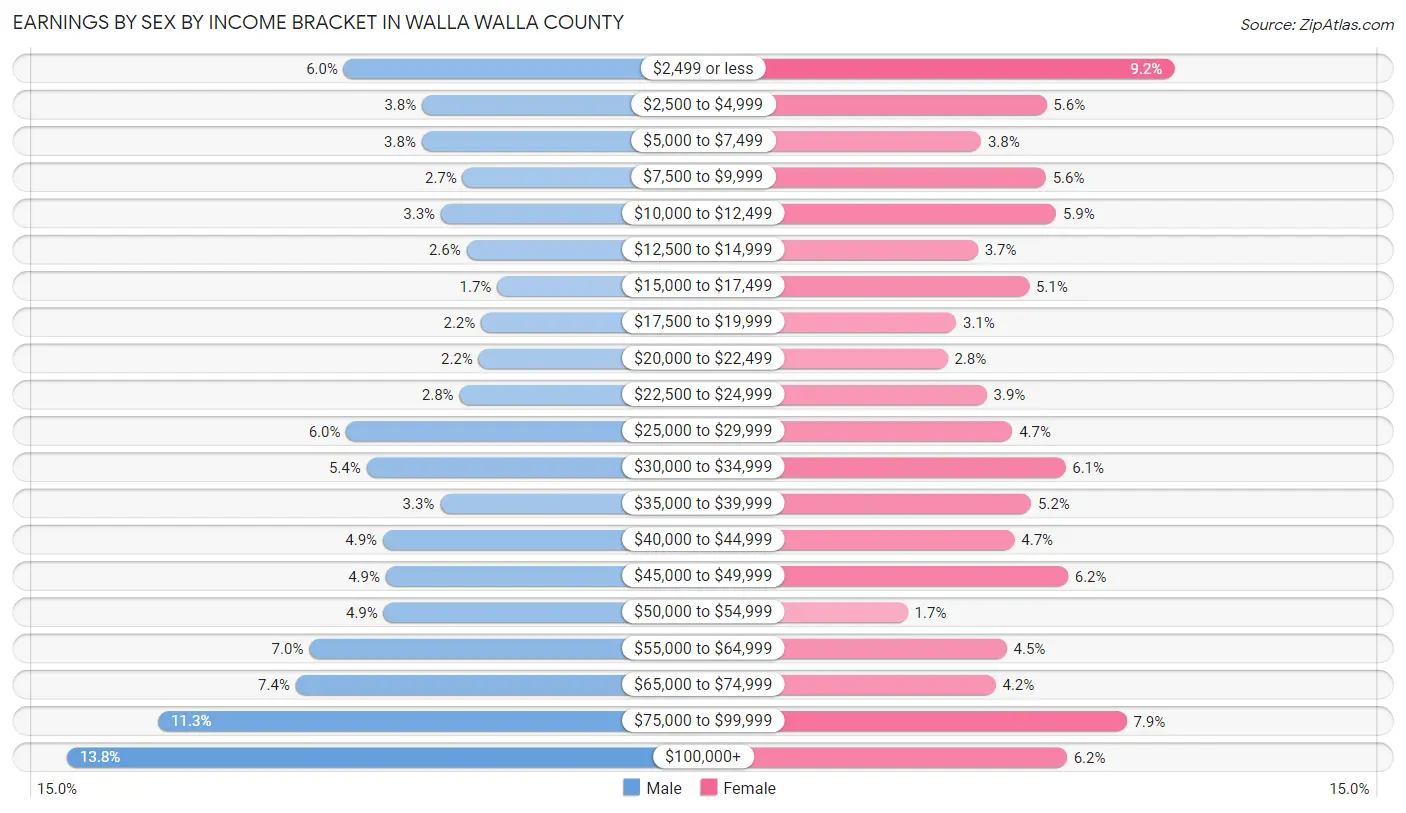
| Income | Male | Female |
| $2,499 or less | 999 (6.0%) | 1,417 (9.2%) |
| $2,500 to $4,999 | 635 (3.8%) | 863 (5.6%) |
| $5,000 to $7,499 | 636 (3.8%) | 581 (3.8%) |
| $7,500 to $9,999 | 445 (2.7%) | 861 (5.6%) |
| $10,000 to $12,499 | 546 (3.3%) | 906 (5.9%) |
| $12,500 to $14,999 | 427 (2.6%) | 566 (3.7%) |
| $15,000 to $17,499 | 285 (1.7%) | 789 (5.1%) |
| $17,500 to $19,999 | 360 (2.2%) | 472 (3.1%) |
| $20,000 to $22,499 | 371 (2.2%) | 435 (2.8%) |
| $22,500 to $24,999 | 461 (2.8%) | 605 (3.9%) |
| $25,000 to $29,999 | 988 (6.0%) | 716 (4.6%) |
| $30,000 to $34,999 | 893 (5.4%) | 946 (6.1%) |
| $35,000 to $39,999 | 550 (3.3%) | 798 (5.2%) |
| $40,000 to $44,999 | 817 (4.9%) | 725 (4.7%) |
| $45,000 to $49,999 | 804 (4.9%) | 956 (6.2%) |
| $50,000 to $54,999 | 813 (4.9%) | 264 (1.7%) |
| $55,000 to $64,999 | 1,160 (7.0%) | 691 (4.5%) |
| $65,000 to $74,999 | 1,223 (7.4%) | 643 (4.2%) |
| $75,000 to $99,999 | 1,863 (11.3%) | 1,210 (7.9%) |
| $100,000+ | 2,288 (13.8%) | 952 (6.2%) |
| Total | 16,564 (100.0%) | 15,396 (100.0%) |
Earnings by Sex by Educational Attainment in Walla Walla County
Average earnings in Walla Walla County are $53,731 for men and $37,089 for women, a difference of 31.0%. Men with an educational attainment of graduate degree enjoy the highest average annual earnings of $85,905, while those with less than high school education earn the least with $33,766. Women with an educational attainment of graduate degree earn the most with the average annual earnings of $73,345, while those with high school diploma education have the smallest earnings of $28,813.
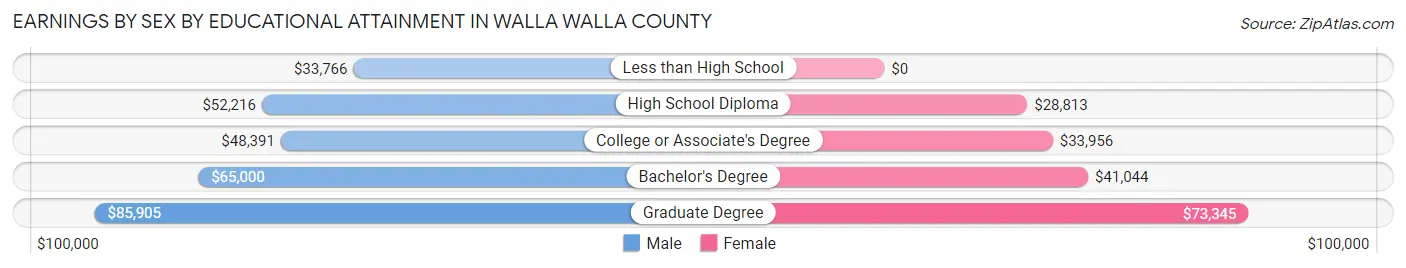
| Educational Attainment | Male Income | Female Income |
| Less than High School | $33,766 | $0 |
| High School Diploma | $52,216 | $28,813 |
| College or Associate's Degree | $48,391 | $33,956 |
| Bachelor's Degree | $65,000 | $41,044 |
| Graduate Degree | $85,905 | $73,345 |
| Total | $53,731 | $37,089 |
Family Income in Walla Walla County
Family Income Brackets in Walla Walla County
According to the Walla Walla County family income data, there are 2,949 families falling into the $100,000 to $149,999 income range, which is the most common income bracket and makes up 20.3% of all families. Conversely, the less than $10,000 income bracket is the least frequent group with only 189 families (1.3%) belonging to this category.
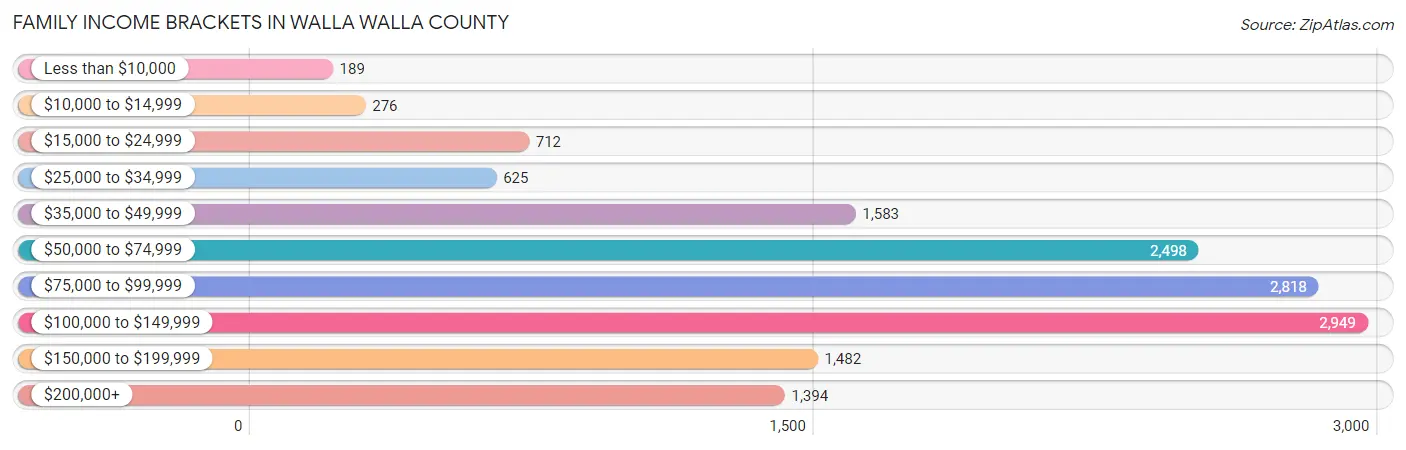
| Income Bracket | # Families | % Families |
| Less than $10,000 | 189 | 1.3% |
| $10,000 to $14,999 | 276 | 1.9% |
| $15,000 to $24,999 | 712 | 4.9% |
| $25,000 to $34,999 | 625 | 4.3% |
| $35,000 to $49,999 | 1,583 | 10.9% |
| $50,000 to $74,999 | 2,498 | 17.2% |
| $75,000 to $99,999 | 2,818 | 19.4% |
| $100,000 to $149,999 | 2,949 | 20.3% |
| $150,000 to $199,999 | 1,482 | 10.2% |
| $200,000+ | 1,394 | 9.6% |
Family Income by Famaliy Size in Walla Walla County
4-person families (2,172 | 14.9%) account for the highest median family income in Walla Walla County with $109,293 per family, while 2-person families (6,927 | 47.7%) have the highest median income of $40,557 per family member.
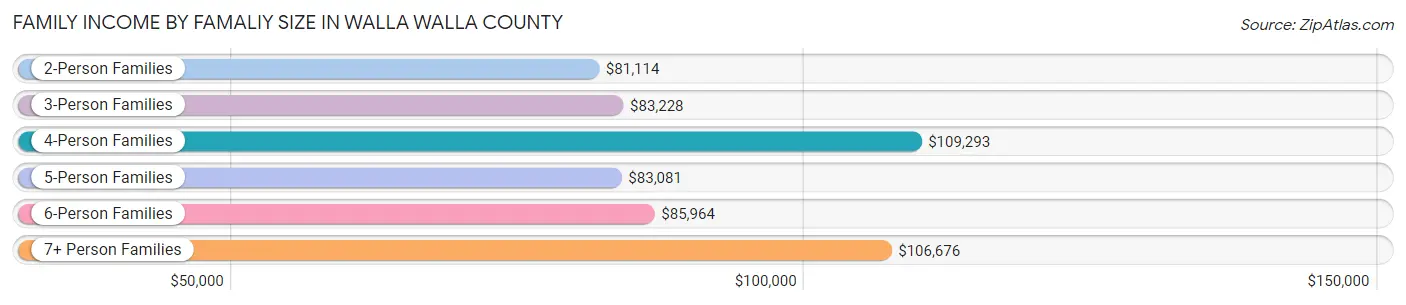
| Income Bracket | # Families | Median Income |
| 2-Person Families | 6,927 (47.7%) | $81,114 |
| 3-Person Families | 3,392 (23.4%) | $83,228 |
| 4-Person Families | 2,172 (14.9%) | $109,293 |
| 5-Person Families | 1,404 (9.7%) | $83,081 |
| 6-Person Families | 480 (3.3%) | $85,964 |
| 7+ Person Families | 151 (1.0%) | $106,676 |
| Total | 14,526 (100.0%) | $84,932 |
Family Income by Number of Earners in Walla Walla County
The median family income in Walla Walla County is $84,932, with families comprising 3+ earners (1,524) having the highest median family income of $121,220, while families with no earners (2,484) have the lowest median family income of $59,797, accounting for 10.5% and 17.1% of families, respectively.
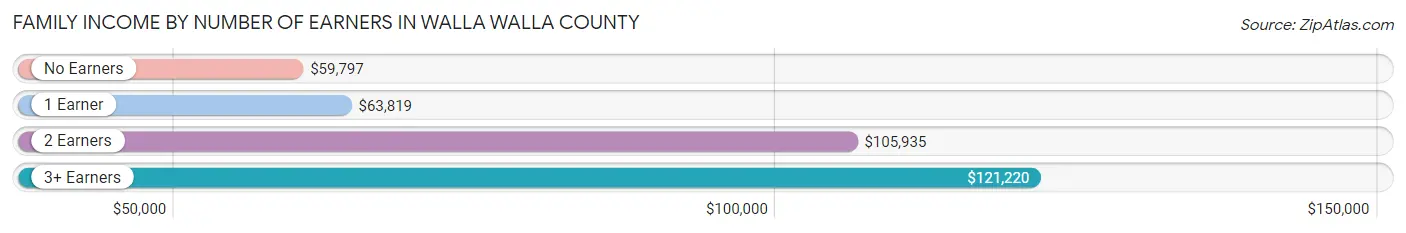
| Number of Earners | # Families | Median Income |
| No Earners | 2,484 (17.1%) | $59,797 |
| 1 Earner | 4,166 (28.7%) | $63,819 |
| 2 Earners | 6,352 (43.7%) | $105,935 |
| 3+ Earners | 1,524 (10.5%) | $121,220 |
| Total | 14,526 (100.0%) | $84,932 |
Household Income in Walla Walla County
Household Income Brackets in Walla Walla County
With 4,067 households falling in the category, the $50,000 to $74,999 income range is the most frequent in Walla Walla County, accounting for 17.7% of all households. In contrast, only 896 households (3.9%) fall into the less than $10,000 income bracket, making it the least populous group.
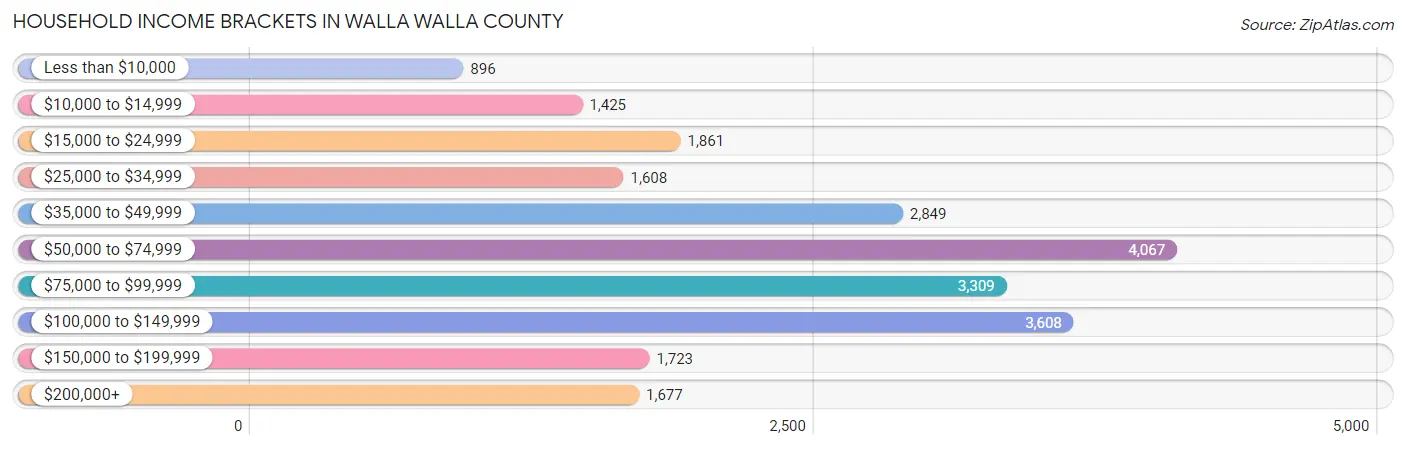
| Income Bracket | # Households | % Households |
| Less than $10,000 | 896 | 3.9% |
| $10,000 to $14,999 | 1,425 | 6.2% |
| $15,000 to $24,999 | 1,861 | 8.1% |
| $25,000 to $34,999 | 1,608 | 7.0% |
| $35,000 to $49,999 | 2,849 | 12.4% |
| $50,000 to $74,999 | 4,067 | 17.7% |
| $75,000 to $99,999 | 3,309 | 14.4% |
| $100,000 to $149,999 | 3,608 | 15.7% |
| $150,000 to $199,999 | 1,723 | 7.5% |
| $200,000+ | 1,677 | 7.3% |
Household Income by Householder Age in Walla Walla County
The median household income in Walla Walla County is $66,635, with the highest median household income of $82,307 found in the 45 to 64 years age bracket for the primary householder. A total of 7,500 households (32.6%) fall into this category. Meanwhile, the 15 to 24 years age bracket for the primary householder has the lowest median household income of $29,224, with 1,432 households (6.2%) in this group.
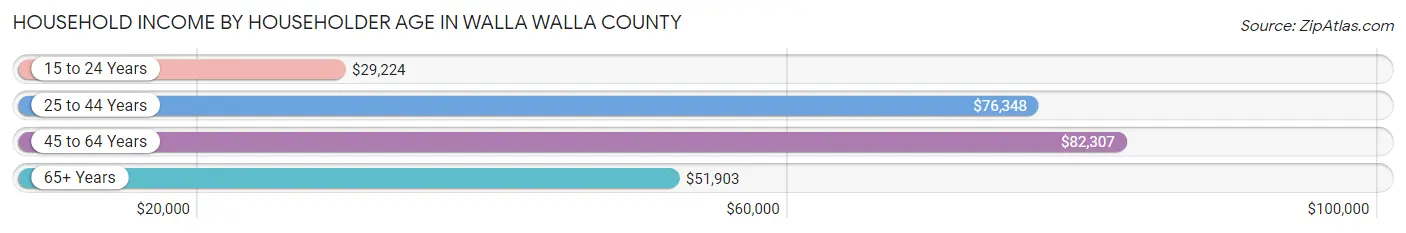
| Income Bracket | # Households | Median Income |
| 15 to 24 Years | 1,432 (6.2%) | $29,224 |
| 25 to 44 Years | 6,546 (28.5%) | $76,348 |
| 45 to 64 Years | 7,500 (32.6%) | $82,307 |
| 65+ Years | 7,500 (32.6%) | $51,903 |
| Total | 22,978 (100.0%) | $66,635 |
Poverty in Walla Walla County
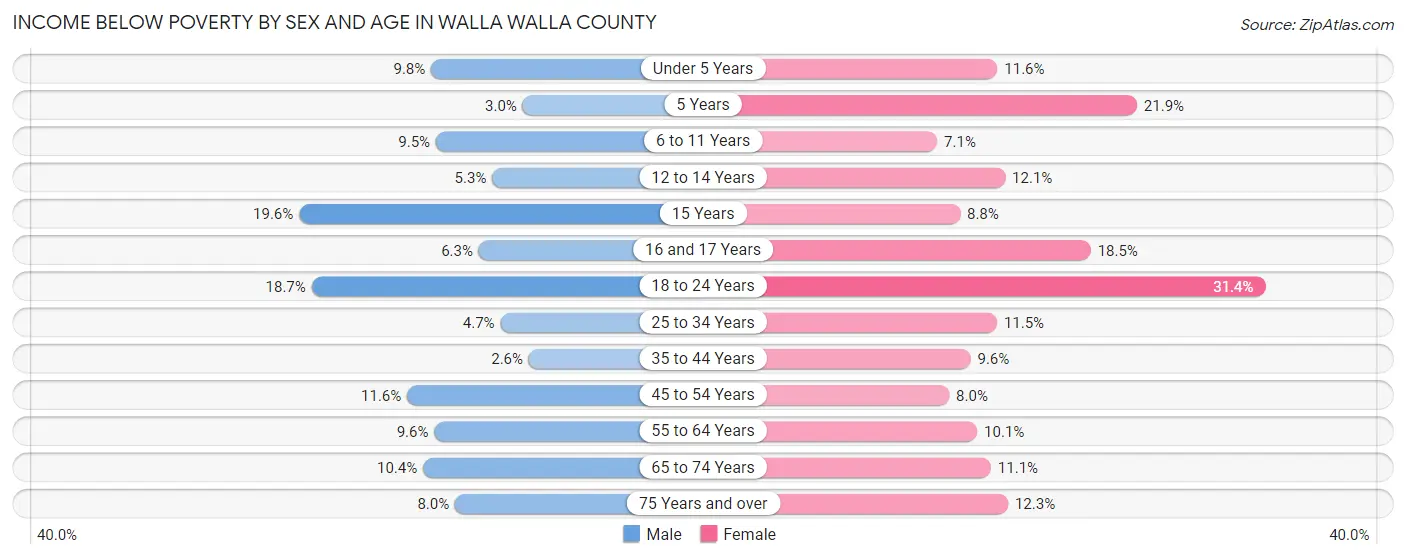
Income Below Poverty by Sex and Age in Walla Walla County
With 9.2% poverty level for males and 12.9% for females among the residents of Walla Walla County, 15 year old males and 18 to 24 year old females are the most vulnerable to poverty, with 72 males (19.6%) and 1,056 females (31.4%) in their respective age groups living below the poverty level.
| Age Bracket | Male | Female |
| Under 5 Years | 147 (9.8%) | 182 (11.6%) |
| 5 Years | 11 (3.0%) | 39 (21.9%) |
| 6 to 11 Years | 205 (9.5%) | 149 (7.1%) |
| 12 to 14 Years | 61 (5.3%) | 151 (12.1%) |
| 15 Years | 72 (19.6%) | 44 (8.8%) |
| 16 and 17 Years | 51 (6.3%) | 119 (18.5%) |
| 18 to 24 Years | 589 (18.7%) | 1,056 (31.4%) |
| 25 to 34 Years | 155 (4.7%) | 386 (11.5%) |
| 35 to 44 Years | 84 (2.6%) | 313 (9.6%) |
| 45 to 54 Years | 377 (11.6%) | 263 (8.0%) |
| 55 to 64 Years | 337 (9.6%) | 374 (10.1%) |
| 65 to 74 Years | 320 (10.4%) | 370 (11.1%) |
| 75 Years and over | 166 (8.0%) | 375 (12.3%) |
| Total | 2,575 (9.2%) | 3,821 (12.9%) |
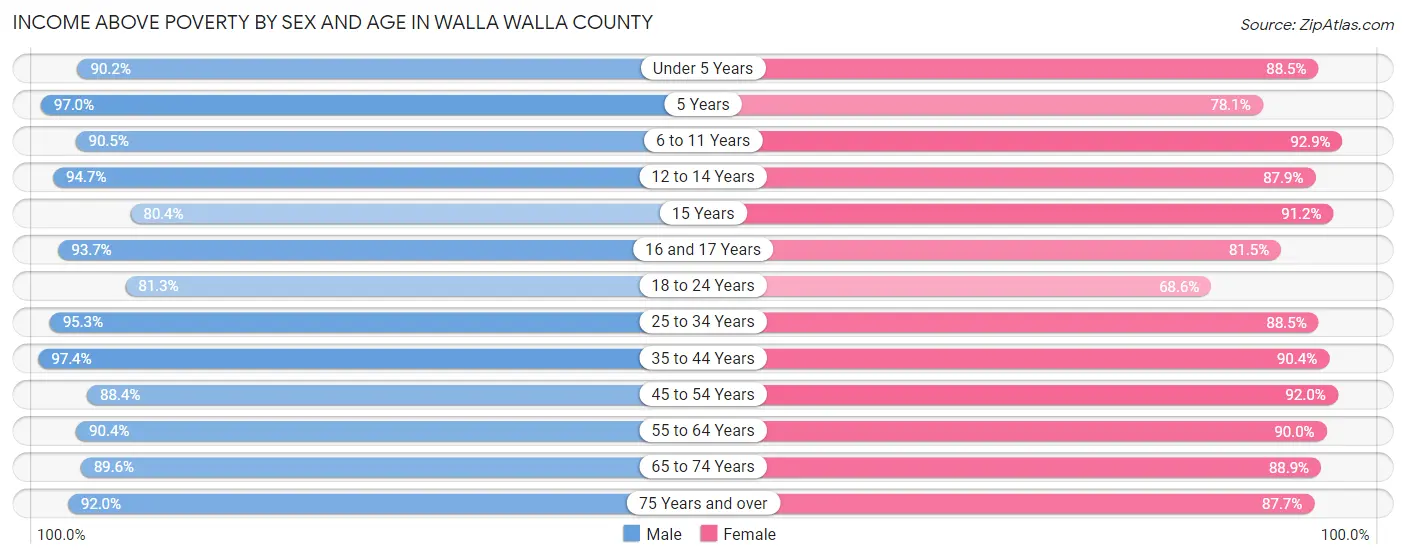
Income Above Poverty by Sex and Age in Walla Walla County
According to the poverty statistics in Walla Walla County, males aged 35 to 44 years and females aged 6 to 11 years are the age groups that are most secure financially, with 97.4% of males and 92.9% of females in these age groups living above the poverty line.
| Age Bracket | Male | Female |
| Under 5 Years | 1,350 (90.2%) | 1,394 (88.4%) |
| 5 Years | 353 (97.0%) | 139 (78.1%) |
| 6 to 11 Years | 1,962 (90.5%) | 1,957 (92.9%) |
| 12 to 14 Years | 1,095 (94.7%) | 1,094 (87.9%) |
| 15 Years | 295 (80.4%) | 457 (91.2%) |
| 16 and 17 Years | 761 (93.7%) | 525 (81.5%) |
| 18 to 24 Years | 2,563 (81.3%) | 2,303 (68.6%) |
| 25 to 34 Years | 3,161 (95.3%) | 2,966 (88.5%) |
| 35 to 44 Years | 3,193 (97.4%) | 2,960 (90.4%) |
| 45 to 54 Years | 2,874 (88.4%) | 3,036 (92.0%) |
| 55 to 64 Years | 3,179 (90.4%) | 3,347 (89.9%) |
| 65 to 74 Years | 2,752 (89.6%) | 2,973 (88.9%) |
| 75 Years and over | 1,898 (92.0%) | 2,665 (87.7%) |
| Total | 25,436 (90.8%) | 25,816 (87.1%) |
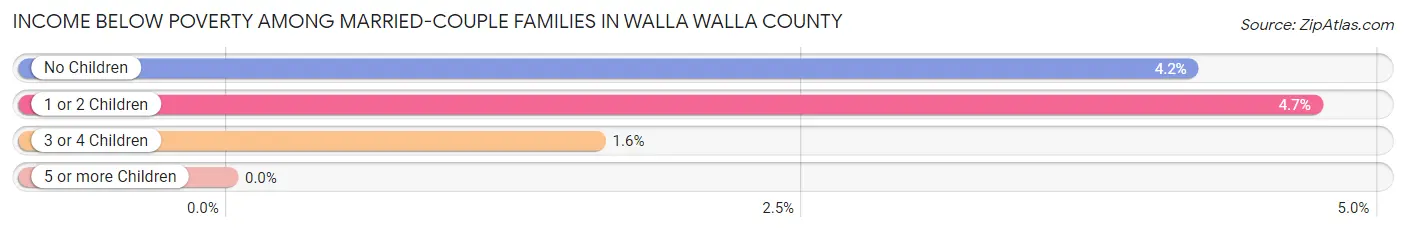
Income Below Poverty Among Married-Couple Families in Walla Walla County
The poverty statistics for married-couple families in Walla Walla County show that 4.1% or 467 of the total 11,402 families live below the poverty line. Families with 1 or 2 children have the highest poverty rate of 4.7%, comprising of 160 families. On the other hand, families with 5 or more children have the lowest poverty rate of 0.0%, which includes 0 families.
| Children | Above Poverty | Below Poverty |
| No Children | 6,677 (95.8%) | 291 (4.2%) |
| 1 or 2 Children | 3,227 (95.3%) | 160 (4.7%) |
| 3 or 4 Children | 982 (98.4%) | 16 (1.6%) |
| 5 or more Children | 49 (100.0%) | 0 (0.0%) |
| Total | 10,935 (95.9%) | 467 (4.1%) |
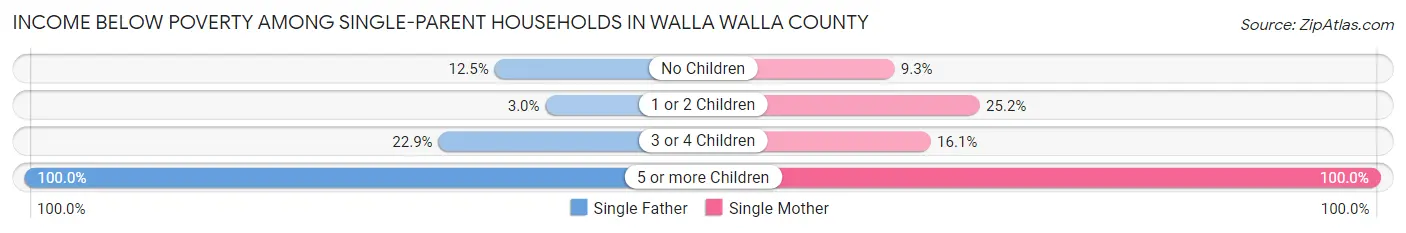
Income Below Poverty Among Single-Parent Households in Walla Walla County
According to the poverty data in Walla Walla County, 8.9% or 83 single-father households and 20.2% or 443 single-mother households are living below the poverty line. Among single-father households, those with 5 or more children have the highest poverty rate, with 5 households (100.0%) experiencing poverty. Likewise, among single-mother households, those with 5 or more children have the highest poverty rate, with 15 households (100.0%) falling below the poverty line.
| Children | Single Father | Single Mother |
| No Children | 41 (12.5%) | 62 (9.3%) |
| 1 or 2 Children | 15 (3.0%) | 337 (25.2%) |
| 3 or 4 Children | 22 (22.9%) | 29 (16.1%) |
| 5 or more Children | 5 (100.0%) | 15 (100.0%) |
| Total | 83 (8.9%) | 443 (20.2%) |
Income Below Poverty Among Married-Couple vs Single-Parent Households in Walla Walla County
The poverty data for Walla Walla County shows that 467 of the married-couple family households (4.1%) and 526 of the single-parent households (16.8%) are living below the poverty level. Within the married-couple family households, those with 1 or 2 children have the highest poverty rate, with 160 households (4.7%) falling below the poverty line. Among the single-parent households, those with 5 or more children have the highest poverty rate, with 20 household (100.0%) living below poverty.
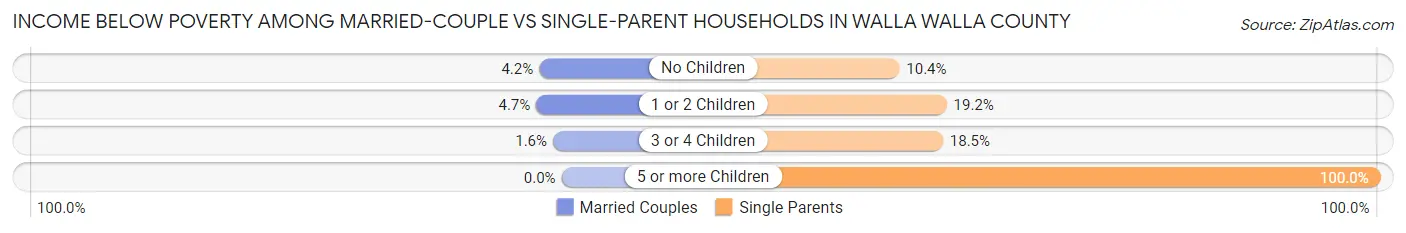
| Children | Married-Couple Families | Single-Parent Households |
| No Children | 291 (4.2%) | 103 (10.4%) |
| 1 or 2 Children | 160 (4.7%) | 352 (19.2%) |
| 3 or 4 Children | 16 (1.6%) | 51 (18.5%) |
| 5 or more Children | 0 (0.0%) | 20 (100.0%) |
| Total | 467 (4.1%) | 526 (16.8%) |
Employment Characteristics in Walla Walla County
Employment by Class of Employer in Walla Walla County
Among the 26,947 employed individuals in Walla Walla County, private company employees (15,851 | 58.8%), not-for-profit organizations (2,807 | 10.4%), and local government employees (1,967 | 7.3%) make up the most common classes of employment.
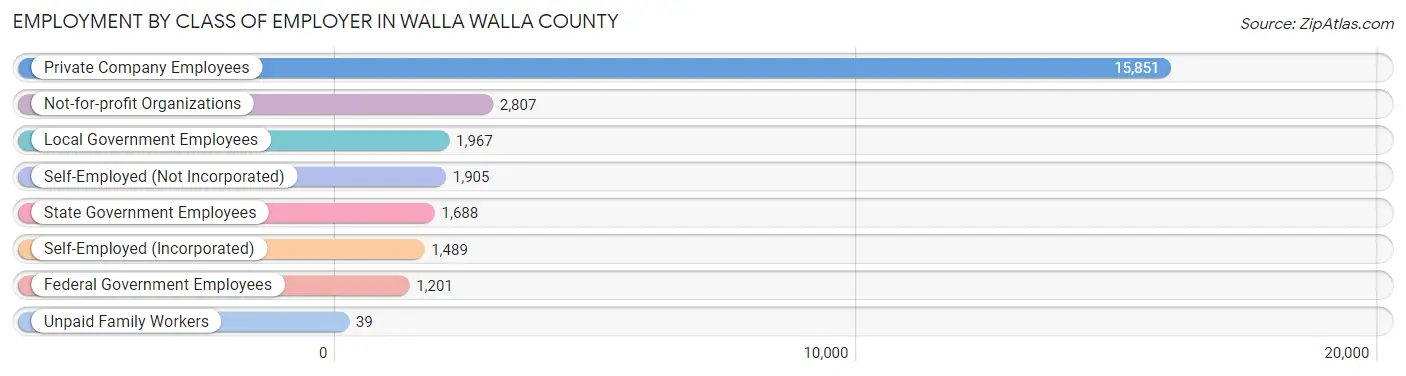
| Employer Class | # Employees | % Employees |
| Private Company Employees | 15,851 | 58.8% |
| Self-Employed (Incorporated) | 1,489 | 5.5% |
| Self-Employed (Not Incorporated) | 1,905 | 7.1% |
| Not-for-profit Organizations | 2,807 | 10.4% |
| Local Government Employees | 1,967 | 7.3% |
| State Government Employees | 1,688 | 6.3% |
| Federal Government Employees | 1,201 | 4.5% |
| Unpaid Family Workers | 39 | 0.1% |
| Total | 26,947 | 100.0% |
Employment Status by Age in Walla Walla County
According to the labor force statistics for Walla Walla County, out of the total population over 16 years of age (50,917), 57.5% or 29,277 individuals are in the labor force, with 5.8% or 1,698 of them unemployed. The age group with the highest labor force participation rate is 25 to 29 years, with 79.1% or 2,955 individuals in the labor force. Within the labor force, the 25 to 29 years age range has the highest percentage of unemployed individuals, with 14.0% or 414 of them being unemployed.
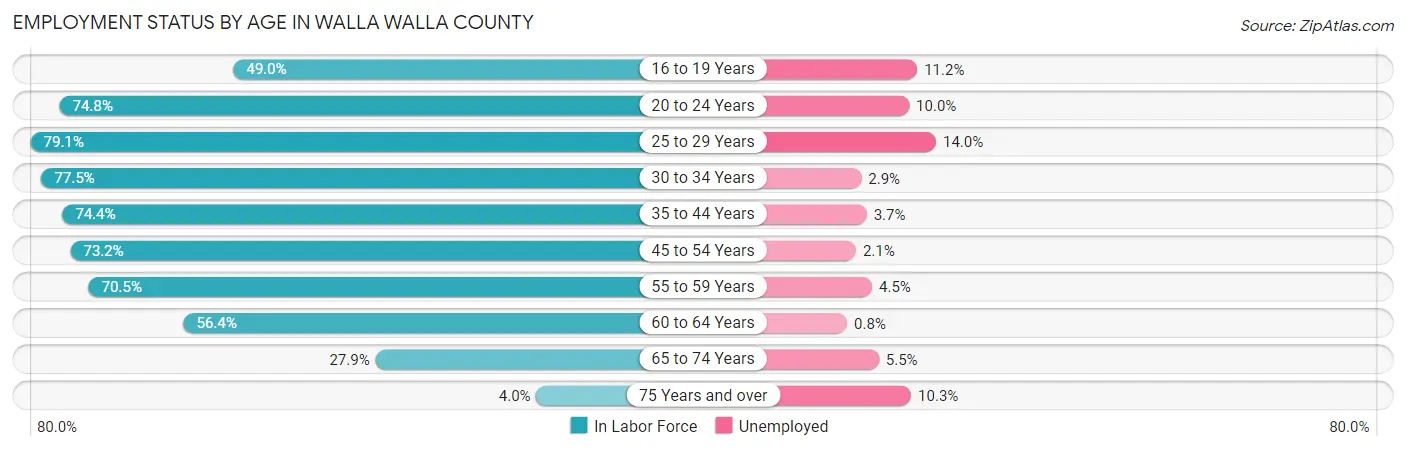
| Age Bracket | In Labor Force | Unemployed |
| 16 to 19 Years | 2,124 (49.0%) | 238 (11.2%) |
| 20 to 24 Years | 4,216 (74.8%) | 422 (10.0%) |
| 25 to 29 Years | 2,955 (79.1%) | 414 (14.0%) |
| 30 to 34 Years | 2,916 (77.5%) | 85 (2.9%) |
| 35 to 44 Years | 5,303 (74.4%) | 196 (3.7%) |
| 45 to 54 Years | 5,052 (73.2%) | 106 (2.1%) |
| 55 to 59 Years | 2,336 (70.5%) | 105 (4.5%) |
| 60 to 64 Years | 2,321 (56.4%) | 19 (0.8%) |
| 65 to 74 Years | 1,860 (27.9%) | 102 (5.5%) |
| 75 Years and over | 213 (4.0%) | 22 (10.3%) |
| Total | 29,277 (57.5%) | 1,698 (5.8%) |
Employment Status by Educational Attainment in Walla Walla County
According to labor force statistics for Walla Walla County, 72.1% of individuals (20,878) out of the total population between 25 and 64 years of age (28,957) are in the labor force, with 4.4% or 919 of them being unemployed. The group with the highest labor force participation rate are those with the educational attainment of bachelor's degree or higher, with 86.0% or 6,963 individuals in the labor force. Within the labor force, individuals with less than high school education have the highest percentage of unemployment, with 11.2% or 223 of them being unemployed.
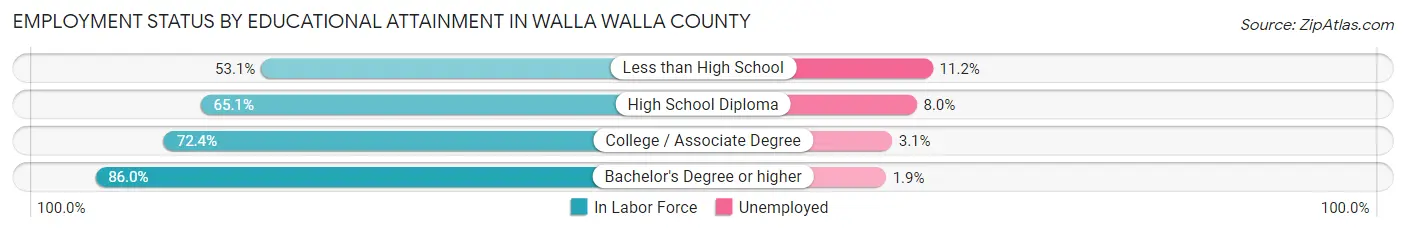
| Educational Attainment | In Labor Force | Unemployed |
| Less than High School | 1,993 (53.1%) | 420 (11.2%) |
| High School Diploma | 4,043 (65.1%) | 497 (8.0%) |
| College / Associate Degree | 7,889 (72.4%) | 338 (3.1%) |
| Bachelor's Degree or higher | 6,963 (86.0%) | 154 (1.9%) |
| Total | 20,878 (72.1%) | 1,274 (4.4%) |
Employment Occupations by Sex in Walla Walla County
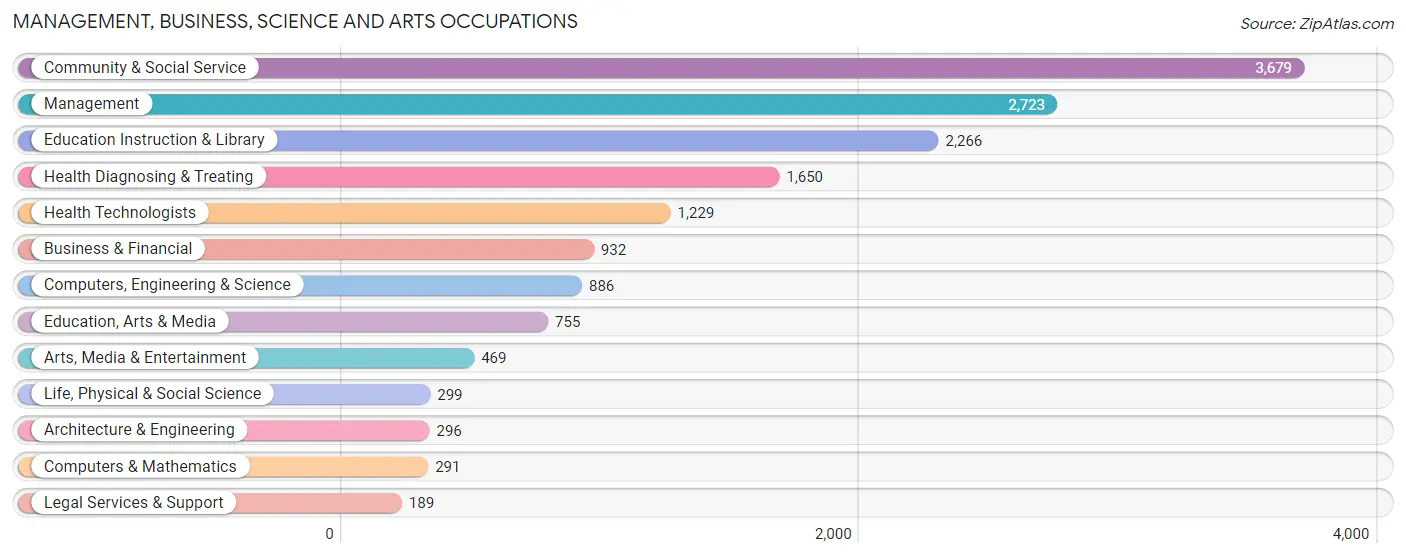
Management, Business, Science and Arts Occupations
The most common Management, Business, Science and Arts occupations in Walla Walla County are Community & Social Service (3,679 | 13.4%), Management (2,723 | 9.9%), Education Instruction & Library (2,266 | 8.2%), Health Diagnosing & Treating (1,650 | 6.0%), and Health Technologists (1,229 | 4.5%).
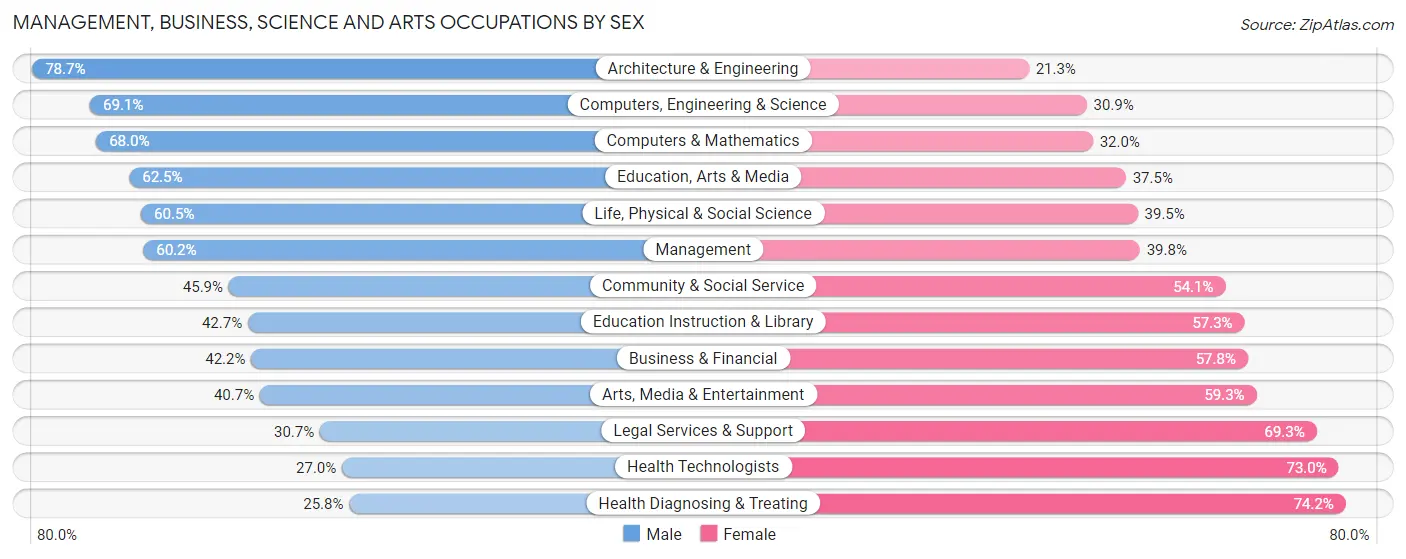
Management, Business, Science and Arts Occupations by Sex
Within the Management, Business, Science and Arts occupations in Walla Walla County, the most male-oriented occupations are Architecture & Engineering (78.7%), Computers, Engineering & Science (69.1%), and Computers & Mathematics (68.0%), while the most female-oriented occupations are Health Diagnosing & Treating (74.2%), Health Technologists (73.0%), and Legal Services & Support (69.3%).
| Occupation | Male | Female |
| Management | 1,639 (60.2%) | 1,084 (39.8%) |
| Business & Financial | 393 (42.2%) | 539 (57.8%) |
| Computers, Engineering & Science | 612 (69.1%) | 274 (30.9%) |
| Computers & Mathematics | 198 (68.0%) | 93 (32.0%) |
| Architecture & Engineering | 233 (78.7%) | 63 (21.3%) |
| Life, Physical & Social Science | 181 (60.5%) | 118 (39.5%) |
| Community & Social Service | 1,689 (45.9%) | 1,990 (54.1%) |
| Education, Arts & Media | 472 (62.5%) | 283 (37.5%) |
| Legal Services & Support | 58 (30.7%) | 131 (69.3%) |
| Education Instruction & Library | 968 (42.7%) | 1,298 (57.3%) |
| Arts, Media & Entertainment | 191 (40.7%) | 278 (59.3%) |
| Health Diagnosing & Treating | 426 (25.8%) | 1,224 (74.2%) |
| Health Technologists | 332 (27.0%) | 897 (73.0%) |
| Total (Category) | 4,759 (48.2%) | 5,111 (51.8%) |
| Total (Overall) | 14,173 (51.5%) | 13,326 (48.5%) |
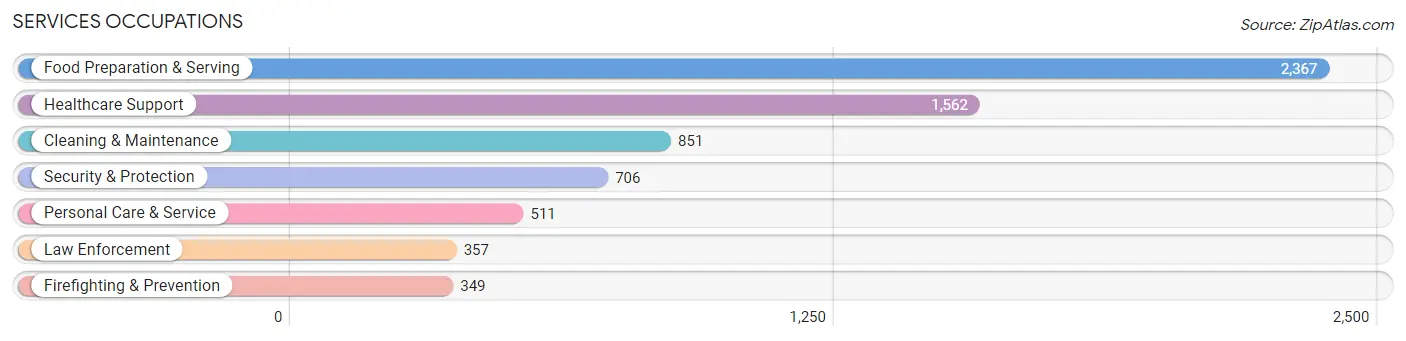
Services Occupations
The most common Services occupations in Walla Walla County are Food Preparation & Serving (2,367 | 8.6%), Healthcare Support (1,562 | 5.7%), Cleaning & Maintenance (851 | 3.1%), Security & Protection (706 | 2.6%), and Personal Care & Service (511 | 1.9%).
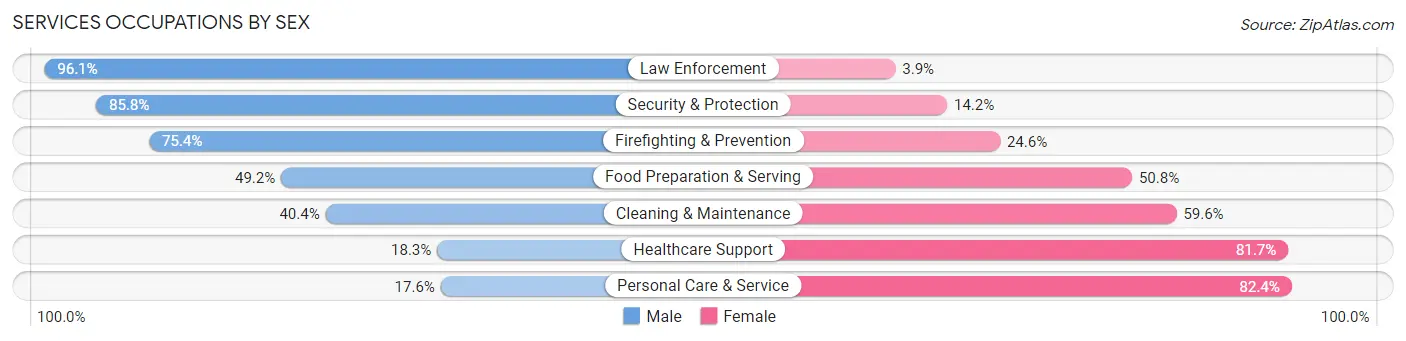
Services Occupations by Sex
Within the Services occupations in Walla Walla County, the most male-oriented occupations are Law Enforcement (96.1%), Security & Protection (85.8%), and Firefighting & Prevention (75.4%), while the most female-oriented occupations are Personal Care & Service (82.4%), Healthcare Support (81.7%), and Cleaning & Maintenance (59.6%).
| Occupation | Male | Female |
| Healthcare Support | 286 (18.3%) | 1,276 (81.7%) |
| Security & Protection | 606 (85.8%) | 100 (14.2%) |
| Firefighting & Prevention | 263 (75.4%) | 86 (24.6%) |
| Law Enforcement | 343 (96.1%) | 14 (3.9%) |
| Food Preparation & Serving | 1,165 (49.2%) | 1,202 (50.8%) |
| Cleaning & Maintenance | 344 (40.4%) | 507 (59.6%) |
| Personal Care & Service | 90 (17.6%) | 421 (82.4%) |
| Total (Category) | 2,491 (41.5%) | 3,506 (58.5%) |
| Total (Overall) | 14,173 (51.5%) | 13,326 (48.5%) |
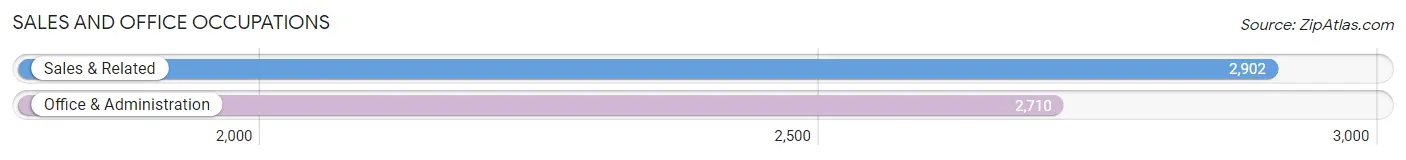
Sales and Office Occupations
The most common Sales and Office occupations in Walla Walla County are Sales & Related (2,902 | 10.5%), and Office & Administration (2,710 | 9.9%).
Sales and Office Occupations by Sex
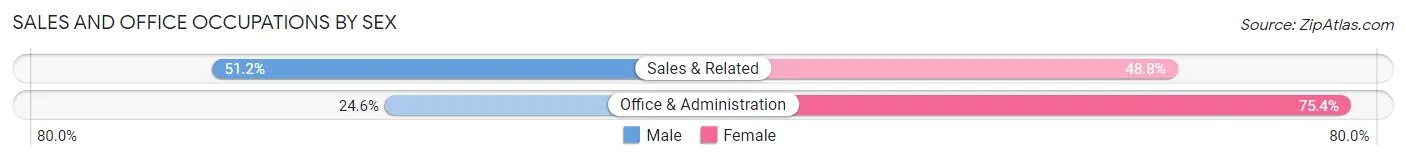
| Occupation | Male | Female |
| Sales & Related | 1,487 (51.2%) | 1,415 (48.8%) |
| Office & Administration | 666 (24.6%) | 2,044 (75.4%) |
| Total (Category) | 2,153 (38.4%) | 3,459 (61.6%) |
| Total (Overall) | 14,173 (51.5%) | 13,326 (48.5%) |
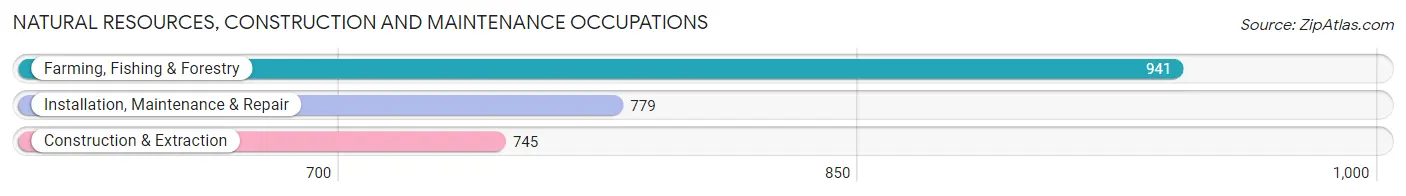
Natural Resources, Construction and Maintenance Occupations
The most common Natural Resources, Construction and Maintenance occupations in Walla Walla County are Farming, Fishing & Forestry (941 | 3.4%), Installation, Maintenance & Repair (779 | 2.8%), and Construction & Extraction (745 | 2.7%).
Natural Resources, Construction and Maintenance Occupations by Sex
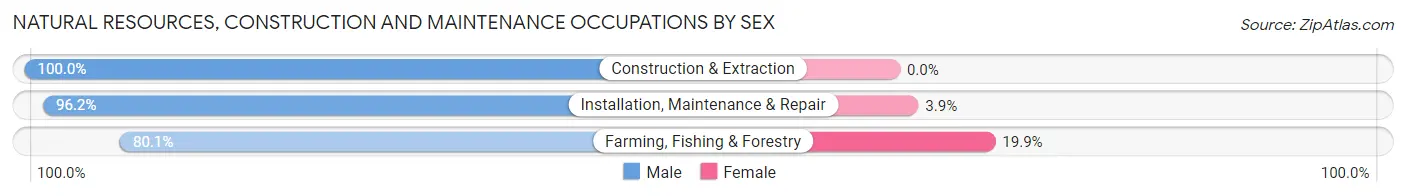
| Occupation | Male | Female |
| Farming, Fishing & Forestry | 754 (80.1%) | 187 (19.9%) |
| Construction & Extraction | 745 (100.0%) | 0 (0.0%) |
| Installation, Maintenance & Repair | 749 (96.2%) | 30 (3.8%) |
| Total (Category) | 2,248 (91.2%) | 217 (8.8%) |
| Total (Overall) | 14,173 (51.5%) | 13,326 (48.5%) |
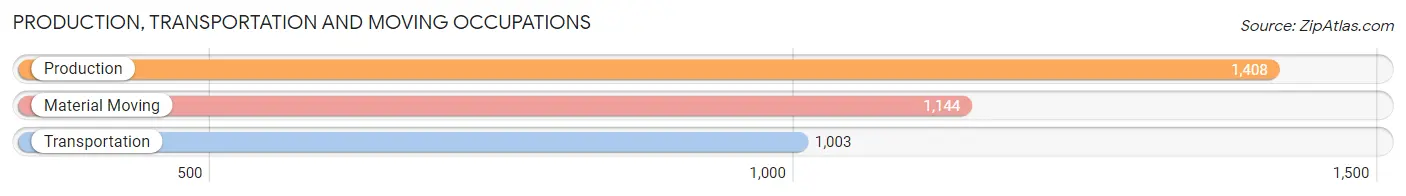
Production, Transportation and Moving Occupations
The most common Production, Transportation and Moving occupations in Walla Walla County are Production (1,408 | 5.1%), Material Moving (1,144 | 4.2%), and Transportation (1,003 | 3.6%).
Production, Transportation and Moving Occupations by Sex
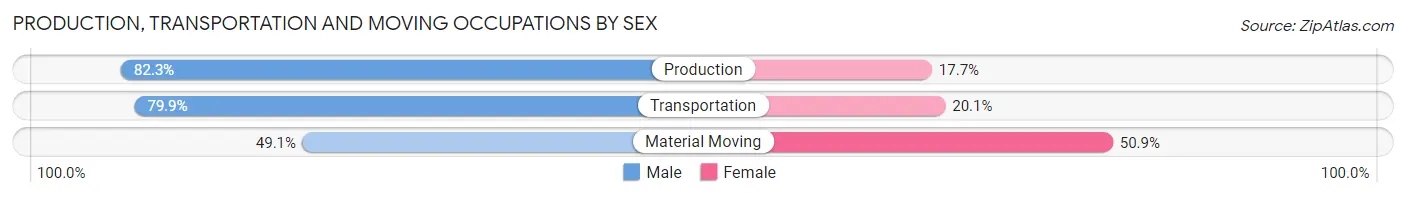
| Occupation | Male | Female |
| Production | 1,159 (82.3%) | 249 (17.7%) |
| Transportation | 801 (79.9%) | 202 (20.1%) |
| Material Moving | 562 (49.1%) | 582 (50.9%) |
| Total (Category) | 2,522 (70.9%) | 1,033 (29.1%) |
| Total (Overall) | 14,173 (51.5%) | 13,326 (48.5%) |
Employment Industries by Sex in Walla Walla County
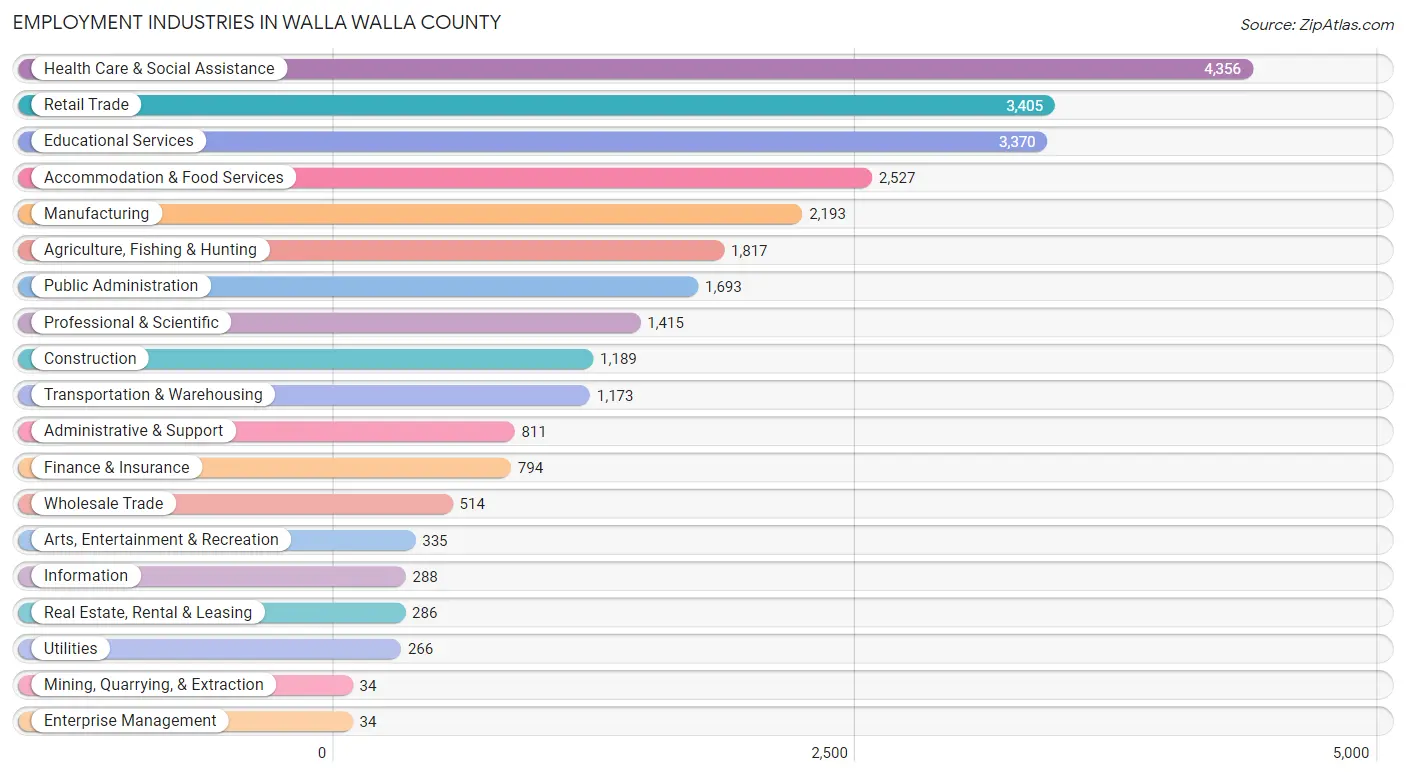
Employment Industries in Walla Walla County
The major employment industries in Walla Walla County include Health Care & Social Assistance (4,356 | 15.8%), Retail Trade (3,405 | 12.4%), Educational Services (3,370 | 12.2%), Accommodation & Food Services (2,527 | 9.2%), and Manufacturing (2,193 | 8.0%).
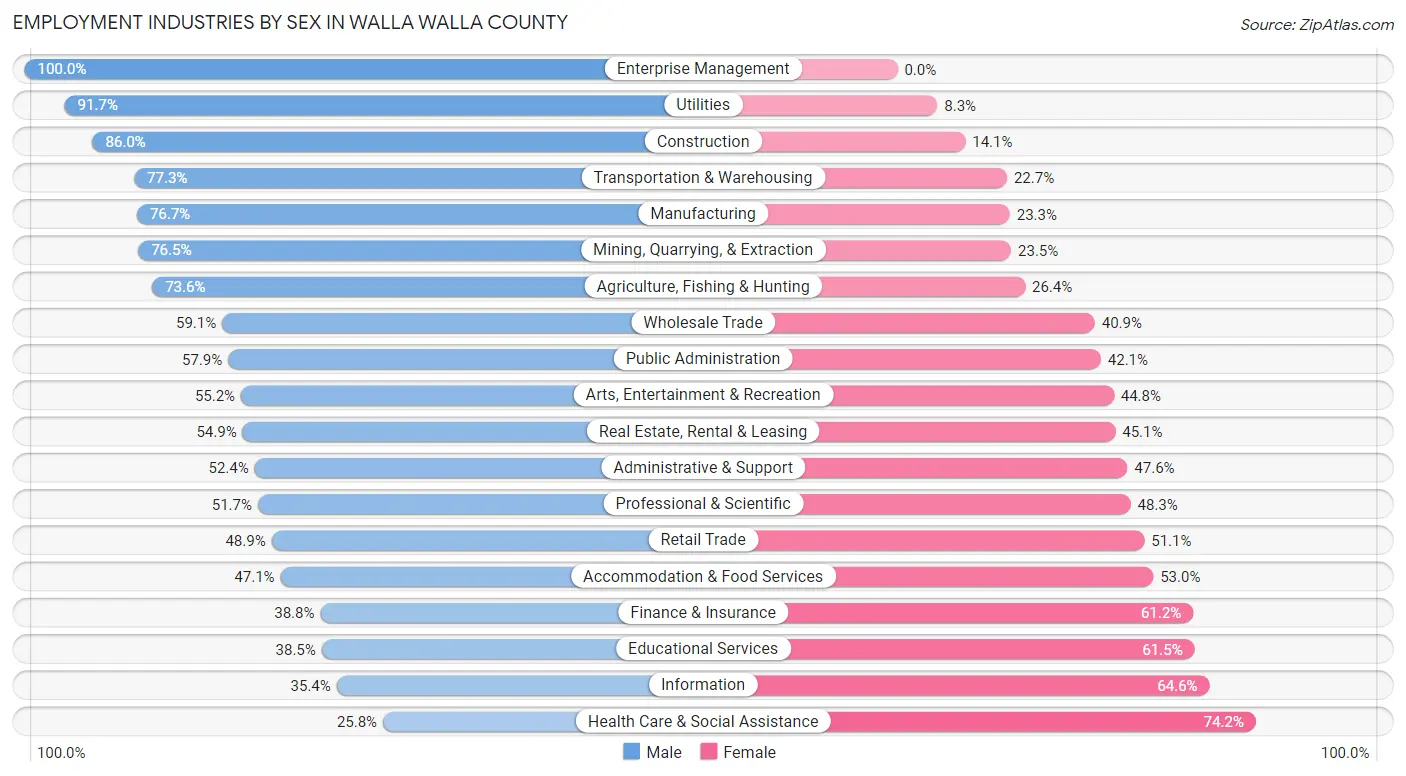
Employment Industries by Sex in Walla Walla County
The Walla Walla County industries that see more men than women are Enterprise Management (100.0%), Utilities (91.7%), and Construction (86.0%), whereas the industries that tend to have a higher number of women are Health Care & Social Assistance (74.2%), Information (64.6%), and Educational Services (61.5%).
| Industry | Male | Female |
| Agriculture, Fishing & Hunting | 1,337 (73.6%) | 480 (26.4%) |
| Mining, Quarrying, & Extraction | 26 (76.5%) | 8 (23.5%) |
| Construction | 1,022 (86.0%) | 167 (14.1%) |
| Manufacturing | 1,683 (76.7%) | 510 (23.3%) |
| Wholesale Trade | 304 (59.1%) | 210 (40.9%) |
| Retail Trade | 1,665 (48.9%) | 1,740 (51.1%) |
| Transportation & Warehousing | 907 (77.3%) | 266 (22.7%) |
| Utilities | 244 (91.7%) | 22 (8.3%) |
| Information | 102 (35.4%) | 186 (64.6%) |
| Finance & Insurance | 308 (38.8%) | 486 (61.2%) |
| Real Estate, Rental & Leasing | 157 (54.9%) | 129 (45.1%) |
| Professional & Scientific | 732 (51.7%) | 683 (48.3%) |
| Enterprise Management | 34 (100.0%) | 0 (0.0%) |
| Administrative & Support | 425 (52.4%) | 386 (47.6%) |
| Educational Services | 1,298 (38.5%) | 2,072 (61.5%) |
| Health Care & Social Assistance | 1,125 (25.8%) | 3,231 (74.2%) |
| Arts, Entertainment & Recreation | 185 (55.2%) | 150 (44.8%) |
| Accommodation & Food Services | 1,189 (47.0%) | 1,338 (52.9%) |
| Public Administration | 980 (57.9%) | 713 (42.1%) |
| Total | 14,173 (51.5%) | 13,326 (48.5%) |
Education in Walla Walla County
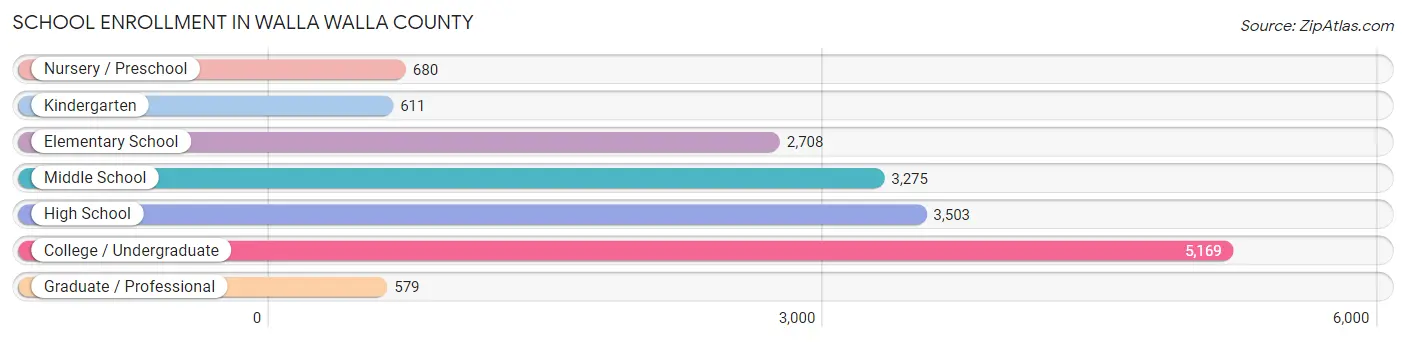
School Enrollment in Walla Walla County
The most common levels of schooling among the 16,525 students in Walla Walla County are college / undergraduate (5,169 | 31.3%), high school (3,503 | 21.2%), and middle school (3,275 | 19.8%).
| School Level | # Students | % Students |
| Nursery / Preschool | 680 | 4.1% |
| Kindergarten | 611 | 3.7% |
| Elementary School | 2,708 | 16.4% |
| Middle School | 3,275 | 19.8% |
| High School | 3,503 | 21.2% |
| College / Undergraduate | 5,169 | 31.3% |
| Graduate / Professional | 579 | 3.5% |
| Total | 16,525 | 100.0% |
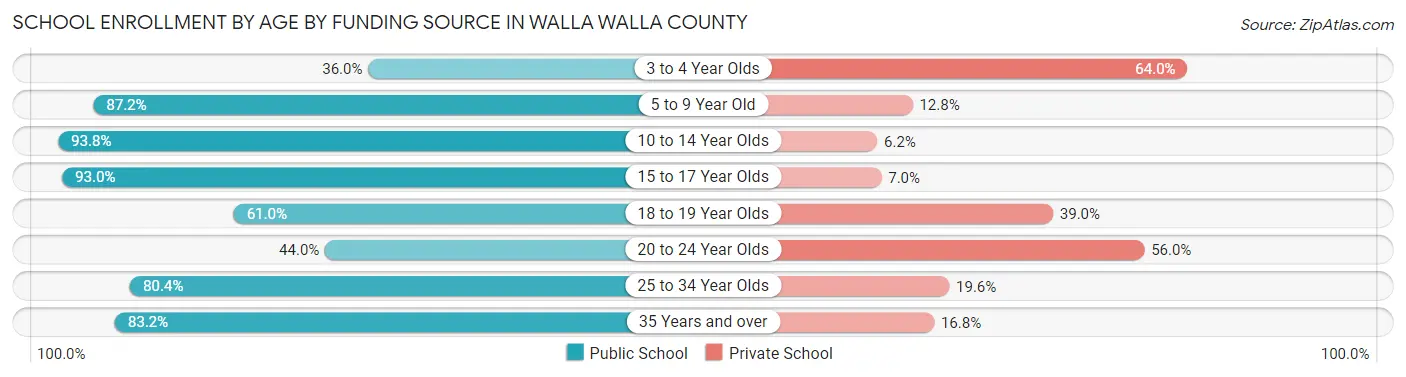
School Enrollment by Age by Funding Source in Walla Walla County
Out of a total of 16,525 students who are enrolled in schools in Walla Walla County, 3,784 (22.9%) attend a private institution, while the remaining 12,741 (77.1%) are enrolled in public schools. The age group of 3 to 4 year olds has the highest likelihood of being enrolled in private schools, with 315 (64.0% in the age bracket) enrolled. Conversely, the age group of 10 to 14 year olds has the lowest likelihood of being enrolled in a private school, with 3,670 (93.8% in the age bracket) attending a public institution.
| Age Bracket | Public School | Private School |
| 3 to 4 Year Olds | 177 (36.0%) | 315 (64.0%) |
| 5 to 9 Year Old | 2,624 (87.2%) | 386 (12.8%) |
| 10 to 14 Year Olds | 3,670 (93.8%) | 244 (6.2%) |
| 15 to 17 Year Olds | 2,152 (93.0%) | 162 (7.0%) |
| 18 to 19 Year Olds | 1,485 (61.0%) | 948 (39.0%) |
| 20 to 24 Year Olds | 1,089 (44.0%) | 1,385 (56.0%) |
| 25 to 34 Year Olds | 896 (80.4%) | 219 (19.6%) |
| 35 Years and over | 643 (83.2%) | 130 (16.8%) |
| Total | 12,741 (77.1%) | 3,784 (22.9%) |
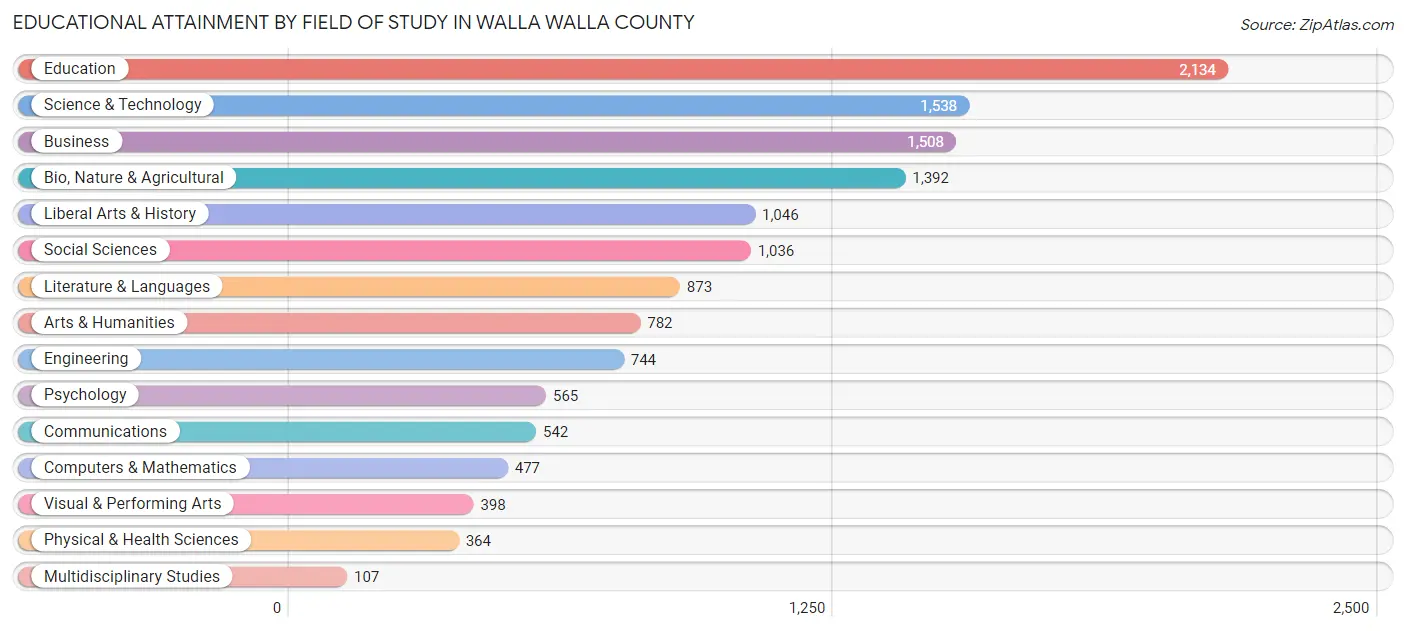
Educational Attainment by Field of Study in Walla Walla County
Education (2,134 | 15.8%), science & technology (1,538 | 11.4%), business (1,508 | 11.2%), bio, nature & agricultural (1,392 | 10.3%), and liberal arts & history (1,046 | 7.7%) are the most common fields of study among 13,506 individuals in Walla Walla County who have obtained a bachelor's degree or higher.
| Field of Study | # Graduates | % Graduates |
| Computers & Mathematics | 477 | 3.5% |
| Bio, Nature & Agricultural | 1,392 | 10.3% |
| Physical & Health Sciences | 364 | 2.7% |
| Psychology | 565 | 4.2% |
| Social Sciences | 1,036 | 7.7% |
| Engineering | 744 | 5.5% |
| Multidisciplinary Studies | 107 | 0.8% |
| Science & Technology | 1,538 | 11.4% |
| Business | 1,508 | 11.2% |
| Education | 2,134 | 15.8% |
| Literature & Languages | 873 | 6.5% |
| Liberal Arts & History | 1,046 | 7.7% |
| Visual & Performing Arts | 398 | 2.9% |
| Communications | 542 | 4.0% |
| Arts & Humanities | 782 | 5.8% |
| Total | 13,506 | 100.0% |
Transportation & Commute in Walla Walla County
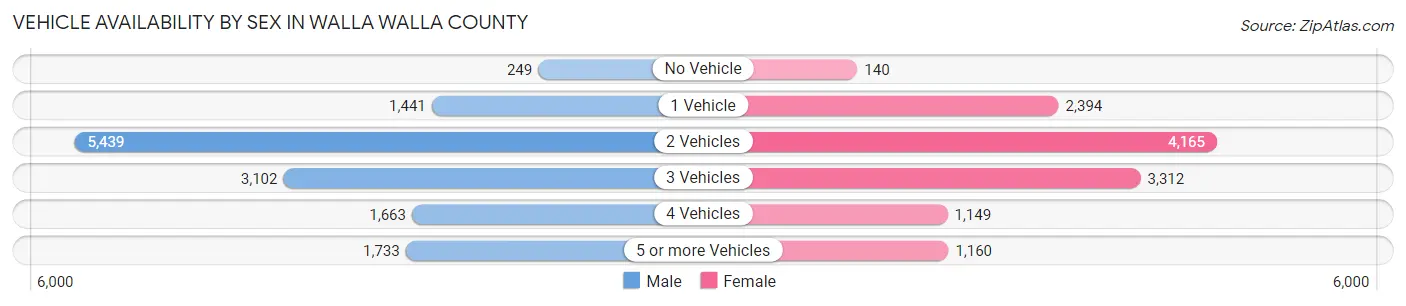
Vehicle Availability by Sex in Walla Walla County
The most prevalent vehicle ownership categories in Walla Walla County are males with 2 vehicles (5,439, accounting for 39.9%) and females with 2 vehicles (4,165, making up 44.2%).
| Vehicles Available | Male | Female |
| No Vehicle | 249 (1.8%) | 140 (1.1%) |
| 1 Vehicle | 1,441 (10.6%) | 2,394 (19.4%) |
| 2 Vehicles | 5,439 (39.9%) | 4,165 (33.8%) |
| 3 Vehicles | 3,102 (22.8%) | 3,312 (26.9%) |
| 4 Vehicles | 1,663 (12.2%) | 1,149 (9.3%) |
| 5 or more Vehicles | 1,733 (12.7%) | 1,160 (9.4%) |
| Total | 13,627 (100.0%) | 12,320 (100.0%) |
Commute Time in Walla Walla County
The most frequently occuring commute durations in Walla Walla County are 5 to 9 minutes (6,617 commuters, 27.4%), 10 to 14 minutes (6,189 commuters, 25.6%), and 15 to 19 minutes (3,904 commuters, 16.2%).
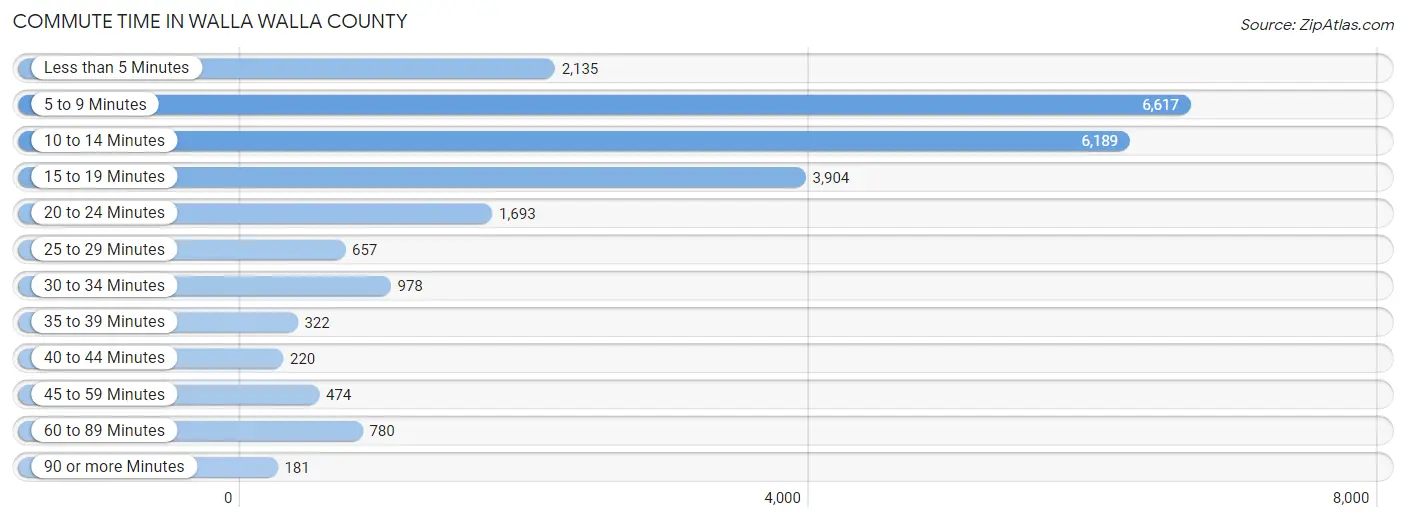
| Commute Time | # Commuters | % Commuters |
| Less than 5 Minutes | 2,135 | 8.8% |
| 5 to 9 Minutes | 6,617 | 27.4% |
| 10 to 14 Minutes | 6,189 | 25.6% |
| 15 to 19 Minutes | 3,904 | 16.2% |
| 20 to 24 Minutes | 1,693 | 7.0% |
| 25 to 29 Minutes | 657 | 2.7% |
| 30 to 34 Minutes | 978 | 4.1% |
| 35 to 39 Minutes | 322 | 1.3% |
| 40 to 44 Minutes | 220 | 0.9% |
| 45 to 59 Minutes | 474 | 2.0% |
| 60 to 89 Minutes | 780 | 3.2% |
| 90 or more Minutes | 181 | 0.7% |
Commute Time by Sex in Walla Walla County
The most common commute times in Walla Walla County are 5 to 9 minutes (3,384 commuters, 26.4%) for males and 5 to 9 minutes (3,233 commuters, 28.5%) for females.
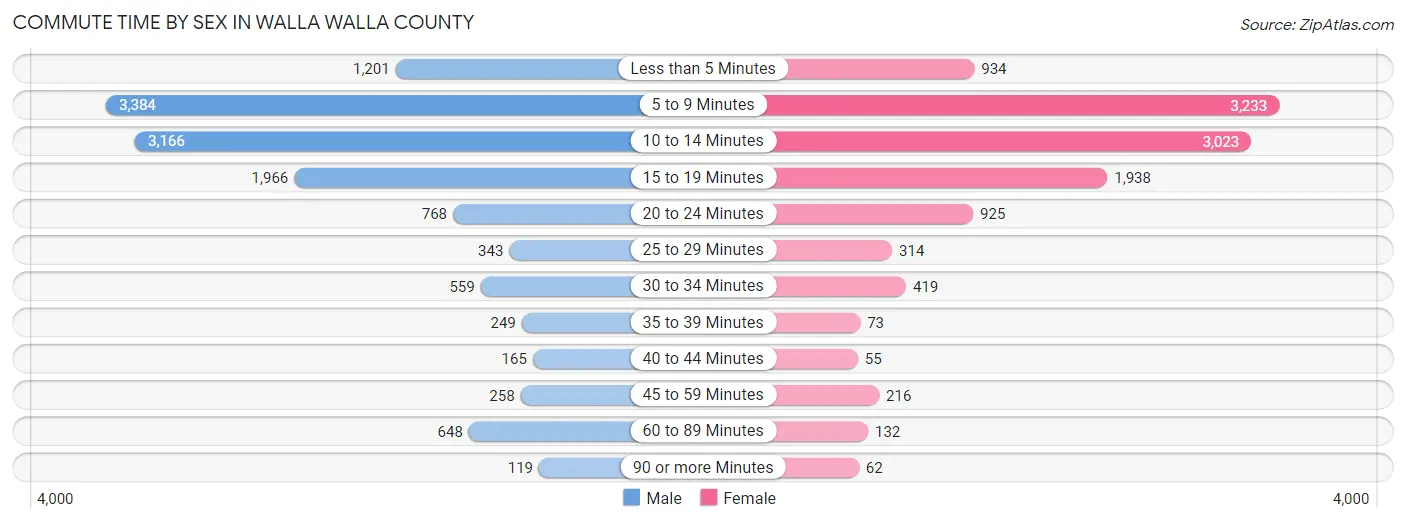
| Commute Time | Male | Female |
| Less than 5 Minutes | 1,201 (9.4%) | 934 (8.3%) |
| 5 to 9 Minutes | 3,384 (26.4%) | 3,233 (28.5%) |
| 10 to 14 Minutes | 3,166 (24.7%) | 3,023 (26.7%) |
| 15 to 19 Minutes | 1,966 (15.3%) | 1,938 (17.1%) |
| 20 to 24 Minutes | 768 (6.0%) | 925 (8.2%) |
| 25 to 29 Minutes | 343 (2.7%) | 314 (2.8%) |
| 30 to 34 Minutes | 559 (4.4%) | 419 (3.7%) |
| 35 to 39 Minutes | 249 (1.9%) | 73 (0.6%) |
| 40 to 44 Minutes | 165 (1.3%) | 55 (0.5%) |
| 45 to 59 Minutes | 258 (2.0%) | 216 (1.9%) |
| 60 to 89 Minutes | 648 (5.1%) | 132 (1.2%) |
| 90 or more Minutes | 119 (0.9%) | 62 (0.5%) |
Time of Departure to Work by Sex in Walla Walla County
The most frequent times of departure to work in Walla Walla County are 7:30 AM to 7:59 AM (1,958, 15.3%) for males and 7:30 AM to 7:59 AM (1,639, 14.5%) for females.
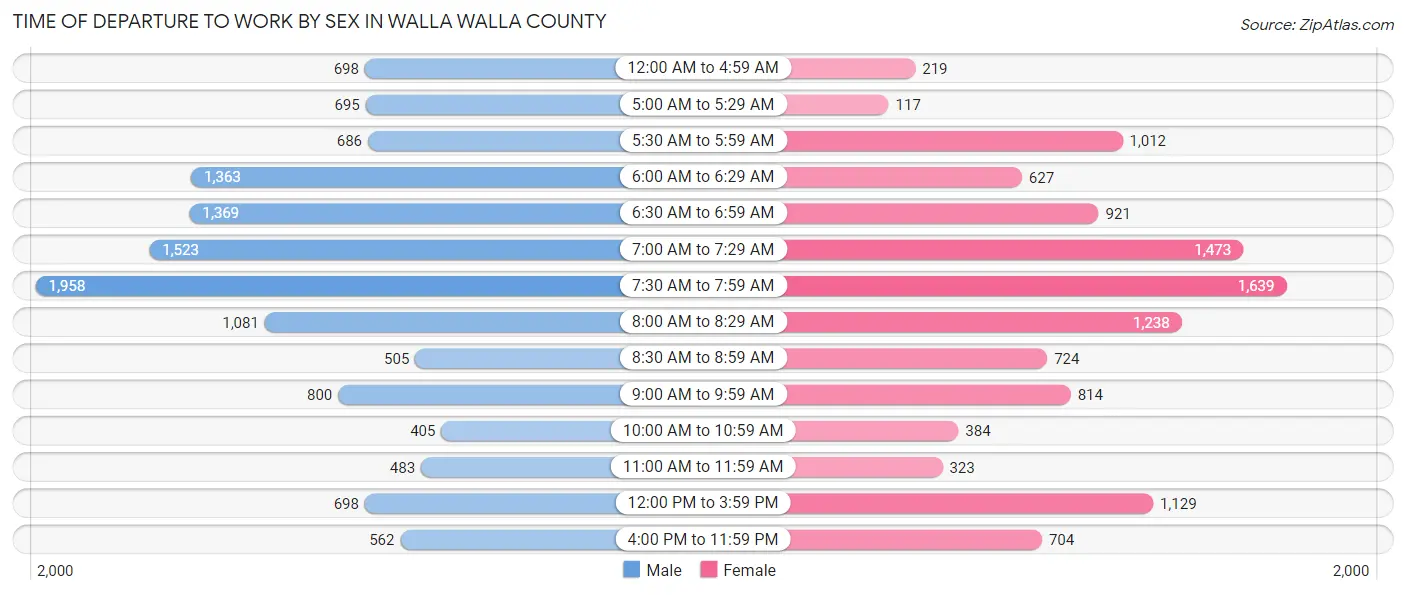
| Time of Departure | Male | Female |
| 12:00 AM to 4:59 AM | 698 (5.4%) | 219 (1.9%) |
| 5:00 AM to 5:29 AM | 695 (5.4%) | 117 (1.0%) |
| 5:30 AM to 5:59 AM | 686 (5.3%) | 1,012 (8.9%) |
| 6:00 AM to 6:29 AM | 1,363 (10.6%) | 627 (5.5%) |
| 6:30 AM to 6:59 AM | 1,369 (10.7%) | 921 (8.1%) |
| 7:00 AM to 7:29 AM | 1,523 (11.9%) | 1,473 (13.0%) |
| 7:30 AM to 7:59 AM | 1,958 (15.3%) | 1,639 (14.5%) |
| 8:00 AM to 8:29 AM | 1,081 (8.4%) | 1,238 (10.9%) |
| 8:30 AM to 8:59 AM | 505 (3.9%) | 724 (6.4%) |
| 9:00 AM to 9:59 AM | 800 (6.2%) | 814 (7.2%) |
| 10:00 AM to 10:59 AM | 405 (3.2%) | 384 (3.4%) |
| 11:00 AM to 11:59 AM | 483 (3.8%) | 323 (2.9%) |
| 12:00 PM to 3:59 PM | 698 (5.4%) | 1,129 (10.0%) |
| 4:00 PM to 11:59 PM | 562 (4.4%) | 704 (6.2%) |
| Total | 12,826 (100.0%) | 11,324 (100.0%) |
Housing Occupancy in Walla Walla County
Occupancy by Ownership in Walla Walla County
Of the total 22,978 dwellings in Walla Walla County, owner-occupied units account for 15,200 (66.1%), while renter-occupied units make up 7,778 (33.9%).
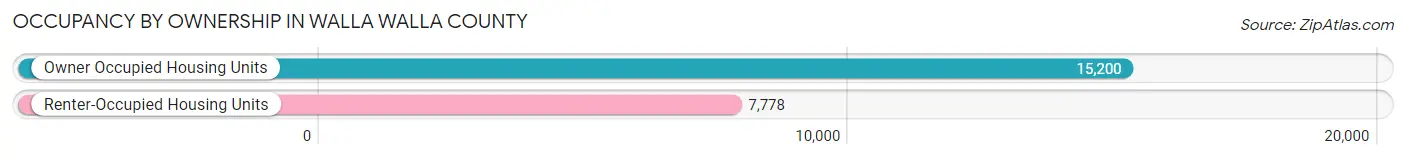
| Occupancy | # Housing Units | % Housing Units |
| Owner Occupied Housing Units | 15,200 | 66.1% |
| Renter-Occupied Housing Units | 7,778 | 33.9% |
| Total Occupied Housing Units | 22,978 | 100.0% |
Occupancy by Household Size in Walla Walla County
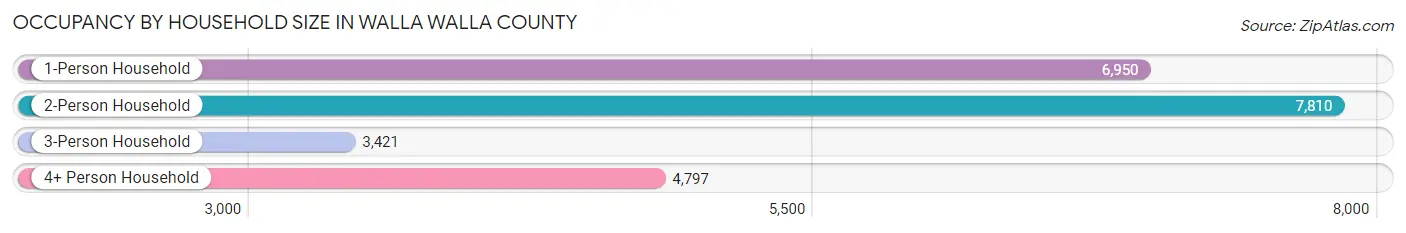
| Household Size | # Housing Units | % Housing Units |
| 1-Person Household | 6,950 | 30.2% |
| 2-Person Household | 7,810 | 34.0% |
| 3-Person Household | 3,421 | 14.9% |
| 4+ Person Household | 4,797 | 20.9% |
| Total Housing Units | 22,978 | 100.0% |
Occupancy by Ownership by Household Size in Walla Walla County
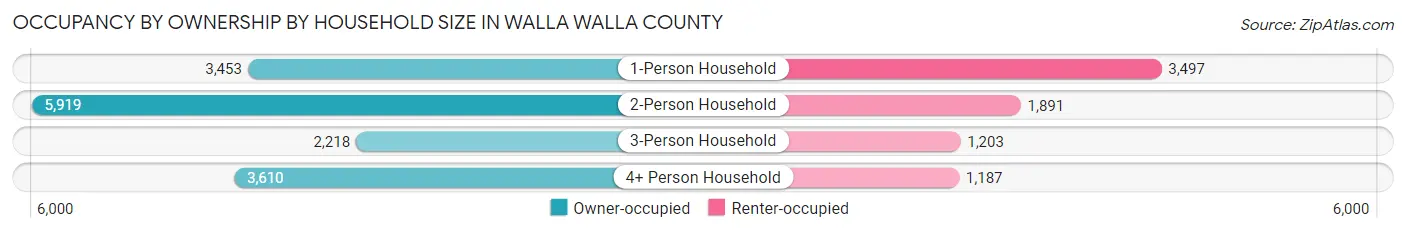
| Household Size | Owner-occupied | Renter-occupied |
| 1-Person Household | 3,453 (49.7%) | 3,497 (50.3%) |
| 2-Person Household | 5,919 (75.8%) | 1,891 (24.2%) |
| 3-Person Household | 2,218 (64.8%) | 1,203 (35.2%) |
| 4+ Person Household | 3,610 (75.3%) | 1,187 (24.7%) |
| Total Housing Units | 15,200 (66.1%) | 7,778 (33.9%) |
Occupancy by Educational Attainment in Walla Walla County
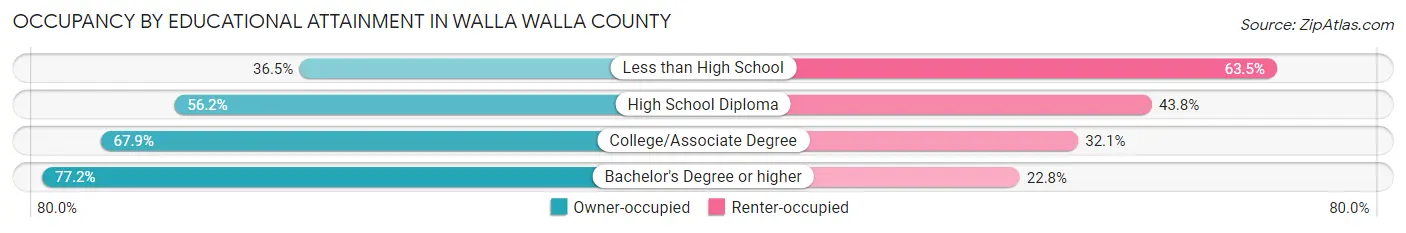
| Household Size | Owner-occupied | Renter-occupied |
| Less than High School | 672 (36.5%) | 1,171 (63.5%) |
| High School Diploma | 2,546 (56.2%) | 1,981 (43.8%) |
| College/Associate Degree | 6,168 (67.9%) | 2,910 (32.1%) |
| Bachelor's Degree or higher | 5,814 (77.2%) | 1,716 (22.8%) |
Occupancy by Age of Householder in Walla Walla County
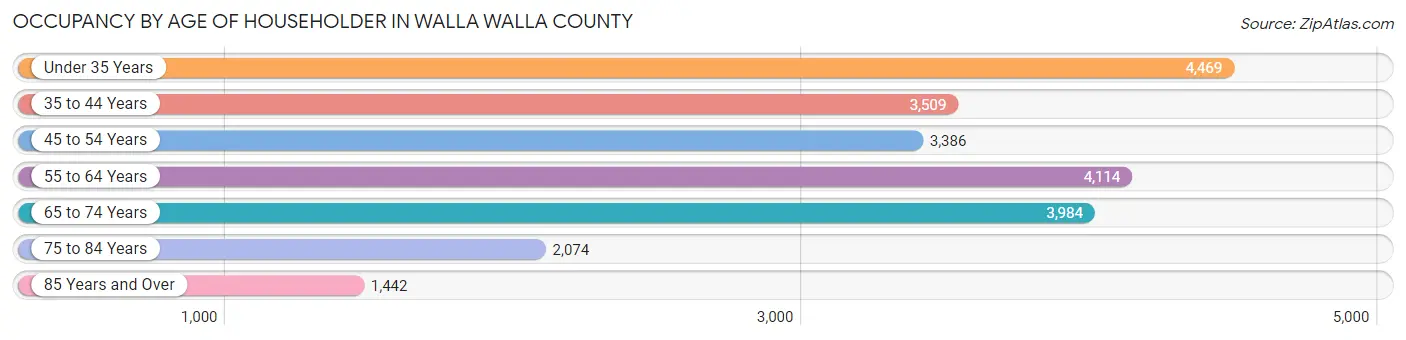
| Age Bracket | # Households | % Households |
| Under 35 Years | 4,469 | 19.5% |
| 35 to 44 Years | 3,509 | 15.3% |
| 45 to 54 Years | 3,386 | 14.7% |
| 55 to 64 Years | 4,114 | 17.9% |
| 65 to 74 Years | 3,984 | 17.3% |
| 75 to 84 Years | 2,074 | 9.0% |
| 85 Years and Over | 1,442 | 6.3% |
| Total | 22,978 | 100.0% |
Housing Finances in Walla Walla County
Median Income by Occupancy in Walla Walla County
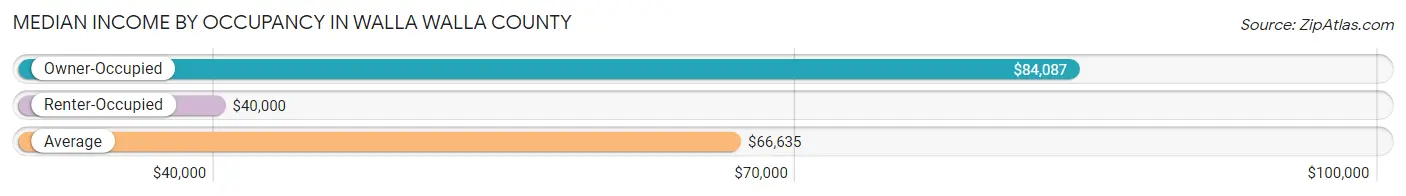
| Occupancy Type | # Households | Median Income |
| Owner-Occupied | 15,200 (66.1%) | $84,087 |
| Renter-Occupied | 7,778 (33.9%) | $40,000 |
| Average | 22,978 (100.0%) | $66,635 |
Occupancy by Householder Income Bracket in Walla Walla County
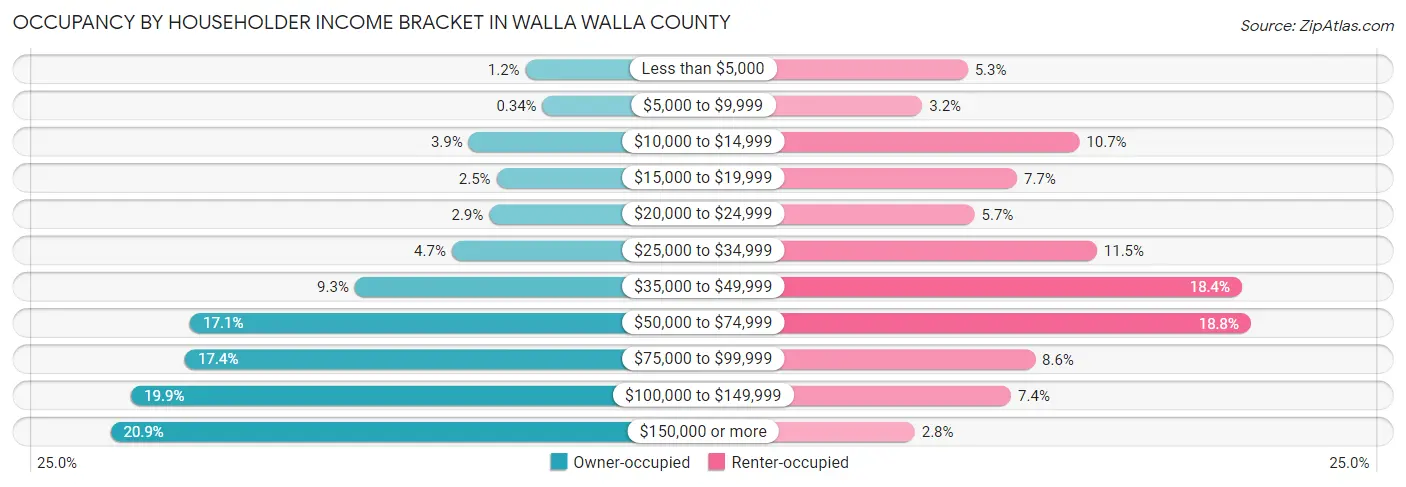
| Income Bracket | Owner-occupied | Renter-occupied |
| Less than $5,000 | 175 (1.1%) | 415 (5.3%) |
| $5,000 to $9,999 | 52 (0.3%) | 247 (3.2%) |
| $10,000 to $14,999 | 586 (3.9%) | 829 (10.7%) |
| $15,000 to $19,999 | 384 (2.5%) | 598 (7.7%) |
| $20,000 to $24,999 | 437 (2.9%) | 441 (5.7%) |
| $25,000 to $34,999 | 708 (4.7%) | 894 (11.5%) |
| $35,000 to $49,999 | 1,411 (9.3%) | 1,430 (18.4%) |
| $50,000 to $74,999 | 2,602 (17.1%) | 1,464 (18.8%) |
| $75,000 to $99,999 | 2,638 (17.4%) | 665 (8.6%) |
| $100,000 to $149,999 | 3,029 (19.9%) | 576 (7.4%) |
| $150,000 or more | 3,178 (20.9%) | 219 (2.8%) |
| Total | 15,200 (100.0%) | 7,778 (100.0%) |
Monthly Housing Cost Tiers in Walla Walla County
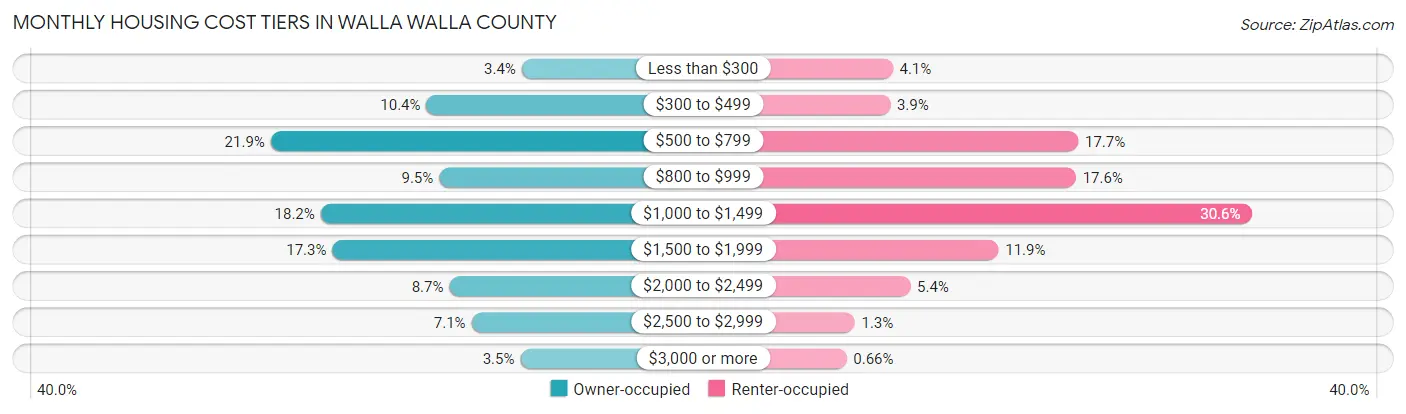
| Monthly Cost | Owner-occupied | Renter-occupied |
| Less than $300 | 515 (3.4%) | 316 (4.1%) |
| $300 to $499 | 1,583 (10.4%) | 301 (3.9%) |
| $500 to $799 | 3,326 (21.9%) | 1,378 (17.7%) |
| $800 to $999 | 1,440 (9.5%) | 1,365 (17.5%) |
| $1,000 to $1,499 | 2,767 (18.2%) | 2,376 (30.5%) |
| $1,500 to $1,999 | 2,636 (17.3%) | 922 (11.8%) |
| $2,000 to $2,499 | 1,325 (8.7%) | 416 (5.3%) |
| $2,500 to $2,999 | 1,077 (7.1%) | 98 (1.3%) |
| $3,000 or more | 531 (3.5%) | 51 (0.7%) |
| Total | 15,200 (100.0%) | 7,778 (100.0%) |
Physical Housing Characteristics in Walla Walla County
Housing Structures in Walla Walla County
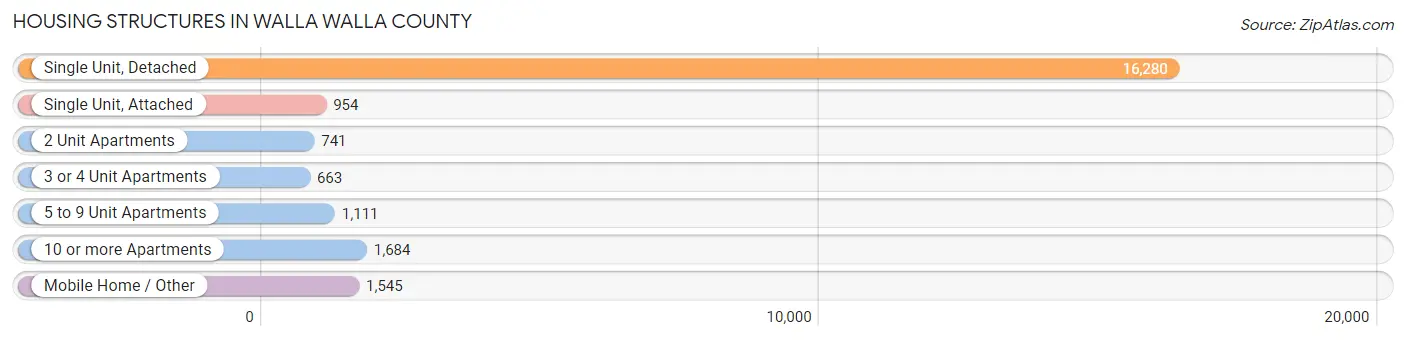
| Structure Type | # Housing Units | % Housing Units |
| Single Unit, Detached | 16,280 | 70.9% |
| Single Unit, Attached | 954 | 4.2% |
| 2 Unit Apartments | 741 | 3.2% |
| 3 or 4 Unit Apartments | 663 | 2.9% |
| 5 to 9 Unit Apartments | 1,111 | 4.8% |
| 10 or more Apartments | 1,684 | 7.3% |
| Mobile Home / Other | 1,545 | 6.7% |
| Total | 22,978 | 100.0% |
Housing Structures by Occupancy in Walla Walla County
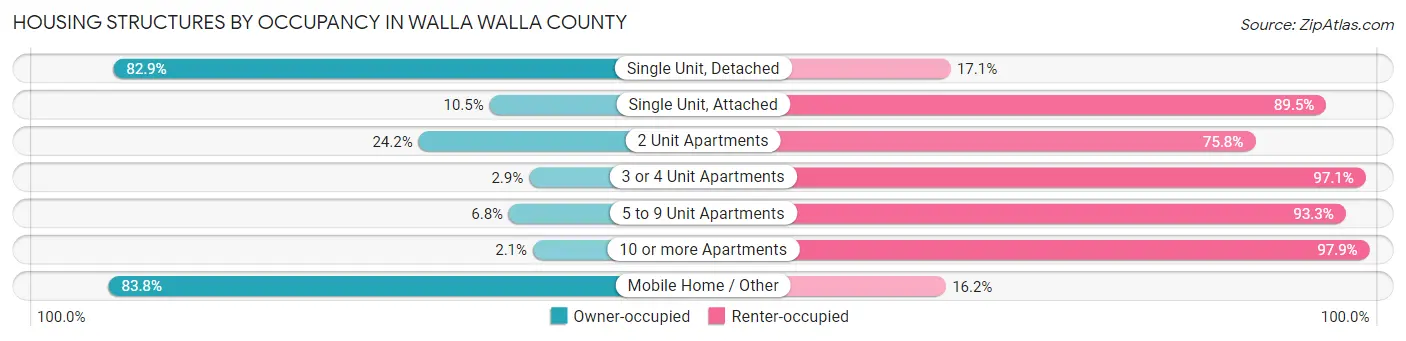
| Structure Type | Owner-occupied | Renter-occupied |
| Single Unit, Detached | 13,496 (82.9%) | 2,784 (17.1%) |
| Single Unit, Attached | 100 (10.5%) | 854 (89.5%) |
| 2 Unit Apartments | 179 (24.2%) | 562 (75.8%) |
| 3 or 4 Unit Apartments | 19 (2.9%) | 644 (97.1%) |
| 5 to 9 Unit Apartments | 75 (6.8%) | 1,036 (93.2%) |
| 10 or more Apartments | 36 (2.1%) | 1,648 (97.9%) |
| Mobile Home / Other | 1,295 (83.8%) | 250 (16.2%) |
| Total | 15,200 (66.1%) | 7,778 (33.9%) |
Housing Structures by Number of Rooms in Walla Walla County
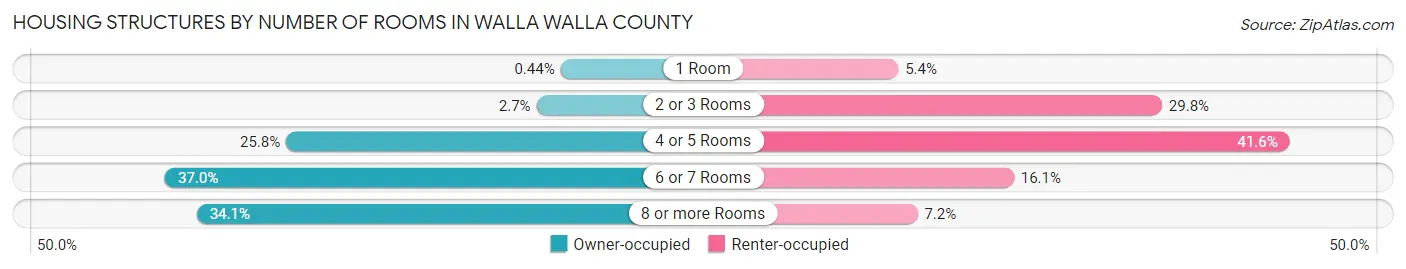
| Number of Rooms | Owner-occupied | Renter-occupied |
| 1 Room | 67 (0.4%) | 419 (5.4%) |
| 2 or 3 Rooms | 404 (2.7%) | 2,316 (29.8%) |
| 4 or 5 Rooms | 3,924 (25.8%) | 3,234 (41.6%) |
| 6 or 7 Rooms | 5,625 (37.0%) | 1,251 (16.1%) |
| 8 or more Rooms | 5,180 (34.1%) | 558 (7.2%) |
| Total | 15,200 (100.0%) | 7,778 (100.0%) |
Housing Structure by Heating Type in Walla Walla County
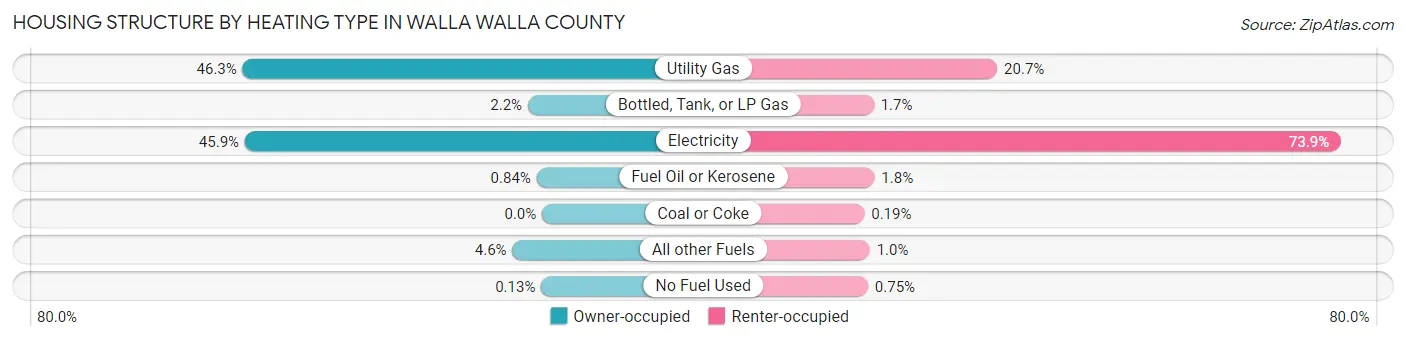
| Heating Type | Owner-occupied | Renter-occupied |
| Utility Gas | 7,038 (46.3%) | 1,612 (20.7%) |
| Bottled, Tank, or LP Gas | 333 (2.2%) | 128 (1.7%) |
| Electricity | 6,983 (45.9%) | 5,748 (73.9%) |
| Fuel Oil or Kerosene | 128 (0.8%) | 137 (1.8%) |
| Coal or Coke | 0 (0.0%) | 15 (0.2%) |
| All other Fuels | 698 (4.6%) | 80 (1.0%) |
| No Fuel Used | 20 (0.1%) | 58 (0.7%) |
| Total | 15,200 (100.0%) | 7,778 (100.0%) |
Household Vehicle Usage in Walla Walla County
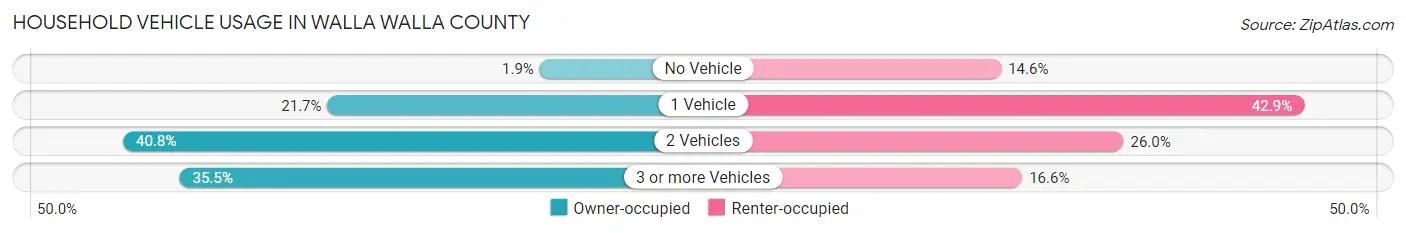
| Vehicles per Household | Owner-occupied | Renter-occupied |
| No Vehicle | 292 (1.9%) | 1,135 (14.6%) |
| 1 Vehicle | 3,305 (21.7%) | 3,333 (42.8%) |
| 2 Vehicles | 6,203 (40.8%) | 2,023 (26.0%) |
| 3 or more Vehicles | 5,400 (35.5%) | 1,287 (16.6%) |
| Total | 15,200 (100.0%) | 7,778 (100.0%) |
Real Estate & Mortgages in Walla Walla County
Real Estate and Mortgage Overview in Walla Walla County
| Characteristic | Without Mortgage | With Mortgage |
| Housing Units | 6,689 | 8,511 |
| Median Property Value | $309,300 | $347,600 |
| Median Household Income | $63,293 | $2,124 |
| Monthly Housing Costs | $591 | $519 |
| Real Estate Taxes | $2,890 | $175 |
Property Value by Mortgage Status in Walla Walla County
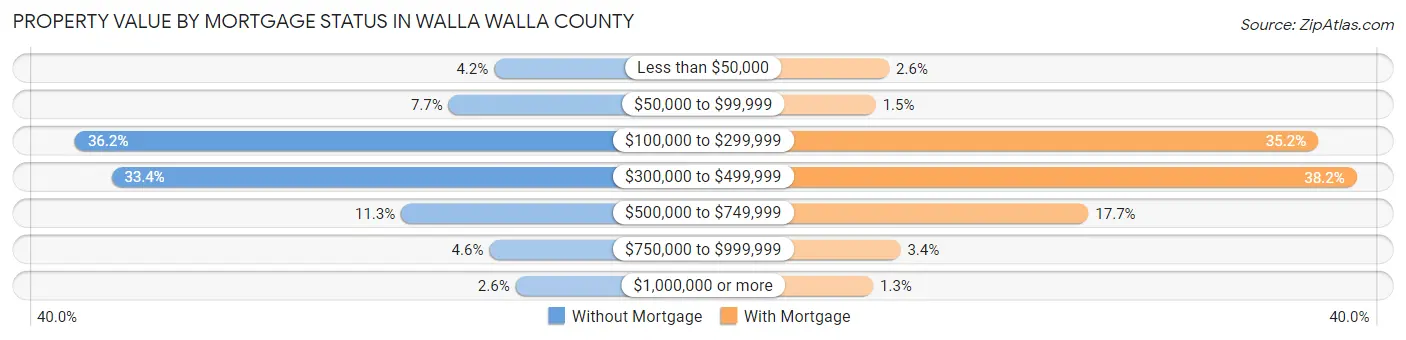
| Property Value | Without Mortgage | With Mortgage |
| Less than $50,000 | 283 (4.2%) | 218 (2.6%) |
| $50,000 to $99,999 | 515 (7.7%) | 131 (1.5%) |
| $100,000 to $299,999 | 2,419 (36.2%) | 2,998 (35.2%) |
| $300,000 to $499,999 | 2,233 (33.4%) | 3,249 (38.2%) |
| $500,000 to $749,999 | 757 (11.3%) | 1,510 (17.7%) |
| $750,000 to $999,999 | 308 (4.6%) | 291 (3.4%) |
| $1,000,000 or more | 174 (2.6%) | 114 (1.3%) |
| Total | 6,689 (100.0%) | 8,511 (100.0%) |
Household Income by Mortgage Status in Walla Walla County
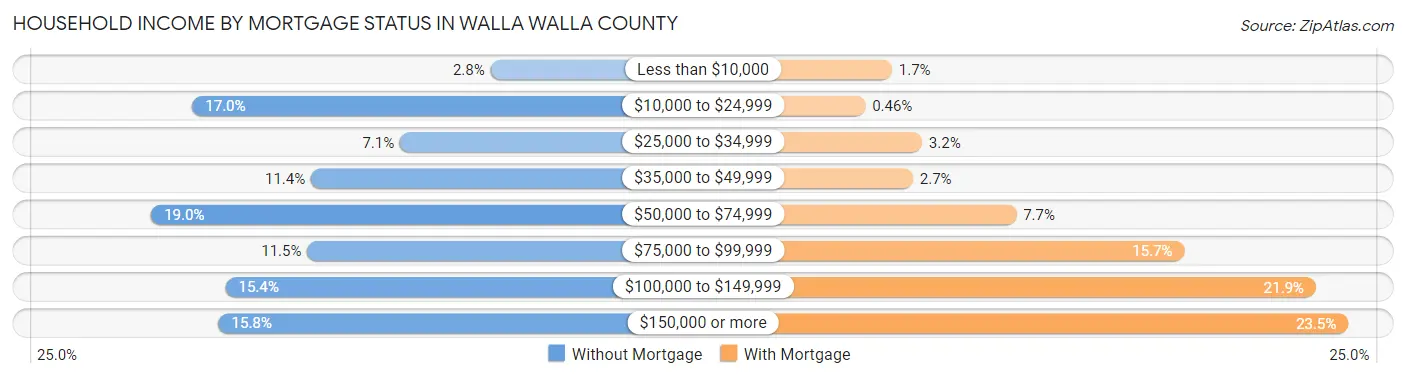
| Household Income | Without Mortgage | With Mortgage |
| Less than $10,000 | 188 (2.8%) | 147 (1.7%) |
| $10,000 to $24,999 | 1,138 (17.0%) | 39 (0.5%) |
| $25,000 to $34,999 | 476 (7.1%) | 269 (3.2%) |
| $35,000 to $49,999 | 760 (11.4%) | 232 (2.7%) |
| $50,000 to $74,999 | 1,269 (19.0%) | 651 (7.6%) |
| $75,000 to $99,999 | 772 (11.5%) | 1,333 (15.7%) |
| $100,000 to $149,999 | 1,032 (15.4%) | 1,866 (21.9%) |
| $150,000 or more | 1,054 (15.8%) | 1,997 (23.5%) |
| Total | 6,689 (100.0%) | 8,511 (100.0%) |
Property Value to Household Income Ratio in Walla Walla County
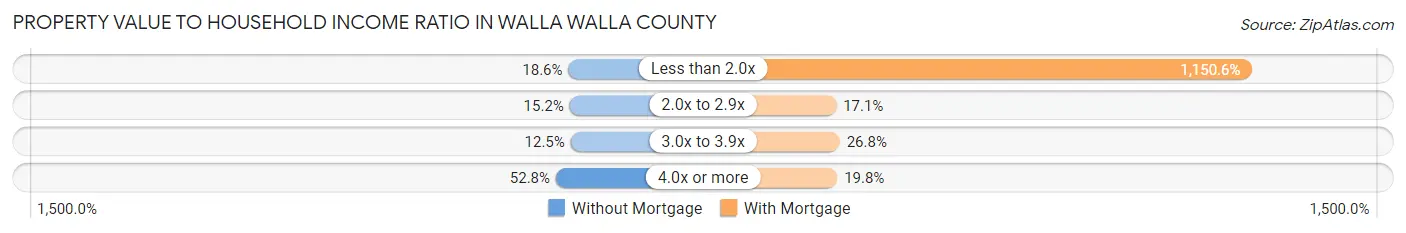
| Value-to-Income Ratio | Without Mortgage | With Mortgage |
| Less than 2.0x | 1,246 (18.6%) | 97,924 (1,150.6%) |
| 2.0x to 2.9x | 1,014 (15.2%) | 1,456 (17.1%) |
| 3.0x to 3.9x | 838 (12.5%) | 2,279 (26.8%) |
| 4.0x or more | 3,534 (52.8%) | 1,689 (19.8%) |
| Total | 6,689 (100.0%) | 8,511 (100.0%) |
Real Estate Taxes by Mortgage Status in Walla Walla County
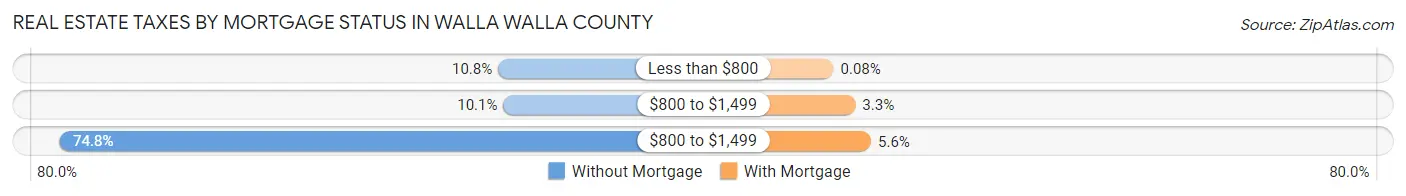
| Property Taxes | Without Mortgage | With Mortgage |
| Less than $800 | 724 (10.8%) | 7 (0.1%) |
| $800 to $1,499 | 672 (10.1%) | 278 (3.3%) |
| $800 to $1,499 | 5,004 (74.8%) | 473 (5.6%) |
| Total | 6,689 (100.0%) | 8,511 (100.0%) |
Health & Disability in Walla Walla County
Health Insurance Coverage by Age in Walla Walla County
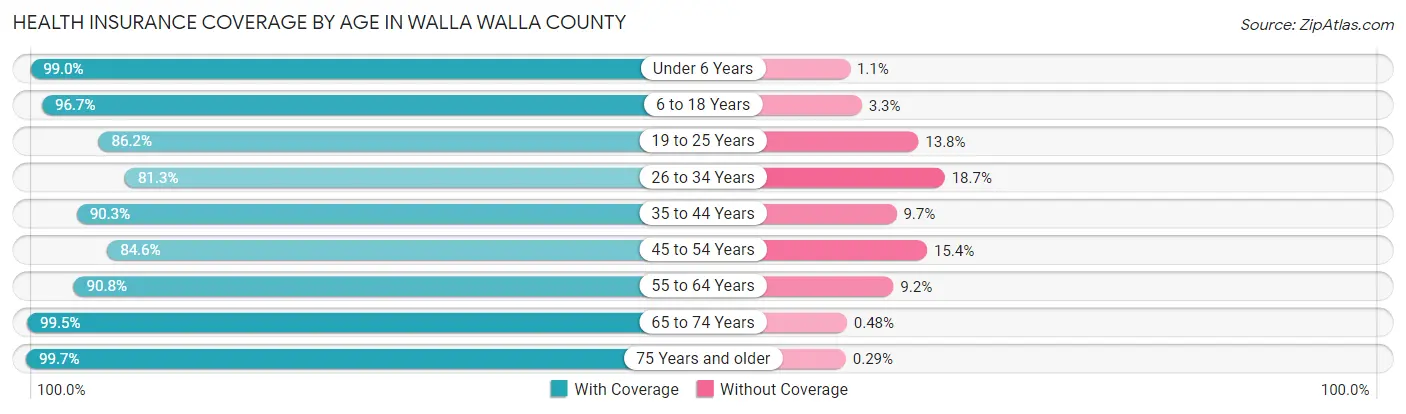
| Age Bracket | With Coverage | Without Coverage |
| Under 6 Years | 3,592 (99.0%) | 38 (1.1%) |
| 6 to 18 Years | 10,247 (96.7%) | 345 (3.3%) |
| 19 to 25 Years | 6,251 (86.2%) | 1,002 (13.8%) |
| 26 to 34 Years | 4,963 (81.3%) | 1,144 (18.7%) |
| 35 to 44 Years | 5,913 (90.3%) | 637 (9.7%) |
| 45 to 54 Years | 5,525 (84.6%) | 1,008 (15.4%) |
| 55 to 64 Years | 6,574 (90.8%) | 663 (9.2%) |
| 65 to 74 Years | 6,384 (99.5%) | 31 (0.5%) |
| 75 Years and older | 5,089 (99.7%) | 15 (0.3%) |
| Total | 54,538 (91.8%) | 4,883 (8.2%) |
Health Insurance Coverage by Citizenship Status in Walla Walla County
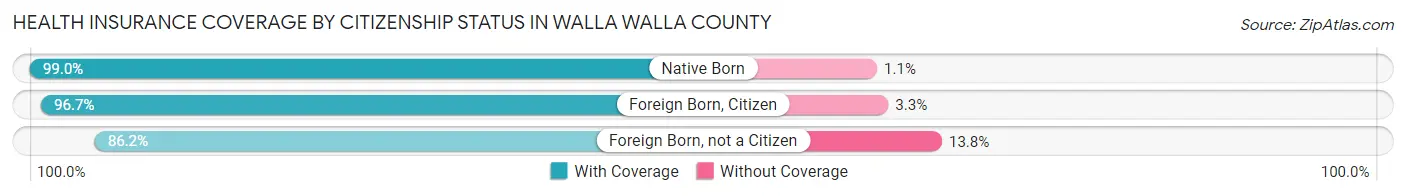
| Citizenship Status | With Coverage | Without Coverage |
| Native Born | 3,592 (99.0%) | 38 (1.1%) |
| Foreign Born, Citizen | 10,247 (96.7%) | 345 (3.3%) |
| Foreign Born, not a Citizen | 6,251 (86.2%) | 1,002 (13.8%) |
Health Insurance Coverage by Household Income in Walla Walla County
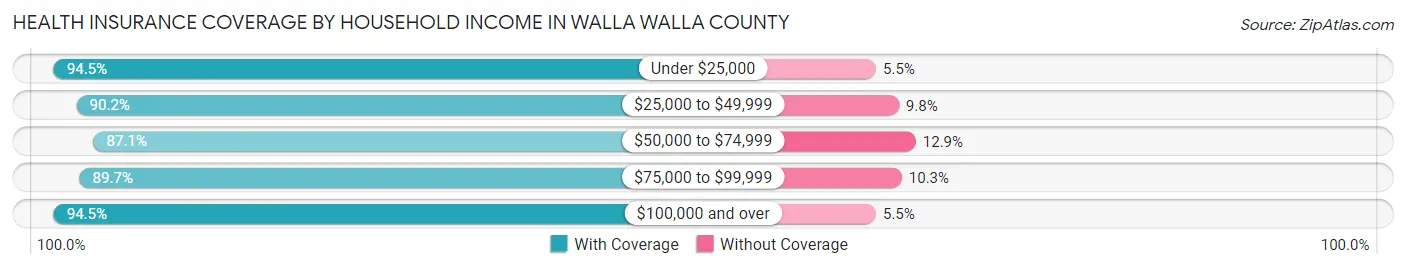
| Household Income | With Coverage | Without Coverage |
| Under $25,000 | 6,079 (94.5%) | 353 (5.5%) |
| $25,000 to $49,999 | 8,542 (90.2%) | 924 (9.8%) |
| $50,000 to $74,999 | 8,426 (87.1%) | 1,252 (12.9%) |
| $75,000 to $99,999 | 8,542 (89.7%) | 983 (10.3%) |
| $100,000 and over | 20,971 (94.5%) | 1,216 (5.5%) |
Public vs Private Health Insurance Coverage by Age in Walla Walla County
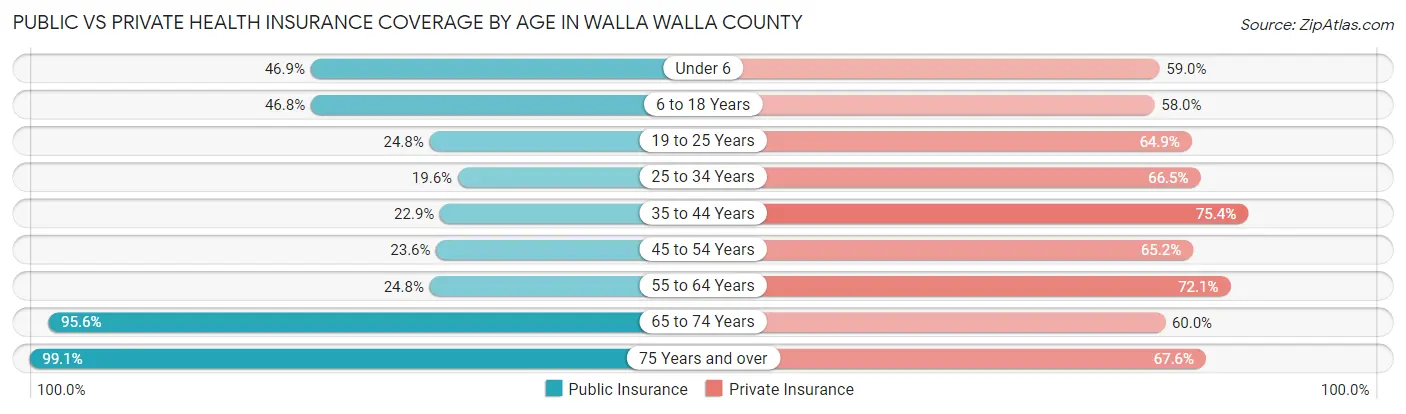
| Age Bracket | Public Insurance | Private Insurance |
| Under 6 | 1,702 (46.9%) | 2,140 (59.0%) |
| 6 to 18 Years | 4,961 (46.8%) | 6,145 (58.0%) |
| 19 to 25 Years | 1,801 (24.8%) | 4,710 (64.9%) |
| 25 to 34 Years | 1,195 (19.6%) | 4,063 (66.5%) |
| 35 to 44 Years | 1,498 (22.9%) | 4,938 (75.4%) |
| 45 to 54 Years | 1,540 (23.6%) | 4,258 (65.2%) |
| 55 to 64 Years | 1,795 (24.8%) | 5,217 (72.1%) |
| 65 to 74 Years | 6,134 (95.6%) | 3,848 (60.0%) |
| 75 Years and over | 5,059 (99.1%) | 3,449 (67.6%) |
| Total | 25,685 (43.2%) | 38,768 (65.2%) |
Disability Status by Sex by Age in Walla Walla County
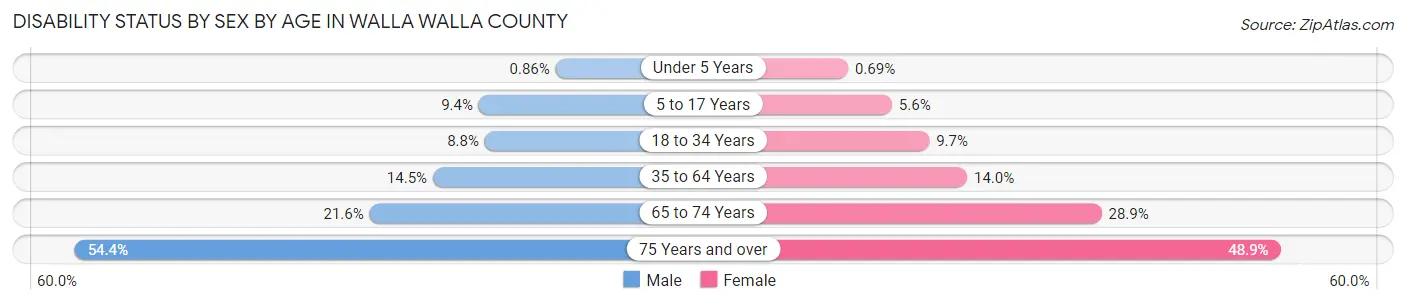
| Age Bracket | Male | Female |
| Under 5 Years | 13 (0.9%) | 11 (0.7%) |
| 5 to 17 Years | 463 (9.4%) | 262 (5.6%) |
| 18 to 34 Years | 633 (8.7%) | 745 (9.7%) |
| 35 to 64 Years | 1,458 (14.5%) | 1,435 (14.0%) |
| 65 to 74 Years | 663 (21.6%) | 967 (28.9%) |
| 75 Years and over | 1,123 (54.4%) | 1,485 (48.8%) |
Disability Class by Sex by Age in Walla Walla County
Disability Class: Hearing Difficulty
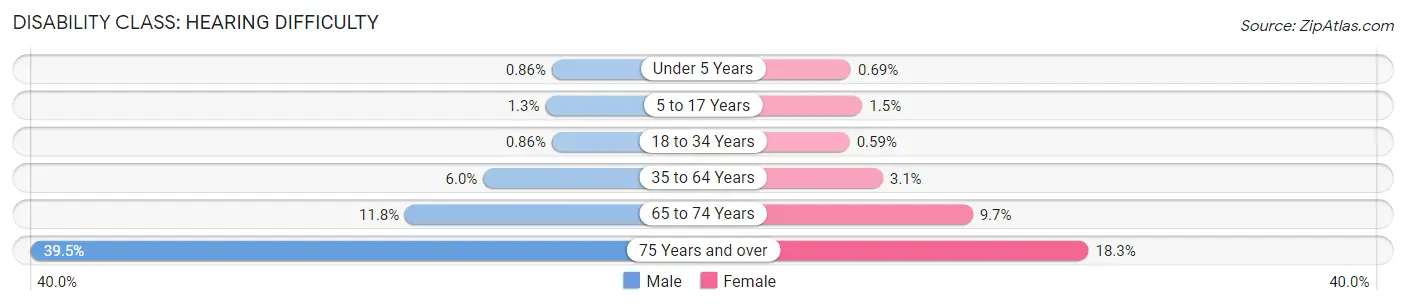
| Age Bracket | Male | Female |
| Under 5 Years | 13 (0.9%) | 11 (0.7%) |
| 5 to 17 Years | 66 (1.3%) | 72 (1.5%) |
| 18 to 34 Years | 62 (0.9%) | 45 (0.6%) |
| 35 to 64 Years | 597 (5.9%) | 314 (3.0%) |
| 65 to 74 Years | 361 (11.7%) | 325 (9.7%) |
| 75 Years and over | 816 (39.5%) | 557 (18.3%) |
Disability Class: Vision Difficulty
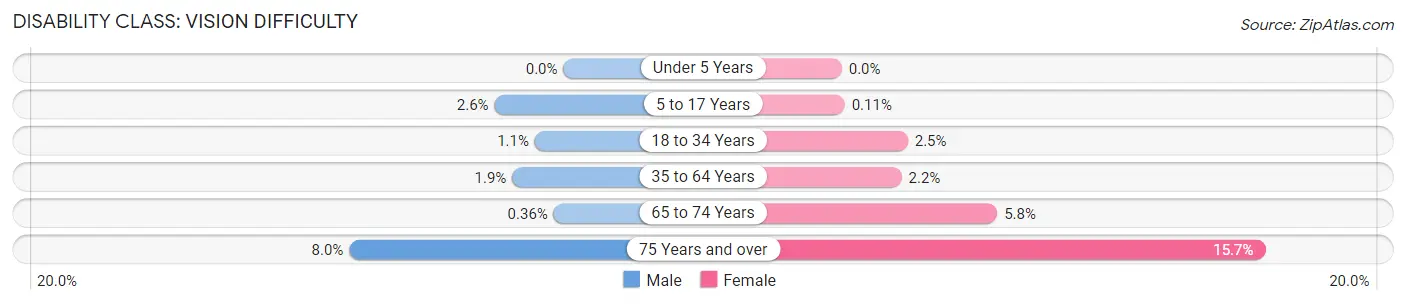
| Age Bracket | Male | Female |
| Under 5 Years | 0 (0.0%) | 0 (0.0%) |
| 5 to 17 Years | 126 (2.6%) | 5 (0.1%) |
| 18 to 34 Years | 77 (1.1%) | 187 (2.5%) |
| 35 to 64 Years | 191 (1.9%) | 228 (2.2%) |
| 65 to 74 Years | 11 (0.4%) | 193 (5.8%) |
| 75 Years and over | 164 (8.0%) | 478 (15.7%) |
Disability Class: Cognitive Difficulty
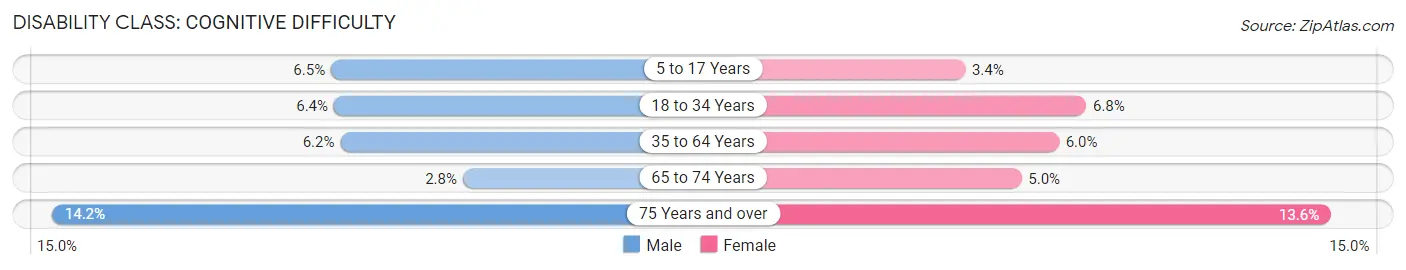
| Age Bracket | Male | Female |
| 5 to 17 Years | 318 (6.5%) | 161 (3.4%) |
| 18 to 34 Years | 462 (6.4%) | 520 (6.8%) |
| 35 to 64 Years | 623 (6.2%) | 621 (6.0%) |
| 65 to 74 Years | 86 (2.8%) | 167 (5.0%) |
| 75 Years and over | 294 (14.2%) | 414 (13.6%) |
Disability Class: Ambulatory Difficulty
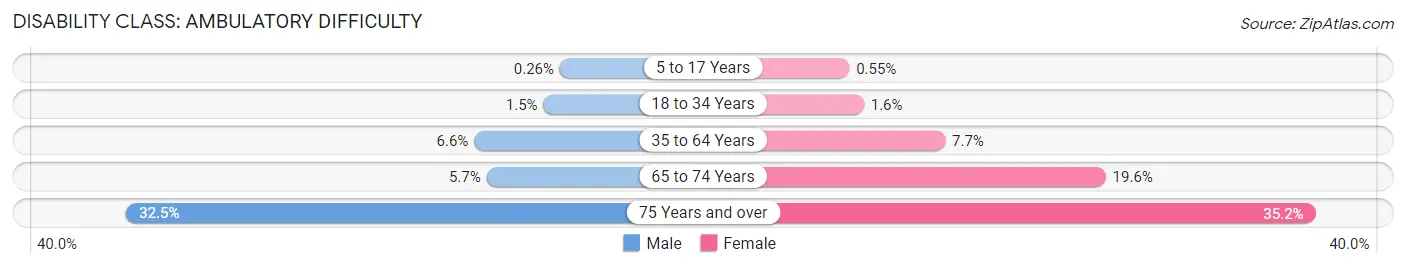
| Age Bracket | Male | Female |
| 5 to 17 Years | 13 (0.3%) | 26 (0.5%) |
| 18 to 34 Years | 107 (1.5%) | 125 (1.6%) |
| 35 to 64 Years | 664 (6.6%) | 789 (7.7%) |
| 65 to 74 Years | 175 (5.7%) | 655 (19.6%) |
| 75 Years and over | 670 (32.5%) | 1,069 (35.2%) |
Disability Class: Self-Care Difficulty
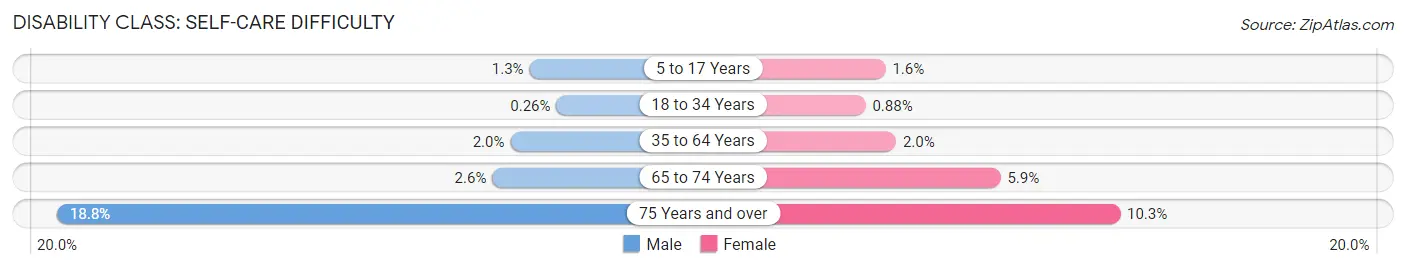
| Age Bracket | Male | Female |
| 5 to 17 Years | 62 (1.3%) | 76 (1.6%) |
| 18 to 34 Years | 19 (0.3%) | 67 (0.9%) |
| 35 to 64 Years | 198 (2.0%) | 207 (2.0%) |
| 65 to 74 Years | 81 (2.6%) | 197 (5.9%) |
| 75 Years and over | 388 (18.8%) | 314 (10.3%) |
Technology Access in Walla Walla County
Computing Device Access in Walla Walla County
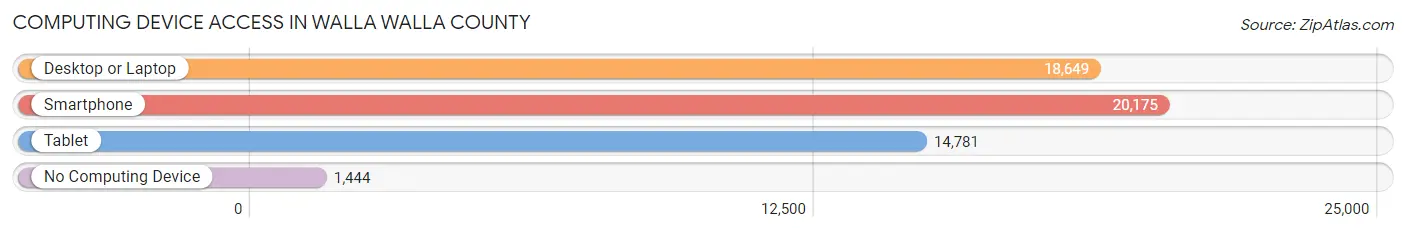
| Device Type | # Households | % Households |
| Desktop or Laptop | 18,649 | 81.2% |
| Smartphone | 20,175 | 87.8% |
| Tablet | 14,781 | 64.3% |
| No Computing Device | 1,444 | 6.3% |
| Total | 22,978 | 100.0% |
Internet Access in Walla Walla County
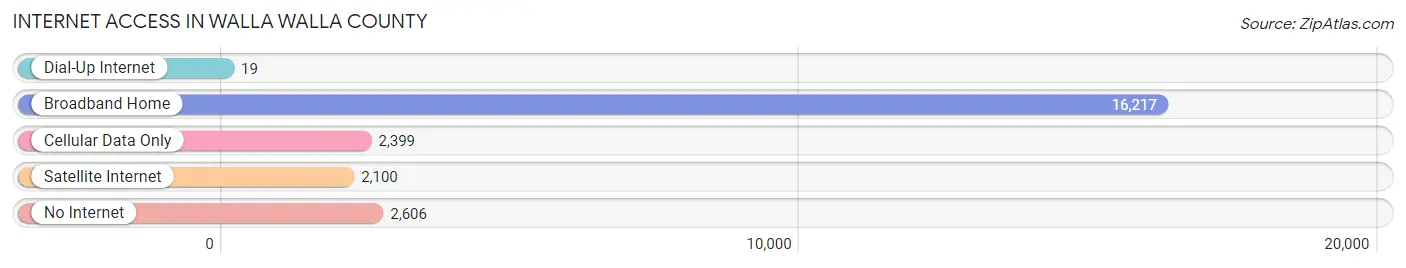
| Internet Type | # Households | % Households |
| Dial-Up Internet | 19 | 0.1% |
| Broadband Home | 16,217 | 70.6% |
| Cellular Data Only | 2,399 | 10.4% |
| Satellite Internet | 2,100 | 9.1% |
| No Internet | 2,606 | 11.3% |
| Total | 22,978 | 100.0% |
Walla Walla County Summary
Walla Walla County is located in the southeastern corner of Washington State, and is bordered by Columbia, Garfield, and Asotin Counties to the north, Umatilla County, Oregon to the east, and Franklin County to the south. The county seat is Walla Walla, and the county is part of the Walla Walla Metropolitan Statistical Area. The county has a total area of 1,299 square miles, of which 1,293 square miles is land and 6.2 square miles is water.
History
The area that is now Walla Walla County was originally inhabited by the Cayuse and Walla Walla Native American tribes. The first non-native settlers arrived in the area in the early 1800s, and the county was officially established in 1854. The county was named after the Walla Walla tribe, and the city of Walla Walla was established in 1855.
The county was an important agricultural center in the late 19th and early 20th centuries, and was home to a number of large wheat farms. The county also had a thriving wine industry, and was home to several wineries.
In the late 20th century, the county experienced a population boom, as people moved to the area for its mild climate and scenic beauty. The county also experienced an economic boom, as new businesses and industries moved to the area.
Geography
Walla Walla County is located in the southeastern corner of Washington State, and is bordered by Columbia, Garfield, and Asotin Counties to the north, Umatilla County, Oregon to the east, and Franklin County to the south. The county has a total area of 1,299 square miles, of which 1,293 square miles is land and 6.2 square miles is water.
The county is located in the Columbia Plateau region of Washington, and is characterized by rolling hills and valleys. The county is home to several rivers, including the Walla Walla River, Touchet River, and Mill Creek. The county is also home to several lakes, including Lake Wallula, Lake Sacajawea, and Lake Umatilla.
Economy
Walla Walla County has a diverse economy, with a mix of agriculture, manufacturing, and services. The county is home to several large agricultural operations, including wheat farms, vineyards, and cattle ranches. The county is also home to several manufacturing companies, including a large food processing plant and a paper mill.
The county is also home to several service-based businesses, including healthcare, education, and retail. The county is home to several hospitals, including Providence St. Mary Medical Center and Walla Walla General Hospital. The county is also home to several colleges and universities, including Walla Walla University and Whitman College.
Demographics
As of the 2010 census, Walla Walla County had a population of 58,781. The population was spread out, with 24.3% under the age of 18, 10.2% from 18 to 24, 25.2% from 25 to 44, 25.2% from 45 to 64, and 15.1% who were 65 years of age or older. The median age was 37.4 years.
The racial makeup of the county was 81.2% White, 1.2% African American, 0.7% Native American, 1.3% Asian, 0.2% Pacific Islander, 11.7% from other races, and 3.7% from two or more races. Hispanic or Latino of any race were 20.2% of the population.
The median income for a household in the county was $45,837, and the median income for a family was $54,945. The per capita income for the county was $22,945. About 11.2% of families and 15.3% of the population were below the poverty line, including 20.2% of those under age 18 and 8.2% of those age 65 or over.
Common Questions
What is the Total Population of Walla Walla County?
Total Population of Walla Walla County is 62,150.
What is the Total Male Population of Walla Walla County?
Total Male Population of Walla Walla County is 31,276.
What is the Total Female Population of Walla Walla County?
Total Female Population of Walla Walla County is 30,874.
What is the Ratio of Males per 100 Females in Walla Walla County?
There are 101.30 Males per 100 Females in Walla Walla County.
What is the Ratio of Females per 100 Males in Walla Walla County?
There are 98.71 Females per 100 Males in Walla Walla County.
What is the Median Population Age in Walla Walla County?
Median Population Age in Walla Walla County is 38.0 Years.
What is the Average Family Size in Walla Walla County
Average Family Size in Walla Walla County is 3.1 People.
What is the Average Household Size in Walla Walla County
Average Household Size in Walla Walla County is 2.5 People.
What is Per Capita Income in Walla Walla County?
Per Capita income in Walla Walla County is $34,476.
What is the Median Family Income in Walla Walla County?
Median Family Income in Walla Walla County is $84,932.
What is the Median Household income in Walla Walla County?
Median Household Income in Walla Walla County is $66,635.
What is Income or Wage Gap in Walla Walla County?
Income or Wage Gap in Walla Walla County is 40.2%.
Women in Walla Walla County earn 59.8 cents for every dollar earned by a man.
What is Family Income Deficit in Walla Walla County?
Family Income Deficit in Walla Walla County is $8,080.
Families that are below poverty line in Walla Walla County earn $8,080 less on average than the poverty threshold level.
What is Inequality or Gini Index in Walla Walla County?
Inequality or Gini Index in Walla Walla County is 0.46.
How Large is the Labor Force in Walla Walla County?
There are 29,277 People in the Labor Forcein in Walla Walla County.
What is the Percentage of People in the Labor Force in Walla Walla County?
57.5% of People are in the Labor Force in Walla Walla County.
What is the Unemployment Rate in Walla Walla County?
Unemployment Rate in Walla Walla County is 5.8%.