Stevens County, WA
Stevens County Map
Stevens County Overview
46,774
TOTAL POPULATION
23,444
MALE POPULATION
23,330
FEMALE POPULATION
100.49
MALES / 100 FEMALES
99.51
FEMALES / 100 MALES
46.9
MEDIAN AGE
3.0
AVG FAMILY SIZE
2.5
AVG HOUSEHOLD SIZE
$32,904
PER CAPITA INCOME
$77,945
AVG FAMILY INCOME
$62,381
AVG HOUSEHOLD INCOME
38.7%
WAGE / INCOME GAP [ % ]
61.3¢/ $1
WAGE / INCOME GAP [ $ ]
$10,314
FAMILY INCOME DEFICIT
0.44
INEQUALITY / GINI INDEX
18,966
LABOR FORCE [ PEOPLE ]
49.7%
PERCENT IN LABOR FORCE
5.3%
UNEMPLOYMENT RATE
Stevens County Area Codes
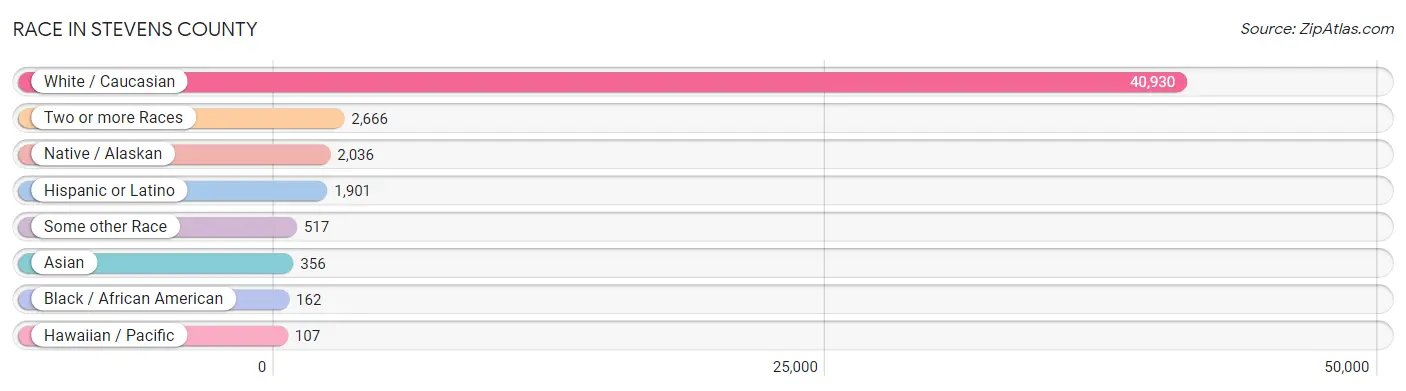
Race in Stevens County
The most populous races in Stevens County are White / Caucasian (40,930 | 87.5%), Two or more Races (2,666 | 5.7%), and Native / Alaskan (2,036 | 4.3%).
| Race | # Population | % Population |
| Asian | 356 | 0.8% |
| Black / African American | 162 | 0.4% |
| Hawaiian / Pacific | 107 | 0.2% |
| Hispanic or Latino | 1,901 | 4.1% |
| Native / Alaskan | 2,036 | 4.3% |
| White / Caucasian | 40,930 | 87.5% |
| Two or more Races | 2,666 | 5.7% |
| Some other Race | 517 | 1.1% |
| Total | 46,774 | 100.0% |
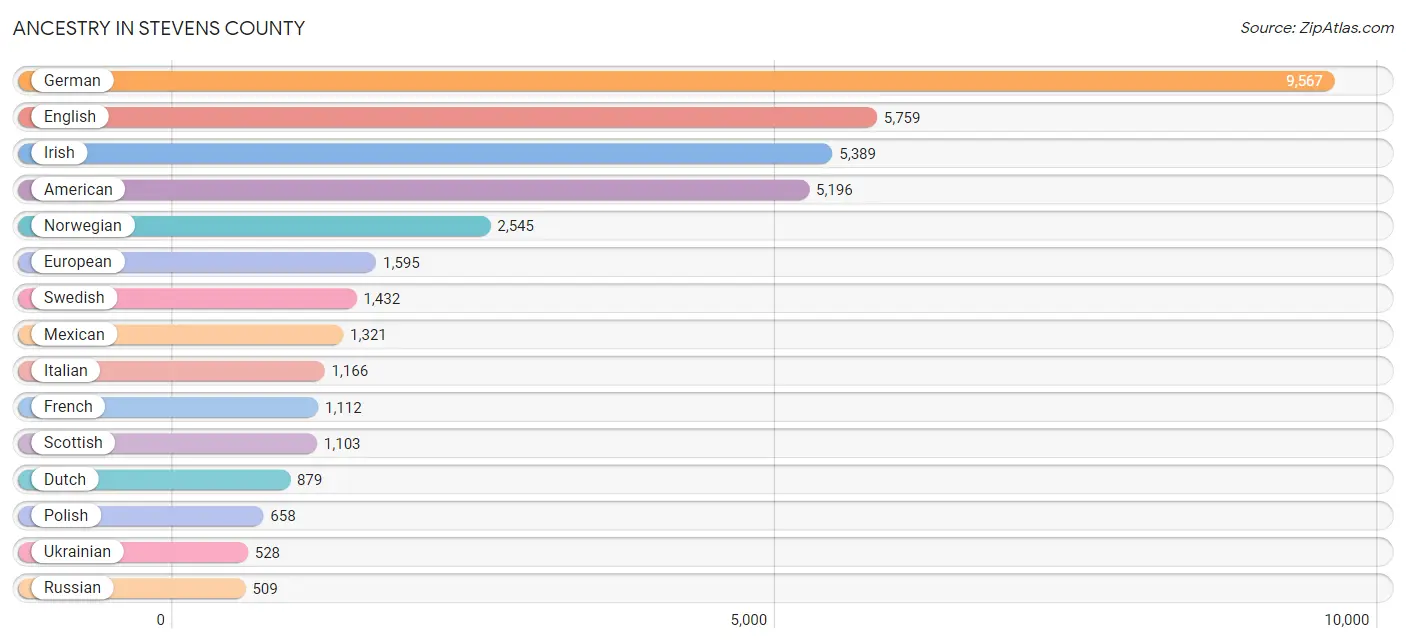
Ancestry in Stevens County
The most populous ancestries reported in Stevens County are German (9,567 | 20.4%), English (5,759 | 12.3%), Irish (5,389 | 11.5%), American (5,196 | 11.1%), and Norwegian (2,545 | 5.4%), together accounting for 60.8% of all Stevens County residents.
| Ancestry | # Population | % Population |
| African | 40 | 0.1% |
| Alaska Native | 38 | 0.1% |
| Aleut | 10 | 0.0% |
| American | 5,196 | 11.1% |
| Apache | 123 | 0.3% |
| Arab | 45 | 0.1% |
| Armenian | 2 | 0.0% |
| Australian | 10 | 0.0% |
| Austrian | 202 | 0.4% |
| Basque | 27 | 0.1% |
| Belgian | 8 | 0.0% |
| Bhutanese | 172 | 0.4% |
| Blackfeet | 157 | 0.3% |
| British | 286 | 0.6% |
| Burmese | 132 | 0.3% |
| Canadian | 243 | 0.5% |
| Carpatho Rusyn | 14 | 0.0% |
| Celtic | 7 | 0.0% |
| Central American | 23 | 0.1% |
| Cherokee | 270 | 0.6% |
| Chickasaw | 7 | 0.0% |
| Chippewa | 25 | 0.1% |
| Choctaw | 221 | 0.5% |
| Colombian | 23 | 0.1% |
| Colville | 341 | 0.7% |
| Comanche | 1 | 0.0% |
| Cree | 22 | 0.1% |
| Croatian | 31 | 0.1% |
| Crow | 4 | 0.0% |
| Cuban | 20 | 0.0% |
| Cypriot | 3 | 0.0% |
| Czech | 95 | 0.2% |
| Czechoslovakian | 65 | 0.1% |
| Danish | 340 | 0.7% |
| Delaware | 54 | 0.1% |
| Dominican | 14 | 0.0% |
| Dutch | 879 | 1.9% |
| Eastern European | 73 | 0.2% |
| Ecuadorian | 144 | 0.3% |
| English | 5,759 | 12.3% |
| European | 1,595 | 3.4% |
| Finnish | 297 | 0.6% |
| French | 1,112 | 2.4% |
| French Canadian | 370 | 0.8% |
| German | 9,567 | 20.4% |
| German Russian | 12 | 0.0% |
| Greek | 120 | 0.3% |
| Guamanian / Chamorro | 47 | 0.1% |
| Guatemalan | 13 | 0.0% |
| Hopi | 33 | 0.1% |
| Hungarian | 90 | 0.2% |
| Indian (Asian) | 109 | 0.2% |
| Inupiat | 10 | 0.0% |
| Iraqi | 7 | 0.0% |
| Irish | 5,389 | 11.5% |
| Iroquois | 58 | 0.1% |
| Italian | 1,166 | 2.5% |
| Japanese | 51 | 0.1% |
| Korean | 212 | 0.4% |
| Lebanese | 20 | 0.0% |
| Lithuanian | 27 | 0.1% |
| Lumbee | 15 | 0.0% |
| Luxembourger | 6 | 0.0% |
| Mexican | 1,321 | 2.8% |
| Mexican American Indian | 6 | 0.0% |
| Native Hawaiian | 33 | 0.1% |
| Navajo | 7 | 0.0% |
| Northern European | 140 | 0.3% |
| Norwegian | 2,545 | 5.4% |
| Osage | 13 | 0.0% |
| Paiute | 33 | 0.1% |
| Pakistani | 39 | 0.1% |
| Panamanian | 10 | 0.0% |
| Pennsylvania German | 25 | 0.1% |
| Peruvian | 17 | 0.0% |
| Polish | 658 | 1.4% |
| Portuguese | 133 | 0.3% |
| Puerto Rican | 14 | 0.0% |
| Puget Sound Salish | 16 | 0.0% |
| Romanian | 128 | 0.3% |
| Russian | 509 | 1.1% |
| Samoan | 97 | 0.2% |
| Scandinavian | 301 | 0.6% |
| Scotch-Irish | 451 | 1.0% |
| Scottish | 1,103 | 2.4% |
| Seminole | 16 | 0.0% |
| Serbian | 44 | 0.1% |
| Shoshone | 21 | 0.0% |
| Sioux | 27 | 0.1% |
| Slavic | 42 | 0.1% |
| Slovak | 11 | 0.0% |
| South American | 184 | 0.4% |
| Spaniard | 171 | 0.4% |
| Spanish | 38 | 0.1% |
| Sri Lankan | 32 | 0.1% |
| Subsaharan African | 46 | 0.1% |
| Swedish | 1,432 | 3.1% |
| Swiss | 245 | 0.5% |
| Syrian | 18 | 0.0% |
| Tlingit-Haida | 25 | 0.1% |
| Tongan | 45 | 0.1% |
| Turkish | 4 | 0.0% |
| Ukrainian | 528 | 1.1% |
| Welsh | 509 | 1.1% |
| Yakama | 14 | 0.0% |
| Yugoslavian | 25 | 0.1% |
| Yup'ik | 2 | 0.0% | View All 107 Rows |
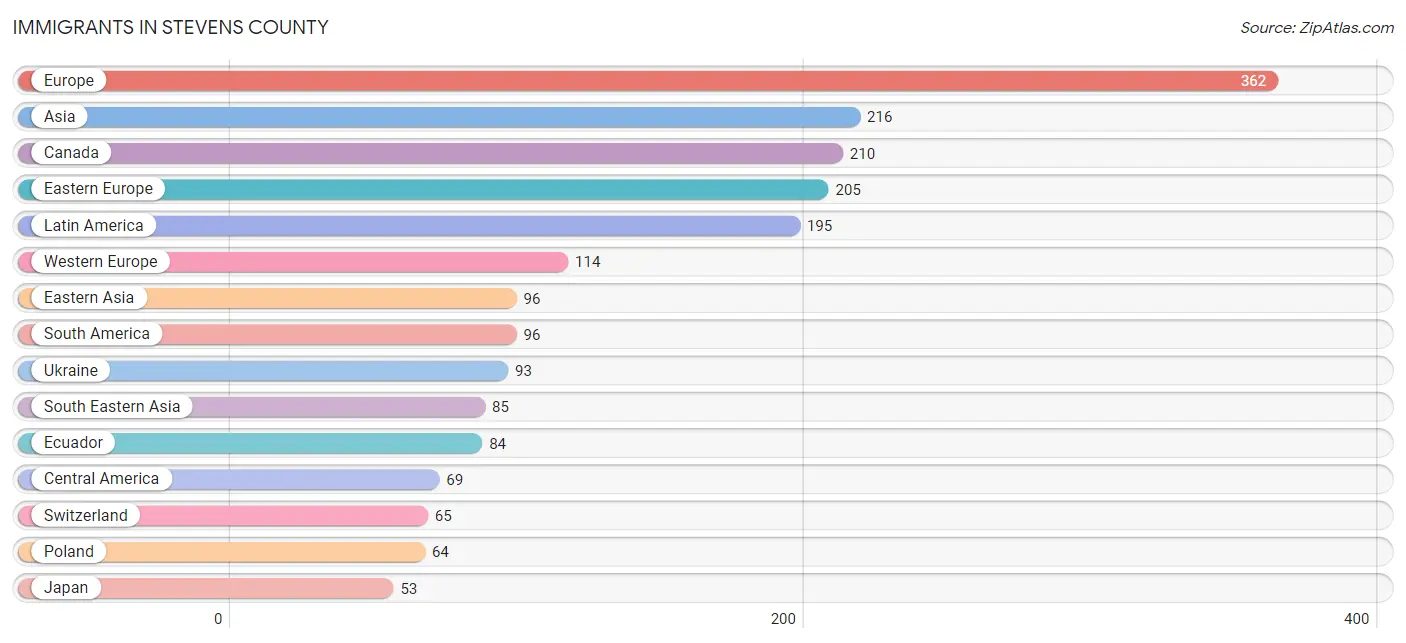
Immigrants in Stevens County
The most numerous immigrant groups reported in Stevens County came from Europe (362 | 0.8%), Asia (216 | 0.5%), Canada (210 | 0.4%), Eastern Europe (205 | 0.4%), and Latin America (195 | 0.4%), together accounting for 2.5% of all Stevens County residents.
| Immigration Origin | # Population | % Population |
| Africa | 22 | 0.1% |
| Argentina | 12 | 0.0% |
| Asia | 216 | 0.5% |
| Australia | 3 | 0.0% |
| Canada | 210 | 0.4% |
| Caribbean | 30 | 0.1% |
| Central America | 69 | 0.2% |
| China | 14 | 0.0% |
| Cuba | 16 | 0.0% |
| Czechoslovakia | 4 | 0.0% |
| Dominican Republic | 14 | 0.0% |
| Eastern Africa | 18 | 0.0% |
| Eastern Asia | 96 | 0.2% |
| Eastern Europe | 205 | 0.4% |
| Ecuador | 84 | 0.2% |
| England | 40 | 0.1% |
| Europe | 362 | 0.8% |
| France | 8 | 0.0% |
| Germany | 41 | 0.1% |
| Guatemala | 9 | 0.0% |
| Hungary | 29 | 0.1% |
| Ireland | 3 | 0.0% |
| Japan | 53 | 0.1% |
| Kazakhstan | 18 | 0.0% |
| Kenya | 12 | 0.0% |
| Korea | 29 | 0.1% |
| Latin America | 195 | 0.4% |
| Mexico | 50 | 0.1% |
| Northern Europe | 43 | 0.1% |
| Oceania | 6 | 0.0% |
| Panama | 10 | 0.0% |
| Philippines | 41 | 0.1% |
| Poland | 64 | 0.1% |
| Romania | 15 | 0.0% |
| South America | 96 | 0.2% |
| South Central Asia | 32 | 0.1% |
| South Eastern Asia | 85 | 0.2% |
| Switzerland | 65 | 0.1% |
| Ukraine | 93 | 0.2% |
| Vietnam | 44 | 0.1% |
| Western Asia | 3 | 0.0% |
| Western Europe | 114 | 0.2% | View All 42 Rows |
Sex and Age in Stevens County
Sex and Age in Stevens County
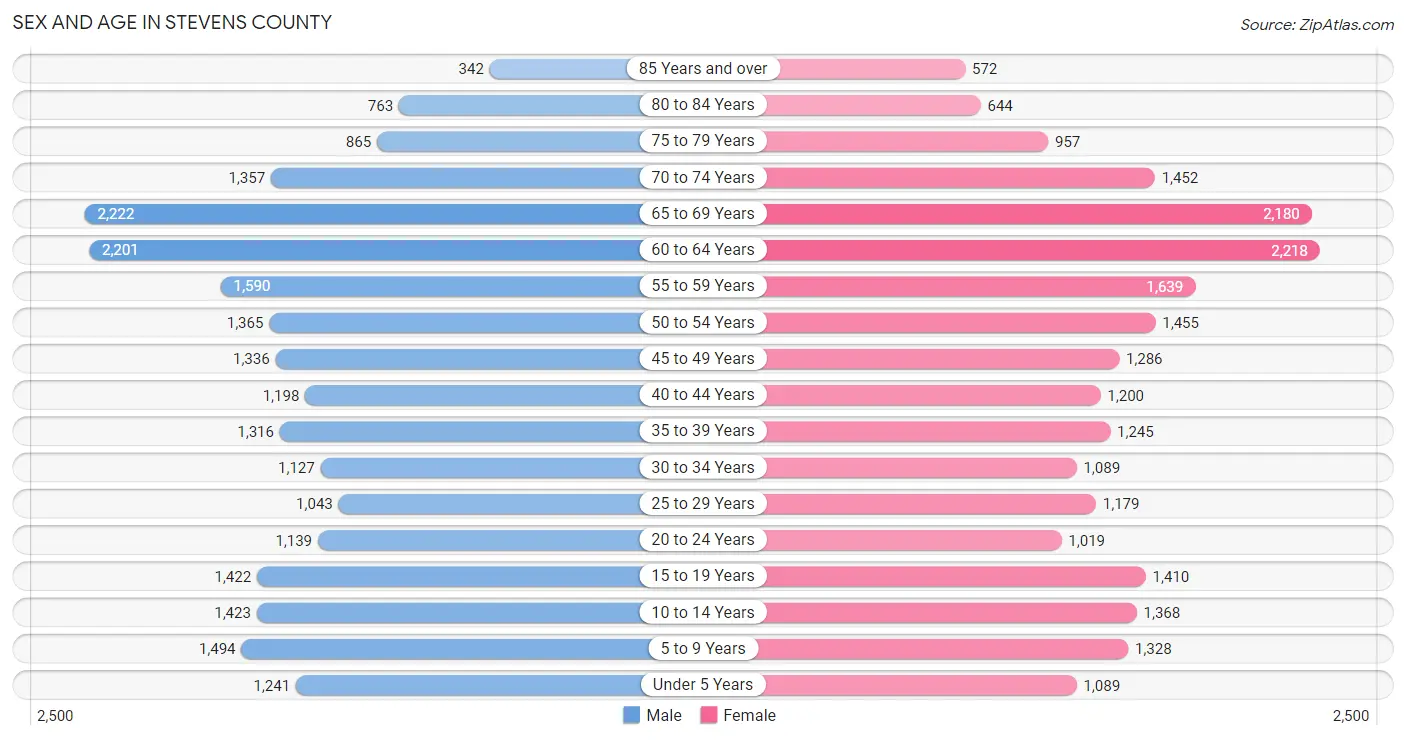
The most populous age groups in Stevens County are 65 to 69 Years (2,222 | 9.5%) for men and 60 to 64 Years (2,218 | 9.5%) for women.
| Age Bracket | Male | Female |
| Under 5 Years | 1,241 (5.3%) | 1,089 (4.7%) |
| 5 to 9 Years | 1,494 (6.4%) | 1,328 (5.7%) |
| 10 to 14 Years | 1,423 (6.1%) | 1,368 (5.9%) |
| 15 to 19 Years | 1,422 (6.1%) | 1,410 (6.0%) |
| 20 to 24 Years | 1,139 (4.9%) | 1,019 (4.4%) |
| 25 to 29 Years | 1,043 (4.4%) | 1,179 (5.1%) |
| 30 to 34 Years | 1,127 (4.8%) | 1,089 (4.7%) |
| 35 to 39 Years | 1,316 (5.6%) | 1,245 (5.3%) |
| 40 to 44 Years | 1,198 (5.1%) | 1,200 (5.1%) |
| 45 to 49 Years | 1,336 (5.7%) | 1,286 (5.5%) |
| 50 to 54 Years | 1,365 (5.8%) | 1,455 (6.2%) |
| 55 to 59 Years | 1,590 (6.8%) | 1,639 (7.0%) |
| 60 to 64 Years | 2,201 (9.4%) | 2,218 (9.5%) |
| 65 to 69 Years | 2,222 (9.5%) | 2,180 (9.3%) |
| 70 to 74 Years | 1,357 (5.8%) | 1,452 (6.2%) |
| 75 to 79 Years | 865 (3.7%) | 957 (4.1%) |
| 80 to 84 Years | 763 (3.3%) | 644 (2.8%) |
| 85 Years and over | 342 (1.5%) | 572 (2.5%) |
| Total | 23,444 (100.0%) | 23,330 (100.0%) |
Families and Households in Stevens County
Median Family Size in Stevens County
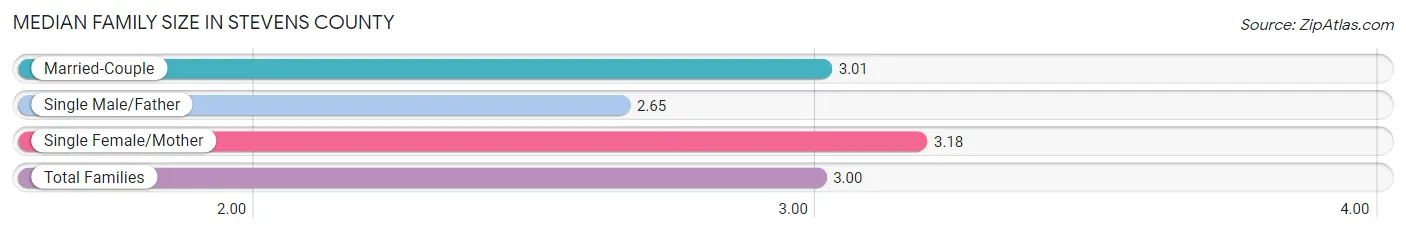
The median family size in Stevens County is 3.00 persons per family, with single female/mother families (1,401 | 11.1%) accounting for the largest median family size of 3.18 persons per family. On the other hand, single male/father families (881 | 7.0%) represent the smallest median family size with 2.65 persons per family.
| Family Type | # Families | Family Size |
| Married-Couple | 10,397 (82.0%) | 3.01 |
| Single Male/Father | 881 (7.0%) | 2.65 |
| Single Female/Mother | 1,401 (11.1%) | 3.18 |
| Total Families | 12,679 (100.0%) | 3.00 |
Median Household Size in Stevens County
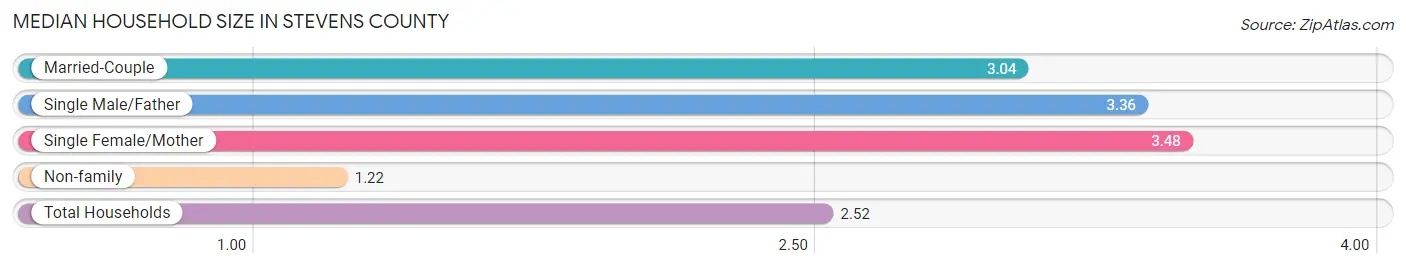
The median household size in Stevens County is 2.52 persons per household, with single female/mother households (1,401 | 7.6%) accounting for the largest median household size of 3.48 persons per household. non-family households (5,792 | 31.4%) represent the smallest median household size with 1.22 persons per household.
| Household Type | # Households | Household Size |
| Married-Couple | 10,397 (56.3%) | 3.04 |
| Single Male/Father | 881 (4.8%) | 3.36 |
| Single Female/Mother | 1,401 (7.6%) | 3.48 |
| Non-family | 5,792 (31.4%) | 1.22 |
| Total Households | 18,471 (100.0%) | 2.52 |
Household Size by Marriage Status in Stevens County
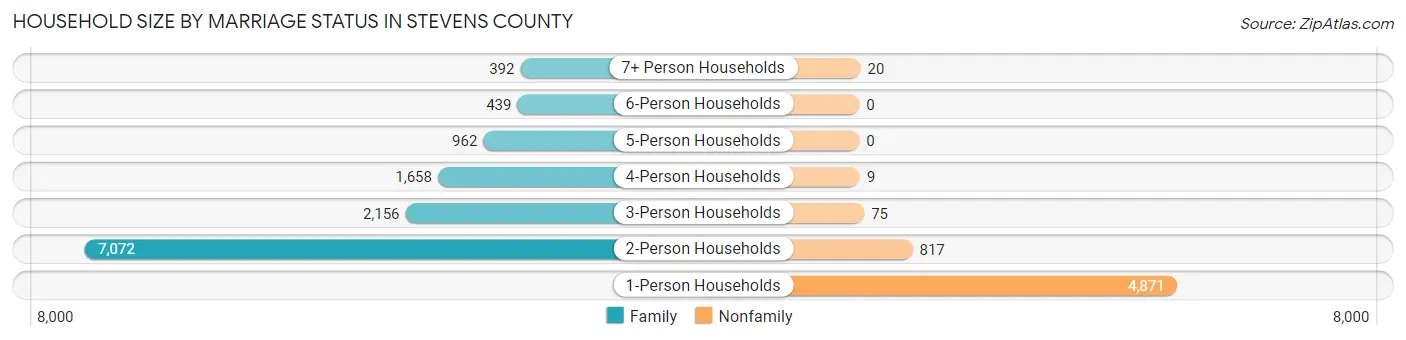
Out of a total of 18,471 households in Stevens County, 12,679 (68.6%) are family households, while 5,792 (31.4%) are nonfamily households. The most numerous type of family households are 2-person households, comprising 7,072, and the most common type of nonfamily households are 1-person households, comprising 4,871.
| Household Size | Family Households | Nonfamily Households |
| 1-Person Households | - | 4,871 (26.4%) |
| 2-Person Households | 7,072 (38.3%) | 817 (4.4%) |
| 3-Person Households | 2,156 (11.7%) | 75 (0.4%) |
| 4-Person Households | 1,658 (9.0%) | 9 (0.1%) |
| 5-Person Households | 962 (5.2%) | 0 (0.0%) |
| 6-Person Households | 439 (2.4%) | 0 (0.0%) |
| 7+ Person Households | 392 (2.1%) | 20 (0.1%) |
| Total | 12,679 (68.6%) | 5,792 (31.4%) |
Female Fertility in Stevens County
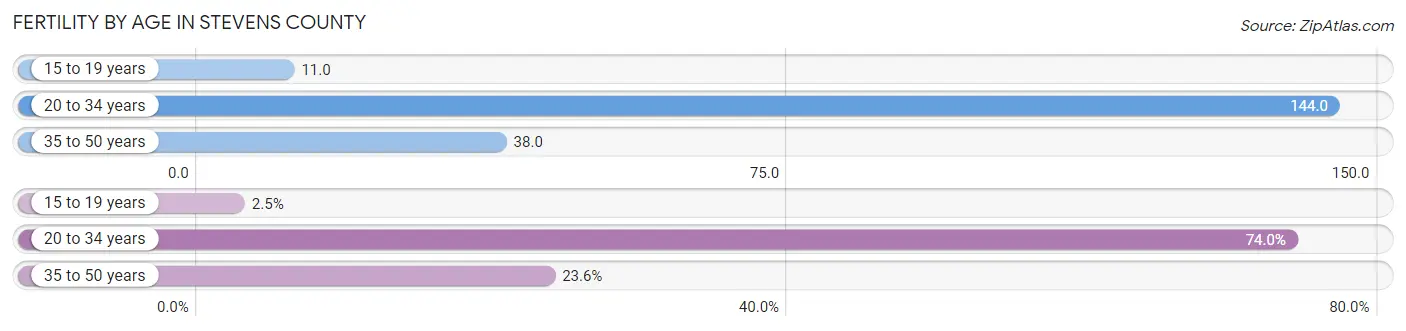
Fertility by Age in Stevens County
Average fertility rate in Stevens County is 74.0 births per 1,000 women. Women in the age bracket of 20 to 34 years have the highest fertility rate with 144.0 births per 1,000 women. Women in the age bracket of 20 to 34 years acount for 74.0% of all women with births.
| Age Bracket | Women with Births | Births / 1,000 Women |
| 15 to 19 years | 16 (2.5%) | 11.0 |
| 20 to 34 years | 474 (74.0%) | 144.0 |
| 35 to 50 years | 151 (23.6%) | 38.0 |
| Total | 641 (100.0%) | 74.0 |
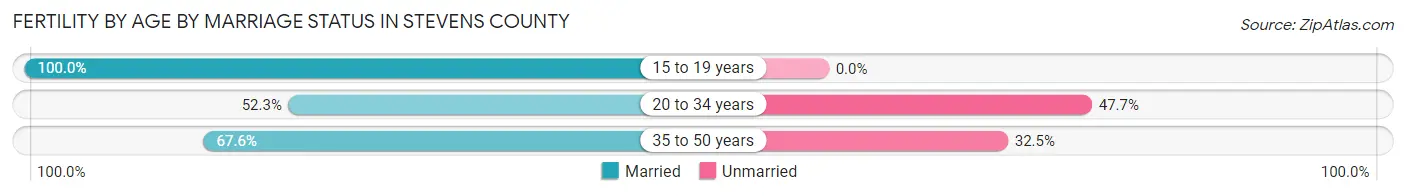
Fertility by Age by Marriage Status in Stevens County
57.1% of women with births (641) in Stevens County are married. The highest percentage of unmarried women with births falls into 20 to 34 years age bracket with 47.7% of them unmarried at the time of birth, while the lowest percentage of unmarried women with births belong to 15 to 19 years age bracket with 0.0% of them unmarried.
| Age Bracket | Married | Unmarried |
| 15 to 19 years | 16 (100.0%) | 0 (0.0%) |
| 20 to 34 years | 248 (52.3%) | 226 (47.7%) |
| 35 to 50 years | 102 (67.5%) | 49 (32.5%) |
| Total | 366 (57.1%) | 275 (42.9%) |
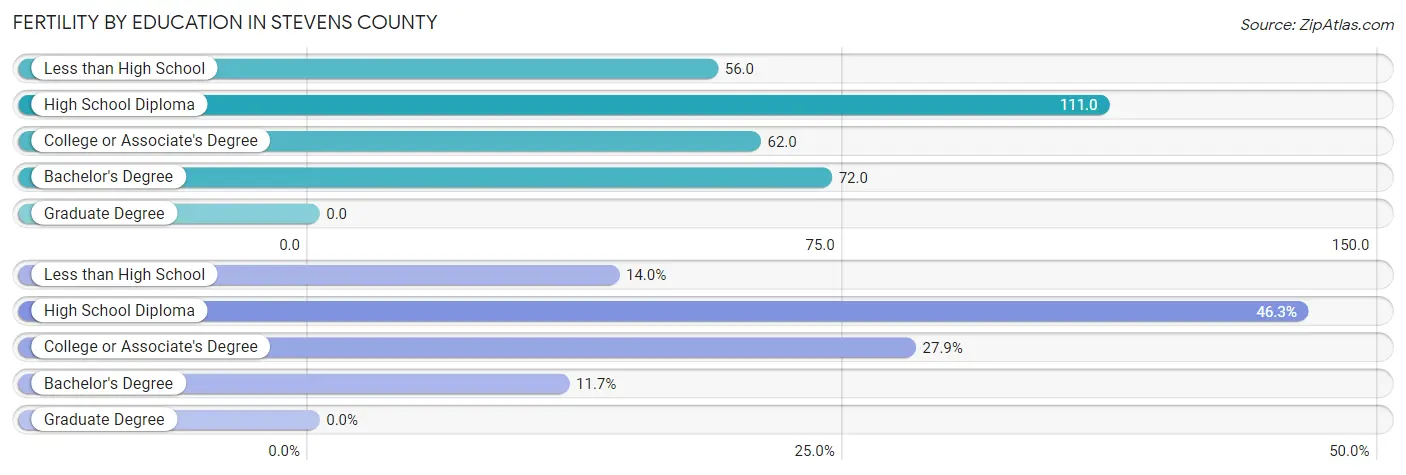
Fertility by Education in Stevens County
| Educational Attainment | Women with Births | Births / 1,000 Women |
| Less than High School | 90 (14.0%) | 56.0 |
| High School Diploma | 297 (46.3%) | 111.0 |
| College or Associate's Degree | 179 (27.9%) | 62.0 |
| Bachelor's Degree | 75 (11.7%) | 72.0 |
| Graduate Degree | 0 (0.0%) | 0.0 |
| Total | 641 (100.0%) | 74.0 |
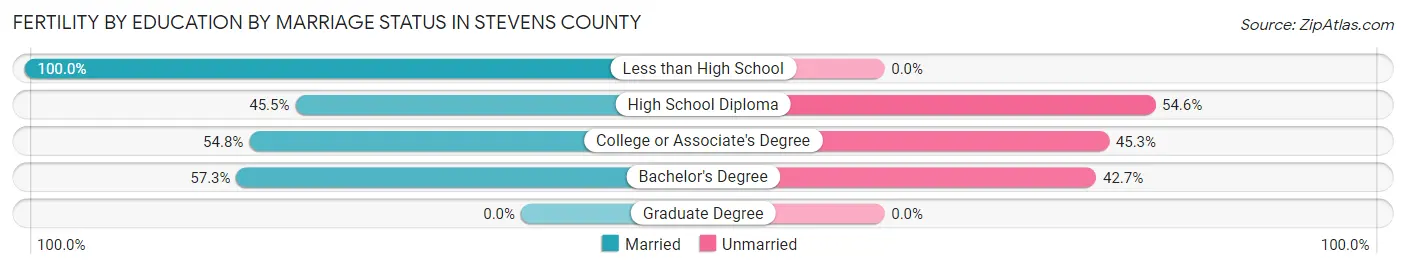
Fertility by Education by Marriage Status in Stevens County
42.9% of women with births in Stevens County are unmarried. Women with the educational attainment of less than high school are most likely to be married with 100.0% of them married at childbirth, while women with the educational attainment of high school diploma are least likely to be married with 54.5% of them unmarried at childbirth.
| Educational Attainment | Married | Unmarried |
| Less than High School | 90 (100.0%) | 0 (0.0%) |
| High School Diploma | 135 (45.5%) | 162 (54.5%) |
| College or Associate's Degree | 98 (54.7%) | 81 (45.3%) |
| Bachelor's Degree | 43 (57.3%) | 32 (42.7%) |
| Graduate Degree | 0 (0.0%) | 0 (0.0%) |
| Total | 366 (57.1%) | 275 (42.9%) |
Income in Stevens County
Income Overview in Stevens County
Per Capita Income in Stevens County is $32,904, while median incomes of families and households are $77,945 and $62,381 respectively.
| Characteristic | Number | Measure |
| Per Capita Income | 46,774 | $32,904 |
| Median Family Income | 12,679 | $77,945 |
| Mean Family Income | 12,679 | $92,793 |
| Median Household Income | 18,471 | $62,381 |
| Mean Household Income | 18,471 | $82,246 |
| Income Deficit | 12,679 | $10,314 |
| Wage / Income Gap (%) | 46,774 | 38.73% |
| Wage / Income Gap ($) | 46,774 | 61.27¢ per $1 |
| Gini / Inequality Index | 46,774 | 0.44 |
Earnings by Sex in Stevens County
Average Earnings in Stevens County are $37,718, $47,358 for men and $29,018 for women, a difference of 38.7%.
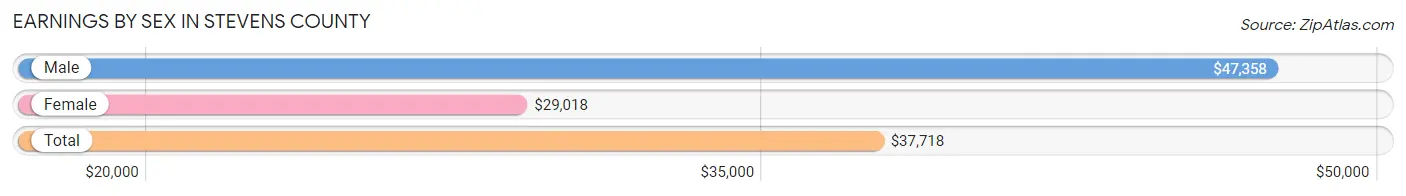
| Sex | Number | Average Earnings |
| Male | 10,812 (53.2%) | $47,358 |
| Female | 9,497 (46.8%) | $29,018 |
| Total | 20,309 (100.0%) | $37,718 |
Earnings by Sex by Income Bracket in Stevens County
The most common earnings brackets in Stevens County are $100,000+ for men (1,529 | 14.1%) and $25,000 to $29,999 for women (716 | 7.5%).
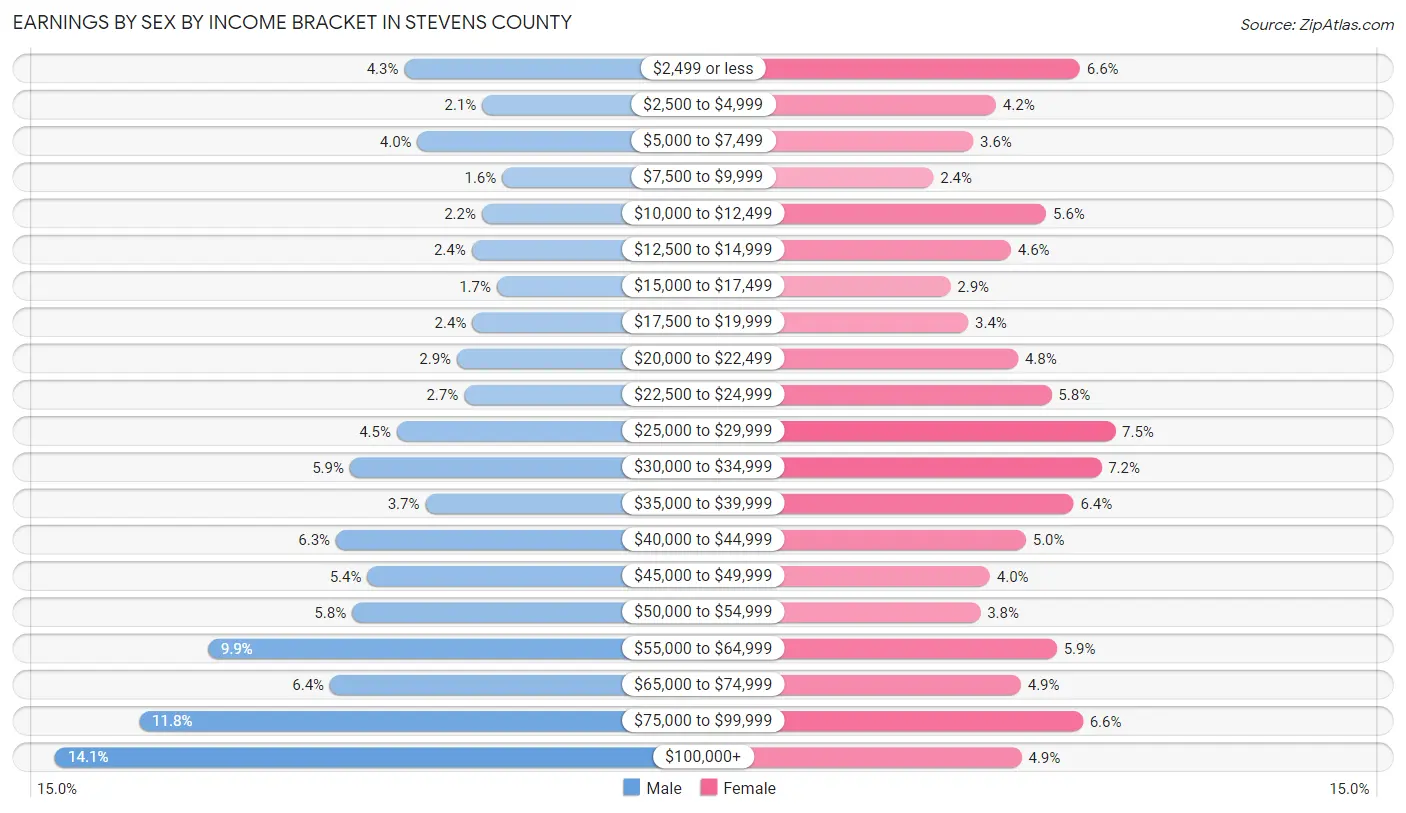
| Income | Male | Female |
| $2,499 or less | 468 (4.3%) | 622 (6.6%) |
| $2,500 to $4,999 | 231 (2.1%) | 398 (4.2%) |
| $5,000 to $7,499 | 428 (4.0%) | 337 (3.5%) |
| $7,500 to $9,999 | 171 (1.6%) | 231 (2.4%) |
| $10,000 to $12,499 | 232 (2.1%) | 532 (5.6%) |
| $12,500 to $14,999 | 264 (2.4%) | 438 (4.6%) |
| $15,000 to $17,499 | 187 (1.7%) | 276 (2.9%) |
| $17,500 to $19,999 | 262 (2.4%) | 324 (3.4%) |
| $20,000 to $22,499 | 308 (2.9%) | 457 (4.8%) |
| $22,500 to $24,999 | 286 (2.6%) | 546 (5.8%) |
| $25,000 to $29,999 | 491 (4.5%) | 716 (7.5%) |
| $30,000 to $34,999 | 634 (5.9%) | 679 (7.1%) |
| $35,000 to $39,999 | 404 (3.7%) | 605 (6.4%) |
| $40,000 to $44,999 | 676 (6.2%) | 478 (5.0%) |
| $45,000 to $49,999 | 581 (5.4%) | 382 (4.0%) |
| $50,000 to $54,999 | 627 (5.8%) | 356 (3.7%) |
| $55,000 to $64,999 | 1,065 (9.9%) | 560 (5.9%) |
| $65,000 to $74,999 | 694 (6.4%) | 464 (4.9%) |
| $75,000 to $99,999 | 1,274 (11.8%) | 630 (6.6%) |
| $100,000+ | 1,529 (14.1%) | 466 (4.9%) |
| Total | 10,812 (100.0%) | 9,497 (100.0%) |
Earnings by Sex by Educational Attainment in Stevens County
Average earnings in Stevens County are $51,655 for men and $31,892 for women, a difference of 38.3%. Men with an educational attainment of bachelor's degree enjoy the highest average annual earnings of $68,750, while those with less than high school education earn the least with $39,933. Women with an educational attainment of graduate degree earn the most with the average annual earnings of $52,250, while those with less than high school education have the smallest earnings of $20,875.
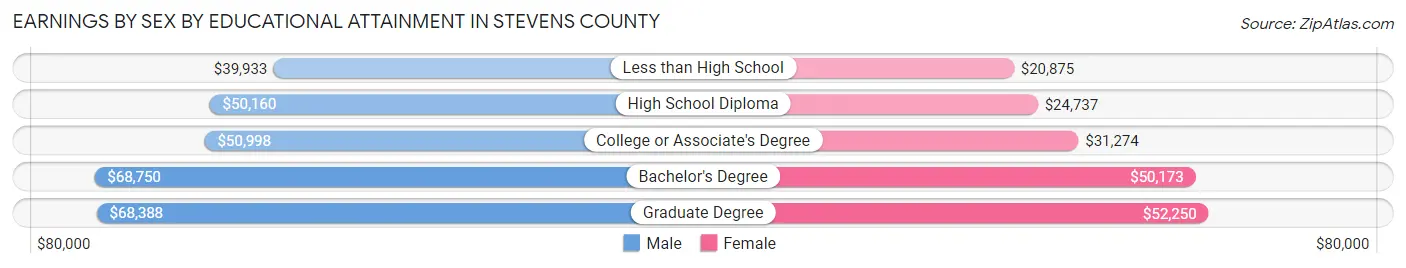
| Educational Attainment | Male Income | Female Income |
| Less than High School | $39,933 | $20,875 |
| High School Diploma | $50,160 | $24,737 |
| College or Associate's Degree | $50,998 | $31,274 |
| Bachelor's Degree | $68,750 | $50,173 |
| Graduate Degree | $68,388 | $52,250 |
| Total | $51,655 | $31,892 |
Family Income in Stevens County
Family Income Brackets in Stevens County
According to the Stevens County family income data, there are 2,625 families falling into the $100,000 to $149,999 income range, which is the most common income bracket and makes up 20.7% of all families. Conversely, the $10,000 to $14,999 income bracket is the least frequent group with only 228 families (1.8%) belonging to this category.
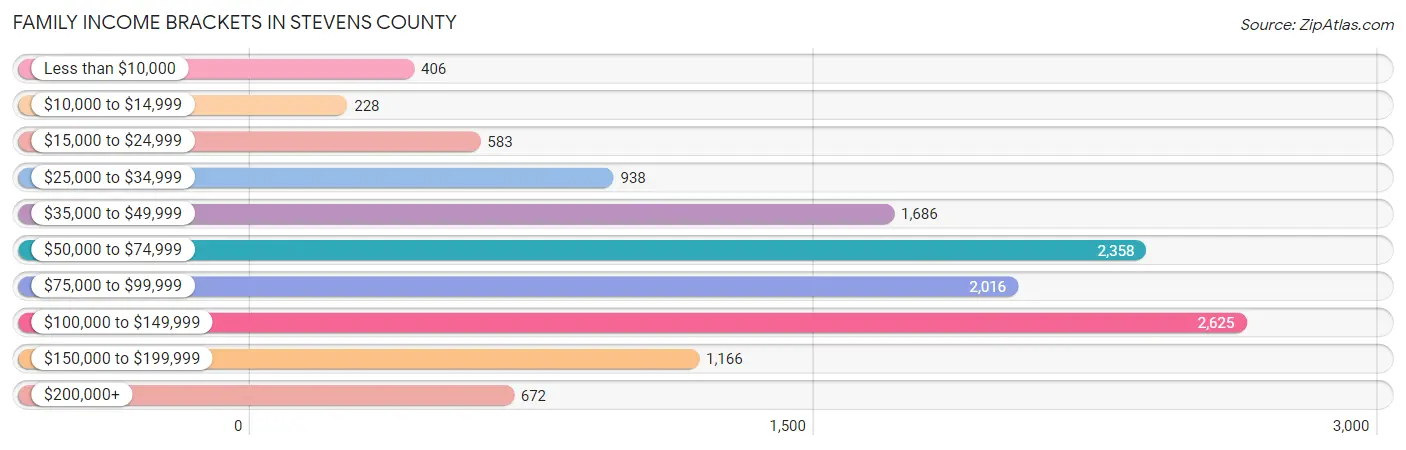
| Income Bracket | # Families | % Families |
| Less than $10,000 | 406 | 3.2% |
| $10,000 to $14,999 | 228 | 1.8% |
| $15,000 to $24,999 | 583 | 4.6% |
| $25,000 to $34,999 | 938 | 7.4% |
| $35,000 to $49,999 | 1,686 | 13.3% |
| $50,000 to $74,999 | 2,358 | 18.6% |
| $75,000 to $99,999 | 2,016 | 15.9% |
| $100,000 to $149,999 | 2,625 | 20.7% |
| $150,000 to $199,999 | 1,166 | 9.2% |
| $200,000+ | 672 | 5.3% |
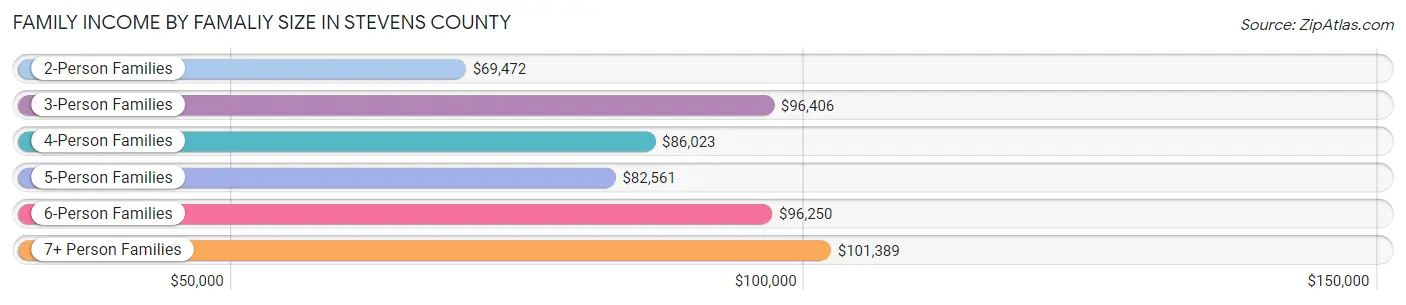
Family Income by Famaliy Size in Stevens County
7+ person families (334 | 2.6%) account for the highest median family income in Stevens County with $101,389 per family, while 2-person families (7,522 | 59.3%) have the highest median income of $34,736 per family member.
| Income Bracket | # Families | Median Income |
| 2-Person Families | 7,522 (59.3%) | $69,472 |
| 3-Person Families | 2,019 (15.9%) | $96,406 |
| 4-Person Families | 1,647 (13.0%) | $86,023 |
| 5-Person Families | 757 (6.0%) | $82,561 |
| 6-Person Families | 400 (3.2%) | $96,250 |
| 7+ Person Families | 334 (2.6%) | $101,389 |
| Total | 12,679 (100.0%) | $77,945 |
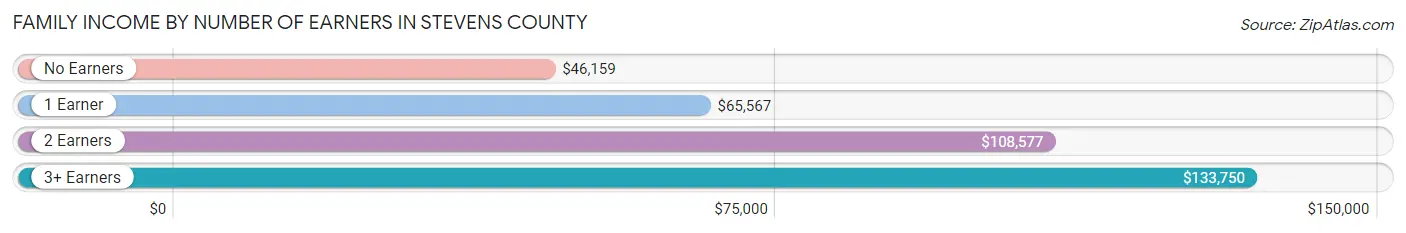
Family Income by Number of Earners in Stevens County
The median family income in Stevens County is $77,945, with families comprising 3+ earners (971) having the highest median family income of $133,750, while families with no earners (3,216) have the lowest median family income of $46,159, accounting for 7.7% and 25.4% of families, respectively.
| Number of Earners | # Families | Median Income |
| No Earners | 3,216 (25.4%) | $46,159 |
| 1 Earner | 4,292 (33.9%) | $65,567 |
| 2 Earners | 4,200 (33.1%) | $108,577 |
| 3+ Earners | 971 (7.7%) | $133,750 |
| Total | 12,679 (100.0%) | $77,945 |
Household Income in Stevens County
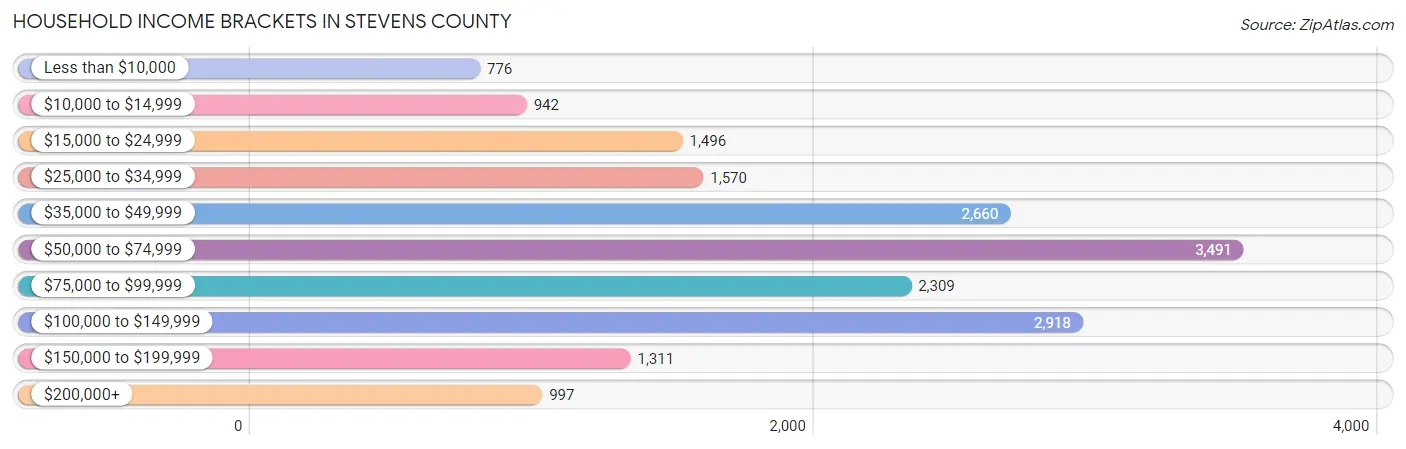
Household Income Brackets in Stevens County
With 3,491 households falling in the category, the $50,000 to $74,999 income range is the most frequent in Stevens County, accounting for 18.9% of all households. In contrast, only 776 households (4.2%) fall into the less than $10,000 income bracket, making it the least populous group.
| Income Bracket | # Households | % Households |
| Less than $10,000 | 776 | 4.2% |
| $10,000 to $14,999 | 942 | 5.1% |
| $15,000 to $24,999 | 1,496 | 8.1% |
| $25,000 to $34,999 | 1,570 | 8.5% |
| $35,000 to $49,999 | 2,660 | 14.4% |
| $50,000 to $74,999 | 3,491 | 18.9% |
| $75,000 to $99,999 | 2,309 | 12.5% |
| $100,000 to $149,999 | 2,918 | 15.8% |
| $150,000 to $199,999 | 1,311 | 7.1% |
| $200,000+ | 997 | 5.4% |
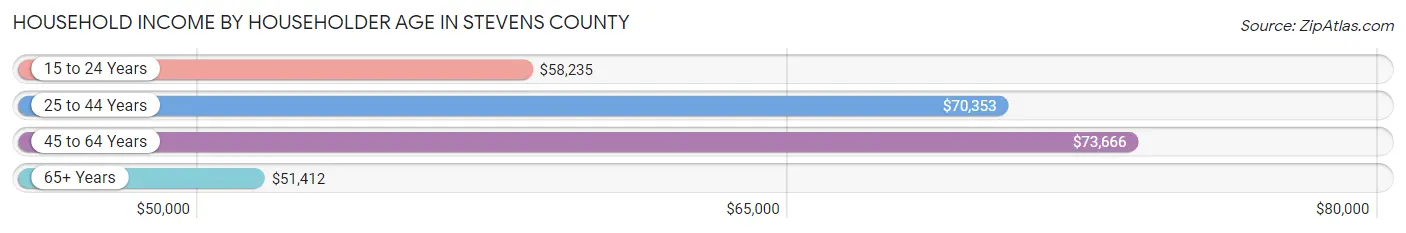
Household Income by Householder Age in Stevens County
The median household income in Stevens County is $62,381, with the highest median household income of $73,666 found in the 45 to 64 years age bracket for the primary householder. A total of 6,897 households (37.3%) fall into this category. Meanwhile, the 65+ years age bracket for the primary householder has the lowest median household income of $51,412, with 6,933 households (37.5%) in this group.
| Income Bracket | # Households | Median Income |
| 15 to 24 Years | 488 (2.6%) | $58,235 |
| 25 to 44 Years | 4,153 (22.5%) | $70,353 |
| 45 to 64 Years | 6,897 (37.3%) | $73,666 |
| 65+ Years | 6,933 (37.5%) | $51,412 |
| Total | 18,471 (100.0%) | $62,381 |
Poverty in Stevens County
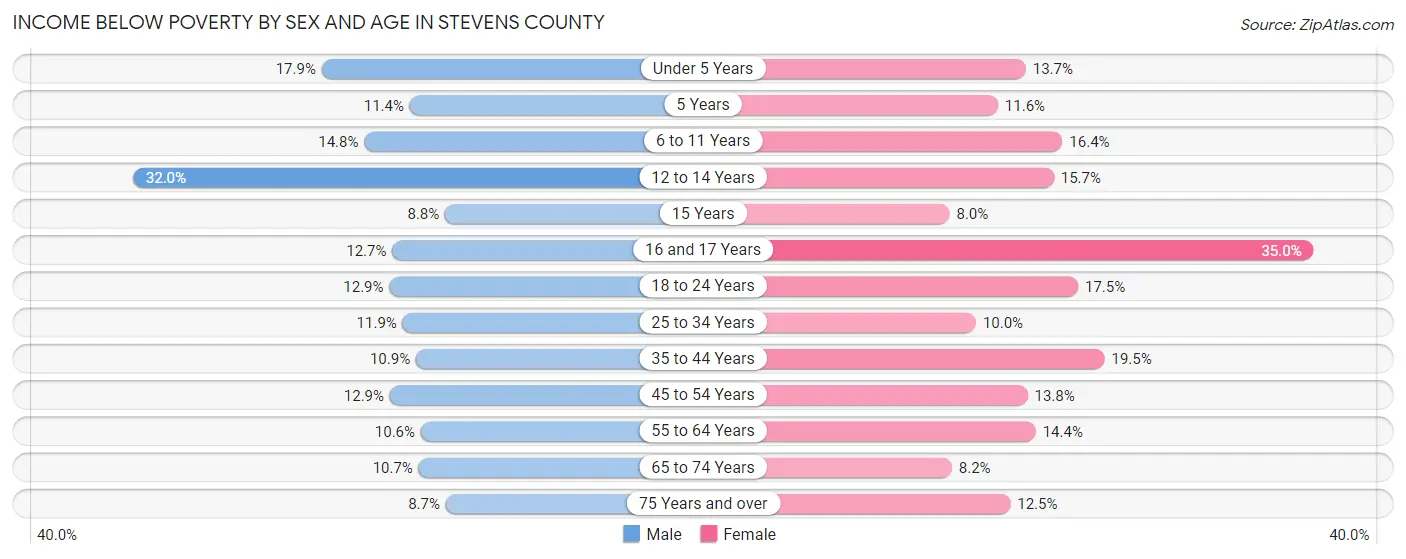
Income Below Poverty by Sex and Age in Stevens County
With 12.5% poverty level for males and 14.1% for females among the residents of Stevens County, 12 to 14 year old males and 16 and 17 year old females are the most vulnerable to poverty, with 272 males (32.0%) and 214 females (35.0%) in their respective age groups living below the poverty level.
| Age Bracket | Male | Female |
| Under 5 Years | 207 (17.9%) | 147 (13.7%) |
| 5 Years | 48 (11.4%) | 24 (11.6%) |
| 6 to 11 Years | 232 (14.8%) | 274 (16.4%) |
| 12 to 14 Years | 272 (32.0%) | 119 (15.7%) |
| 15 Years | 28 (8.8%) | 28 (8.0%) |
| 16 and 17 Years | 81 (12.7%) | 214 (35.0%) |
| 18 to 24 Years | 207 (12.9%) | 257 (17.5%) |
| 25 to 34 Years | 256 (11.9%) | 226 (10.0%) |
| 35 to 44 Years | 275 (10.9%) | 477 (19.5%) |
| 45 to 54 Years | 347 (12.9%) | 378 (13.8%) |
| 55 to 64 Years | 401 (10.6%) | 555 (14.4%) |
| 65 to 74 Years | 383 (10.7%) | 296 (8.2%) |
| 75 Years and over | 166 (8.7%) | 263 (12.5%) |
| Total | 2,903 (12.5%) | 3,258 (14.1%) |
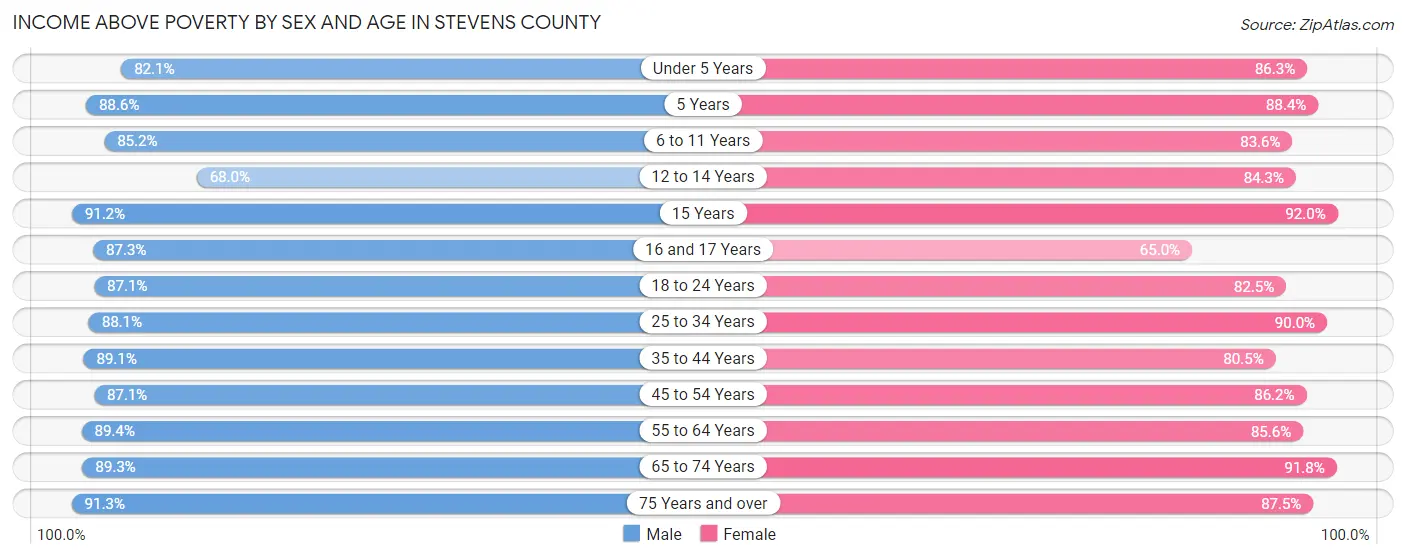
Income Above Poverty by Sex and Age in Stevens County
According to the poverty statistics in Stevens County, males aged 75 years and over and females aged 15 years are the age groups that are most secure financially, with 91.3% of males and 92.0% of females in these age groups living above the poverty line.
| Age Bracket | Male | Female |
| Under 5 Years | 947 (82.1%) | 929 (86.3%) |
| 5 Years | 373 (88.6%) | 183 (88.4%) |
| 6 to 11 Years | 1,338 (85.2%) | 1,399 (83.6%) |
| 12 to 14 Years | 579 (68.0%) | 637 (84.3%) |
| 15 Years | 291 (91.2%) | 322 (92.0%) |
| 16 and 17 Years | 557 (87.3%) | 397 (65.0%) |
| 18 to 24 Years | 1,395 (87.1%) | 1,208 (82.5%) |
| 25 to 34 Years | 1,890 (88.1%) | 2,042 (90.0%) |
| 35 to 44 Years | 2,239 (89.1%) | 1,968 (80.5%) |
| 45 to 54 Years | 2,347 (87.1%) | 2,363 (86.2%) |
| 55 to 64 Years | 3,388 (89.4%) | 3,300 (85.6%) |
| 65 to 74 Years | 3,183 (89.3%) | 3,326 (91.8%) |
| 75 Years and over | 1,735 (91.3%) | 1,840 (87.5%) |
| Total | 20,262 (87.5%) | 19,914 (85.9%) |
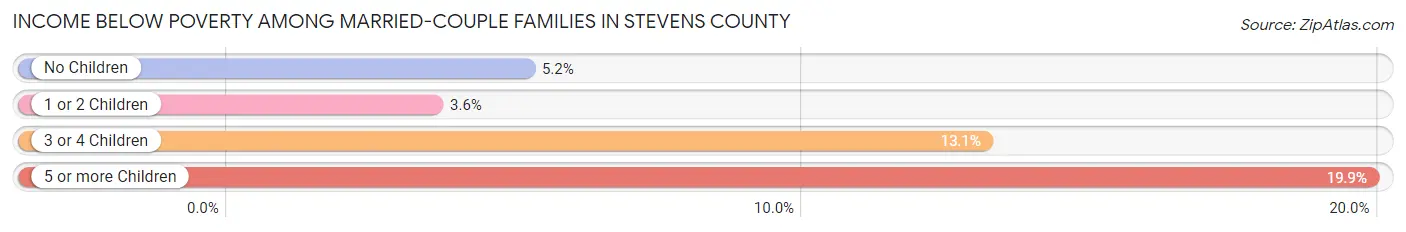
Income Below Poverty Among Married-Couple Families in Stevens County
The poverty statistics for married-couple families in Stevens County show that 5.7% or 587 of the total 10,397 families live below the poverty line. Families with 5 or more children have the highest poverty rate of 19.9%, comprising of 29 families. On the other hand, families with 1 or 2 children have the lowest poverty rate of 3.6%, which includes 76 families.
| Children | Above Poverty | Below Poverty |
| No Children | 6,957 (94.8%) | 379 (5.2%) |
| 1 or 2 Children | 2,055 (96.4%) | 76 (3.6%) |
| 3 or 4 Children | 681 (86.9%) | 103 (13.1%) |
| 5 or more Children | 117 (80.1%) | 29 (19.9%) |
| Total | 9,810 (94.4%) | 587 (5.7%) |
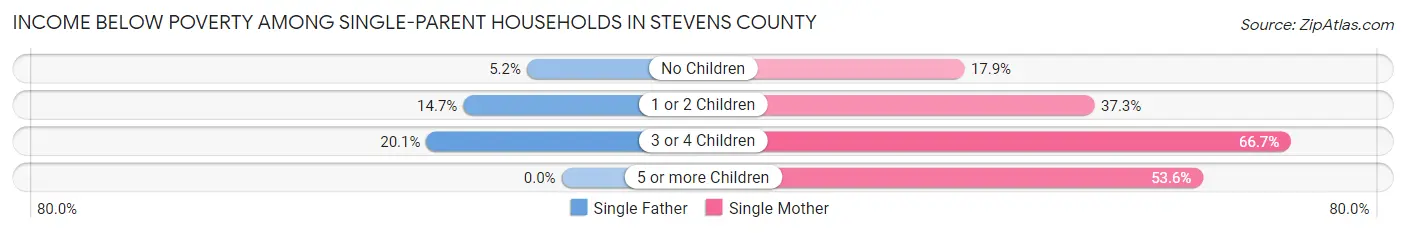
Income Below Poverty Among Single-Parent Households in Stevens County
According to the poverty data in Stevens County, 11.4% or 100 single-father households and 31.7% or 444 single-mother households are living below the poverty line. Among single-father households, those with 3 or 4 children have the highest poverty rate, with 28 households (20.1%) experiencing poverty. Likewise, among single-mother households, those with 3 or 4 children have the highest poverty rate, with 86 households (66.7%) falling below the poverty line.
| Children | Single Father | Single Mother |
| No Children | 20 (5.2%) | 112 (17.9%) |
| 1 or 2 Children | 52 (14.6%) | 231 (37.3%) |
| 3 or 4 Children | 28 (20.1%) | 86 (66.7%) |
| 5 or more Children | 0 (0.0%) | 15 (53.6%) |
| Total | 100 (11.4%) | 444 (31.7%) |
Income Below Poverty Among Married-Couple vs Single-Parent Households in Stevens County
The poverty data for Stevens County shows that 587 of the married-couple family households (5.7%) and 544 of the single-parent households (23.8%) are living below the poverty level. Within the married-couple family households, those with 5 or more children have the highest poverty rate, with 29 households (19.9%) falling below the poverty line. Among the single-parent households, those with 5 or more children have the highest poverty rate, with 15 household (53.6%) living below poverty.
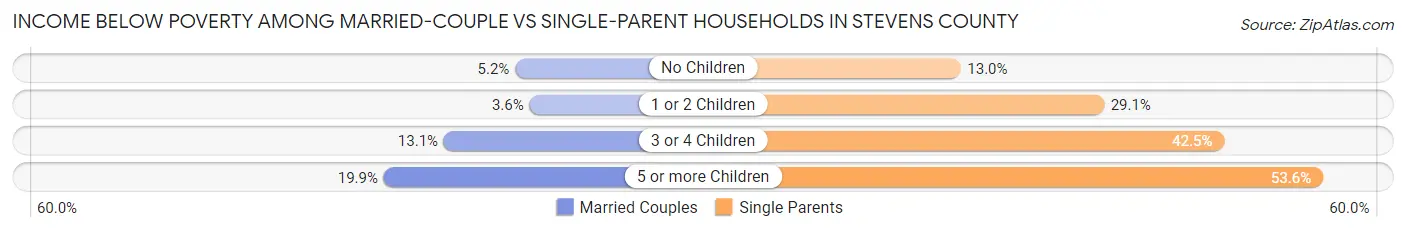
| Children | Married-Couple Families | Single-Parent Households |
| No Children | 379 (5.2%) | 132 (13.0%) |
| 1 or 2 Children | 76 (3.6%) | 283 (29.1%) |
| 3 or 4 Children | 103 (13.1%) | 114 (42.5%) |
| 5 or more Children | 29 (19.9%) | 15 (53.6%) |
| Total | 587 (5.7%) | 544 (23.8%) |
Employment Characteristics in Stevens County
Employment by Class of Employer in Stevens County
Among the 17,576 employed individuals in Stevens County, private company employees (9,941 | 56.6%), local government employees (1,868 | 10.6%), and self-employed (not incorporated) (1,606 | 9.1%) make up the most common classes of employment.
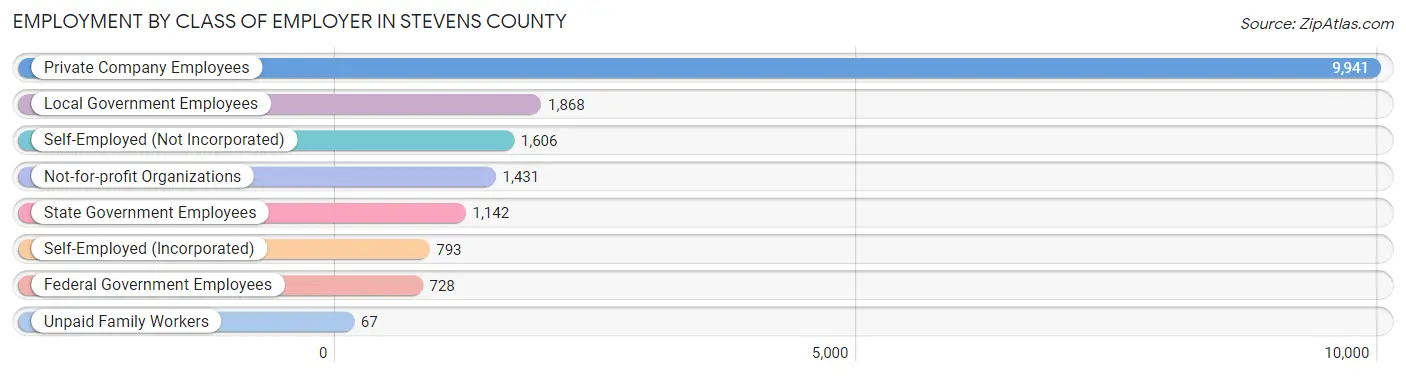
| Employer Class | # Employees | % Employees |
| Private Company Employees | 9,941 | 56.6% |
| Self-Employed (Incorporated) | 793 | 4.5% |
| Self-Employed (Not Incorporated) | 1,606 | 9.1% |
| Not-for-profit Organizations | 1,431 | 8.1% |
| Local Government Employees | 1,868 | 10.6% |
| State Government Employees | 1,142 | 6.5% |
| Federal Government Employees | 728 | 4.1% |
| Unpaid Family Workers | 67 | 0.4% |
| Total | 17,576 | 100.0% |
Employment Status by Age in Stevens County
According to the labor force statistics for Stevens County, out of the total population over 16 years of age (38,160), 49.7% or 18,966 individuals are in the labor force, with 5.3% or 1,005 of them unemployed. The age group with the highest labor force participation rate is 25 to 29 years, with 77.0% or 1,711 individuals in the labor force. Within the labor force, the 16 to 19 years age range has the highest percentage of unemployed individuals, with 13.9% or 104 of them being unemployed.
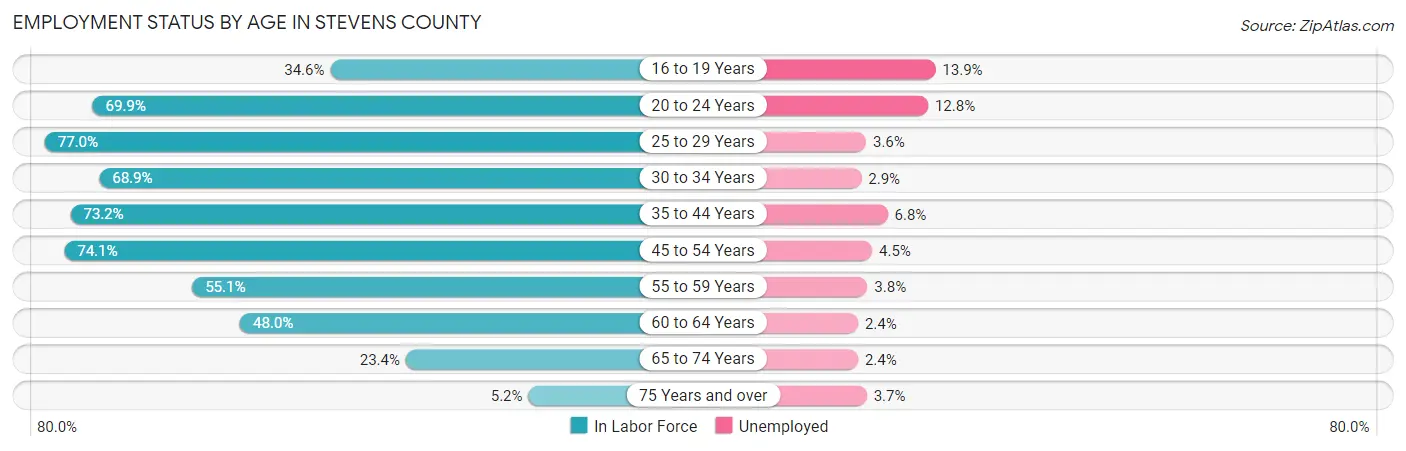
| Age Bracket | In Labor Force | Unemployed |
| 16 to 19 Years | 748 (34.6%) | 104 (13.9%) |
| 20 to 24 Years | 1,508 (69.9%) | 193 (12.8%) |
| 25 to 29 Years | 1,711 (77.0%) | 62 (3.6%) |
| 30 to 34 Years | 1,527 (68.9%) | 44 (2.9%) |
| 35 to 44 Years | 3,630 (73.2%) | 247 (6.8%) |
| 45 to 54 Years | 4,033 (74.1%) | 181 (4.5%) |
| 55 to 59 Years | 1,779 (55.1%) | 68 (3.8%) |
| 60 to 64 Years | 2,121 (48.0%) | 51 (2.4%) |
| 65 to 74 Years | 1,687 (23.4%) | 40 (2.4%) |
| 75 Years and over | 215 (5.2%) | 8 (3.7%) |
| Total | 18,966 (49.7%) | 1,005 (5.3%) |
Employment Status by Educational Attainment in Stevens County
According to labor force statistics for Stevens County, 65.8% of individuals (14,796) out of the total population between 25 and 64 years of age (22,487) are in the labor force, with 4.4% or 651 of them being unemployed. The group with the highest labor force participation rate are those with the educational attainment of bachelor's degree or higher, with 82.3% or 3,485 individuals in the labor force. Within the labor force, individuals with less than high school education have the highest percentage of unemployment, with 8.9% or 73 of them being unemployed.
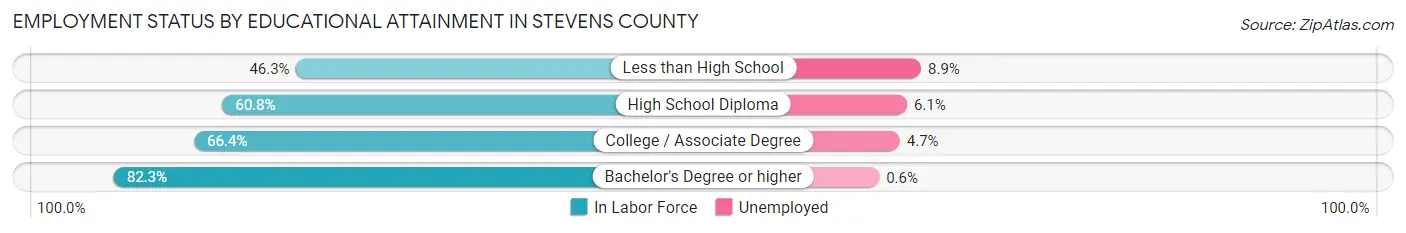
| Educational Attainment | In Labor Force | Unemployed |
| Less than High School | 821 (46.3%) | 158 (8.9%) |
| High School Diploma | 4,823 (60.8%) | 484 (6.1%) |
| College / Associate Degree | 5,675 (66.4%) | 402 (4.7%) |
| Bachelor's Degree or higher | 3,485 (82.3%) | 25 (0.6%) |
| Total | 14,796 (65.8%) | 989 (4.4%) |
Employment Occupations by Sex in Stevens County
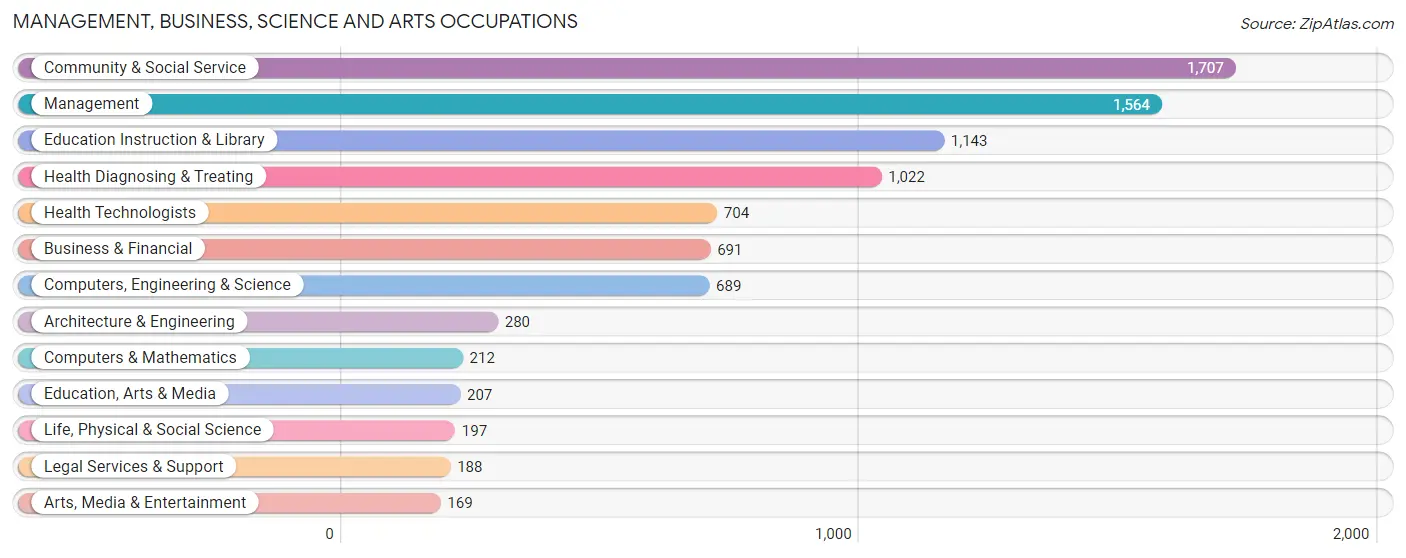
Management, Business, Science and Arts Occupations
The most common Management, Business, Science and Arts occupations in Stevens County are Community & Social Service (1,707 | 9.5%), Management (1,564 | 8.7%), Education Instruction & Library (1,143 | 6.4%), Health Diagnosing & Treating (1,022 | 5.7%), and Health Technologists (704 | 3.9%).
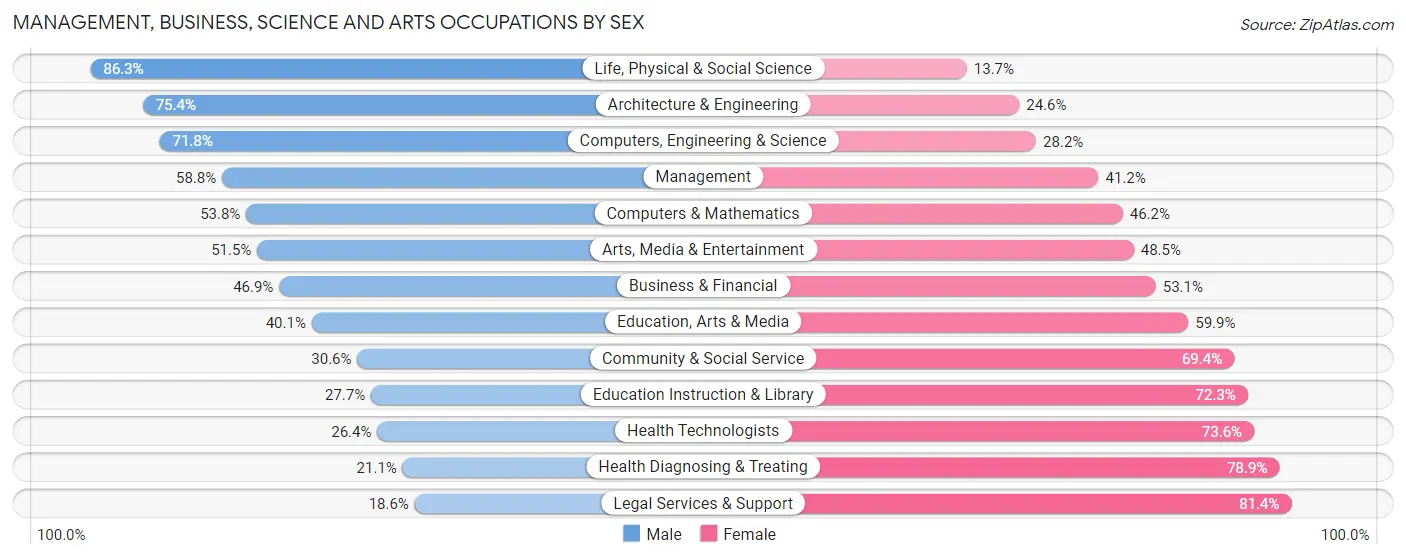
Management, Business, Science and Arts Occupations by Sex
Within the Management, Business, Science and Arts occupations in Stevens County, the most male-oriented occupations are Life, Physical & Social Science (86.3%), Architecture & Engineering (75.4%), and Computers, Engineering & Science (71.8%), while the most female-oriented occupations are Legal Services & Support (81.4%), Health Diagnosing & Treating (78.9%), and Health Technologists (73.6%).
| Occupation | Male | Female |
| Management | 920 (58.8%) | 644 (41.2%) |
| Business & Financial | 324 (46.9%) | 367 (53.1%) |
| Computers, Engineering & Science | 495 (71.8%) | 194 (28.2%) |
| Computers & Mathematics | 114 (53.8%) | 98 (46.2%) |
| Architecture & Engineering | 211 (75.4%) | 69 (24.6%) |
| Life, Physical & Social Science | 170 (86.3%) | 27 (13.7%) |
| Community & Social Service | 522 (30.6%) | 1,185 (69.4%) |
| Education, Arts & Media | 83 (40.1%) | 124 (59.9%) |
| Legal Services & Support | 35 (18.6%) | 153 (81.4%) |
| Education Instruction & Library | 317 (27.7%) | 826 (72.3%) |
| Arts, Media & Entertainment | 87 (51.5%) | 82 (48.5%) |
| Health Diagnosing & Treating | 216 (21.1%) | 806 (78.9%) |
| Health Technologists | 186 (26.4%) | 518 (73.6%) |
| Total (Category) | 2,477 (43.7%) | 3,196 (56.3%) |
| Total (Overall) | 9,481 (52.8%) | 8,481 (47.2%) |
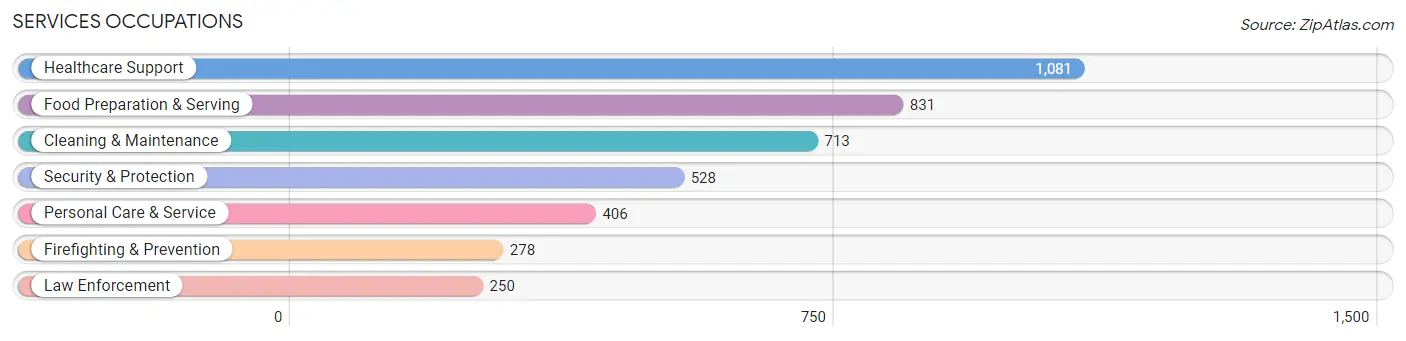
Services Occupations
The most common Services occupations in Stevens County are Healthcare Support (1,081 | 6.0%), Food Preparation & Serving (831 | 4.6%), Cleaning & Maintenance (713 | 4.0%), Security & Protection (528 | 2.9%), and Personal Care & Service (406 | 2.3%).
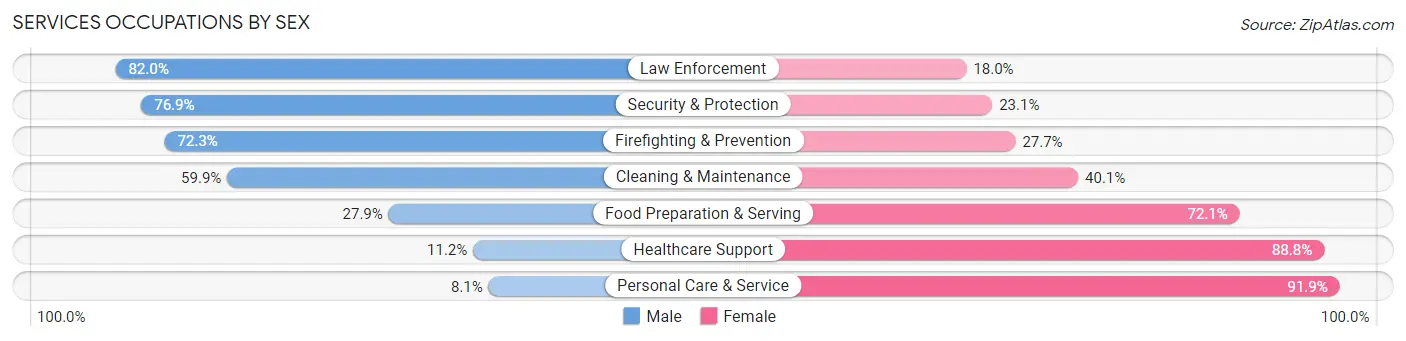
Services Occupations by Sex
Within the Services occupations in Stevens County, the most male-oriented occupations are Law Enforcement (82.0%), Security & Protection (76.9%), and Firefighting & Prevention (72.3%), while the most female-oriented occupations are Personal Care & Service (91.9%), Healthcare Support (88.8%), and Food Preparation & Serving (72.1%).
| Occupation | Male | Female |
| Healthcare Support | 121 (11.2%) | 960 (88.8%) |
| Security & Protection | 406 (76.9%) | 122 (23.1%) |
| Firefighting & Prevention | 201 (72.3%) | 77 (27.7%) |
| Law Enforcement | 205 (82.0%) | 45 (18.0%) |
| Food Preparation & Serving | 232 (27.9%) | 599 (72.1%) |
| Cleaning & Maintenance | 427 (59.9%) | 286 (40.1%) |
| Personal Care & Service | 33 (8.1%) | 373 (91.9%) |
| Total (Category) | 1,219 (34.3%) | 2,340 (65.7%) |
| Total (Overall) | 9,481 (52.8%) | 8,481 (47.2%) |
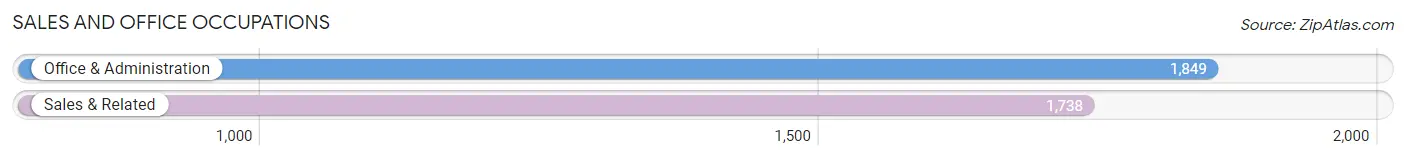
Sales and Office Occupations
The most common Sales and Office occupations in Stevens County are Office & Administration (1,849 | 10.3%), and Sales & Related (1,738 | 9.7%).
Sales and Office Occupations by Sex
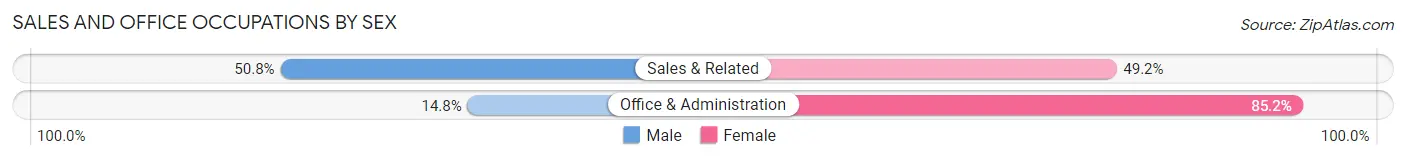
| Occupation | Male | Female |
| Sales & Related | 883 (50.8%) | 855 (49.2%) |
| Office & Administration | 274 (14.8%) | 1,575 (85.2%) |
| Total (Category) | 1,157 (32.3%) | 2,430 (67.7%) |
| Total (Overall) | 9,481 (52.8%) | 8,481 (47.2%) |
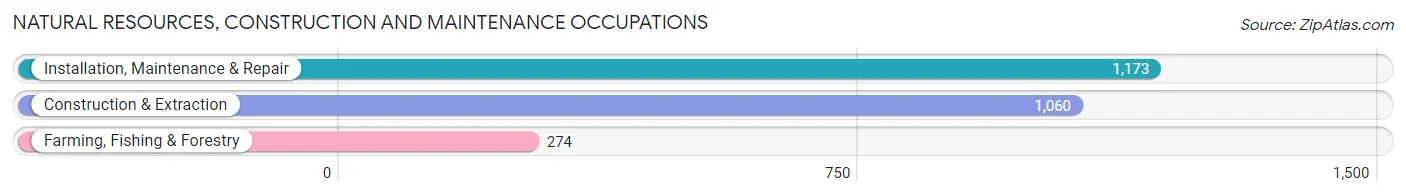
Natural Resources, Construction and Maintenance Occupations
The most common Natural Resources, Construction and Maintenance occupations in Stevens County are Installation, Maintenance & Repair (1,173 | 6.5%), Construction & Extraction (1,060 | 5.9%), and Farming, Fishing & Forestry (274 | 1.5%).
Natural Resources, Construction and Maintenance Occupations by Sex
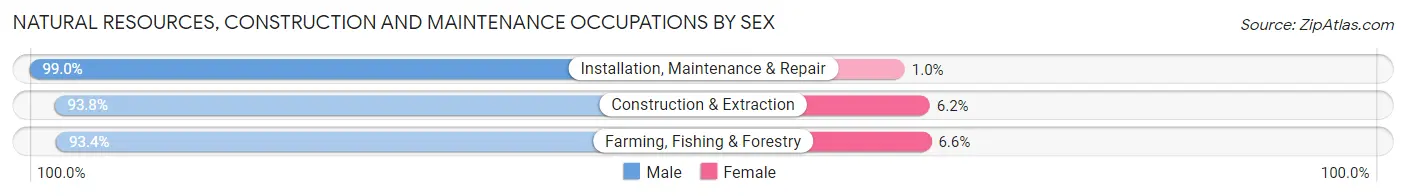
| Occupation | Male | Female |
| Farming, Fishing & Forestry | 256 (93.4%) | 18 (6.6%) |
| Construction & Extraction | 994 (93.8%) | 66 (6.2%) |
| Installation, Maintenance & Repair | 1,161 (99.0%) | 12 (1.0%) |
| Total (Category) | 2,411 (96.2%) | 96 (3.8%) |
| Total (Overall) | 9,481 (52.8%) | 8,481 (47.2%) |
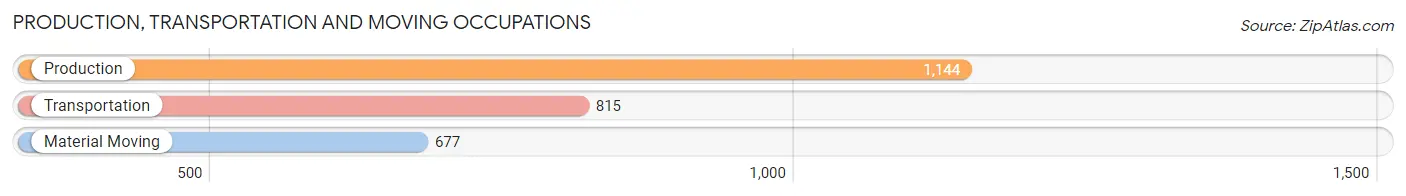
Production, Transportation and Moving Occupations
The most common Production, Transportation and Moving occupations in Stevens County are Production (1,144 | 6.4%), Transportation (815 | 4.5%), and Material Moving (677 | 3.8%).
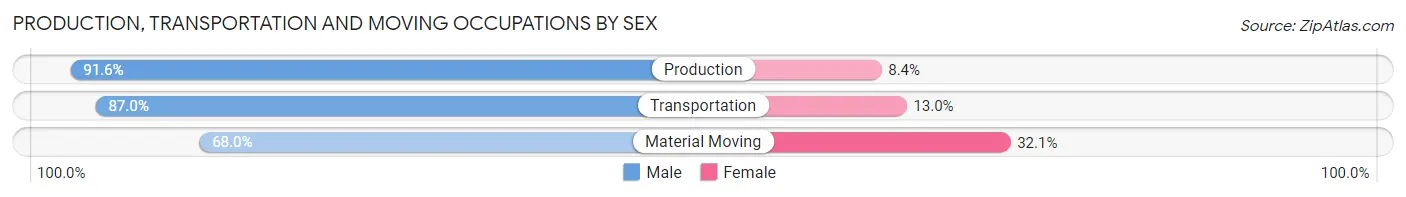
Production, Transportation and Moving Occupations by Sex
| Occupation | Male | Female |
| Production | 1,048 (91.6%) | 96 (8.4%) |
| Transportation | 709 (87.0%) | 106 (13.0%) |
| Material Moving | 460 (67.9%) | 217 (32.1%) |
| Total (Category) | 2,217 (84.1%) | 419 (15.9%) |
| Total (Overall) | 9,481 (52.8%) | 8,481 (47.2%) |
Employment Industries by Sex in Stevens County
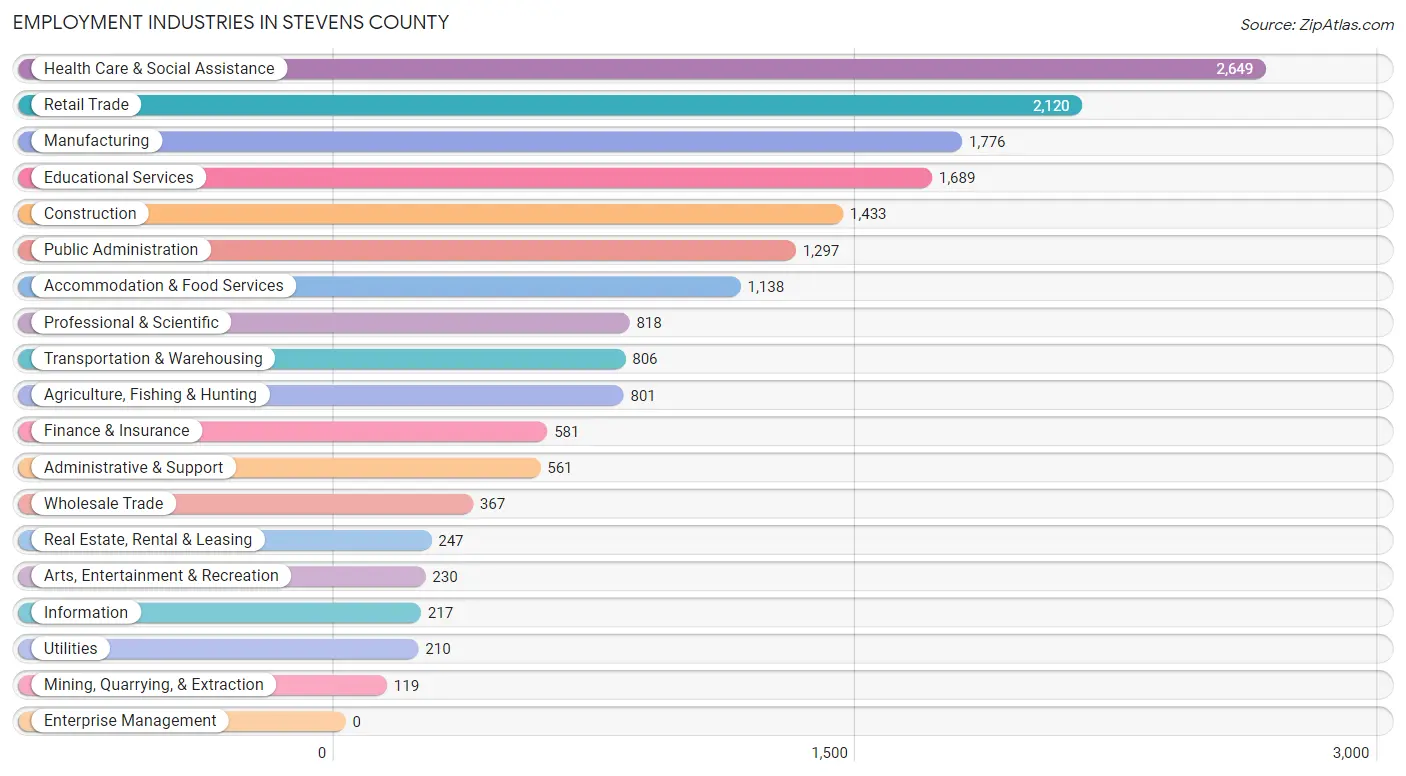
Employment Industries in Stevens County
The major employment industries in Stevens County include Health Care & Social Assistance (2,649 | 14.7%), Retail Trade (2,120 | 11.8%), Manufacturing (1,776 | 9.9%), Educational Services (1,689 | 9.4%), and Construction (1,433 | 8.0%).
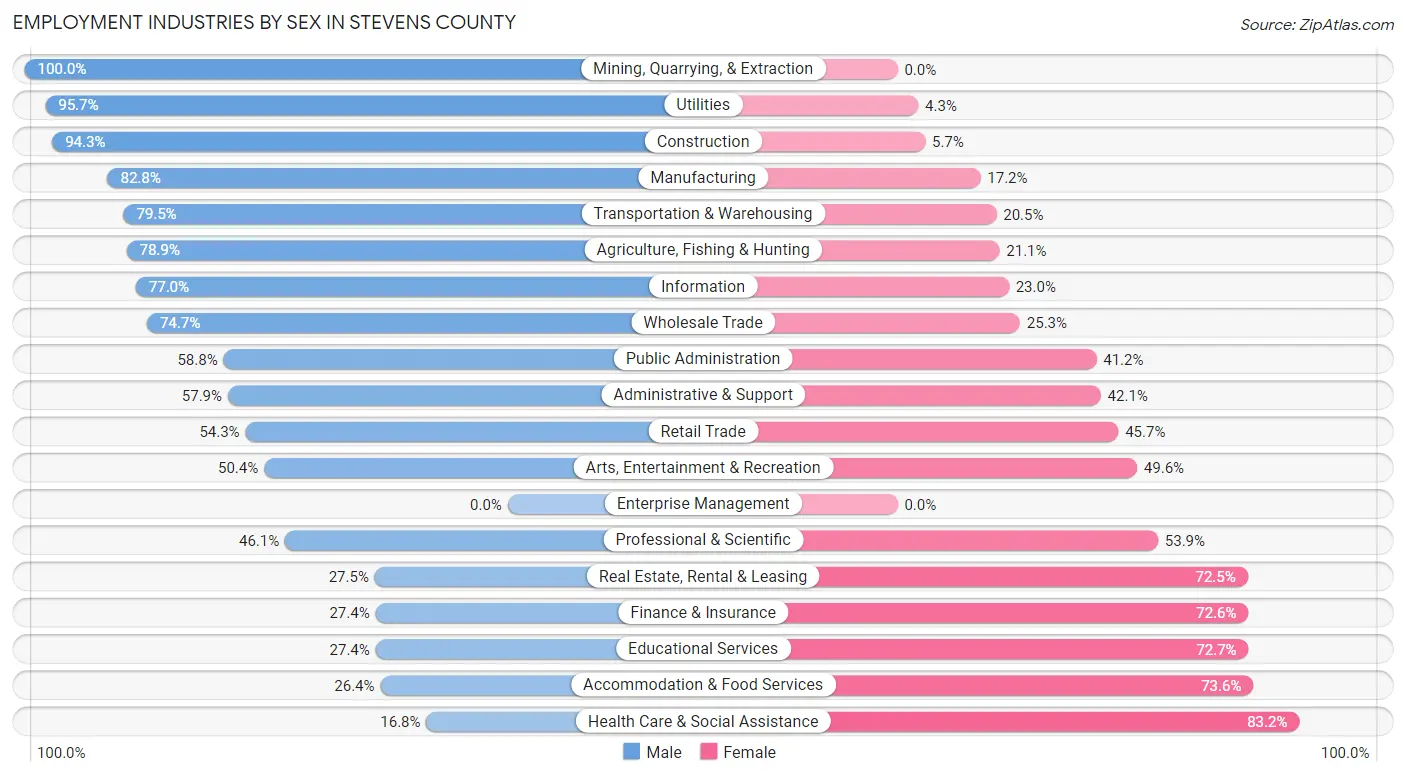
Employment Industries by Sex in Stevens County
The Stevens County industries that see more men than women are Mining, Quarrying, & Extraction (100.0%), Utilities (95.7%), and Construction (94.3%), whereas the industries that tend to have a higher number of women are Health Care & Social Assistance (83.2%), Accommodation & Food Services (73.6%), and Educational Services (72.7%).
| Industry | Male | Female |
| Agriculture, Fishing & Hunting | 632 (78.9%) | 169 (21.1%) |
| Mining, Quarrying, & Extraction | 119 (100.0%) | 0 (0.0%) |
| Construction | 1,351 (94.3%) | 82 (5.7%) |
| Manufacturing | 1,471 (82.8%) | 305 (17.2%) |
| Wholesale Trade | 274 (74.7%) | 93 (25.3%) |
| Retail Trade | 1,151 (54.3%) | 969 (45.7%) |
| Transportation & Warehousing | 641 (79.5%) | 165 (20.5%) |
| Utilities | 201 (95.7%) | 9 (4.3%) |
| Information | 167 (77.0%) | 50 (23.0%) |
| Finance & Insurance | 159 (27.4%) | 422 (72.6%) |
| Real Estate, Rental & Leasing | 68 (27.5%) | 179 (72.5%) |
| Professional & Scientific | 377 (46.1%) | 441 (53.9%) |
| Enterprise Management | 0 (0.0%) | 0 (0.0%) |
| Administrative & Support | 325 (57.9%) | 236 (42.1%) |
| Educational Services | 462 (27.4%) | 1,227 (72.7%) |
| Health Care & Social Assistance | 446 (16.8%) | 2,203 (83.2%) |
| Arts, Entertainment & Recreation | 116 (50.4%) | 114 (49.6%) |
| Accommodation & Food Services | 300 (26.4%) | 838 (73.6%) |
| Public Administration | 763 (58.8%) | 534 (41.2%) |
| Total | 9,481 (52.8%) | 8,481 (47.2%) |
Education in Stevens County
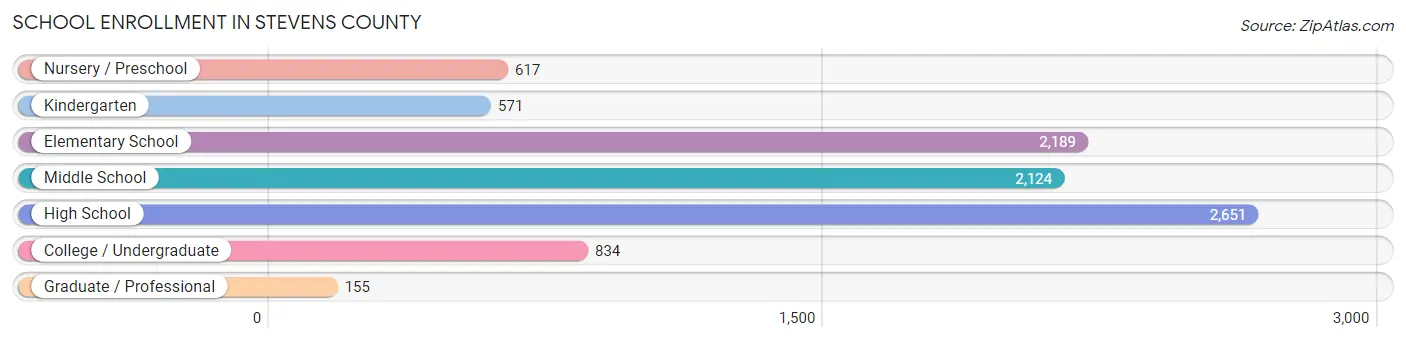
School Enrollment in Stevens County
The most common levels of schooling among the 9,141 students in Stevens County are high school (2,651 | 29.0%), elementary school (2,189 | 23.9%), and middle school (2,124 | 23.2%).
| School Level | # Students | % Students |
| Nursery / Preschool | 617 | 6.8% |
| Kindergarten | 571 | 6.2% |
| Elementary School | 2,189 | 23.9% |
| Middle School | 2,124 | 23.2% |
| High School | 2,651 | 29.0% |
| College / Undergraduate | 834 | 9.1% |
| Graduate / Professional | 155 | 1.7% |
| Total | 9,141 | 100.0% |
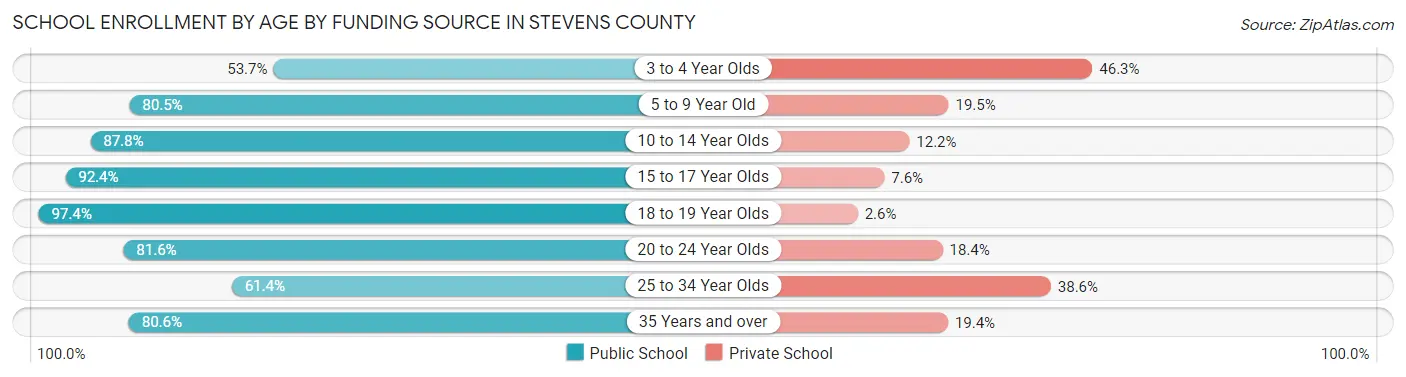
School Enrollment by Age by Funding Source in Stevens County
Out of a total of 9,141 students who are enrolled in schools in Stevens County, 1,426 (15.6%) attend a private institution, while the remaining 7,715 (84.4%) are enrolled in public schools. The age group of 3 to 4 year olds has the highest likelihood of being enrolled in private schools, with 189 (46.3% in the age bracket) enrolled. Conversely, the age group of 18 to 19 year olds has the lowest likelihood of being enrolled in a private school, with 559 (97.4% in the age bracket) attending a public institution.
| Age Bracket | Public School | Private School |
| 3 to 4 Year Olds | 219 (53.7%) | 189 (46.3%) |
| 5 to 9 Year Old | 2,122 (80.5%) | 515 (19.5%) |
| 10 to 14 Year Olds | 2,401 (87.8%) | 335 (12.2%) |
| 15 to 17 Year Olds | 1,647 (92.4%) | 135 (7.6%) |
| 18 to 19 Year Olds | 559 (97.4%) | 15 (2.6%) |
| 20 to 24 Year Olds | 257 (81.6%) | 58 (18.4%) |
| 25 to 34 Year Olds | 148 (61.4%) | 93 (38.6%) |
| 35 Years and over | 361 (80.6%) | 87 (19.4%) |
| Total | 7,715 (84.4%) | 1,426 (15.6%) |
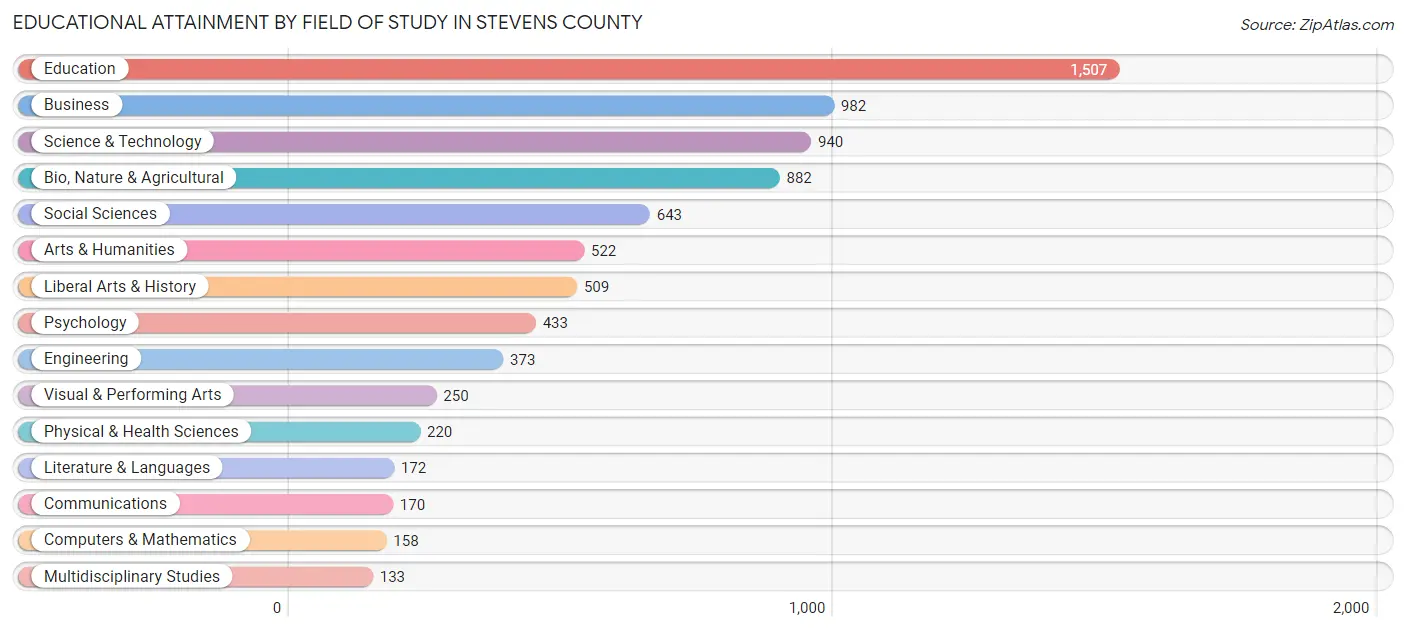
Educational Attainment by Field of Study in Stevens County
Education (1,507 | 19.1%), business (982 | 12.4%), science & technology (940 | 11.9%), bio, nature & agricultural (882 | 11.2%), and social sciences (643 | 8.2%) are the most common fields of study among 7,894 individuals in Stevens County who have obtained a bachelor's degree or higher.
| Field of Study | # Graduates | % Graduates |
| Computers & Mathematics | 158 | 2.0% |
| Bio, Nature & Agricultural | 882 | 11.2% |
| Physical & Health Sciences | 220 | 2.8% |
| Psychology | 433 | 5.5% |
| Social Sciences | 643 | 8.2% |
| Engineering | 373 | 4.7% |
| Multidisciplinary Studies | 133 | 1.7% |
| Science & Technology | 940 | 11.9% |
| Business | 982 | 12.4% |
| Education | 1,507 | 19.1% |
| Literature & Languages | 172 | 2.2% |
| Liberal Arts & History | 509 | 6.5% |
| Visual & Performing Arts | 250 | 3.2% |
| Communications | 170 | 2.1% |
| Arts & Humanities | 522 | 6.6% |
| Total | 7,894 | 100.0% |
Transportation & Commute in Stevens County
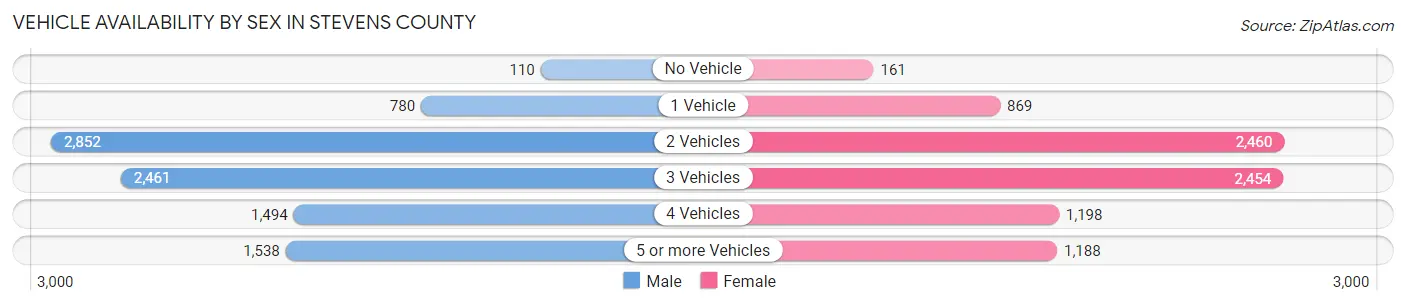
Vehicle Availability by Sex in Stevens County
The most prevalent vehicle ownership categories in Stevens County are males with 2 vehicles (2,852, accounting for 30.9%) and females with 2 vehicles (2,460, making up 34.2%).
| Vehicles Available | Male | Female |
| No Vehicle | 110 (1.2%) | 161 (1.9%) |
| 1 Vehicle | 780 (8.5%) | 869 (10.4%) |
| 2 Vehicles | 2,852 (30.9%) | 2,460 (29.5%) |
| 3 Vehicles | 2,461 (26.7%) | 2,454 (29.5%) |
| 4 Vehicles | 1,494 (16.2%) | 1,198 (14.4%) |
| 5 or more Vehicles | 1,538 (16.7%) | 1,188 (14.3%) |
| Total | 9,235 (100.0%) | 8,330 (100.0%) |
Commute Time in Stevens County
The most frequently occuring commute durations in Stevens County are 5 to 9 minutes (2,379 commuters, 14.9%), 45 to 59 minutes (2,269 commuters, 14.2%), and 30 to 34 minutes (1,917 commuters, 12.0%).
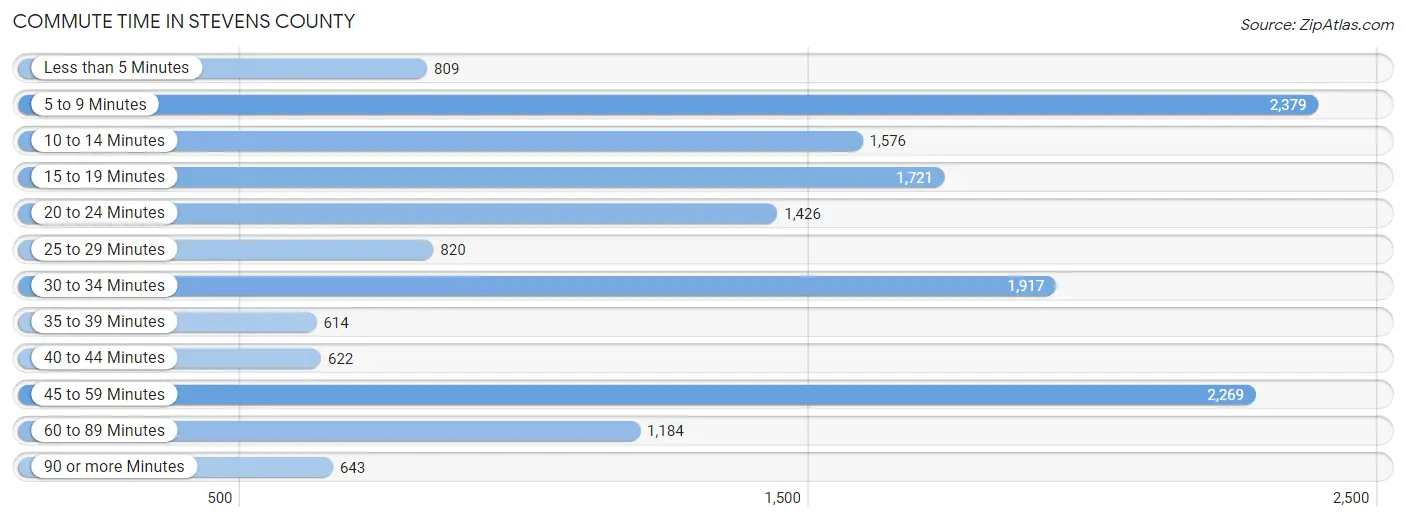
| Commute Time | # Commuters | % Commuters |
| Less than 5 Minutes | 809 | 5.1% |
| 5 to 9 Minutes | 2,379 | 14.9% |
| 10 to 14 Minutes | 1,576 | 9.9% |
| 15 to 19 Minutes | 1,721 | 10.8% |
| 20 to 24 Minutes | 1,426 | 8.9% |
| 25 to 29 Minutes | 820 | 5.1% |
| 30 to 34 Minutes | 1,917 | 12.0% |
| 35 to 39 Minutes | 614 | 3.8% |
| 40 to 44 Minutes | 622 | 3.9% |
| 45 to 59 Minutes | 2,269 | 14.2% |
| 60 to 89 Minutes | 1,184 | 7.4% |
| 90 or more Minutes | 643 | 4.0% |
Commute Time by Sex in Stevens County
The most common commute times in Stevens County are 45 to 59 minutes (1,500 commuters, 17.4%) for males and 5 to 9 minutes (1,349 commuters, 18.3%) for females.
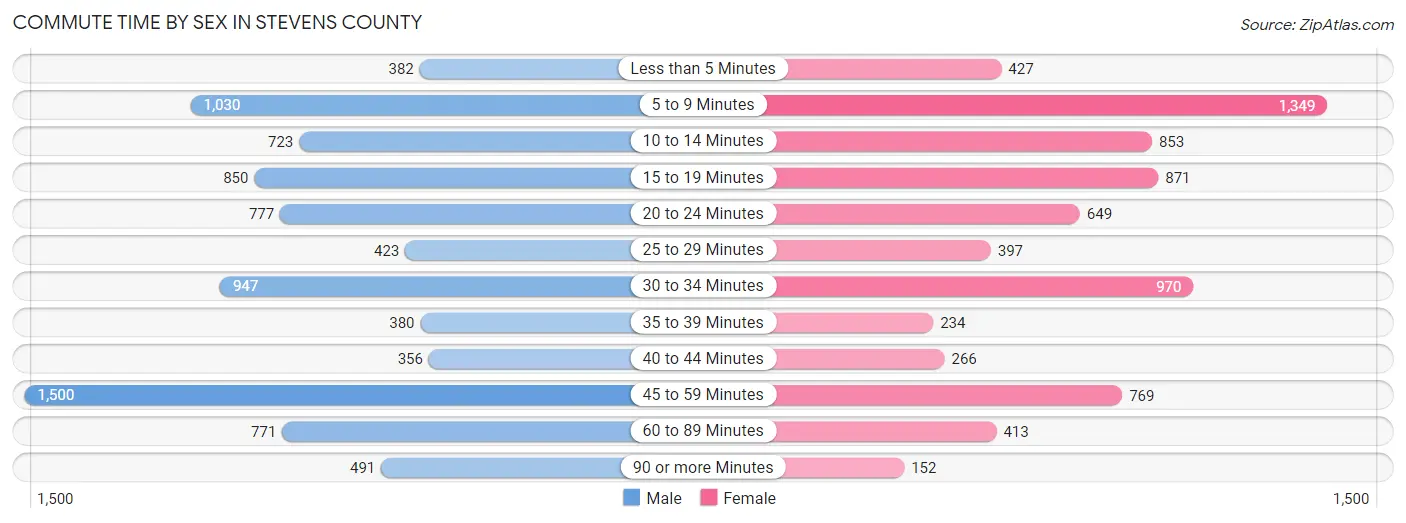
| Commute Time | Male | Female |
| Less than 5 Minutes | 382 (4.4%) | 427 (5.8%) |
| 5 to 9 Minutes | 1,030 (11.9%) | 1,349 (18.3%) |
| 10 to 14 Minutes | 723 (8.4%) | 853 (11.6%) |
| 15 to 19 Minutes | 850 (9.9%) | 871 (11.8%) |
| 20 to 24 Minutes | 777 (9.0%) | 649 (8.8%) |
| 25 to 29 Minutes | 423 (4.9%) | 397 (5.4%) |
| 30 to 34 Minutes | 947 (11.0%) | 970 (13.2%) |
| 35 to 39 Minutes | 380 (4.4%) | 234 (3.2%) |
| 40 to 44 Minutes | 356 (4.1%) | 266 (3.6%) |
| 45 to 59 Minutes | 1,500 (17.4%) | 769 (10.5%) |
| 60 to 89 Minutes | 771 (8.9%) | 413 (5.6%) |
| 90 or more Minutes | 491 (5.7%) | 152 (2.1%) |
Time of Departure to Work by Sex in Stevens County
The most frequent times of departure to work in Stevens County are 12:00 AM to 4:59 AM (1,315, 15.2%) for males and 7:30 AM to 7:59 AM (1,261, 17.2%) for females.
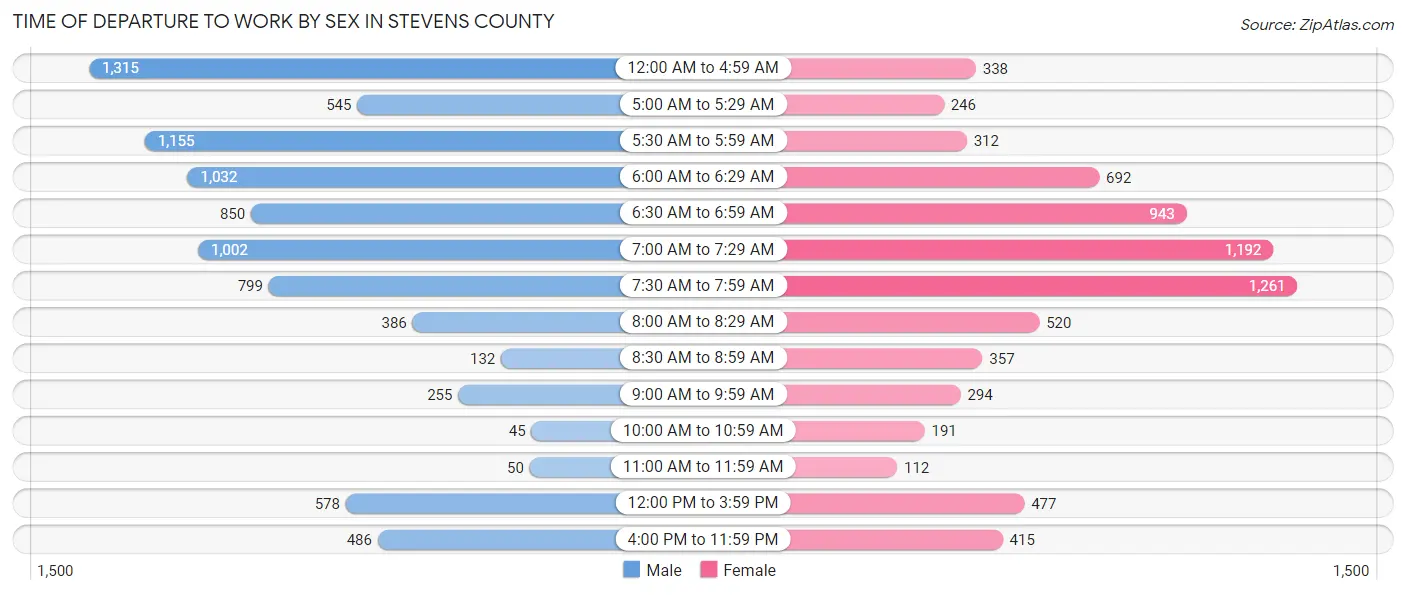
| Time of Departure | Male | Female |
| 12:00 AM to 4:59 AM | 1,315 (15.2%) | 338 (4.6%) |
| 5:00 AM to 5:29 AM | 545 (6.3%) | 246 (3.4%) |
| 5:30 AM to 5:59 AM | 1,155 (13.4%) | 312 (4.2%) |
| 6:00 AM to 6:29 AM | 1,032 (12.0%) | 692 (9.4%) |
| 6:30 AM to 6:59 AM | 850 (9.9%) | 943 (12.8%) |
| 7:00 AM to 7:29 AM | 1,002 (11.6%) | 1,192 (16.2%) |
| 7:30 AM to 7:59 AM | 799 (9.3%) | 1,261 (17.2%) |
| 8:00 AM to 8:29 AM | 386 (4.5%) | 520 (7.1%) |
| 8:30 AM to 8:59 AM | 132 (1.5%) | 357 (4.9%) |
| 9:00 AM to 9:59 AM | 255 (2.9%) | 294 (4.0%) |
| 10:00 AM to 10:59 AM | 45 (0.5%) | 191 (2.6%) |
| 11:00 AM to 11:59 AM | 50 (0.6%) | 112 (1.5%) |
| 12:00 PM to 3:59 PM | 578 (6.7%) | 477 (6.5%) |
| 4:00 PM to 11:59 PM | 486 (5.6%) | 415 (5.7%) |
| Total | 8,630 (100.0%) | 7,350 (100.0%) |
Housing Occupancy in Stevens County
Occupancy by Ownership in Stevens County
Of the total 18,471 dwellings in Stevens County, owner-occupied units account for 14,726 (79.7%), while renter-occupied units make up 3,745 (20.3%).
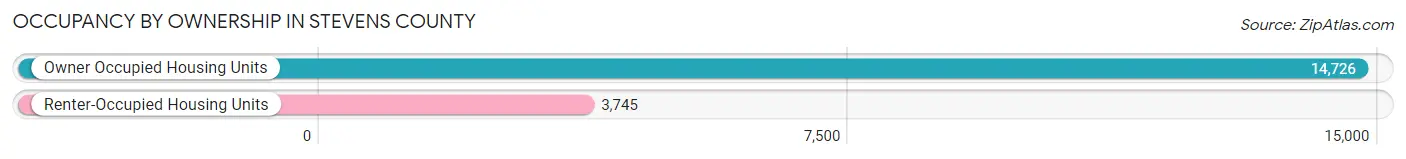
| Occupancy | # Housing Units | % Housing Units |
| Owner Occupied Housing Units | 14,726 | 79.7% |
| Renter-Occupied Housing Units | 3,745 | 20.3% |
| Total Occupied Housing Units | 18,471 | 100.0% |
Occupancy by Household Size in Stevens County
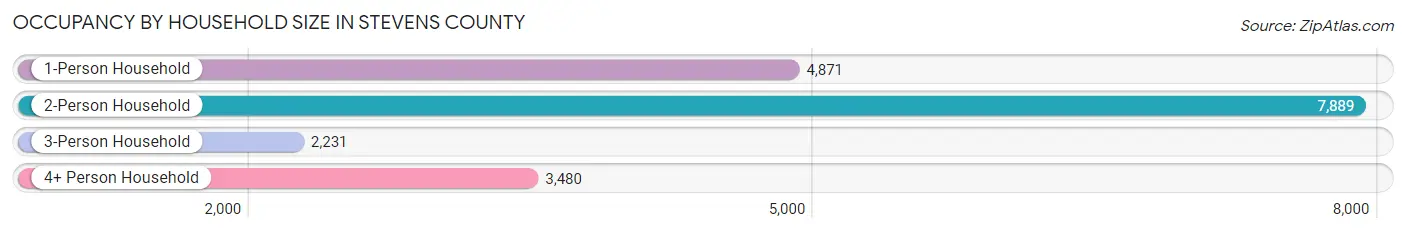
| Household Size | # Housing Units | % Housing Units |
| 1-Person Household | 4,871 | 26.4% |
| 2-Person Household | 7,889 | 42.7% |
| 3-Person Household | 2,231 | 12.1% |
| 4+ Person Household | 3,480 | 18.8% |
| Total Housing Units | 18,471 | 100.0% |
Occupancy by Ownership by Household Size in Stevens County
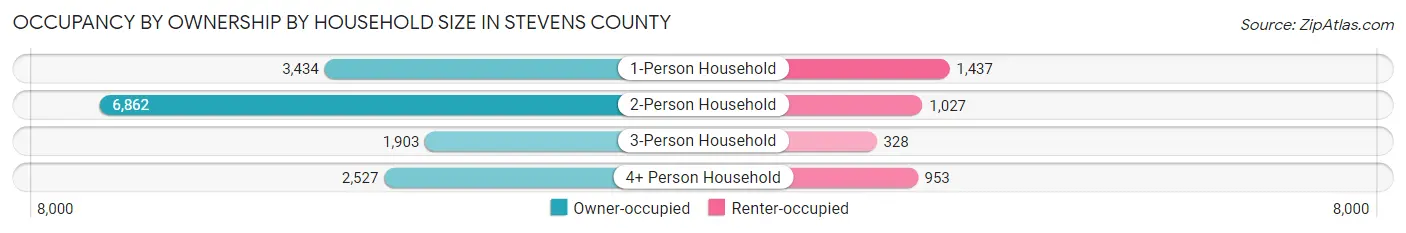
| Household Size | Owner-occupied | Renter-occupied |
| 1-Person Household | 3,434 (70.5%) | 1,437 (29.5%) |
| 2-Person Household | 6,862 (87.0%) | 1,027 (13.0%) |
| 3-Person Household | 1,903 (85.3%) | 328 (14.7%) |
| 4+ Person Household | 2,527 (72.6%) | 953 (27.4%) |
| Total Housing Units | 14,726 (79.7%) | 3,745 (20.3%) |
Occupancy by Educational Attainment in Stevens County
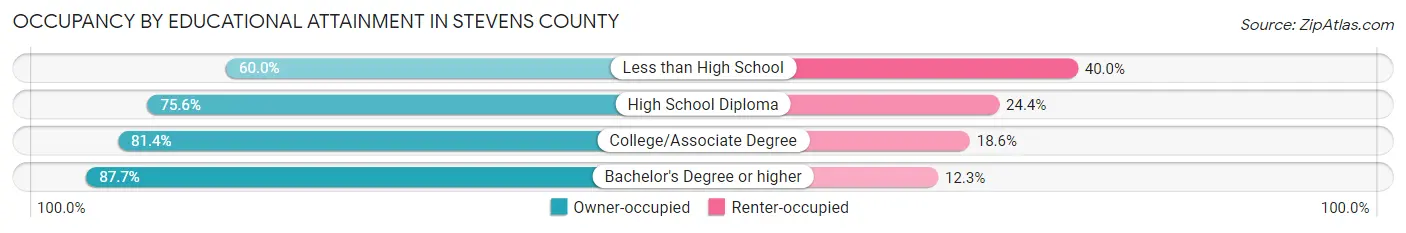
| Household Size | Owner-occupied | Renter-occupied |
| Less than High School | 727 (60.0%) | 484 (40.0%) |
| High School Diploma | 4,291 (75.6%) | 1,383 (24.4%) |
| College/Associate Degree | 5,921 (81.4%) | 1,349 (18.6%) |
| Bachelor's Degree or higher | 3,787 (87.7%) | 529 (12.3%) |
Occupancy by Age of Householder in Stevens County
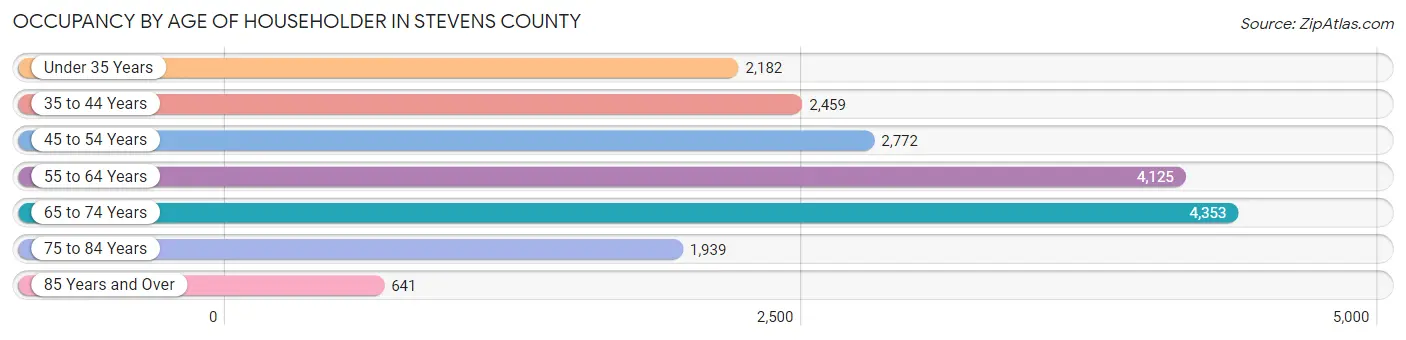
| Age Bracket | # Households | % Households |
| Under 35 Years | 2,182 | 11.8% |
| 35 to 44 Years | 2,459 | 13.3% |
| 45 to 54 Years | 2,772 | 15.0% |
| 55 to 64 Years | 4,125 | 22.3% |
| 65 to 74 Years | 4,353 | 23.6% |
| 75 to 84 Years | 1,939 | 10.5% |
| 85 Years and Over | 641 | 3.5% |
| Total | 18,471 | 100.0% |
Housing Finances in Stevens County
Median Income by Occupancy in Stevens County
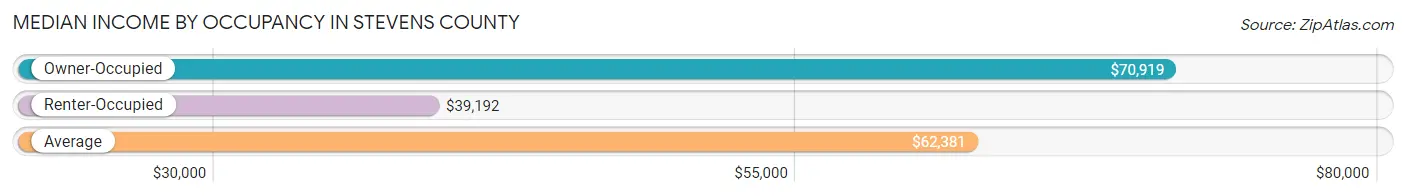
| Occupancy Type | # Households | Median Income |
| Owner-Occupied | 14,726 (79.7%) | $70,919 |
| Renter-Occupied | 3,745 (20.3%) | $39,192 |
| Average | 18,471 (100.0%) | $62,381 |
Occupancy by Householder Income Bracket in Stevens County
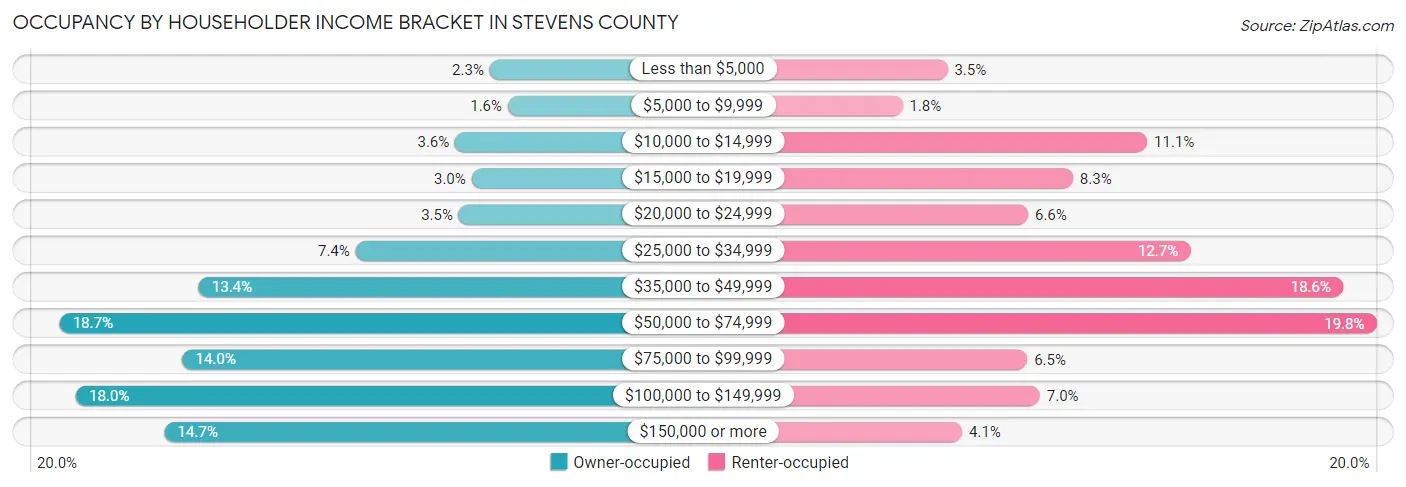
| Income Bracket | Owner-occupied | Renter-occupied |
| Less than $5,000 | 336 (2.3%) | 131 (3.5%) |
| $5,000 to $9,999 | 234 (1.6%) | 67 (1.8%) |
| $10,000 to $14,999 | 530 (3.6%) | 416 (11.1%) |
| $15,000 to $19,999 | 437 (3.0%) | 310 (8.3%) |
| $20,000 to $24,999 | 509 (3.5%) | 246 (6.6%) |
| $25,000 to $34,999 | 1,088 (7.4%) | 477 (12.7%) |
| $35,000 to $49,999 | 1,968 (13.4%) | 695 (18.6%) |
| $50,000 to $74,999 | 2,748 (18.7%) | 743 (19.8%) |
| $75,000 to $99,999 | 2,059 (14.0%) | 245 (6.5%) |
| $100,000 to $149,999 | 2,657 (18.0%) | 263 (7.0%) |
| $150,000 or more | 2,160 (14.7%) | 152 (4.1%) |
| Total | 14,726 (100.0%) | 3,745 (100.0%) |
Monthly Housing Cost Tiers in Stevens County
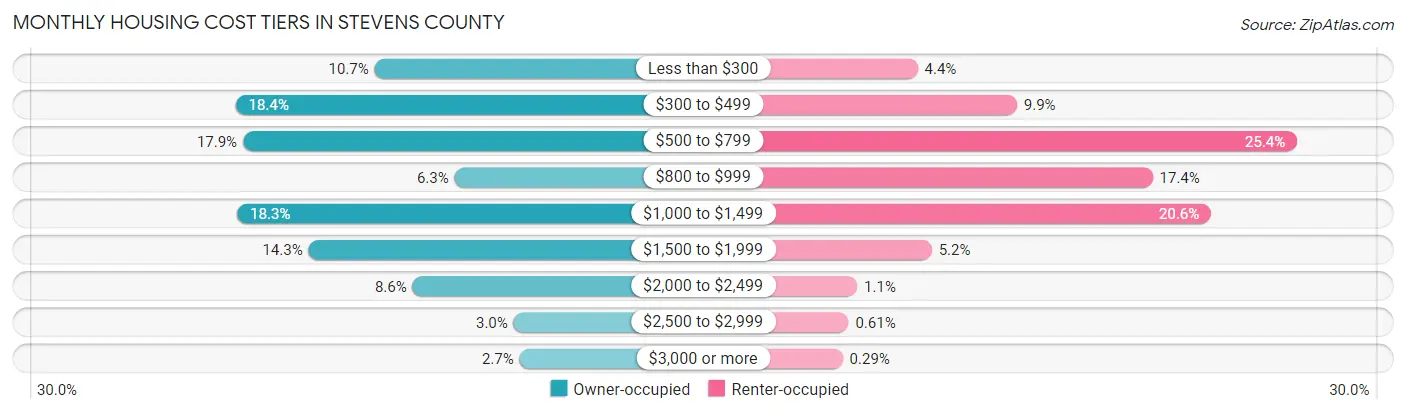
| Monthly Cost | Owner-occupied | Renter-occupied |
| Less than $300 | 1,571 (10.7%) | 166 (4.4%) |
| $300 to $499 | 2,702 (18.3%) | 371 (9.9%) |
| $500 to $799 | 2,642 (17.9%) | 951 (25.4%) |
| $800 to $999 | 920 (6.2%) | 652 (17.4%) |
| $1,000 to $1,499 | 2,689 (18.3%) | 773 (20.6%) |
| $1,500 to $1,999 | 2,109 (14.3%) | 195 (5.2%) |
| $2,000 to $2,499 | 1,262 (8.6%) | 41 (1.1%) |
| $2,500 to $2,999 | 440 (3.0%) | 23 (0.6%) |
| $3,000 or more | 391 (2.7%) | 11 (0.3%) |
| Total | 14,726 (100.0%) | 3,745 (100.0%) |
Physical Housing Characteristics in Stevens County
Housing Structures in Stevens County
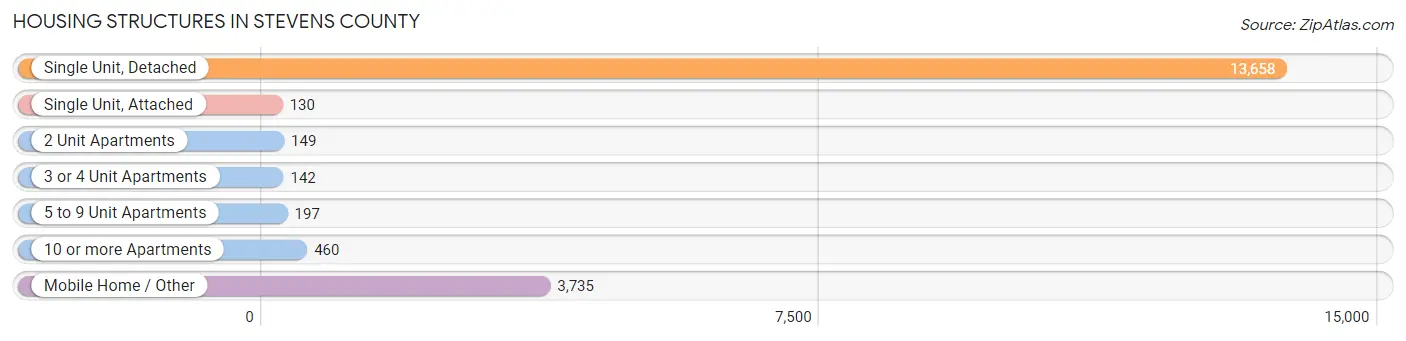
| Structure Type | # Housing Units | % Housing Units |
| Single Unit, Detached | 13,658 | 73.9% |
| Single Unit, Attached | 130 | 0.7% |
| 2 Unit Apartments | 149 | 0.8% |
| 3 or 4 Unit Apartments | 142 | 0.8% |
| 5 to 9 Unit Apartments | 197 | 1.1% |
| 10 or more Apartments | 460 | 2.5% |
| Mobile Home / Other | 3,735 | 20.2% |
| Total | 18,471 | 100.0% |
Housing Structures by Occupancy in Stevens County
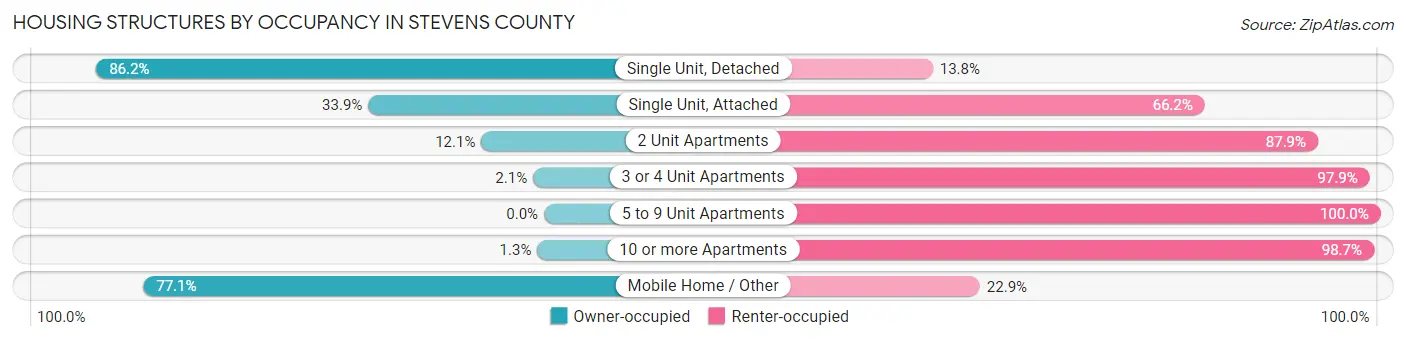
| Structure Type | Owner-occupied | Renter-occupied |
| Single Unit, Detached | 11,774 (86.2%) | 1,884 (13.8%) |
| Single Unit, Attached | 44 (33.9%) | 86 (66.1%) |
| 2 Unit Apartments | 18 (12.1%) | 131 (87.9%) |
| 3 or 4 Unit Apartments | 3 (2.1%) | 139 (97.9%) |
| 5 to 9 Unit Apartments | 0 (0.0%) | 197 (100.0%) |
| 10 or more Apartments | 6 (1.3%) | 454 (98.7%) |
| Mobile Home / Other | 2,881 (77.1%) | 854 (22.9%) |
| Total | 14,726 (79.7%) | 3,745 (20.3%) |
Housing Structures by Number of Rooms in Stevens County
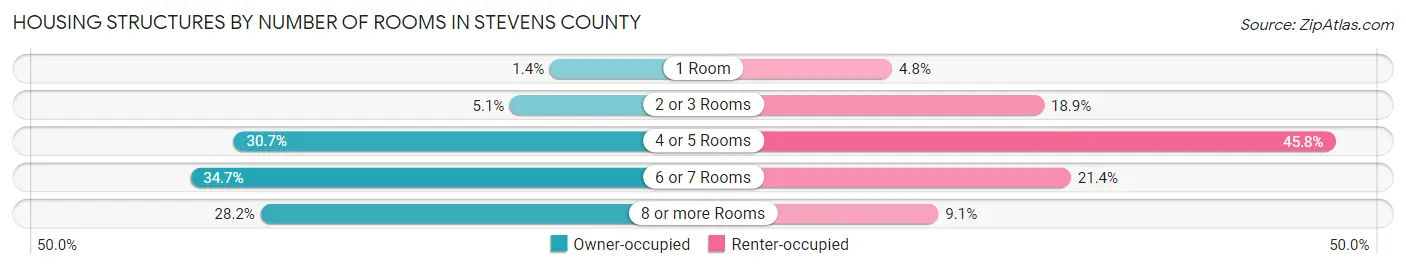
| Number of Rooms | Owner-occupied | Renter-occupied |
| 1 Room | 207 (1.4%) | 181 (4.8%) |
| 2 or 3 Rooms | 749 (5.1%) | 707 (18.9%) |
| 4 or 5 Rooms | 4,516 (30.7%) | 1,716 (45.8%) |
| 6 or 7 Rooms | 5,106 (34.7%) | 800 (21.4%) |
| 8 or more Rooms | 4,148 (28.2%) | 341 (9.1%) |
| Total | 14,726 (100.0%) | 3,745 (100.0%) |
Housing Structure by Heating Type in Stevens County
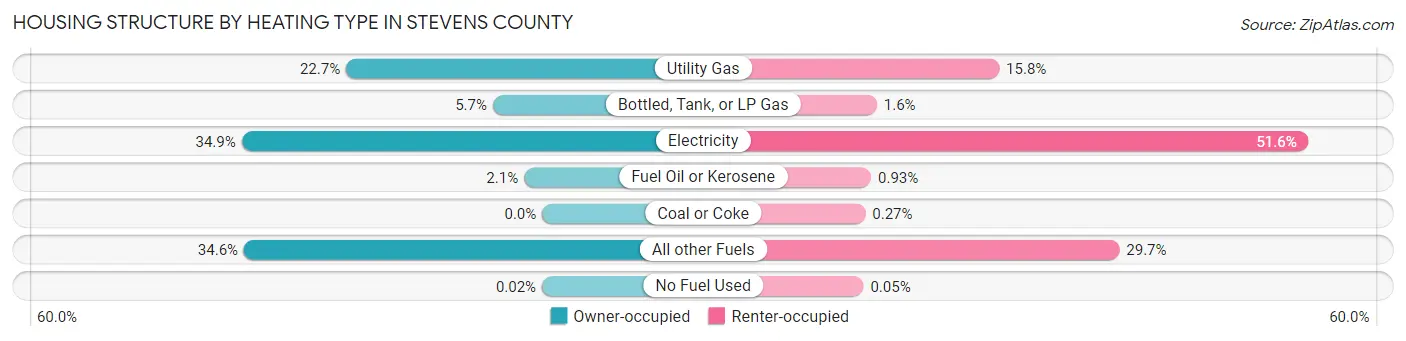
| Heating Type | Owner-occupied | Renter-occupied |
| Utility Gas | 3,349 (22.7%) | 591 (15.8%) |
| Bottled, Tank, or LP Gas | 842 (5.7%) | 60 (1.6%) |
| Electricity | 5,132 (34.8%) | 1,934 (51.6%) |
| Fuel Oil or Kerosene | 309 (2.1%) | 35 (0.9%) |
| Coal or Coke | 0 (0.0%) | 10 (0.3%) |
| All other Fuels | 5,091 (34.6%) | 1,113 (29.7%) |
| No Fuel Used | 3 (0.0%) | 2 (0.1%) |
| Total | 14,726 (100.0%) | 3,745 (100.0%) |
Household Vehicle Usage in Stevens County
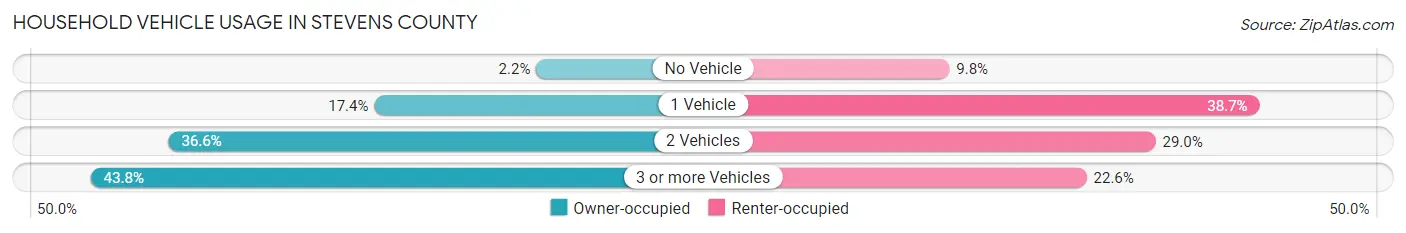
| Vehicles per Household | Owner-occupied | Renter-occupied |
| No Vehicle | 330 (2.2%) | 365 (9.8%) |
| 1 Vehicle | 2,557 (17.4%) | 1,449 (38.7%) |
| 2 Vehicles | 5,385 (36.6%) | 1,086 (29.0%) |
| 3 or more Vehicles | 6,454 (43.8%) | 845 (22.6%) |
| Total | 14,726 (100.0%) | 3,745 (100.0%) |
Real Estate & Mortgages in Stevens County
Real Estate and Mortgage Overview in Stevens County
| Characteristic | Without Mortgage | With Mortgage |
| Housing Units | 6,747 | 7,979 |
| Median Property Value | $229,800 | $311,600 |
| Median Household Income | $55,218 | $1,593 |
| Monthly Housing Costs | $441 | $388 |
| Real Estate Taxes | $1,629 | $221 |
Property Value by Mortgage Status in Stevens County
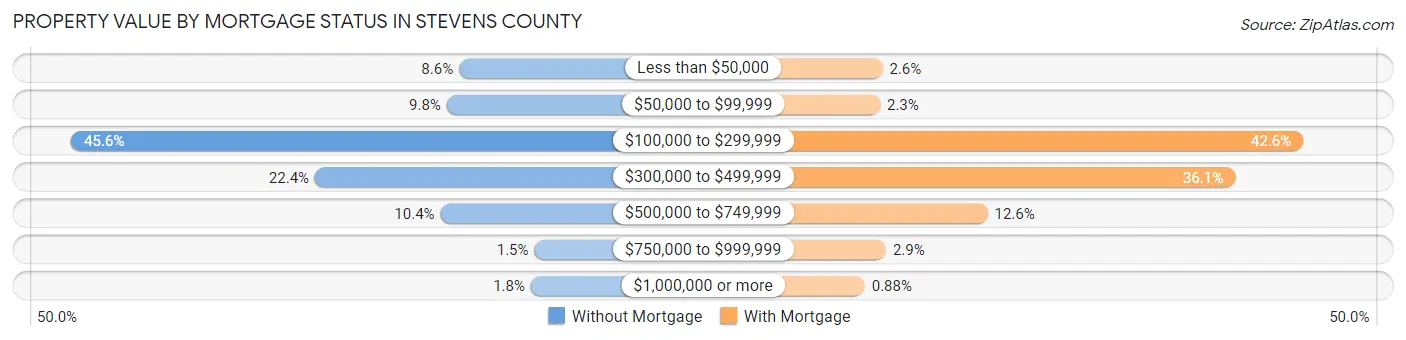
| Property Value | Without Mortgage | With Mortgage |
| Less than $50,000 | 582 (8.6%) | 204 (2.6%) |
| $50,000 to $99,999 | 661 (9.8%) | 186 (2.3%) |
| $100,000 to $299,999 | 3,075 (45.6%) | 3,401 (42.6%) |
| $300,000 to $499,999 | 1,508 (22.4%) | 2,884 (36.1%) |
| $500,000 to $749,999 | 702 (10.4%) | 1,003 (12.6%) |
| $750,000 to $999,999 | 98 (1.5%) | 231 (2.9%) |
| $1,000,000 or more | 121 (1.8%) | 70 (0.9%) |
| Total | 6,747 (100.0%) | 7,979 (100.0%) |
Household Income by Mortgage Status in Stevens County
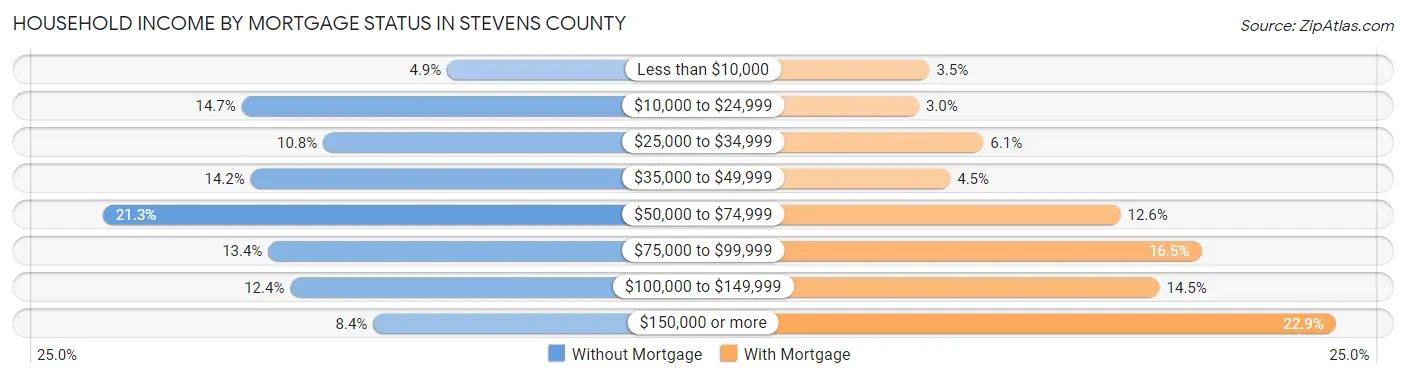
| Household Income | Without Mortgage | With Mortgage |
| Less than $10,000 | 329 (4.9%) | 281 (3.5%) |
| $10,000 to $24,999 | 990 (14.7%) | 241 (3.0%) |
| $25,000 to $34,999 | 728 (10.8%) | 486 (6.1%) |
| $35,000 to $49,999 | 961 (14.2%) | 360 (4.5%) |
| $50,000 to $74,999 | 1,435 (21.3%) | 1,007 (12.6%) |
| $75,000 to $99,999 | 904 (13.4%) | 1,313 (16.5%) |
| $100,000 to $149,999 | 833 (12.3%) | 1,155 (14.5%) |
| $150,000 or more | 567 (8.4%) | 1,824 (22.9%) |
| Total | 6,747 (100.0%) | 7,979 (100.0%) |
Property Value to Household Income Ratio in Stevens County
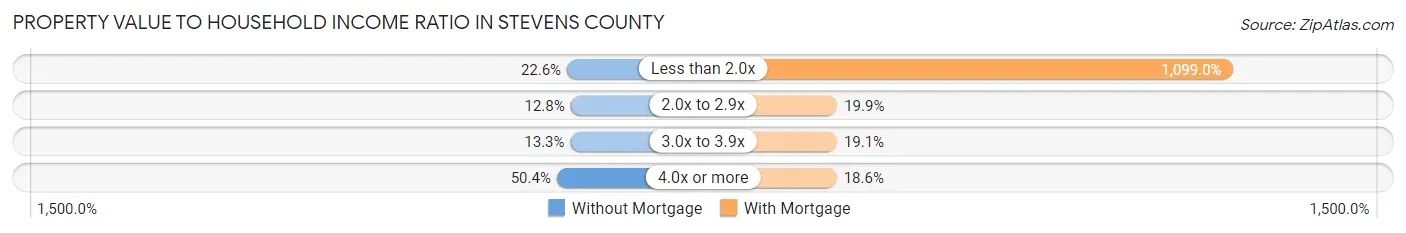
| Value-to-Income Ratio | Without Mortgage | With Mortgage |
| Less than 2.0x | 1,524 (22.6%) | 87,692 (1,099.0%) |
| 2.0x to 2.9x | 862 (12.8%) | 1,591 (19.9%) |
| 3.0x to 3.9x | 897 (13.3%) | 1,525 (19.1%) |
| 4.0x or more | 3,399 (50.4%) | 1,481 (18.6%) |
| Total | 6,747 (100.0%) | 7,979 (100.0%) |
Real Estate Taxes by Mortgage Status in Stevens County
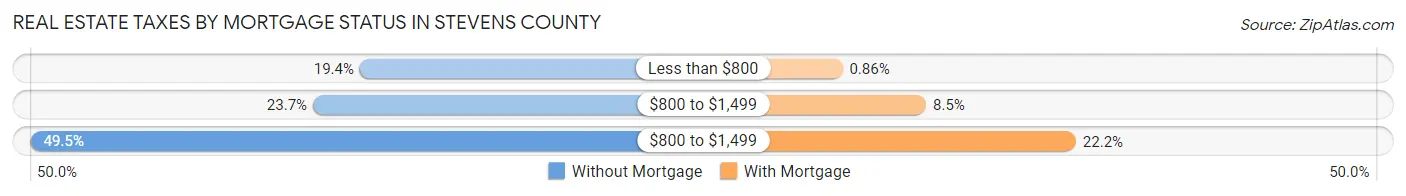
| Property Taxes | Without Mortgage | With Mortgage |
| Less than $800 | 1,308 (19.4%) | 69 (0.9%) |
| $800 to $1,499 | 1,597 (23.7%) | 678 (8.5%) |
| $800 to $1,499 | 3,337 (49.5%) | 1,770 (22.2%) |
| Total | 6,747 (100.0%) | 7,979 (100.0%) |
Health & Disability in Stevens County
Health Insurance Coverage by Age in Stevens County
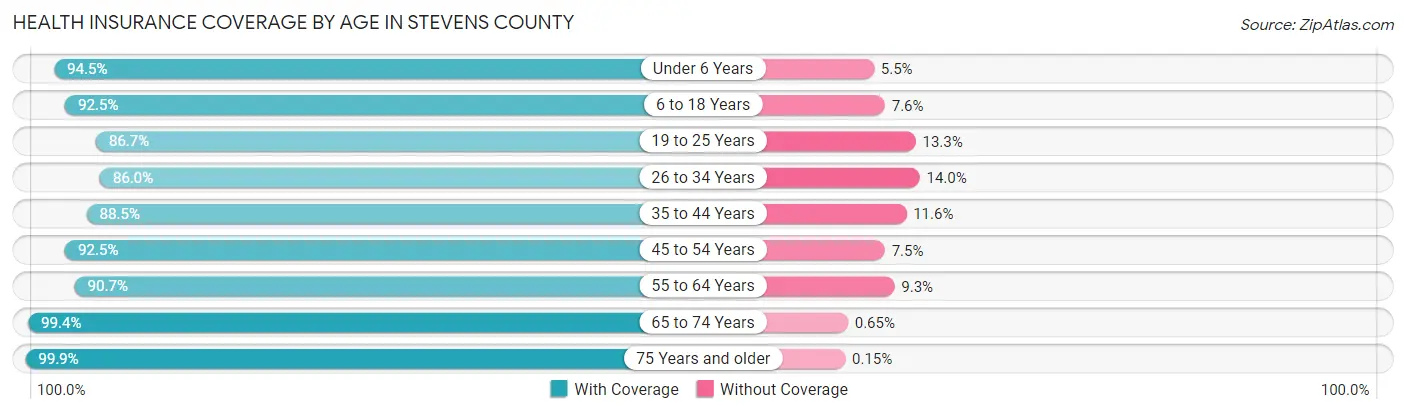
| Age Bracket | With Coverage | Without Coverage |
| Under 6 Years | 2,795 (94.5%) | 163 (5.5%) |
| 6 to 18 Years | 6,844 (92.4%) | 559 (7.5%) |
| 19 to 25 Years | 2,558 (86.7%) | 392 (13.3%) |
| 26 to 34 Years | 3,464 (86.0%) | 566 (14.0%) |
| 35 to 44 Years | 4,386 (88.4%) | 573 (11.6%) |
| 45 to 54 Years | 5,025 (92.5%) | 410 (7.5%) |
| 55 to 64 Years | 6,931 (90.7%) | 713 (9.3%) |
| 65 to 74 Years | 7,141 (99.4%) | 47 (0.6%) |
| 75 Years and older | 3,998 (99.9%) | 6 (0.2%) |
| Total | 43,142 (92.6%) | 3,429 (7.4%) |
Health Insurance Coverage by Citizenship Status in Stevens County
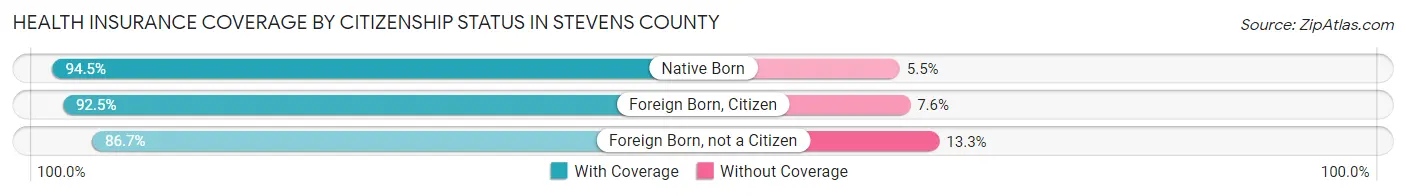
| Citizenship Status | With Coverage | Without Coverage |
| Native Born | 2,795 (94.5%) | 163 (5.5%) |
| Foreign Born, Citizen | 6,844 (92.4%) | 559 (7.5%) |
| Foreign Born, not a Citizen | 2,558 (86.7%) | 392 (13.3%) |
Health Insurance Coverage by Household Income in Stevens County
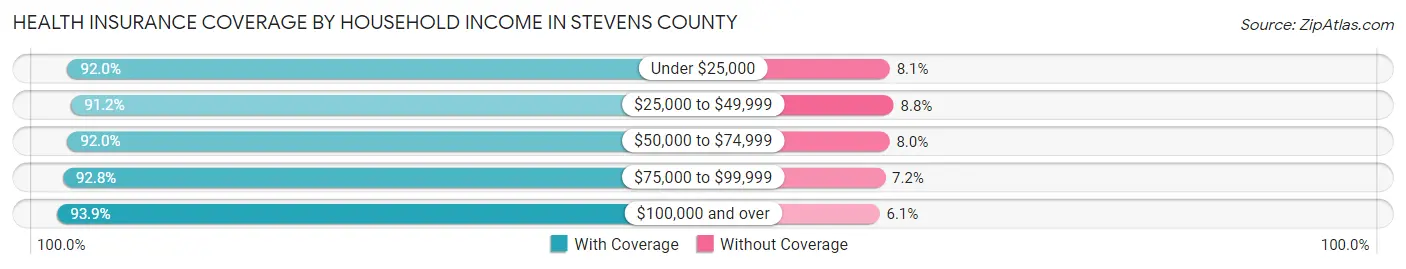
| Household Income | With Coverage | Without Coverage |
| Under $25,000 | 4,627 (91.9%) | 405 (8.1%) |
| $25,000 to $49,999 | 8,823 (91.2%) | 848 (8.8%) |
| $50,000 to $74,999 | 7,337 (92.0%) | 638 (8.0%) |
| $75,000 to $99,999 | 6,335 (92.8%) | 490 (7.2%) |
| $100,000 and over | 15,918 (93.9%) | 1,041 (6.1%) |
Public vs Private Health Insurance Coverage by Age in Stevens County
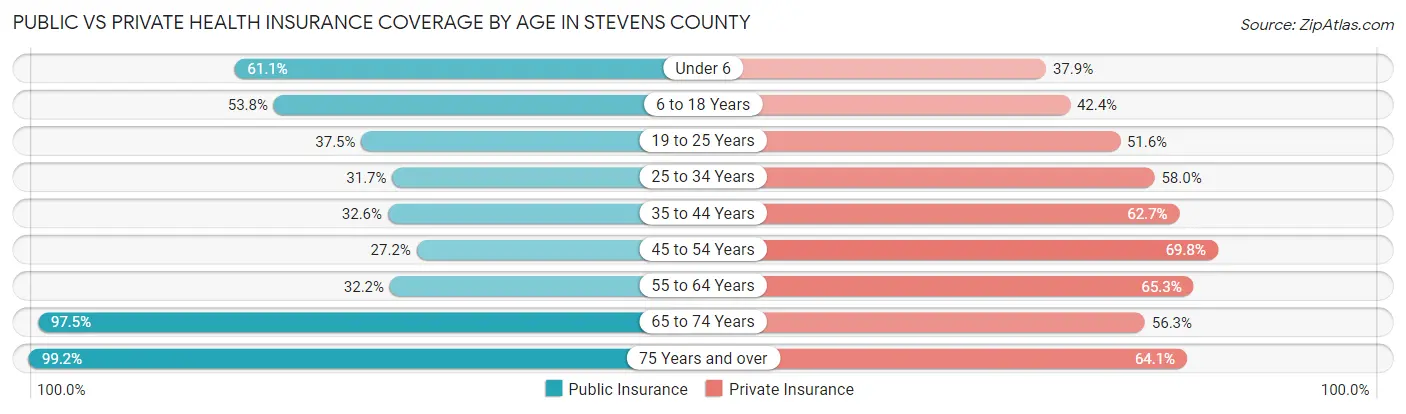
| Age Bracket | Public Insurance | Private Insurance |
| Under 6 | 1,806 (61.1%) | 1,121 (37.9%) |
| 6 to 18 Years | 3,979 (53.7%) | 3,135 (42.3%) |
| 19 to 25 Years | 1,106 (37.5%) | 1,523 (51.6%) |
| 25 to 34 Years | 1,279 (31.7%) | 2,339 (58.0%) |
| 35 to 44 Years | 1,615 (32.6%) | 3,108 (62.7%) |
| 45 to 54 Years | 1,480 (27.2%) | 3,792 (69.8%) |
| 55 to 64 Years | 2,461 (32.2%) | 4,991 (65.3%) |
| 65 to 74 Years | 7,011 (97.5%) | 4,043 (56.2%) |
| 75 Years and over | 3,972 (99.2%) | 2,565 (64.1%) |
| Total | 24,709 (53.1%) | 26,617 (57.2%) |
Disability Status by Sex by Age in Stevens County
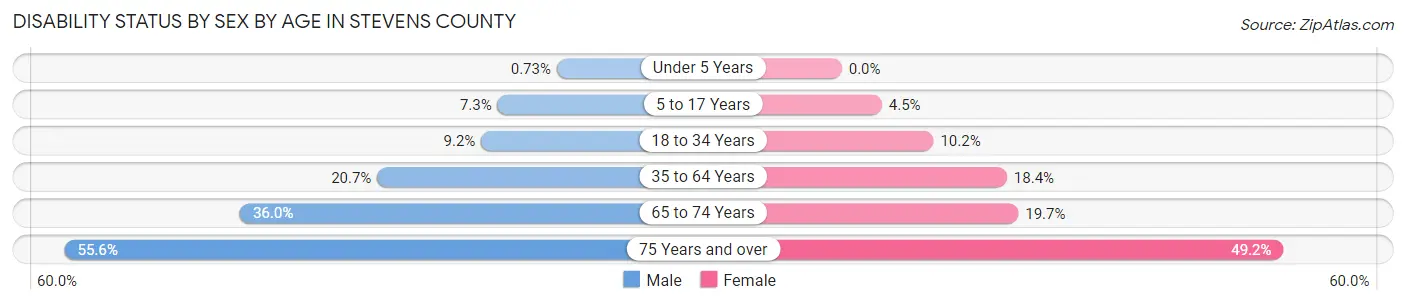
| Age Bracket | Male | Female |
| Under 5 Years | 9 (0.7%) | 0 (0.0%) |
| 5 to 17 Years | 284 (7.3%) | 163 (4.5%) |
| 18 to 34 Years | 343 (9.1%) | 381 (10.2%) |
| 35 to 64 Years | 1,865 (20.7%) | 1,663 (18.4%) |
| 65 to 74 Years | 1,284 (36.0%) | 712 (19.7%) |
| 75 Years and over | 1,056 (55.5%) | 1,034 (49.2%) |
Disability Class by Sex by Age in Stevens County
Disability Class: Hearing Difficulty
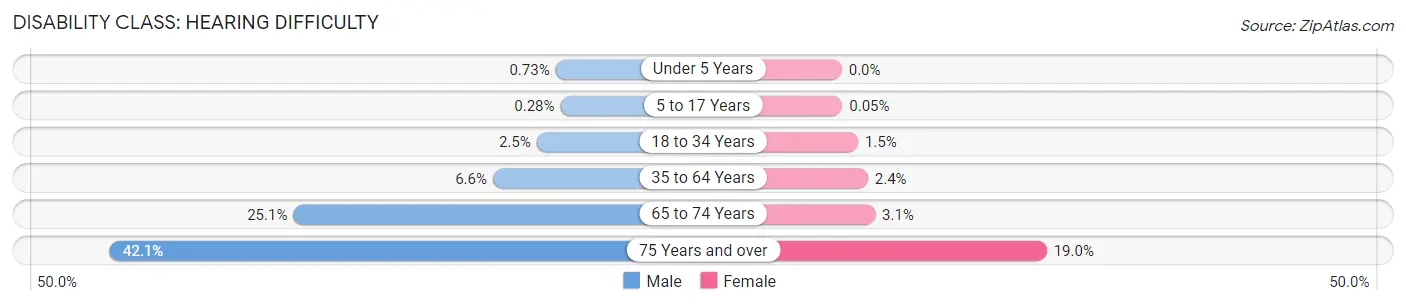
| Age Bracket | Male | Female |
| Under 5 Years | 9 (0.7%) | 0 (0.0%) |
| 5 to 17 Years | 11 (0.3%) | 2 (0.1%) |
| 18 to 34 Years | 93 (2.5%) | 56 (1.5%) |
| 35 to 64 Years | 589 (6.6%) | 219 (2.4%) |
| 65 to 74 Years | 894 (25.1%) | 112 (3.1%) |
| 75 Years and over | 800 (42.1%) | 400 (19.0%) |
Disability Class: Vision Difficulty
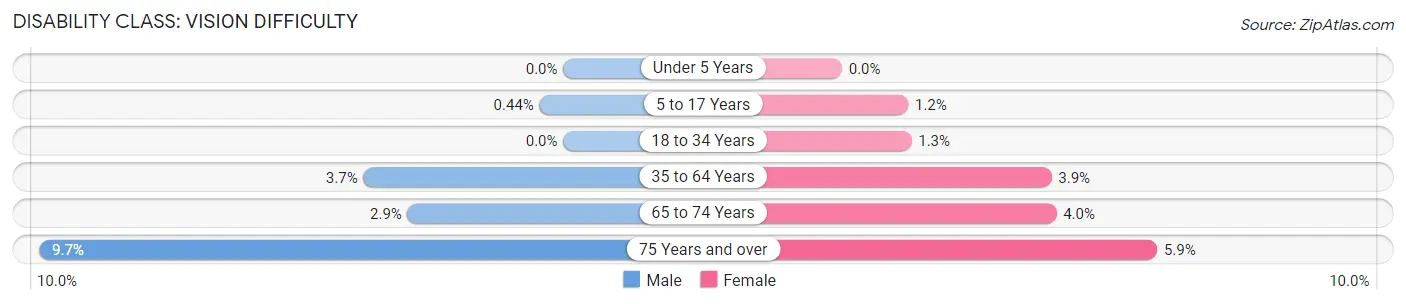
| Age Bracket | Male | Female |
| Under 5 Years | 0 (0.0%) | 0 (0.0%) |
| 5 to 17 Years | 17 (0.4%) | 45 (1.2%) |
| 18 to 34 Years | 0 (0.0%) | 48 (1.3%) |
| 35 to 64 Years | 334 (3.7%) | 352 (3.9%) |
| 65 to 74 Years | 103 (2.9%) | 144 (4.0%) |
| 75 Years and over | 185 (9.7%) | 123 (5.9%) |
Disability Class: Cognitive Difficulty
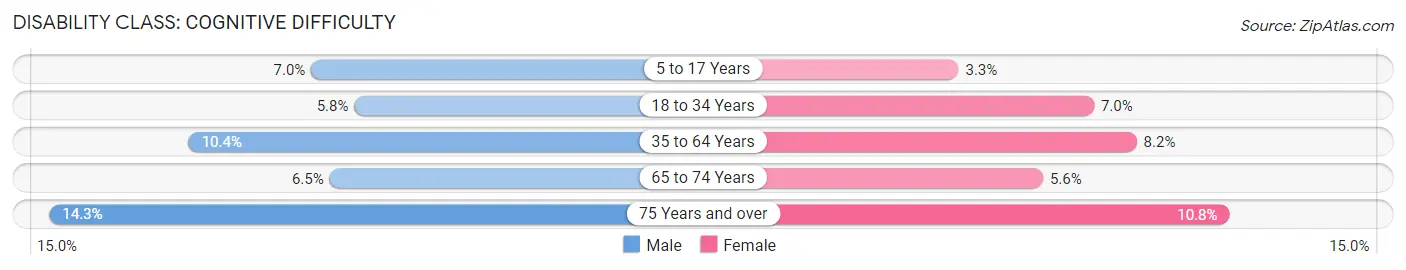
| Age Bracket | Male | Female |
| 5 to 17 Years | 272 (7.0%) | 119 (3.3%) |
| 18 to 34 Years | 218 (5.8%) | 262 (7.0%) |
| 35 to 64 Years | 938 (10.4%) | 742 (8.2%) |
| 65 to 74 Years | 232 (6.5%) | 203 (5.6%) |
| 75 Years and over | 272 (14.3%) | 227 (10.8%) |
Disability Class: Ambulatory Difficulty
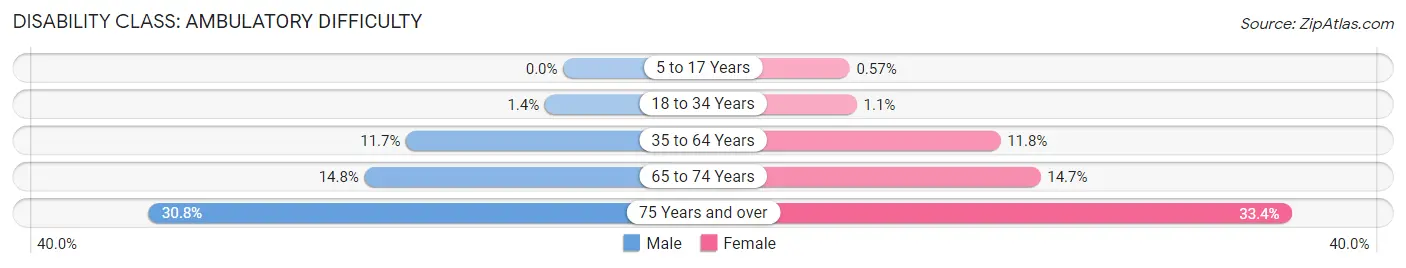
| Age Bracket | Male | Female |
| 5 to 17 Years | 0 (0.0%) | 21 (0.6%) |
| 18 to 34 Years | 51 (1.4%) | 41 (1.1%) |
| 35 to 64 Years | 1,049 (11.7%) | 1,063 (11.8%) |
| 65 to 74 Years | 526 (14.7%) | 534 (14.7%) |
| 75 Years and over | 585 (30.8%) | 702 (33.4%) |
Disability Class: Self-Care Difficulty
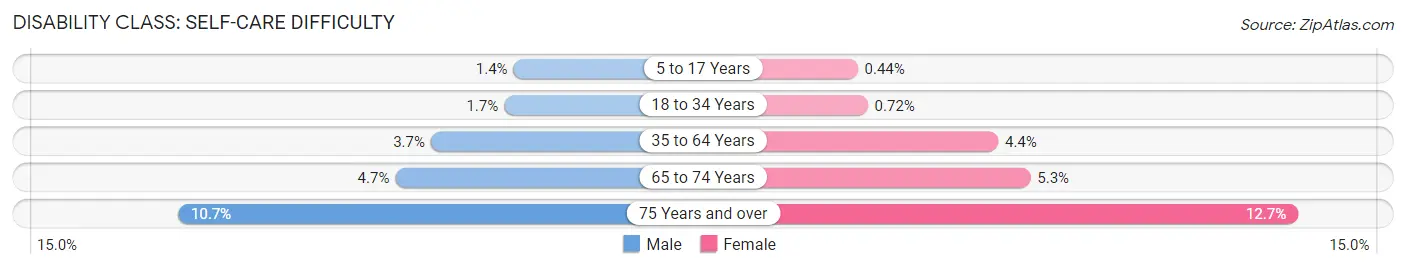
| Age Bracket | Male | Female |
| 5 to 17 Years | 54 (1.4%) | 16 (0.4%) |
| 18 to 34 Years | 62 (1.7%) | 27 (0.7%) |
| 35 to 64 Years | 332 (3.7%) | 393 (4.3%) |
| 65 to 74 Years | 167 (4.7%) | 190 (5.2%) |
| 75 Years and over | 204 (10.7%) | 267 (12.7%) |
Technology Access in Stevens County
Computing Device Access in Stevens County
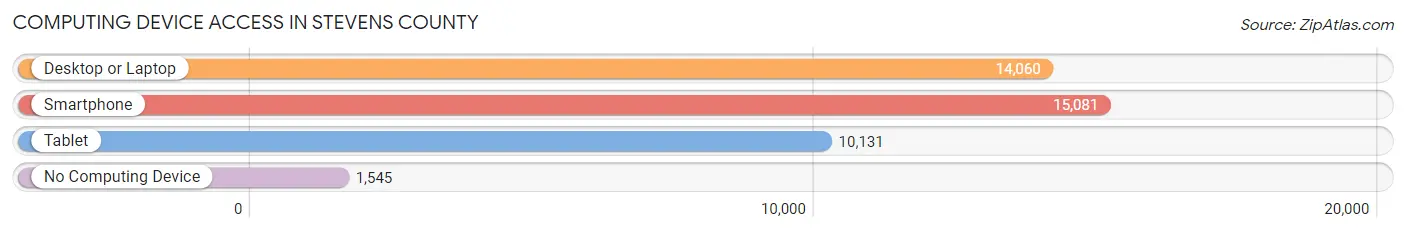
| Device Type | # Households | % Households |
| Desktop or Laptop | 14,060 | 76.1% |
| Smartphone | 15,081 | 81.7% |
| Tablet | 10,131 | 54.8% |
| No Computing Device | 1,545 | 8.4% |
| Total | 18,471 | 100.0% |
Internet Access in Stevens County
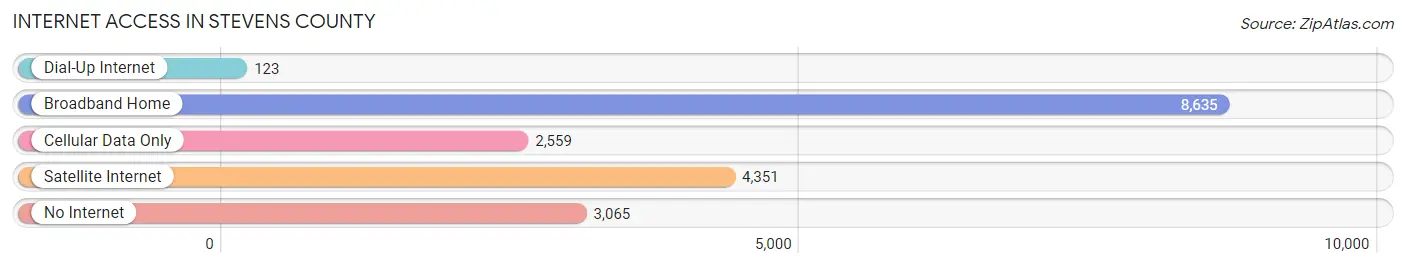
| Internet Type | # Households | % Households |
| Dial-Up Internet | 123 | 0.7% |
| Broadband Home | 8,635 | 46.8% |
| Cellular Data Only | 2,559 | 13.9% |
| Satellite Internet | 4,351 | 23.6% |
| No Internet | 3,065 | 16.6% |
| Total | 18,471 | 100.0% |
Stevens County Summary
Stevens County is located in the northeastern corner of Washington State, bordered by the Canadian province of British Columbia to the north, Pend Oreille County to the east, Spokane County to the south, and Ferry County to the west. The county seat is Colville, and the largest city is Chewelah. The county was created in 1863 and named for Isaac Stevens, the first governor of Washington Territory.
Geography
Stevens County covers an area of 2,541 square miles, making it the fifth-largest county in Washington. The terrain is mostly mountainous, with the Kettle River Range and Selkirk Mountains running through the county. The highest point in the county is Mount Bonaparte, at 8,099 feet. The county is home to several lakes, including Lake Roosevelt, which is the largest lake in the state. The Kettle River, which runs through the county, is a popular destination for whitewater rafting and kayaking.
Demographics
As of the 2010 census, Stevens County had a population of 45,734. The population was spread out, with 24.2% under the age of 18, 8.2% from 18 to 24, 24.2% from 25 to 44, 28.2% from 45 to 64, and 15.2% who were 65 years of age or older. The median age was 40.4 years. The gender makeup of the county was 49.3% male and 50.7% female.
The median income for a household in the county was $41,845, and the median income for a family was $50,845. The per capita income for the county was $20,945. About 13.2% of families and 17.2% of the population were below the poverty line, including 22.2% of those under age 18 and 8.2% of those age 65 or over.
Economy
The economy of Stevens County is largely based on agriculture and natural resources. The county is home to several large farms, and the agricultural industry is the largest employer in the county. The county is also home to several timber companies, and the timber industry is the second-largest employer. Other industries in the county include manufacturing, retail, and tourism.
The county is home to several large employers, including the Colville Tribal Federal Corporation, which is the largest employer in the county. Other major employers include the Colville Tribal Casino, the Colville National Forest, and the Kettle Falls School District.
Conclusion
Stevens County is a rural county located in the northeastern corner of Washington State. The county is home to several large farms and timber companies, and the agricultural and timber industries are the largest employers in the county. The county is also home to several large employers, including the Colville Tribal Federal Corporation and the Colville Tribal Casino. The county has a population of 45,734, and the median income for a household is $41,845.
Common Questions
What is the Total Population of Stevens County?
Total Population of Stevens County is 46,774.
What is the Total Male Population of Stevens County?
Total Male Population of Stevens County is 23,444.
What is the Total Female Population of Stevens County?
Total Female Population of Stevens County is 23,330.
What is the Ratio of Males per 100 Females in Stevens County?
There are 100.49 Males per 100 Females in Stevens County.
What is the Ratio of Females per 100 Males in Stevens County?
There are 99.51 Females per 100 Males in Stevens County.
What is the Median Population Age in Stevens County?
Median Population Age in Stevens County is 46.9 Years.
What is the Average Family Size in Stevens County
Average Family Size in Stevens County is 3.0 People.
What is the Average Household Size in Stevens County
Average Household Size in Stevens County is 2.5 People.
What is Per Capita Income in Stevens County?
Per Capita income in Stevens County is $32,904.
What is the Median Family Income in Stevens County?
Median Family Income in Stevens County is $77,945.
What is the Median Household income in Stevens County?
Median Household Income in Stevens County is $62,381.
What is Income or Wage Gap in Stevens County?
Income or Wage Gap in Stevens County is 38.7%.
Women in Stevens County earn 61.3 cents for every dollar earned by a man.
What is Family Income Deficit in Stevens County?
Family Income Deficit in Stevens County is $10,314.
Families that are below poverty line in Stevens County earn $10,314 less on average than the poverty threshold level.
What is Inequality or Gini Index in Stevens County?
Inequality or Gini Index in Stevens County is 0.44.
How Large is the Labor Force in Stevens County?
There are 18,966 People in the Labor Forcein in Stevens County.
What is the Percentage of People in the Labor Force in Stevens County?
49.7% of People are in the Labor Force in Stevens County.
What is the Unemployment Rate in Stevens County?
Unemployment Rate in Stevens County is 5.3%.