Spokane County, WA
Spokane County Map
Spokane County Overview
538,711
TOTAL POPULATION
269,376
MALE POPULATION
269,335
FEMALE POPULATION
100.02
MALES / 100 FEMALES
99.98
FEMALES / 100 MALES
38.0
MEDIAN AGE
3.0
AVG FAMILY SIZE
2.5
AVG HOUSEHOLD SIZE
$38,052
PER CAPITA INCOME
$89,846
AVG FAMILY INCOME
$70,394
AVG HOUSEHOLD INCOME
25.1%
WAGE / INCOME GAP [ % ]
74.9¢/ $1
WAGE / INCOME GAP [ $ ]
$11,310
FAMILY INCOME DEFICIT
0.45
INEQUALITY / GINI INDEX
268,012
LABOR FORCE [ PEOPLE ]
61.7%
PERCENT IN LABOR FORCE
5.8%
UNEMPLOYMENT RATE
Spokane County Area Codes
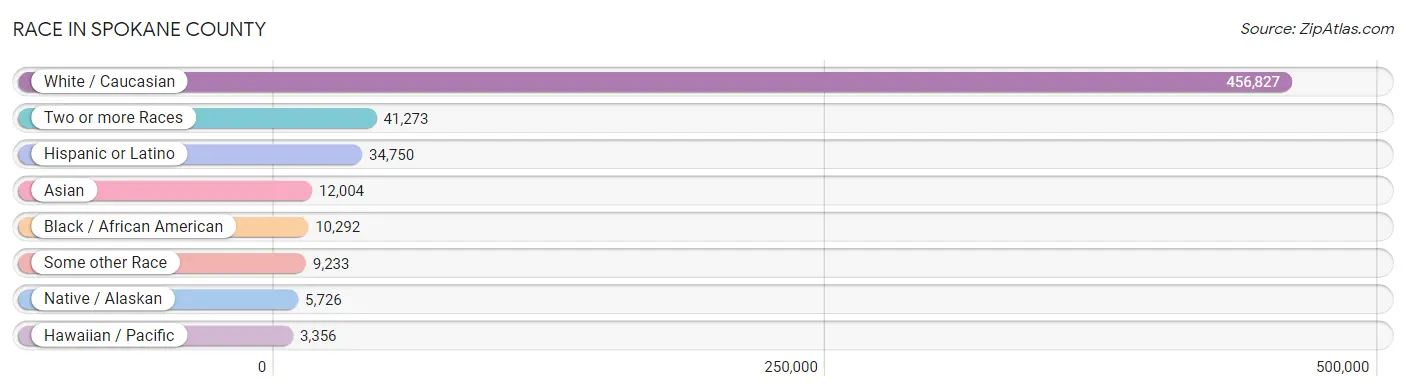
Race in Spokane County
The most populous races in Spokane County are White / Caucasian (456,827 | 84.8%), Two or more Races (41,273 | 7.7%), and Hispanic or Latino (34,750 | 6.5%).
| Race | # Population | % Population |
| Asian | 12,004 | 2.2% |
| Black / African American | 10,292 | 1.9% |
| Hawaiian / Pacific | 3,356 | 0.6% |
| Hispanic or Latino | 34,750 | 6.5% |
| Native / Alaskan | 5,726 | 1.1% |
| White / Caucasian | 456,827 | 84.8% |
| Two or more Races | 41,273 | 7.7% |
| Some other Race | 9,233 | 1.7% |
| Total | 538,711 | 100.0% |
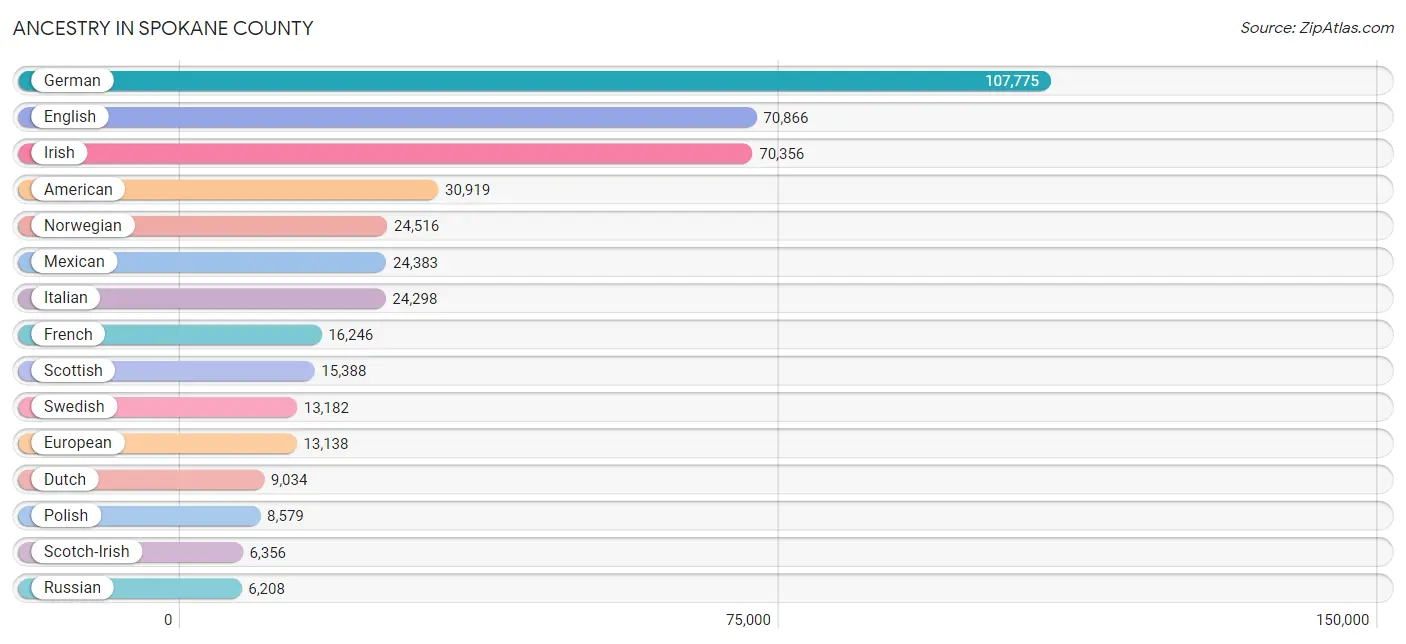
Ancestry in Spokane County
The most populous ancestries reported in Spokane County are German (107,775 | 20.0%), English (70,866 | 13.2%), Irish (70,356 | 13.1%), American (30,919 | 5.7%), and Norwegian (24,516 | 4.5%), together accounting for 56.5% of all Spokane County residents.
| Ancestry | # Population | % Population |
| Afghan | 231 | 0.0% |
| African | 1,101 | 0.2% |
| Alaska Native | 165 | 0.0% |
| Alaskan Athabascan | 78 | 0.0% |
| Albanian | 142 | 0.0% |
| Aleut | 156 | 0.0% |
| American | 30,919 | 5.7% |
| Apache | 293 | 0.1% |
| Arab | 3,084 | 0.6% |
| Arapaho | 10 | 0.0% |
| Argentinean | 40 | 0.0% |
| Armenian | 386 | 0.1% |
| Assyrian / Chaldean / Syriac | 24 | 0.0% |
| Australian | 373 | 0.1% |
| Austrian | 1,709 | 0.3% |
| Bahamian | 9 | 0.0% |
| Bangladeshi | 267 | 0.1% |
| Basque | 300 | 0.1% |
| Belgian | 427 | 0.1% |
| Bhutanese | 4,225 | 0.8% |
| Blackfeet | 1,489 | 0.3% |
| Bolivian | 46 | 0.0% |
| Brazilian | 150 | 0.0% |
| British | 3,748 | 0.7% |
| British West Indian | 21 | 0.0% |
| Bulgarian | 47 | 0.0% |
| Burmese | 1,997 | 0.4% |
| Cajun | 13 | 0.0% |
| Cambodian | 248 | 0.1% |
| Canadian | 1,551 | 0.3% |
| Cape Verdean | 47 | 0.0% |
| Celtic | 89 | 0.0% |
| Central American | 1,139 | 0.2% |
| Central American Indian | 198 | 0.0% |
| Cherokee | 1,672 | 0.3% |
| Cheyenne | 37 | 0.0% |
| Chickasaw | 28 | 0.0% |
| Chilean | 52 | 0.0% |
| Chinese | 10 | 0.0% |
| Chippewa | 713 | 0.1% |
| Choctaw | 305 | 0.1% |
| Colombian | 198 | 0.0% |
| Colville | 1,179 | 0.2% |
| Comanche | 60 | 0.0% |
| Costa Rican | 117 | 0.0% |
| Cree | 74 | 0.0% |
| Creek | 109 | 0.0% |
| Croatian | 960 | 0.2% |
| Crow | 72 | 0.0% |
| Cuban | 631 | 0.1% |
| Czech | 2,554 | 0.5% |
| Czechoslovakian | 305 | 0.1% |
| Danish | 4,699 | 0.9% |
| Delaware | 8 | 0.0% |
| Dominican | 79 | 0.0% |
| Dutch | 9,034 | 1.7% |
| Dutch West Indian | 32 | 0.0% |
| Eastern European | 1,560 | 0.3% |
| Ecuadorian | 168 | 0.0% |
| Egyptian | 84 | 0.0% |
| English | 70,866 | 13.2% |
| Estonian | 94 | 0.0% |
| Ethiopian | 391 | 0.1% |
| European | 13,138 | 2.4% |
| Fijian | 1,780 | 0.3% |
| Filipino | 156 | 0.0% |
| Finnish | 2,268 | 0.4% |
| French | 16,246 | 3.0% |
| French American Indian | 141 | 0.0% |
| French Canadian | 3,730 | 0.7% |
| German | 107,775 | 20.0% |
| German Russian | 91 | 0.0% |
| Ghanaian | 16 | 0.0% |
| Greek | 2,211 | 0.4% |
| Guamanian / Chamorro | 519 | 0.1% |
| Guatemalan | 200 | 0.0% |
| Guyanese | 53 | 0.0% |
| Haitian | 74 | 0.0% |
| Hmong | 4 | 0.0% |
| Honduran | 83 | 0.0% |
| Hopi | 11 | 0.0% |
| Hungarian | 1,333 | 0.3% |
| Icelander | 461 | 0.1% |
| Indian (Asian) | 2,731 | 0.5% |
| Indonesian | 667 | 0.1% |
| Inupiat | 282 | 0.1% |
| Iranian | 138 | 0.0% |
| Iraqi | 593 | 0.1% |
| Irish | 70,356 | 13.1% |
| Iroquois | 147 | 0.0% |
| Italian | 24,298 | 4.5% |
| Jamaican | 545 | 0.1% |
| Japanese | 298 | 0.1% |
| Jordanian | 8 | 0.0% |
| Kenyan | 133 | 0.0% |
| Korean | 5,394 | 1.0% |
| Laotian | 212 | 0.0% |
| Latvian | 16 | 0.0% |
| Lebanese | 194 | 0.0% |
| Liberian | 38 | 0.0% |
| Lithuanian | 953 | 0.2% |
| Luxembourger | 126 | 0.0% |
| Macedonian | 85 | 0.0% |
| Malaysian | 57 | 0.0% |
| Maltese | 78 | 0.0% |
| Marshallese | 112 | 0.0% |
| Menominee | 14 | 0.0% |
| Mexican | 24,383 | 4.5% |
| Mexican American Indian | 236 | 0.0% |
| Mongolian | 20 | 0.0% |
| Moroccan | 25 | 0.0% |
| Native Hawaiian | 1,892 | 0.4% |
| Navajo | 360 | 0.1% |
| Nepalese | 53 | 0.0% |
| New Zealander | 21 | 0.0% |
| Nicaraguan | 48 | 0.0% |
| Nigerian | 307 | 0.1% |
| Northern European | 2,441 | 0.4% |
| Norwegian | 24,516 | 4.5% |
| Osage | 75 | 0.0% |
| Ottawa | 11 | 0.0% |
| Paiute | 135 | 0.0% |
| Pakistani | 1,105 | 0.2% |
| Palestinian | 52 | 0.0% |
| Panamanian | 179 | 0.0% |
| Pennsylvania German | 145 | 0.0% |
| Peruvian | 180 | 0.0% |
| Polish | 8,579 | 1.6% |
| Portuguese | 1,973 | 0.4% |
| Potawatomi | 78 | 0.0% |
| Pueblo | 114 | 0.0% |
| Puerto Rican | 2,288 | 0.4% |
| Puget Sound Salish | 422 | 0.1% |
| Romanian | 1,055 | 0.2% |
| Russian | 6,208 | 1.1% |
| Salvadoran | 505 | 0.1% |
| Samoan | 381 | 0.1% |
| Scandinavian | 5,828 | 1.1% |
| Scotch-Irish | 6,356 | 1.2% |
| Scottish | 15,388 | 2.9% |
| Seminole | 14 | 0.0% |
| Serbian | 193 | 0.0% |
| Sioux | 623 | 0.1% |
| Slavic | 176 | 0.0% |
| Slovak | 415 | 0.1% |
| Slovene | 262 | 0.1% |
| Somali | 50 | 0.0% |
| South African | 111 | 0.0% |
| South American | 923 | 0.2% |
| South American Indian | 69 | 0.0% |
| Spaniard | 1,791 | 0.3% |
| Spanish | 2,008 | 0.4% |
| Spanish American | 59 | 0.0% |
| Spanish American Indian | 23 | 0.0% |
| Sri Lankan | 3,462 | 0.6% |
| Subsaharan African | 3,574 | 0.7% |
| Sudanese | 286 | 0.1% |
| Swedish | 13,182 | 2.5% |
| Swiss | 2,237 | 0.4% |
| Syrian | 150 | 0.0% |
| Thai | 935 | 0.2% |
| Tlingit-Haida | 130 | 0.0% |
| Tohono O'Odham | 39 | 0.0% |
| Tongan | 81 | 0.0% |
| Trinidadian and Tobagonian | 83 | 0.0% |
| Tsimshian | 39 | 0.0% |
| Turkish | 295 | 0.1% |
| Ugandan | 325 | 0.1% |
| Ukrainian | 4,835 | 0.9% |
| Uruguayan | 30 | 0.0% |
| Venezuelan | 209 | 0.0% |
| Welsh | 5,212 | 1.0% |
| West Indian | 20 | 0.0% |
| Yakama | 65 | 0.0% |
| Yaqui | 84 | 0.0% |
| Yugoslavian | 549 | 0.1% |
| Yuman | 30 | 0.0% |
| Yup'ik | 52 | 0.0% | View All 178 Rows |
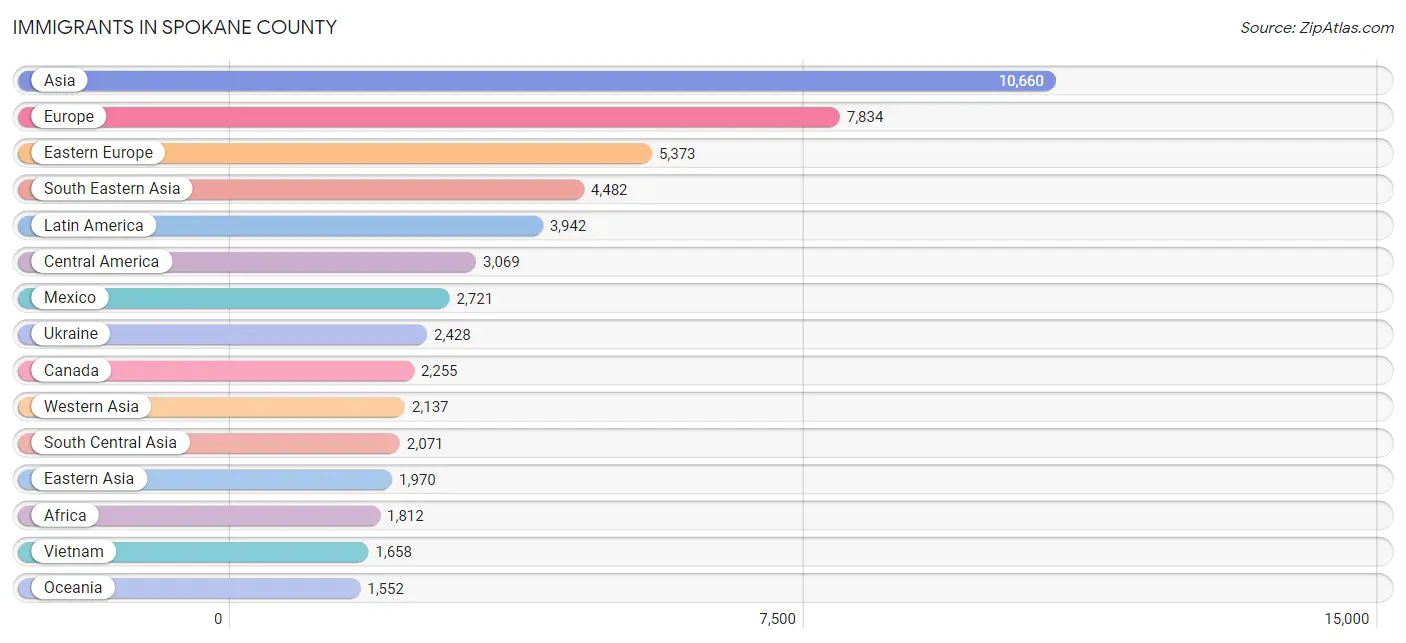
Immigrants in Spokane County
The most numerous immigrant groups reported in Spokane County came from Asia (10,660 | 2.0%), Europe (7,834 | 1.5%), Eastern Europe (5,373 | 1.0%), South Eastern Asia (4,482 | 0.8%), and Latin America (3,942 | 0.7%), together accounting for 6.0% of all Spokane County residents.
| Immigration Origin | # Population | % Population |
| Afghanistan | 293 | 0.1% |
| Africa | 1,812 | 0.3% |
| Albania | 105 | 0.0% |
| Argentina | 26 | 0.0% |
| Armenia | 7 | 0.0% |
| Asia | 10,660 | 2.0% |
| Australia | 84 | 0.0% |
| Austria | 61 | 0.0% |
| Bahamas | 9 | 0.0% |
| Belarus | 545 | 0.1% |
| Bosnia and Herzegovina | 108 | 0.0% |
| Brazil | 120 | 0.0% |
| Bulgaria | 26 | 0.0% |
| Cambodia | 96 | 0.0% |
| Canada | 2,255 | 0.4% |
| Caribbean | 321 | 0.1% |
| Central America | 3,069 | 0.6% |
| Chile | 7 | 0.0% |
| China | 1,029 | 0.2% |
| Colombia | 94 | 0.0% |
| Congo | 56 | 0.0% |
| Costa Rica | 12 | 0.0% |
| Croatia | 88 | 0.0% |
| Cuba | 124 | 0.0% |
| Czechoslovakia | 61 | 0.0% |
| Denmark | 22 | 0.0% |
| Dominican Republic | 32 | 0.0% |
| Eastern Africa | 963 | 0.2% |
| Eastern Asia | 1,970 | 0.4% |
| Eastern Europe | 5,373 | 1.0% |
| Ecuador | 122 | 0.0% |
| Egypt | 26 | 0.0% |
| El Salvador | 164 | 0.0% |
| England | 516 | 0.1% |
| Eritrea | 63 | 0.0% |
| Ethiopia | 347 | 0.1% |
| Europe | 7,834 | 1.5% |
| France | 79 | 0.0% |
| Germany | 843 | 0.2% |
| Ghana | 38 | 0.0% |
| Greece | 8 | 0.0% |
| Guatemala | 72 | 0.0% |
| Guyana | 16 | 0.0% |
| Haiti | 51 | 0.0% |
| Honduras | 3 | 0.0% |
| Hong Kong | 23 | 0.0% |
| Hungary | 36 | 0.0% |
| India | 524 | 0.1% |
| Indonesia | 148 | 0.0% |
| Iran | 45 | 0.0% |
| Iraq | 1,122 | 0.2% |
| Ireland | 83 | 0.0% |
| Italy | 116 | 0.0% |
| Jamaica | 73 | 0.0% |
| Japan | 258 | 0.1% |
| Kazakhstan | 470 | 0.1% |
| Kenya | 116 | 0.0% |
| Korea | 609 | 0.1% |
| Laos | 126 | 0.0% |
| Latin America | 3,942 | 0.7% |
| Latvia | 107 | 0.0% |
| Liberia | 38 | 0.0% |
| Lithuania | 34 | 0.0% |
| Malaysia | 110 | 0.0% |
| Mexico | 2,721 | 0.5% |
| Micronesia | 248 | 0.1% |
| Middle Africa | 130 | 0.0% |
| Moldova | 382 | 0.1% |
| Morocco | 5 | 0.0% |
| Nepal | 235 | 0.0% |
| Netherlands | 98 | 0.0% |
| Nigeria | 63 | 0.0% |
| Northern Africa | 329 | 0.1% |
| Northern Europe | 1,077 | 0.2% |
| Norway | 33 | 0.0% |
| Oceania | 1,552 | 0.3% |
| Pakistan | 38 | 0.0% |
| Panama | 97 | 0.0% |
| Peru | 28 | 0.0% |
| Philippines | 1,523 | 0.3% |
| Poland | 48 | 0.0% |
| Romania | 91 | 0.0% |
| Russia | 1,103 | 0.2% |
| Saudi Arabia | 508 | 0.1% |
| Scotland | 134 | 0.0% |
| Somalia | 87 | 0.0% |
| South Africa | 33 | 0.0% |
| South America | 552 | 0.1% |
| South Central Asia | 2,071 | 0.4% |
| South Eastern Asia | 4,482 | 0.8% |
| Southern Europe | 234 | 0.0% |
| Spain | 110 | 0.0% |
| Sudan | 243 | 0.1% |
| Sweden | 4 | 0.0% |
| Switzerland | 50 | 0.0% |
| Syria | 314 | 0.1% |
| Taiwan | 138 | 0.0% |
| Thailand | 495 | 0.1% |
| Trinidad and Tobago | 32 | 0.0% |
| Turkey | 58 | 0.0% |
| Uganda | 175 | 0.0% |
| Ukraine | 2,428 | 0.4% |
| Uruguay | 6 | 0.0% |
| Uzbekistan | 14 | 0.0% |
| Venezuela | 133 | 0.0% |
| Vietnam | 1,658 | 0.3% |
| Western Africa | 346 | 0.1% |
| Western Asia | 2,137 | 0.4% |
| Western Europe | 1,131 | 0.2% |
| Zaire | 74 | 0.0% |
| Zimbabwe | 9 | 0.0% | View All 111 Rows |
Sex and Age in Spokane County
Sex and Age in Spokane County
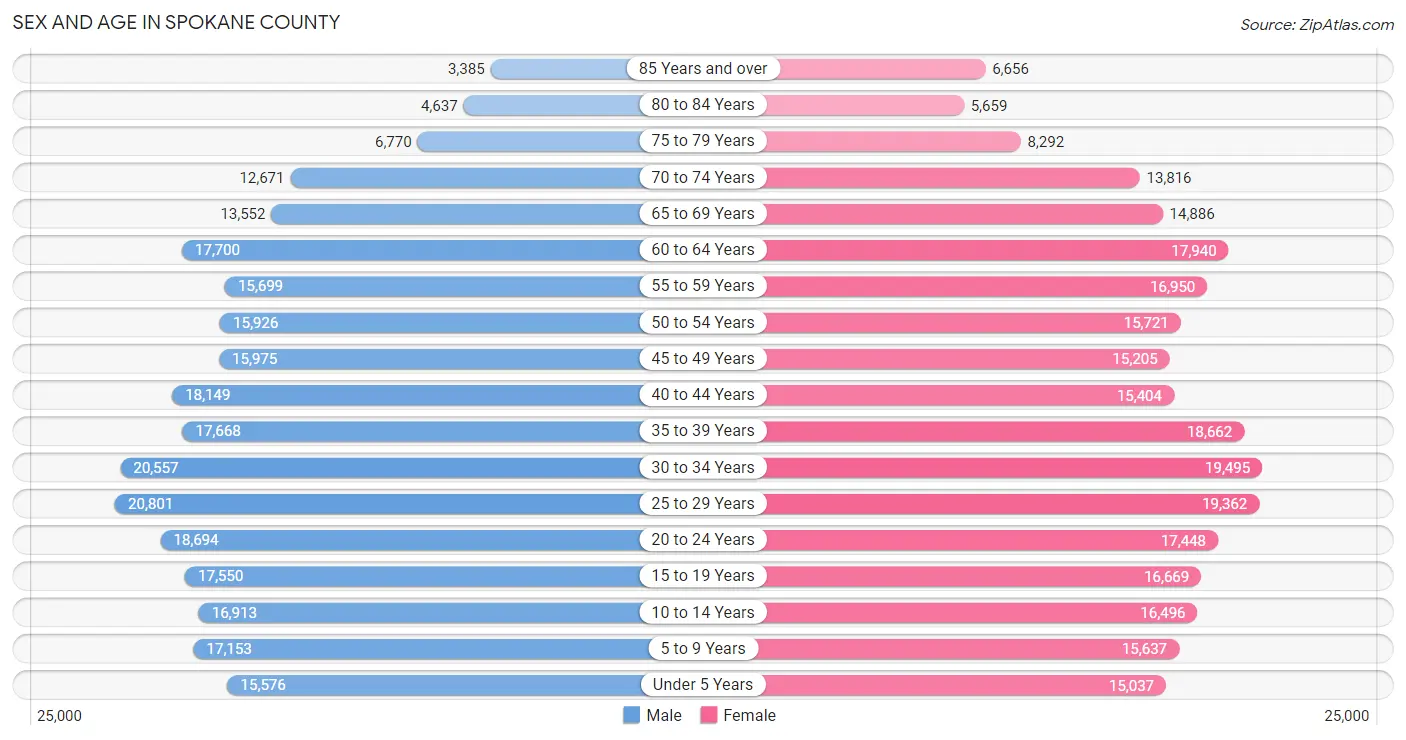
The most populous age groups in Spokane County are 25 to 29 Years (20,801 | 7.7%) for men and 30 to 34 Years (19,495 | 7.2%) for women.
| Age Bracket | Male | Female |
| Under 5 Years | 15,576 (5.8%) | 15,037 (5.6%) |
| 5 to 9 Years | 17,153 (6.4%) | 15,637 (5.8%) |
| 10 to 14 Years | 16,913 (6.3%) | 16,496 (6.1%) |
| 15 to 19 Years | 17,550 (6.5%) | 16,669 (6.2%) |
| 20 to 24 Years | 18,694 (6.9%) | 17,448 (6.5%) |
| 25 to 29 Years | 20,801 (7.7%) | 19,362 (7.2%) |
| 30 to 34 Years | 20,557 (7.6%) | 19,495 (7.2%) |
| 35 to 39 Years | 17,668 (6.6%) | 18,662 (6.9%) |
| 40 to 44 Years | 18,149 (6.7%) | 15,404 (5.7%) |
| 45 to 49 Years | 15,975 (5.9%) | 15,205 (5.7%) |
| 50 to 54 Years | 15,926 (5.9%) | 15,721 (5.8%) |
| 55 to 59 Years | 15,699 (5.8%) | 16,950 (6.3%) |
| 60 to 64 Years | 17,700 (6.6%) | 17,940 (6.7%) |
| 65 to 69 Years | 13,552 (5.0%) | 14,886 (5.5%) |
| 70 to 74 Years | 12,671 (4.7%) | 13,816 (5.1%) |
| 75 to 79 Years | 6,770 (2.5%) | 8,292 (3.1%) |
| 80 to 84 Years | 4,637 (1.7%) | 5,659 (2.1%) |
| 85 Years and over | 3,385 (1.3%) | 6,656 (2.5%) |
| Total | 269,376 (100.0%) | 269,335 (100.0%) |
Families and Households in Spokane County
Median Family Size in Spokane County
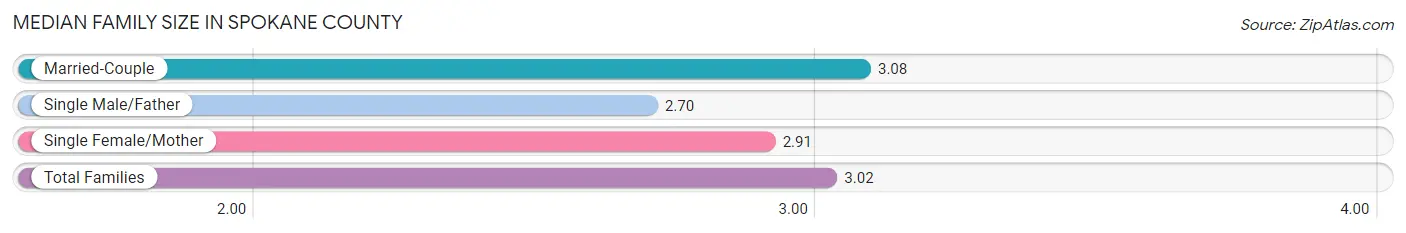
The median family size in Spokane County is 3.02 persons per family, with married-couple families (99,917 | 75.5%) accounting for the largest median family size of 3.08 persons per family. On the other hand, single male/father families (10,466 | 7.9%) represent the smallest median family size with 2.70 persons per family.
| Family Type | # Families | Family Size |
| Married-Couple | 99,917 (75.5%) | 3.08 |
| Single Male/Father | 10,466 (7.9%) | 2.70 |
| Single Female/Mother | 22,026 (16.6%) | 2.91 |
| Total Families | 132,409 (100.0%) | 3.02 |
Median Household Size in Spokane County
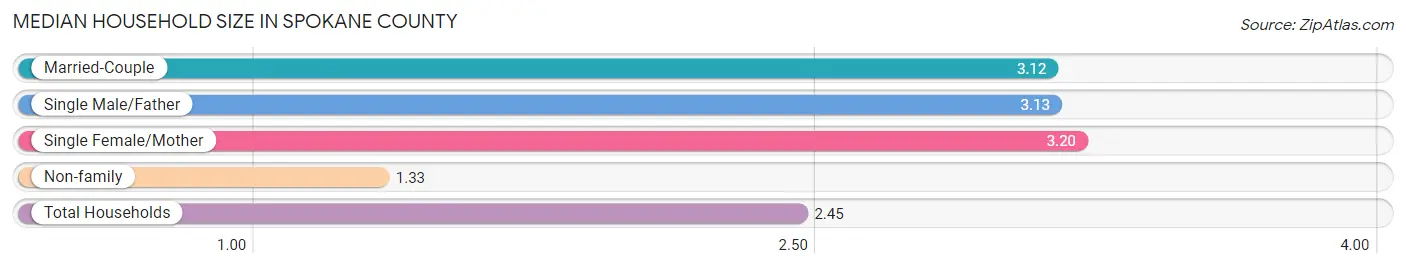
The median household size in Spokane County is 2.45 persons per household, with single female/mother households (22,026 | 10.3%) accounting for the largest median household size of 3.2 persons per household. non-family households (81,115 | 38.0%) represent the smallest median household size with 1.33 persons per household.
| Household Type | # Households | Household Size |
| Married-Couple | 99,917 (46.8%) | 3.12 |
| Single Male/Father | 10,466 (4.9%) | 3.13 |
| Single Female/Mother | 22,026 (10.3%) | 3.20 |
| Non-family | 81,115 (38.0%) | 1.33 |
| Total Households | 213,524 (100.0%) | 2.45 |
Household Size by Marriage Status in Spokane County
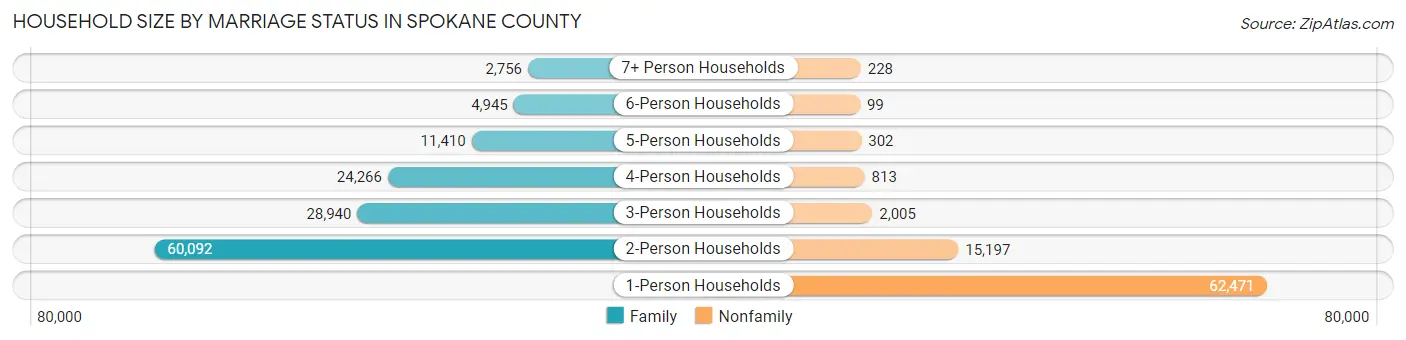
Out of a total of 213,524 households in Spokane County, 132,409 (62.0%) are family households, while 81,115 (38.0%) are nonfamily households. The most numerous type of family households are 2-person households, comprising 60,092, and the most common type of nonfamily households are 1-person households, comprising 62,471.
| Household Size | Family Households | Nonfamily Households |
| 1-Person Households | - | 62,471 (29.3%) |
| 2-Person Households | 60,092 (28.1%) | 15,197 (7.1%) |
| 3-Person Households | 28,940 (13.6%) | 2,005 (0.9%) |
| 4-Person Households | 24,266 (11.4%) | 813 (0.4%) |
| 5-Person Households | 11,410 (5.3%) | 302 (0.1%) |
| 6-Person Households | 4,945 (2.3%) | 99 (0.1%) |
| 7+ Person Households | 2,756 (1.3%) | 228 (0.1%) |
| Total | 132,409 (62.0%) | 81,115 (38.0%) |
Female Fertility in Spokane County
Fertility by Age in Spokane County
Average fertility rate in Spokane County is 52.0 births per 1,000 women. Women in the age bracket of 20 to 34 years have the highest fertility rate with 88.0 births per 1,000 women. Women in the age bracket of 20 to 34 years acount for 76.9% of all women with births.
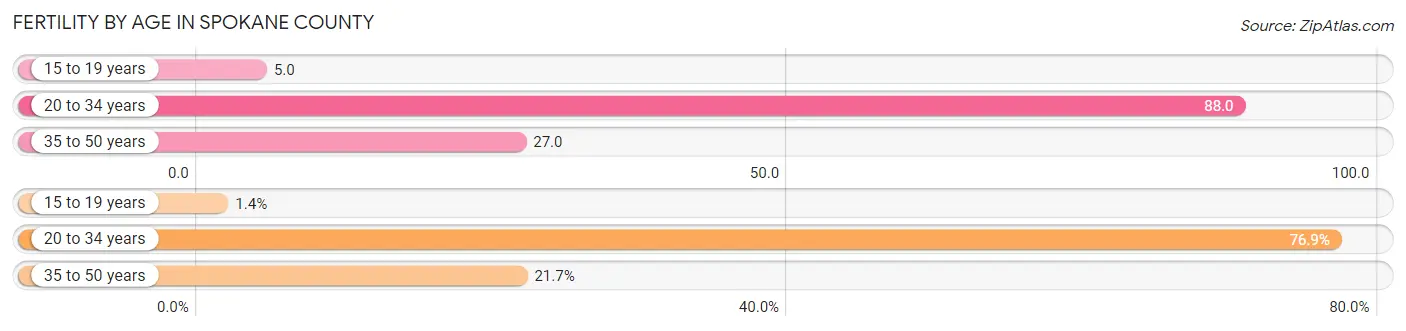
| Age Bracket | Women with Births | Births / 1,000 Women |
| 15 to 19 years | 89 (1.4%) | 5.0 |
| 20 to 34 years | 4,972 (76.9%) | 88.0 |
| 35 to 50 years | 1,401 (21.7%) | 27.0 |
| Total | 6,462 (100.0%) | 52.0 |
Fertility by Age by Marriage Status in Spokane County
72.3% of women with births (6,462) in Spokane County are married. The highest percentage of unmarried women with births falls into 15 to 19 years age bracket with 89.9% of them unmarried at the time of birth, while the lowest percentage of unmarried women with births belong to 35 to 50 years age bracket with 16.0% of them unmarried.
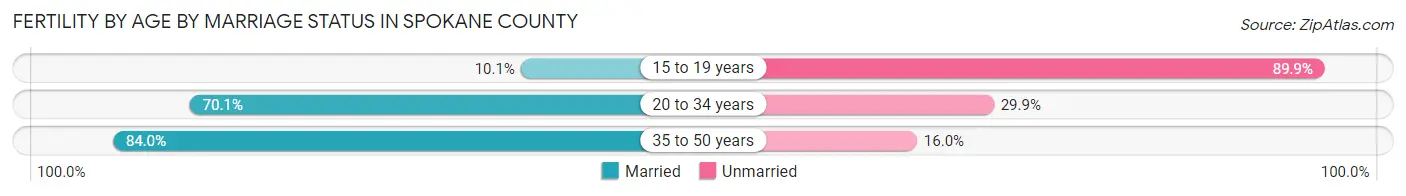
| Age Bracket | Married | Unmarried |
| 15 to 19 years | 9 (10.1%) | 80 (89.9%) |
| 20 to 34 years | 3,485 (70.1%) | 1,487 (29.9%) |
| 35 to 50 years | 1,177 (84.0%) | 224 (16.0%) |
| Total | 4,672 (72.3%) | 1,790 (27.7%) |
Fertility by Education in Spokane County
Average fertility rate in Spokane County is 52.0 births per 1,000 women. Women with the education attainment of bachelor's degree have the highest fertility rate of 67.0 births per 1,000 women, while women with the education attainment of less than high school have the lowest fertility at 26.0 births per 1,000 women. Women with the education attainment of college or associate's degree represent 39.0% of all women with births.
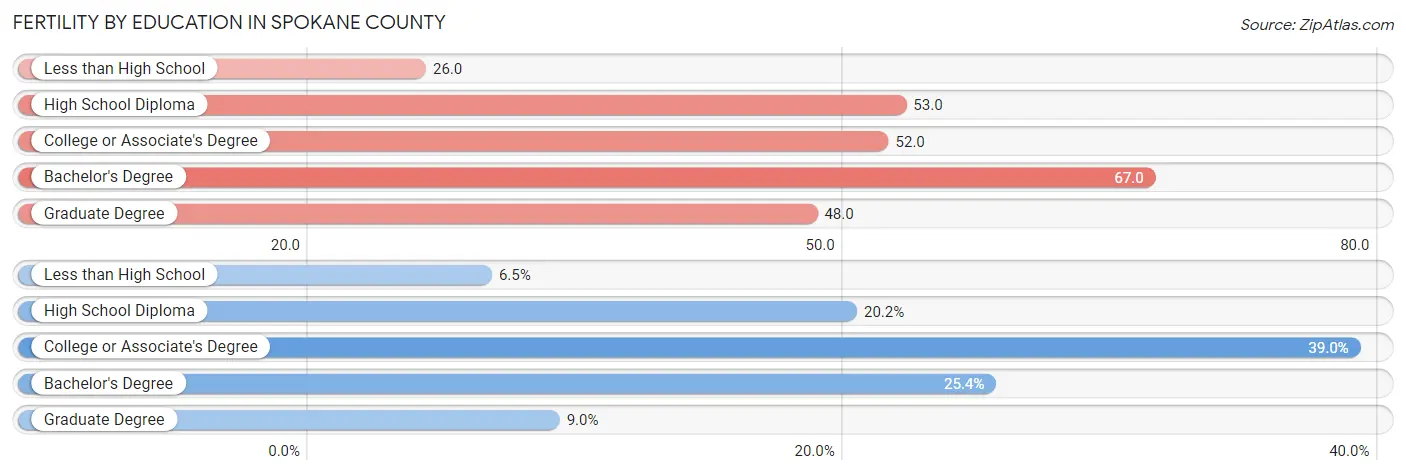
| Educational Attainment | Women with Births | Births / 1,000 Women |
| Less than High School | 418 (6.5%) | 26.0 |
| High School Diploma | 1,302 (20.2%) | 53.0 |
| College or Associate's Degree | 2,521 (39.0%) | 52.0 |
| Bachelor's Degree | 1,639 (25.4%) | 67.0 |
| Graduate Degree | 582 (9.0%) | 48.0 |
| Total | 6,462 (100.0%) | 52.0 |
Fertility by Education by Marriage Status in Spokane County
27.7% of women with births in Spokane County are unmarried. Women with the educational attainment of graduate degree are most likely to be married with 95.7% of them married at childbirth, while women with the educational attainment of less than high school are least likely to be married with 57.2% of them unmarried at childbirth.
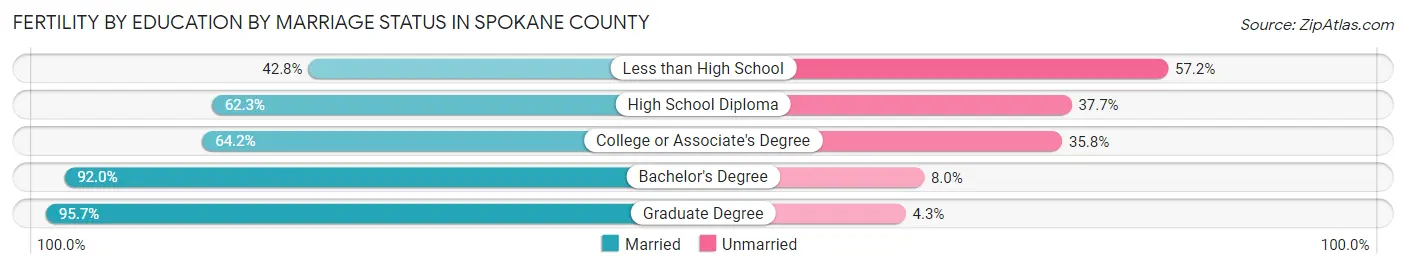
| Educational Attainment | Married | Unmarried |
| Less than High School | 179 (42.8%) | 239 (57.2%) |
| High School Diploma | 811 (62.3%) | 491 (37.7%) |
| College or Associate's Degree | 1,618 (64.2%) | 903 (35.8%) |
| Bachelor's Degree | 1,508 (92.0%) | 131 (8.0%) |
| Graduate Degree | 557 (95.7%) | 25 (4.3%) |
| Total | 4,672 (72.3%) | 1,790 (27.7%) |
Income in Spokane County
Income Overview in Spokane County
Per Capita Income in Spokane County is $38,052, while median incomes of families and households are $89,846 and $70,394 respectively.
| Characteristic | Number | Measure |
| Per Capita Income | 538,711 | $38,052 |
| Median Family Income | 132,409 | $89,846 |
| Mean Family Income | 132,409 | $113,657 |
| Median Household Income | 213,524 | $70,394 |
| Mean Household Income | 213,524 | $93,640 |
| Income Deficit | 132,409 | $11,310 |
| Wage / Income Gap (%) | 538,711 | 25.10% |
| Wage / Income Gap ($) | 538,711 | 74.90¢ per $1 |
| Gini / Inequality Index | 538,711 | 0.45 |
Earnings by Sex in Spokane County
Average Earnings in Spokane County are $40,011, $46,195 for men and $34,602 for women, a difference of 25.1%.
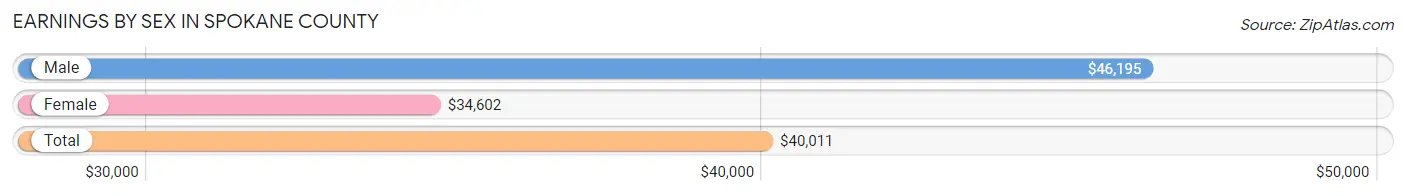
| Sex | Number | Average Earnings |
| Male | 152,253 (53.2%) | $46,195 |
| Female | 133,792 (46.8%) | $34,602 |
| Total | 286,045 (100.0%) | $40,011 |
Earnings by Sex by Income Bracket in Spokane County
The most common earnings brackets in Spokane County are $100,000+ for men (25,524 | 16.8%) and $75,000 to $99,999 for women (11,009 | 8.2%).
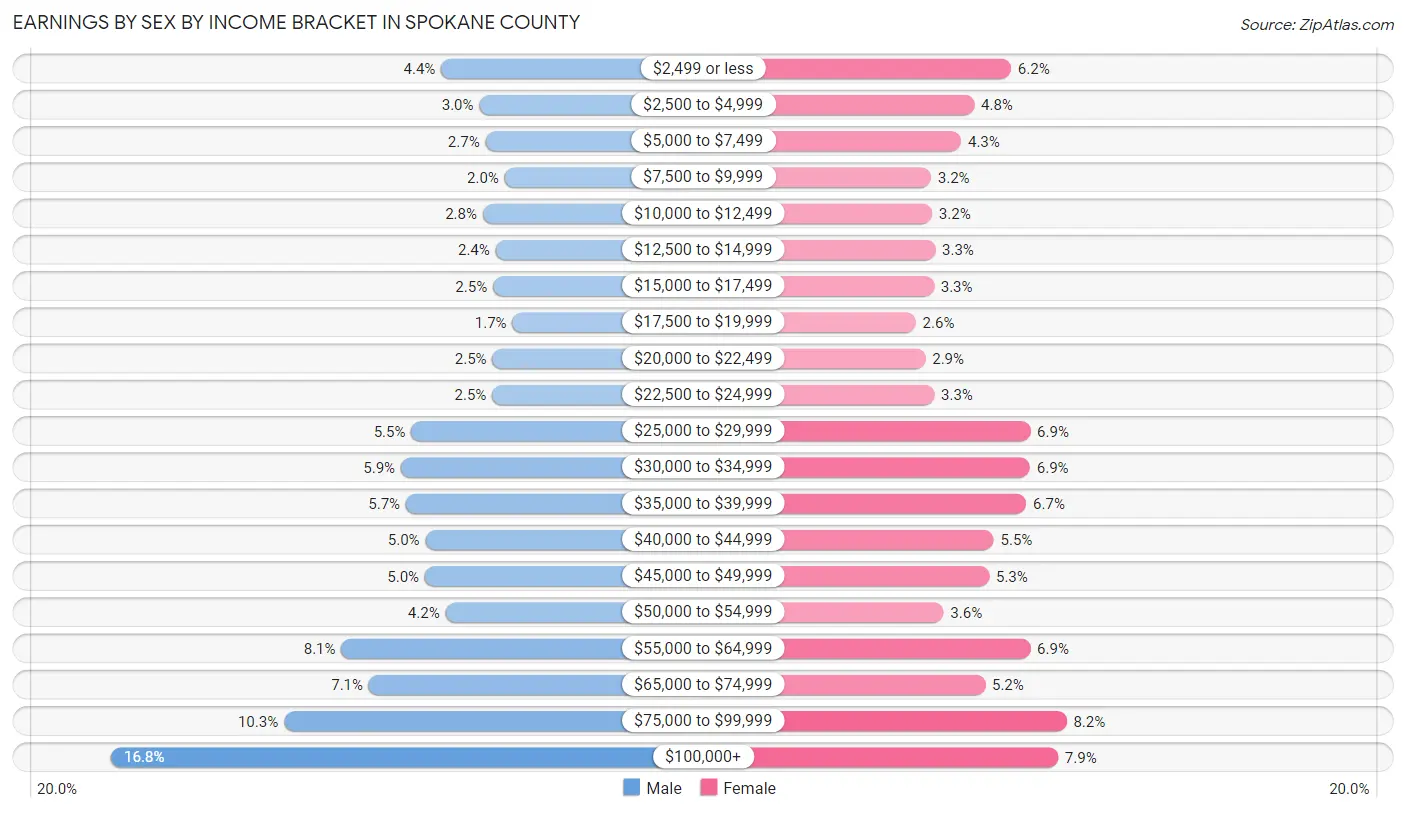
| Income | Male | Female |
| $2,499 or less | 6,688 (4.4%) | 8,231 (6.1%) |
| $2,500 to $4,999 | 4,514 (3.0%) | 6,377 (4.8%) |
| $5,000 to $7,499 | 4,157 (2.7%) | 5,720 (4.3%) |
| $7,500 to $9,999 | 3,061 (2.0%) | 4,221 (3.2%) |
| $10,000 to $12,499 | 4,315 (2.8%) | 4,269 (3.2%) |
| $12,500 to $14,999 | 3,575 (2.4%) | 4,424 (3.3%) |
| $15,000 to $17,499 | 3,724 (2.5%) | 4,356 (3.3%) |
| $17,500 to $19,999 | 2,617 (1.7%) | 3,455 (2.6%) |
| $20,000 to $22,499 | 3,766 (2.5%) | 3,928 (2.9%) |
| $22,500 to $24,999 | 3,772 (2.5%) | 4,381 (3.3%) |
| $25,000 to $29,999 | 8,384 (5.5%) | 9,197 (6.9%) |
| $30,000 to $34,999 | 8,987 (5.9%) | 9,183 (6.9%) |
| $35,000 to $39,999 | 8,688 (5.7%) | 8,996 (6.7%) |
| $40,000 to $44,999 | 7,585 (5.0%) | 7,361 (5.5%) |
| $45,000 to $49,999 | 7,616 (5.0%) | 7,129 (5.3%) |
| $50,000 to $54,999 | 6,444 (4.2%) | 4,842 (3.6%) |
| $55,000 to $64,999 | 12,380 (8.1%) | 9,191 (6.9%) |
| $65,000 to $74,999 | 10,811 (7.1%) | 6,934 (5.2%) |
| $75,000 to $99,999 | 15,645 (10.3%) | 11,009 (8.2%) |
| $100,000+ | 25,524 (16.8%) | 10,588 (7.9%) |
| Total | 152,253 (100.0%) | 133,792 (100.0%) |
Earnings by Sex by Educational Attainment in Spokane County
Average earnings in Spokane County are $54,184 for men and $39,557 for women, a difference of 27.0%. Men with an educational attainment of graduate degree enjoy the highest average annual earnings of $100,668, while those with less than high school education earn the least with $39,664. Women with an educational attainment of graduate degree earn the most with the average annual earnings of $70,198, while those with less than high school education have the smallest earnings of $23,988.
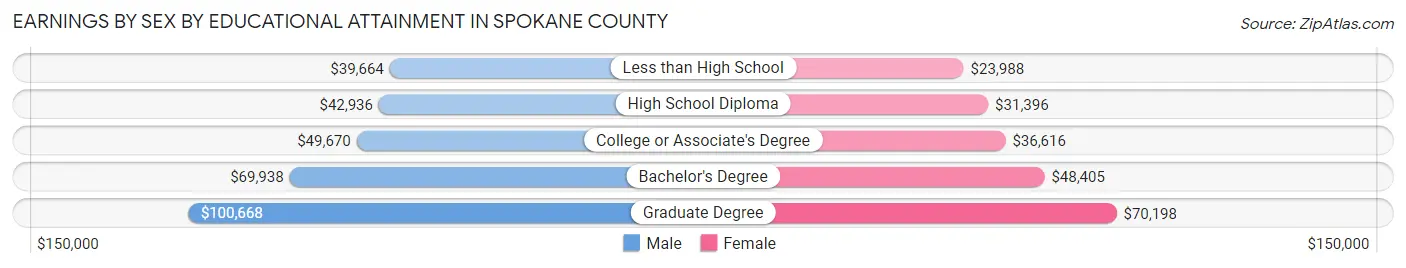
| Educational Attainment | Male Income | Female Income |
| Less than High School | $39,664 | $23,988 |
| High School Diploma | $42,936 | $31,396 |
| College or Associate's Degree | $49,670 | $36,616 |
| Bachelor's Degree | $69,938 | $48,405 |
| Graduate Degree | $100,668 | $70,198 |
| Total | $54,184 | $39,557 |
Family Income in Spokane County
Family Income Brackets in Spokane County
According to the Spokane County family income data, there are 29,660 families falling into the $100,000 to $149,999 income range, which is the most common income bracket and makes up 22.4% of all families. Conversely, the $10,000 to $14,999 income bracket is the least frequent group with only 2,383 families (1.8%) belonging to this category.
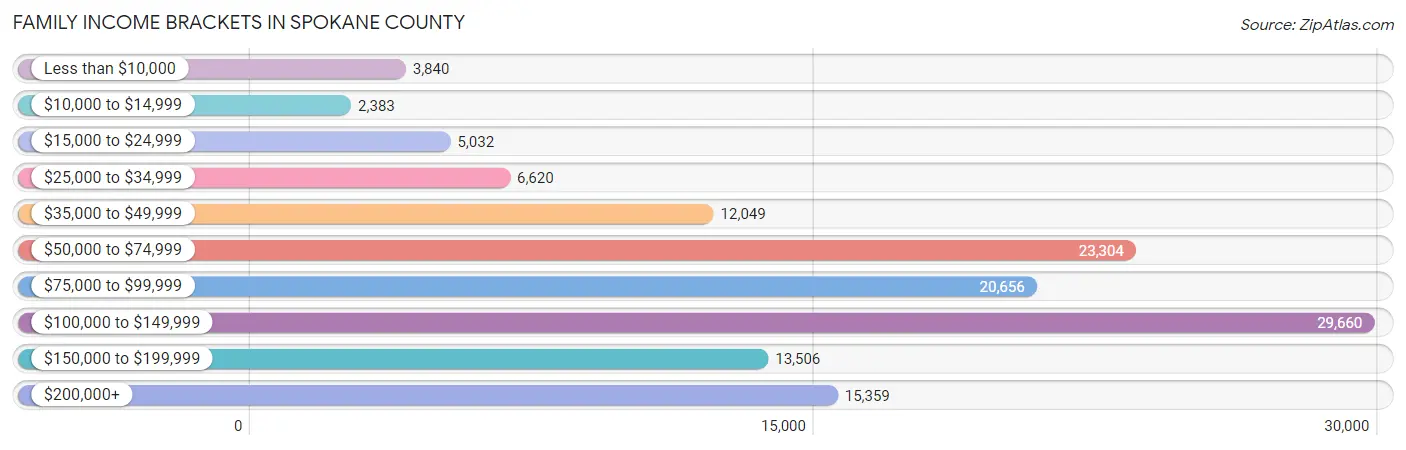
| Income Bracket | # Families | % Families |
| Less than $10,000 | 3,840 | 2.9% |
| $10,000 to $14,999 | 2,383 | 1.8% |
| $15,000 to $24,999 | 5,032 | 3.8% |
| $25,000 to $34,999 | 6,620 | 5.0% |
| $35,000 to $49,999 | 12,049 | 9.1% |
| $50,000 to $74,999 | 23,304 | 17.6% |
| $75,000 to $99,999 | 20,656 | 15.6% |
| $100,000 to $149,999 | 29,660 | 22.4% |
| $150,000 to $199,999 | 13,506 | 10.2% |
| $200,000+ | 15,359 | 11.6% |
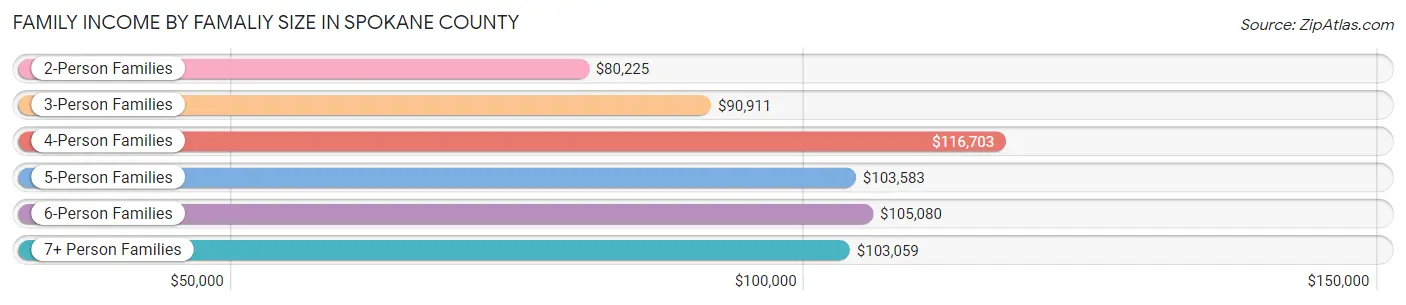
Family Income by Famaliy Size in Spokane County
4-person families (22,432 | 16.9%) account for the highest median family income in Spokane County with $116,703 per family, while 2-person families (65,424 | 49.4%) have the highest median income of $40,112 per family member.
| Income Bracket | # Families | Median Income |
| 2-Person Families | 65,424 (49.4%) | $80,225 |
| 3-Person Families | 27,519 (20.8%) | $90,911 |
| 4-Person Families | 22,432 (16.9%) | $116,703 |
| 5-Person Families | 10,453 (7.9%) | $103,583 |
| 6-Person Families | 4,375 (3.3%) | $105,080 |
| 7+ Person Families | 2,206 (1.7%) | $103,059 |
| Total | 132,409 (100.0%) | $89,846 |
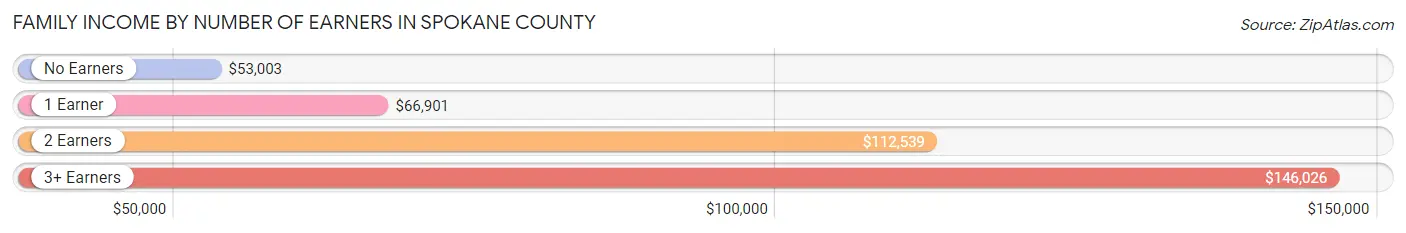
Family Income by Number of Earners in Spokane County
The median family income in Spokane County is $89,846, with families comprising 3+ earners (13,004) having the highest median family income of $146,026, while families with no earners (21,664) have the lowest median family income of $53,003, accounting for 9.8% and 16.4% of families, respectively.
| Number of Earners | # Families | Median Income |
| No Earners | 21,664 (16.4%) | $53,003 |
| 1 Earner | 40,936 (30.9%) | $66,901 |
| 2 Earners | 56,805 (42.9%) | $112,539 |
| 3+ Earners | 13,004 (9.8%) | $146,026 |
| Total | 132,409 (100.0%) | $89,846 |
Household Income in Spokane County
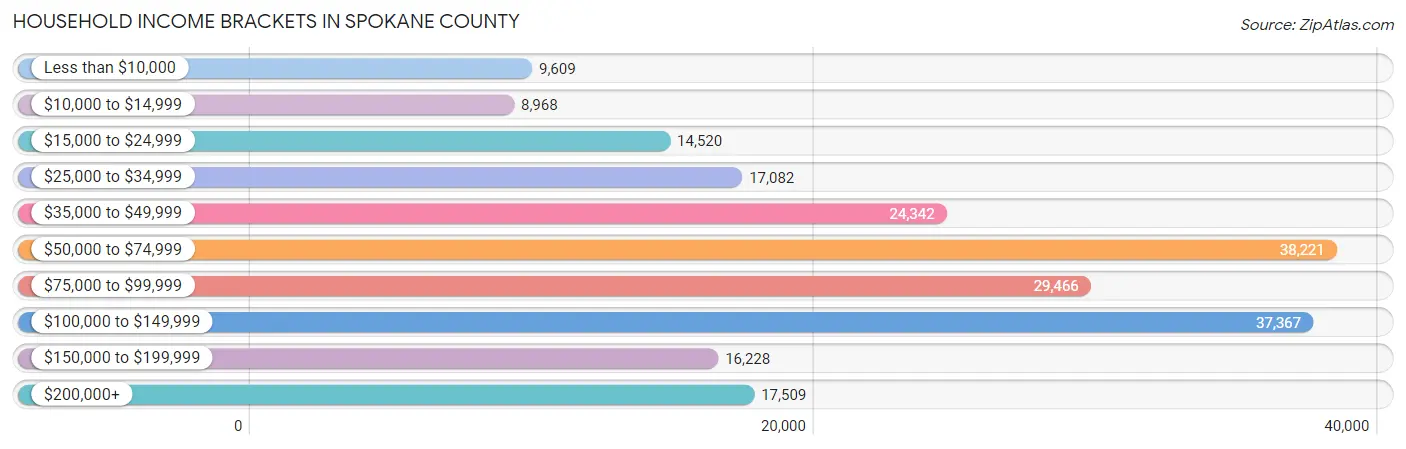
Household Income Brackets in Spokane County
With 38,221 households falling in the category, the $50,000 to $74,999 income range is the most frequent in Spokane County, accounting for 17.9% of all households. In contrast, only 8,968 households (4.2%) fall into the $10,000 to $14,999 income bracket, making it the least populous group.
| Income Bracket | # Households | % Households |
| Less than $10,000 | 9,609 | 4.5% |
| $10,000 to $14,999 | 8,968 | 4.2% |
| $15,000 to $24,999 | 14,520 | 6.8% |
| $25,000 to $34,999 | 17,082 | 8.0% |
| $35,000 to $49,999 | 24,342 | 11.4% |
| $50,000 to $74,999 | 38,221 | 17.9% |
| $75,000 to $99,999 | 29,466 | 13.8% |
| $100,000 to $149,999 | 37,367 | 17.5% |
| $150,000 to $199,999 | 16,228 | 7.6% |
| $200,000+ | 17,509 | 8.2% |
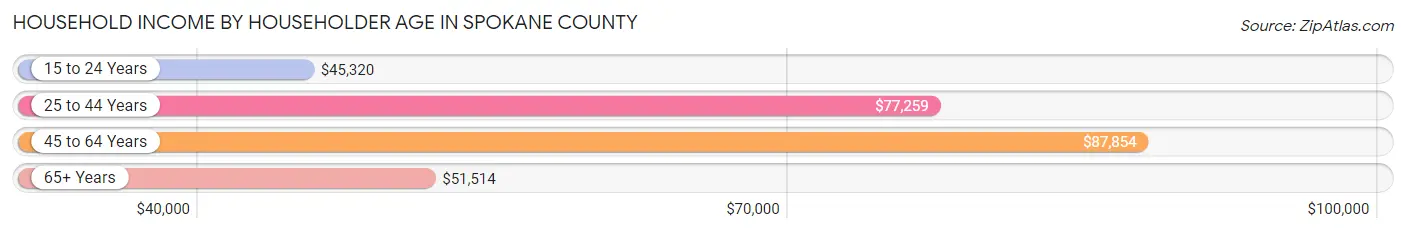
Household Income by Householder Age in Spokane County
The median household income in Spokane County is $70,394, with the highest median household income of $87,854 found in the 45 to 64 years age bracket for the primary householder. A total of 73,748 households (34.5%) fall into this category. Meanwhile, the 15 to 24 years age bracket for the primary householder has the lowest median household income of $45,320, with 11,246 households (5.3%) in this group.
| Income Bracket | # Households | Median Income |
| 15 to 24 Years | 11,246 (5.3%) | $45,320 |
| 25 to 44 Years | 71,649 (33.6%) | $77,259 |
| 45 to 64 Years | 73,748 (34.5%) | $87,854 |
| 65+ Years | 56,881 (26.6%) | $51,514 |
| Total | 213,524 (100.0%) | $70,394 |
Poverty in Spokane County
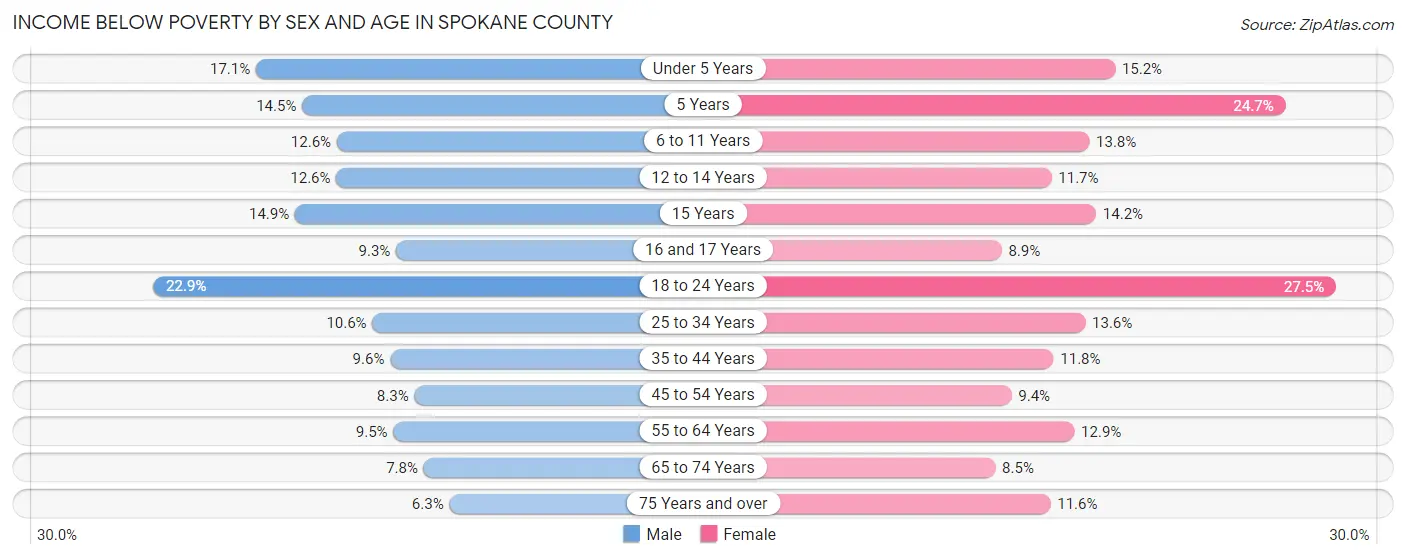
Income Below Poverty by Sex and Age in Spokane County
With 11.3% poverty level for males and 13.3% for females among the residents of Spokane County, 18 to 24 year old males and 18 to 24 year old females are the most vulnerable to poverty, with 5,213 males (22.9%) and 5,944 females (27.5%) in their respective age groups living below the poverty level.
| Age Bracket | Male | Female |
| Under 5 Years | 2,627 (17.1%) | 2,199 (15.2%) |
| 5 Years | 432 (14.5%) | 818 (24.7%) |
| 6 to 11 Years | 2,570 (12.6%) | 2,582 (13.8%) |
| 12 to 14 Years | 1,258 (12.6%) | 1,094 (11.7%) |
| 15 Years | 594 (14.9%) | 499 (14.1%) |
| 16 and 17 Years | 577 (9.3%) | 550 (8.9%) |
| 18 to 24 Years | 5,213 (22.9%) | 5,944 (27.5%) |
| 25 to 34 Years | 4,264 (10.6%) | 5,242 (13.6%) |
| 35 to 44 Years | 3,360 (9.6%) | 4,002 (11.8%) |
| 45 to 54 Years | 2,596 (8.3%) | 2,915 (9.4%) |
| 55 to 64 Years | 3,123 (9.5%) | 4,499 (12.9%) |
| 65 to 74 Years | 1,996 (7.8%) | 2,433 (8.5%) |
| 75 Years and over | 900 (6.3%) | 2,304 (11.6%) |
| Total | 29,510 (11.3%) | 35,081 (13.3%) |
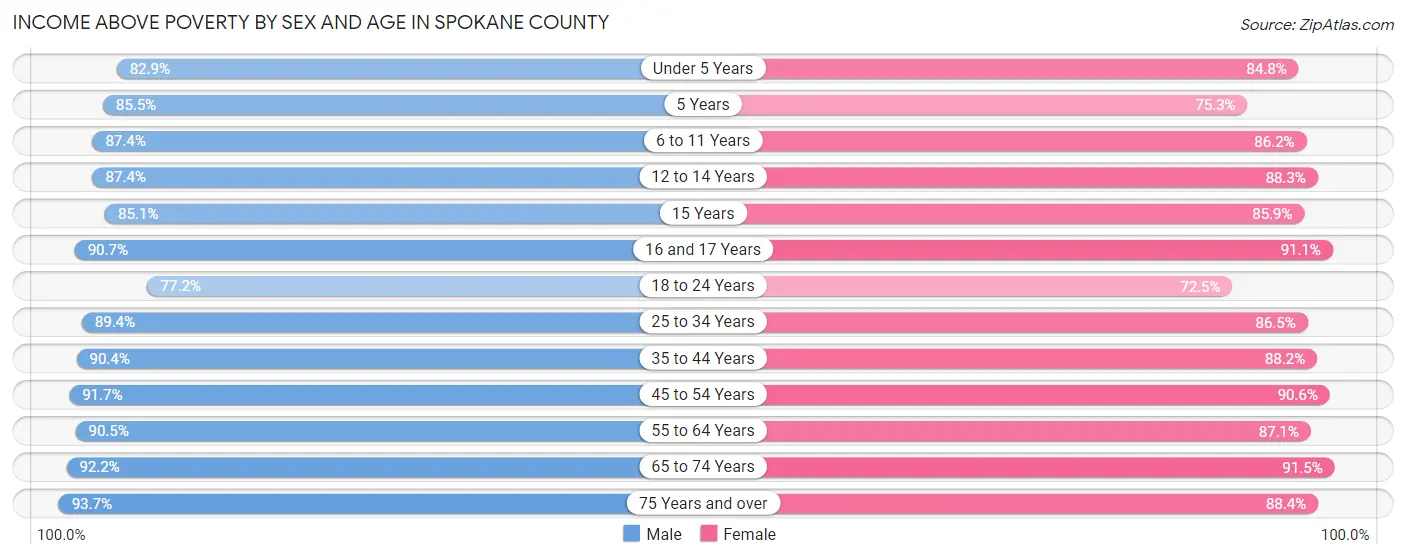
Income Above Poverty by Sex and Age in Spokane County
According to the poverty statistics in Spokane County, males aged 75 years and over and females aged 65 to 74 years are the age groups that are most secure financially, with 93.7% of males and 91.5% of females in these age groups living above the poverty line.
| Age Bracket | Male | Female |
| Under 5 Years | 12,728 (82.9%) | 12,254 (84.8%) |
| 5 Years | 2,540 (85.5%) | 2,493 (75.3%) |
| 6 to 11 Years | 17,810 (87.4%) | 16,167 (86.2%) |
| 12 to 14 Years | 8,697 (87.4%) | 8,283 (88.3%) |
| 15 Years | 3,383 (85.1%) | 3,027 (85.9%) |
| 16 and 17 Years | 5,619 (90.7%) | 5,639 (91.1%) |
| 18 to 24 Years | 17,601 (77.1%) | 15,651 (72.5%) |
| 25 to 34 Years | 35,863 (89.4%) | 33,436 (86.5%) |
| 35 to 44 Years | 31,507 (90.4%) | 29,971 (88.2%) |
| 45 to 54 Years | 28,727 (91.7%) | 27,958 (90.6%) |
| 55 to 64 Years | 29,875 (90.5%) | 30,259 (87.1%) |
| 65 to 74 Years | 23,708 (92.2%) | 26,040 (91.5%) |
| 75 Years and over | 13,293 (93.7%) | 17,545 (88.4%) |
| Total | 231,351 (88.7%) | 228,723 (86.7%) |
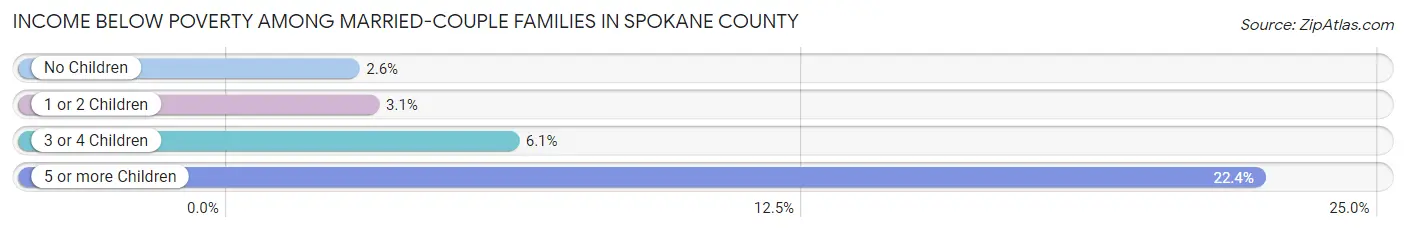
Income Below Poverty Among Married-Couple Families in Spokane County
The poverty statistics for married-couple families in Spokane County show that 3.3% or 3,284 of the total 99,917 families live below the poverty line. Families with 5 or more children have the highest poverty rate of 22.4%, comprising of 239 families. On the other hand, families with no children have the lowest poverty rate of 2.6%, which includes 1,568 families.
| Children | Above Poverty | Below Poverty |
| No Children | 57,715 (97.4%) | 1,568 (2.6%) |
| 1 or 2 Children | 30,007 (96.9%) | 951 (3.1%) |
| 3 or 4 Children | 8,081 (93.9%) | 526 (6.1%) |
| 5 or more Children | 830 (77.6%) | 239 (22.4%) |
| Total | 96,633 (96.7%) | 3,284 (3.3%) |
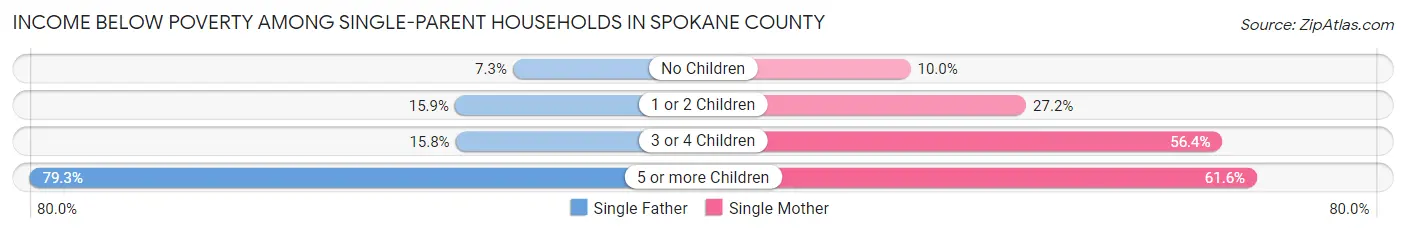
Income Below Poverty Among Single-Parent Households in Spokane County
According to the poverty data in Spokane County, 13.5% or 1,413 single-father households and 24.3% or 5,357 single-mother households are living below the poverty line. Among single-father households, those with 5 or more children have the highest poverty rate, with 107 households (79.3%) experiencing poverty. Likewise, among single-mother households, those with 5 or more children have the highest poverty rate, with 157 households (61.6%) falling below the poverty line.
| Children | Single Father | Single Mother |
| No Children | 282 (7.3%) | 803 (10.0%) |
| 1 or 2 Children | 894 (15.9%) | 3,105 (27.2%) |
| 3 or 4 Children | 130 (15.8%) | 1,292 (56.4%) |
| 5 or more Children | 107 (79.3%) | 157 (61.6%) |
| Total | 1,413 (13.5%) | 5,357 (24.3%) |
Income Below Poverty Among Married-Couple vs Single-Parent Households in Spokane County
The poverty data for Spokane County shows that 3,284 of the married-couple family households (3.3%) and 6,770 of the single-parent households (20.8%) are living below the poverty level. Within the married-couple family households, those with 5 or more children have the highest poverty rate, with 239 households (22.4%) falling below the poverty line. Among the single-parent households, those with 5 or more children have the highest poverty rate, with 264 household (67.7%) living below poverty.
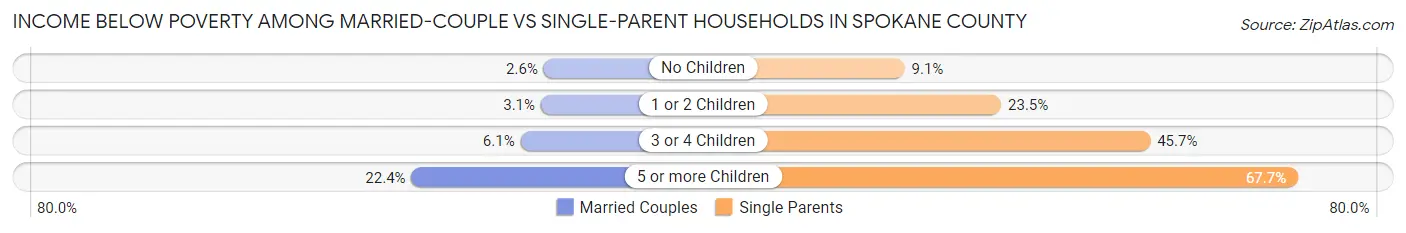
| Children | Married-Couple Families | Single-Parent Households |
| No Children | 1,568 (2.6%) | 1,085 (9.1%) |
| 1 or 2 Children | 951 (3.1%) | 3,999 (23.5%) |
| 3 or 4 Children | 526 (6.1%) | 1,422 (45.7%) |
| 5 or more Children | 239 (22.4%) | 264 (67.7%) |
| Total | 3,284 (3.3%) | 6,770 (20.8%) |
Employment Characteristics in Spokane County
Employment by Class of Employer in Spokane County
Among the 246,816 employed individuals in Spokane County, private company employees (156,813 | 63.5%), not-for-profit organizations (26,895 | 10.9%), and local government employees (16,697 | 6.8%) make up the most common classes of employment.
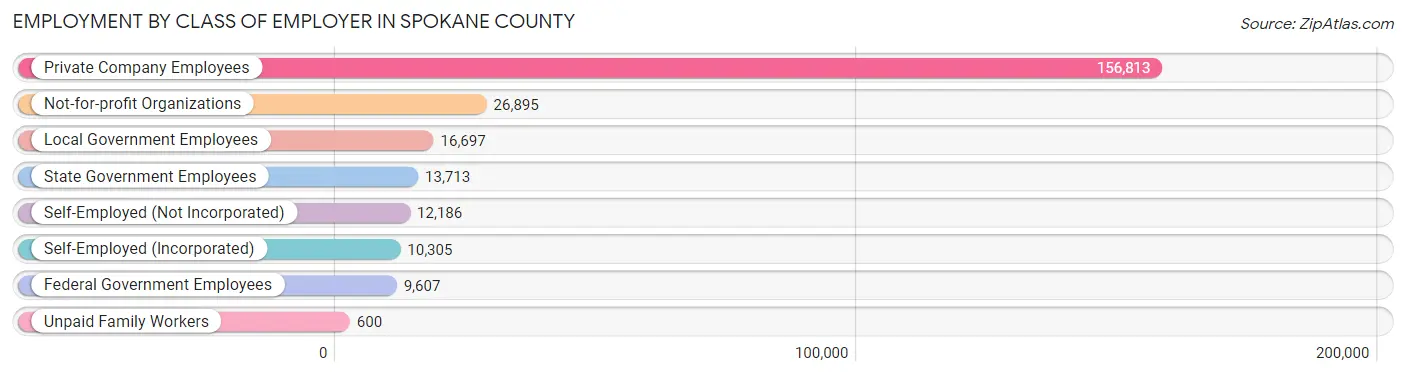
| Employer Class | # Employees | % Employees |
| Private Company Employees | 156,813 | 63.5% |
| Self-Employed (Incorporated) | 10,305 | 4.2% |
| Self-Employed (Not Incorporated) | 12,186 | 4.9% |
| Not-for-profit Organizations | 26,895 | 10.9% |
| Local Government Employees | 16,697 | 6.8% |
| State Government Employees | 13,713 | 5.6% |
| Federal Government Employees | 9,607 | 3.9% |
| Unpaid Family Workers | 600 | 0.2% |
| Total | 246,816 | 100.0% |
Employment Status by Age in Spokane County
According to the labor force statistics for Spokane County, out of the total population over 16 years of age (434,380), 61.7% or 268,012 individuals are in the labor force, with 5.8% or 15,545 of them unemployed. The age group with the highest labor force participation rate is 25 to 29 years, with 82.2% or 33,014 individuals in the labor force. Within the labor force, the 16 to 19 years age range has the highest percentage of unemployed individuals, with 17.5% or 1,981 of them being unemployed.
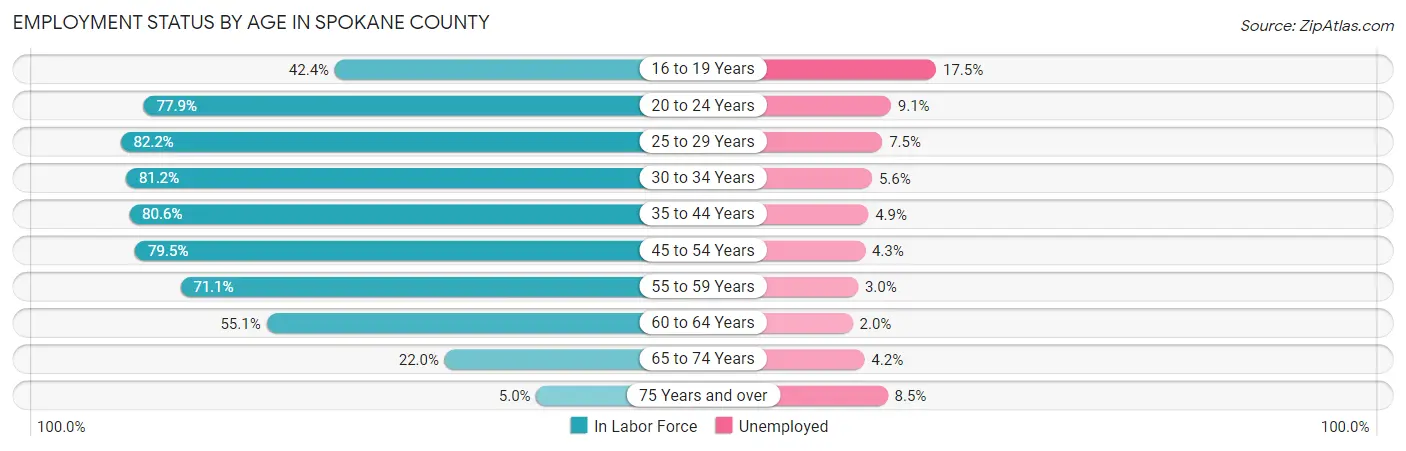
| Age Bracket | In Labor Force | Unemployed |
| 16 to 19 Years | 11,321 (42.4%) | 1,981 (17.5%) |
| 20 to 24 Years | 28,155 (77.9%) | 2,562 (9.1%) |
| 25 to 29 Years | 33,014 (82.2%) | 2,476 (7.5%) |
| 30 to 34 Years | 32,522 (81.2%) | 1,821 (5.6%) |
| 35 to 44 Years | 56,326 (80.6%) | 2,760 (4.9%) |
| 45 to 54 Years | 49,947 (79.5%) | 2,148 (4.3%) |
| 55 to 59 Years | 23,213 (71.1%) | 696 (3.0%) |
| 60 to 64 Years | 19,638 (55.1%) | 393 (2.0%) |
| 65 to 74 Years | 12,084 (22.0%) | 508 (4.2%) |
| 75 Years and over | 1,770 (5.0%) | 150 (8.5%) |
| Total | 268,012 (61.7%) | 15,545 (5.8%) |
Employment Status by Educational Attainment in Spokane County
According to labor force statistics for Spokane County, 76.3% of individuals (214,566) out of the total population between 25 and 64 years of age (281,214) are in the labor force, with 4.8% or 10,299 of them being unemployed. The group with the highest labor force participation rate are those with the educational attainment of bachelor's degree or higher, with 85.4% or 76,287 individuals in the labor force. Within the labor force, individuals with less than high school education have the highest percentage of unemployment, with 12.0% or 1,149 of them being unemployed.
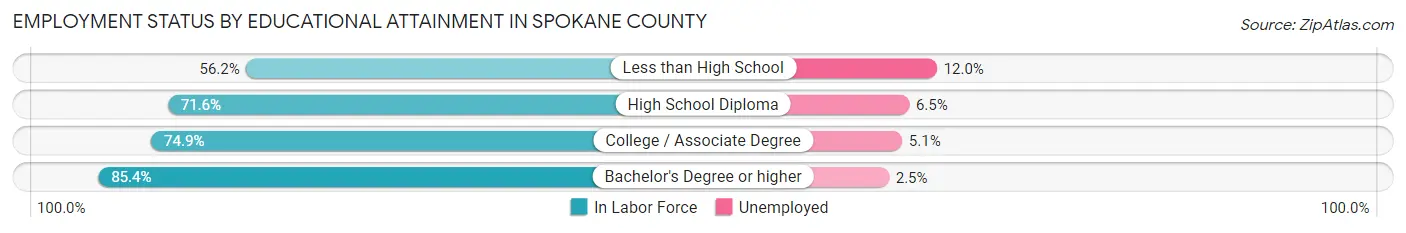
| Educational Attainment | In Labor Force | Unemployed |
| Less than High School | 9,578 (56.2%) | 2,045 (12.0%) |
| High School Diploma | 45,909 (71.6%) | 4,168 (6.5%) |
| College / Associate Degree | 82,932 (74.9%) | 5,647 (5.1%) |
| Bachelor's Degree or higher | 76,287 (85.4%) | 2,233 (2.5%) |
| Total | 214,566 (76.3%) | 13,498 (4.8%) |
Employment Occupations by Sex in Spokane County
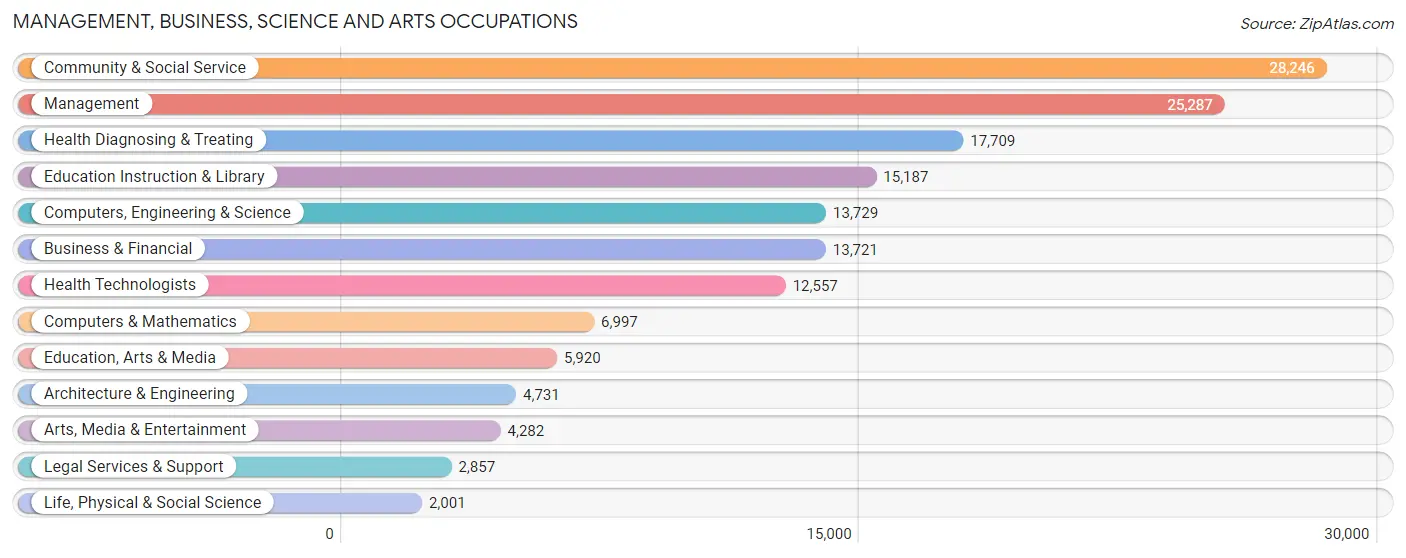
Management, Business, Science and Arts Occupations
The most common Management, Business, Science and Arts occupations in Spokane County are Community & Social Service (28,246 | 11.3%), Management (25,287 | 10.2%), Health Diagnosing & Treating (17,709 | 7.1%), Education Instruction & Library (15,187 | 6.1%), and Computers, Engineering & Science (13,729 | 5.5%).
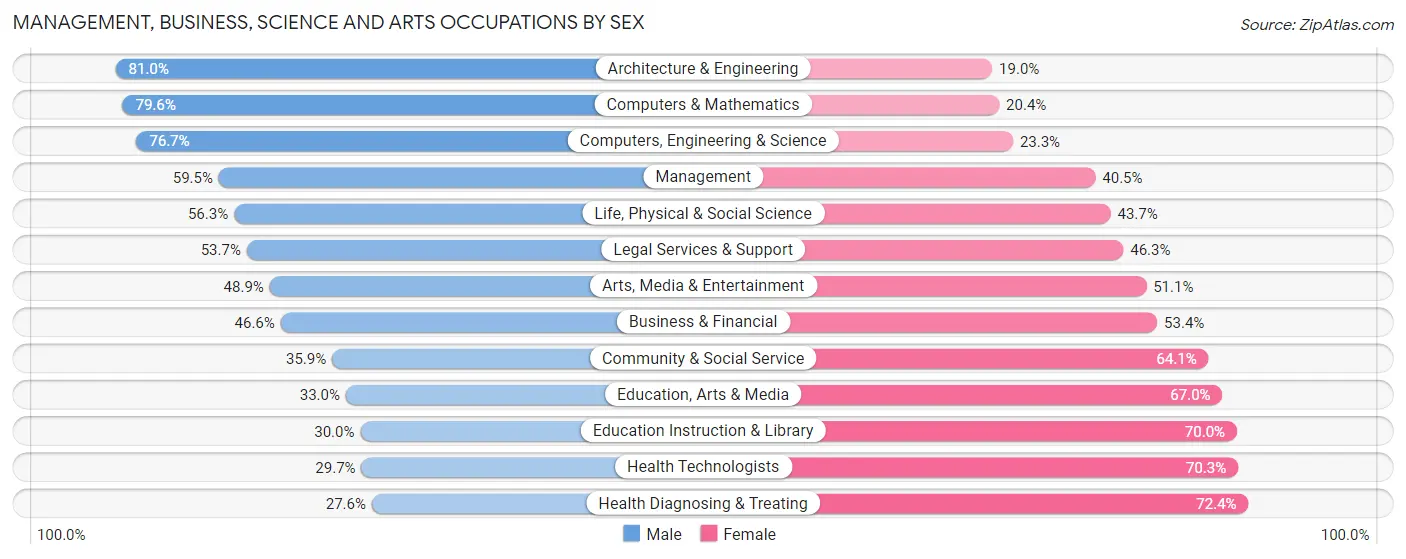
Management, Business, Science and Arts Occupations by Sex
Within the Management, Business, Science and Arts occupations in Spokane County, the most male-oriented occupations are Architecture & Engineering (81.0%), Computers & Mathematics (79.6%), and Computers, Engineering & Science (76.7%), while the most female-oriented occupations are Health Diagnosing & Treating (72.4%), Health Technologists (70.3%), and Education Instruction & Library (70.0%).
| Occupation | Male | Female |
| Management | 15,042 (59.5%) | 10,245 (40.5%) |
| Business & Financial | 6,394 (46.6%) | 7,327 (53.4%) |
| Computers, Engineering & Science | 10,527 (76.7%) | 3,202 (23.3%) |
| Computers & Mathematics | 5,567 (79.6%) | 1,430 (20.4%) |
| Architecture & Engineering | 3,833 (81.0%) | 898 (19.0%) |
| Life, Physical & Social Science | 1,127 (56.3%) | 874 (43.7%) |
| Community & Social Service | 10,131 (35.9%) | 18,115 (64.1%) |
| Education, Arts & Media | 1,953 (33.0%) | 3,967 (67.0%) |
| Legal Services & Support | 1,533 (53.7%) | 1,324 (46.3%) |
| Education Instruction & Library | 4,552 (30.0%) | 10,635 (70.0%) |
| Arts, Media & Entertainment | 2,093 (48.9%) | 2,189 (51.1%) |
| Health Diagnosing & Treating | 4,883 (27.6%) | 12,826 (72.4%) |
| Health Technologists | 3,735 (29.7%) | 8,822 (70.3%) |
| Total (Category) | 46,977 (47.6%) | 51,715 (52.4%) |
| Total (Overall) | 130,726 (52.4%) | 118,512 (47.5%) |
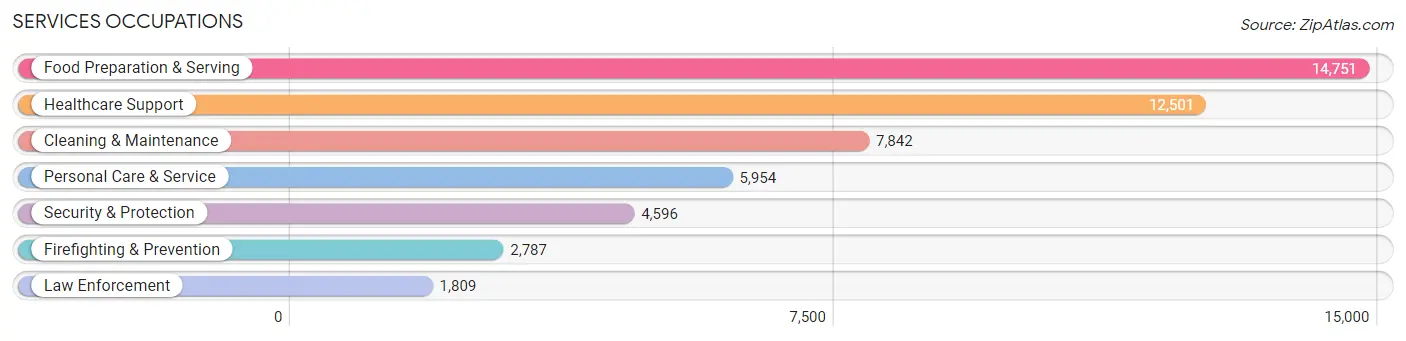
Services Occupations
The most common Services occupations in Spokane County are Food Preparation & Serving (14,751 | 5.9%), Healthcare Support (12,501 | 5.0%), Cleaning & Maintenance (7,842 | 3.2%), Personal Care & Service (5,954 | 2.4%), and Security & Protection (4,596 | 1.8%).
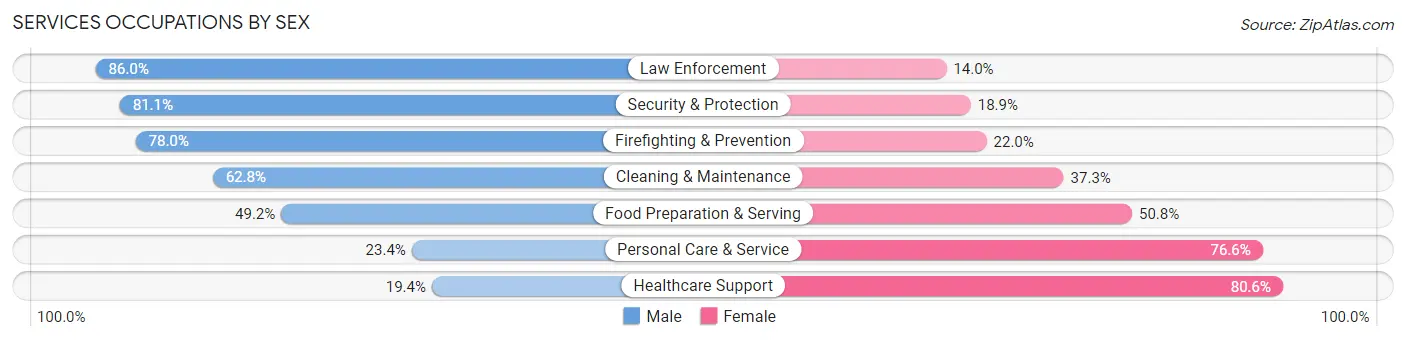
Services Occupations by Sex
Within the Services occupations in Spokane County, the most male-oriented occupations are Law Enforcement (86.0%), Security & Protection (81.1%), and Firefighting & Prevention (78.0%), while the most female-oriented occupations are Healthcare Support (80.6%), Personal Care & Service (76.6%), and Food Preparation & Serving (50.8%).
| Occupation | Male | Female |
| Healthcare Support | 2,421 (19.4%) | 10,080 (80.6%) |
| Security & Protection | 3,729 (81.1%) | 867 (18.9%) |
| Firefighting & Prevention | 2,174 (78.0%) | 613 (22.0%) |
| Law Enforcement | 1,555 (86.0%) | 254 (14.0%) |
| Food Preparation & Serving | 7,259 (49.2%) | 7,492 (50.8%) |
| Cleaning & Maintenance | 4,921 (62.7%) | 2,921 (37.2%) |
| Personal Care & Service | 1,391 (23.4%) | 4,563 (76.6%) |
| Total (Category) | 19,721 (43.2%) | 25,923 (56.8%) |
| Total (Overall) | 130,726 (52.4%) | 118,512 (47.5%) |
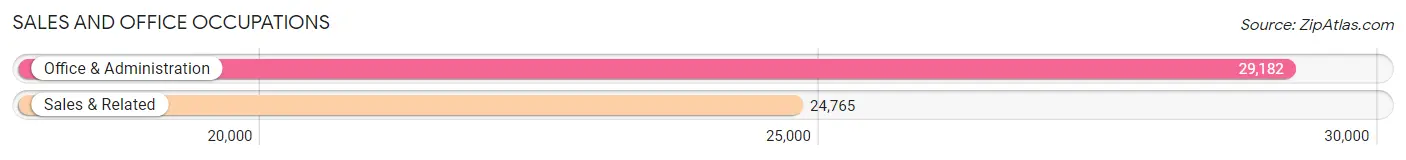
Sales and Office Occupations
The most common Sales and Office occupations in Spokane County are Office & Administration (29,182 | 11.7%), and Sales & Related (24,765 | 9.9%).
Sales and Office Occupations by Sex
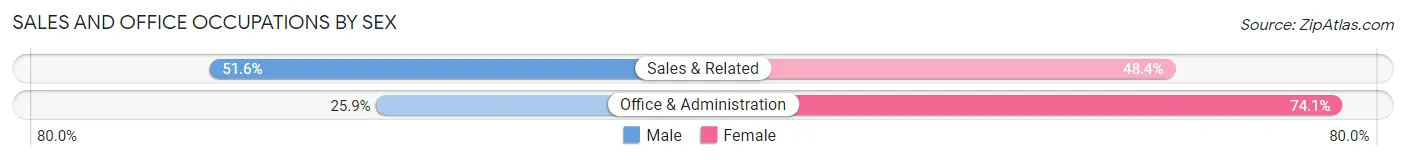
| Occupation | Male | Female |
| Sales & Related | 12,775 (51.6%) | 11,990 (48.4%) |
| Office & Administration | 7,548 (25.9%) | 21,634 (74.1%) |
| Total (Category) | 20,323 (37.7%) | 33,624 (62.3%) |
| Total (Overall) | 130,726 (52.4%) | 118,512 (47.5%) |
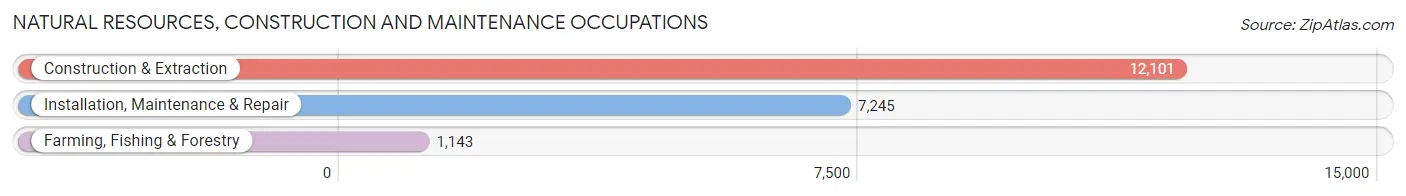
Natural Resources, Construction and Maintenance Occupations
The most common Natural Resources, Construction and Maintenance occupations in Spokane County are Construction & Extraction (12,101 | 4.9%), Installation, Maintenance & Repair (7,245 | 2.9%), and Farming, Fishing & Forestry (1,143 | 0.5%).
Natural Resources, Construction and Maintenance Occupations by Sex
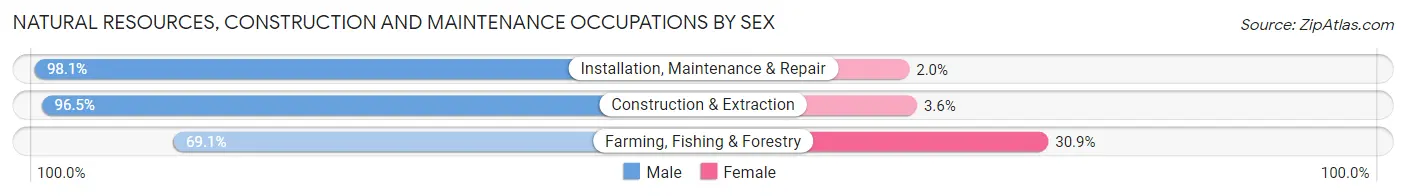
| Occupation | Male | Female |
| Farming, Fishing & Forestry | 790 (69.1%) | 353 (30.9%) |
| Construction & Extraction | 11,671 (96.5%) | 430 (3.5%) |
| Installation, Maintenance & Repair | 7,104 (98.1%) | 141 (1.9%) |
| Total (Category) | 19,565 (95.5%) | 924 (4.5%) |
| Total (Overall) | 130,726 (52.4%) | 118,512 (47.5%) |
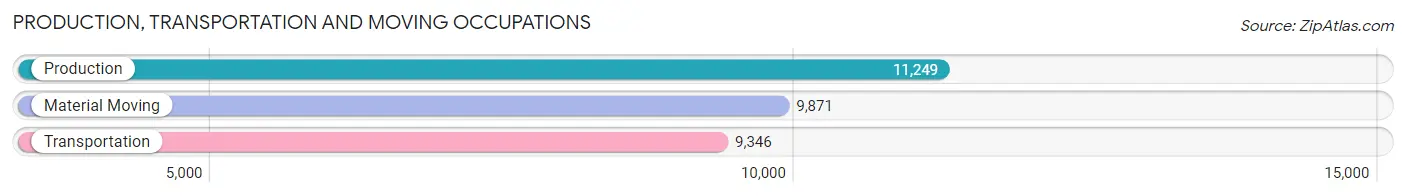
Production, Transportation and Moving Occupations
The most common Production, Transportation and Moving occupations in Spokane County are Production (11,249 | 4.5%), Material Moving (9,871 | 4.0%), and Transportation (9,346 | 3.7%).
Production, Transportation and Moving Occupations by Sex
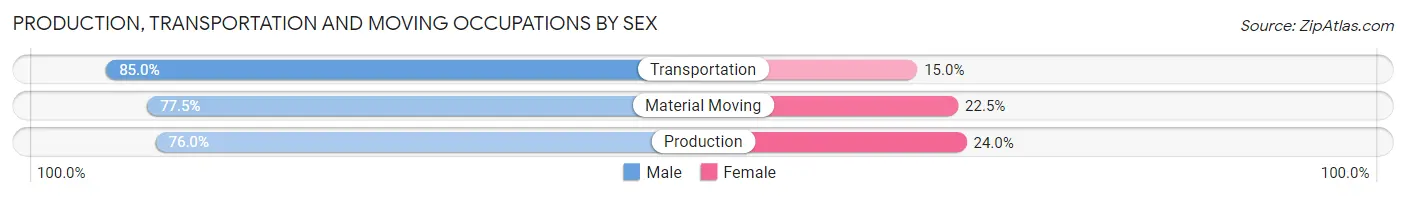
| Occupation | Male | Female |
| Production | 8,545 (76.0%) | 2,704 (24.0%) |
| Transportation | 7,945 (85.0%) | 1,401 (15.0%) |
| Material Moving | 7,650 (77.5%) | 2,221 (22.5%) |
| Total (Category) | 24,140 (79.2%) | 6,326 (20.8%) |
| Total (Overall) | 130,726 (52.4%) | 118,512 (47.5%) |
Employment Industries by Sex in Spokane County
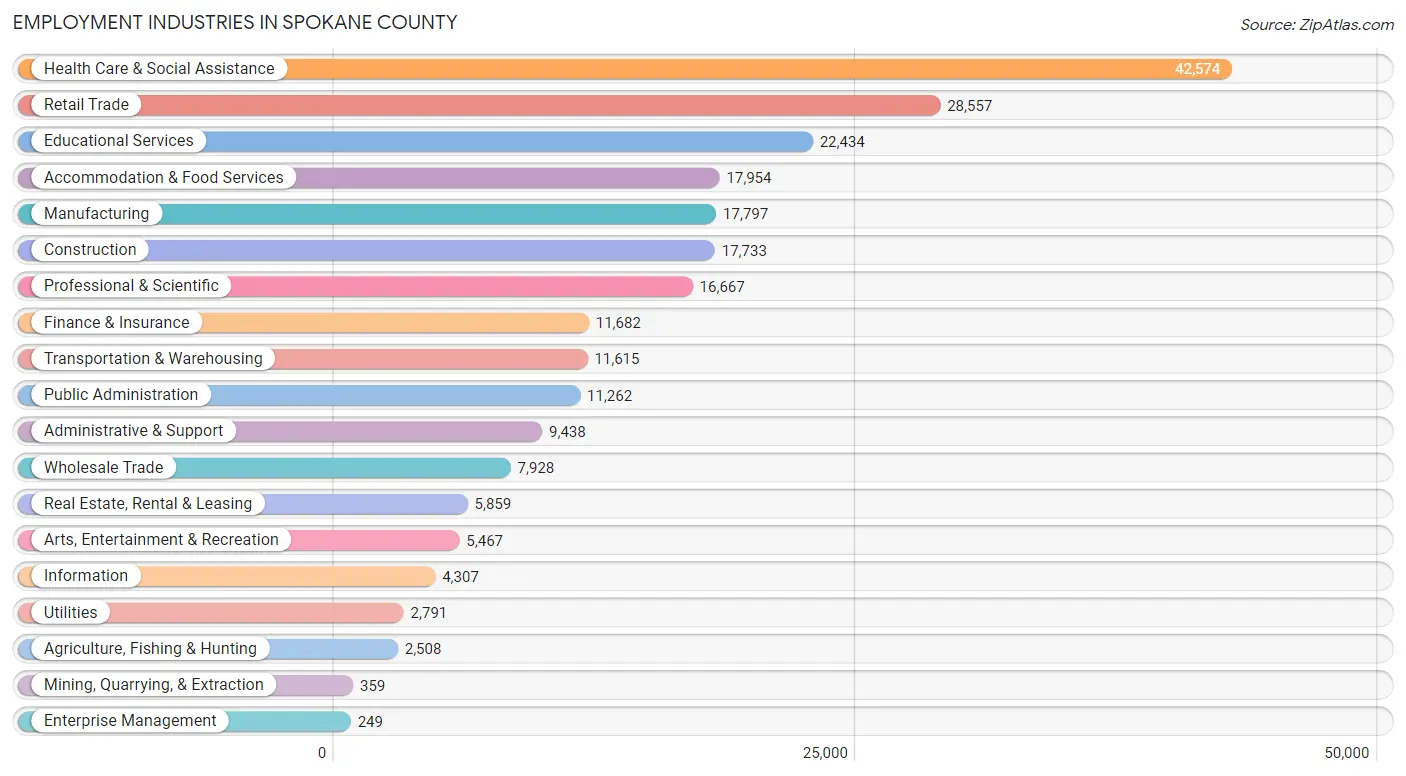
Employment Industries in Spokane County
The major employment industries in Spokane County include Health Care & Social Assistance (42,574 | 17.1%), Retail Trade (28,557 | 11.5%), Educational Services (22,434 | 9.0%), Accommodation & Food Services (17,954 | 7.2%), and Manufacturing (17,797 | 7.1%).
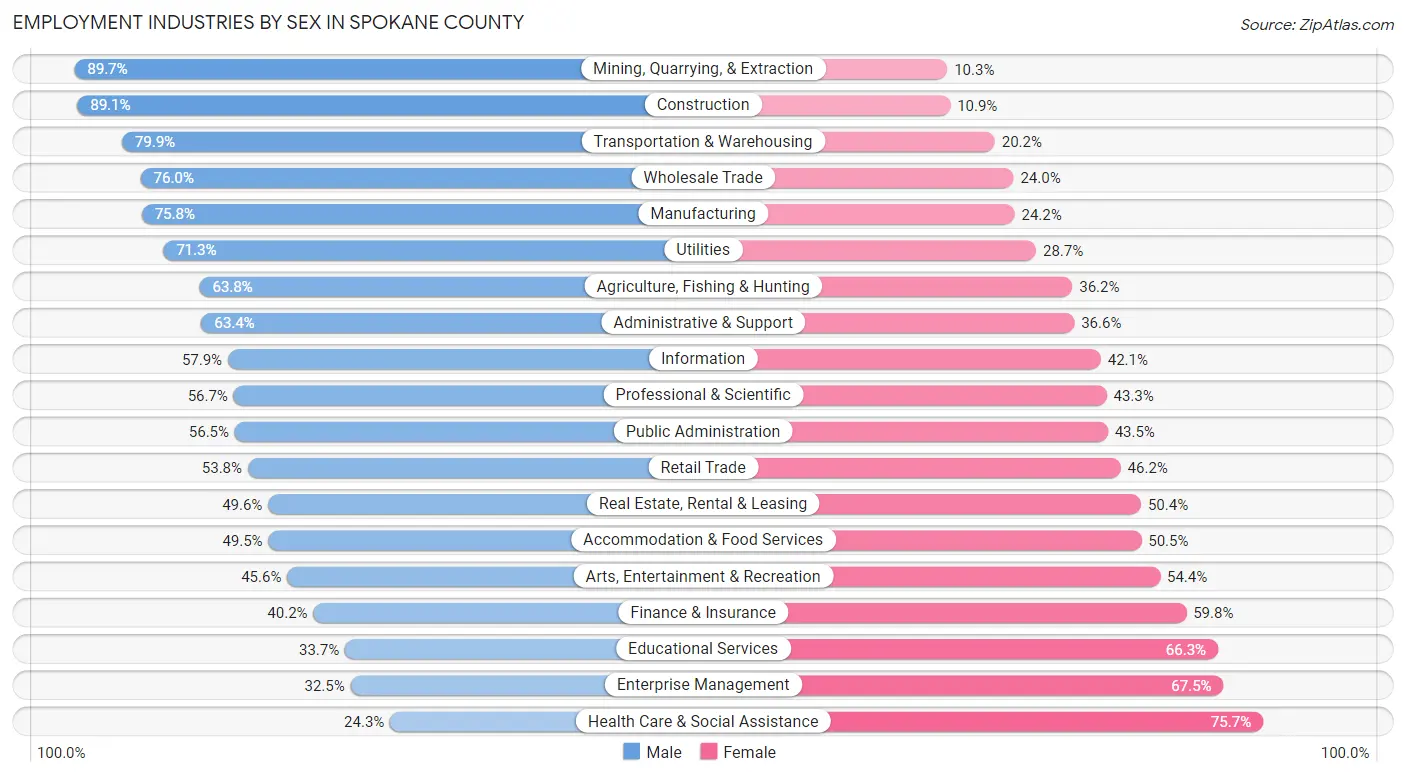
Employment Industries by Sex in Spokane County
The Spokane County industries that see more men than women are Mining, Quarrying, & Extraction (89.7%), Construction (89.1%), and Transportation & Warehousing (79.8%), whereas the industries that tend to have a higher number of women are Health Care & Social Assistance (75.7%), Enterprise Management (67.5%), and Educational Services (66.3%).
| Industry | Male | Female |
| Agriculture, Fishing & Hunting | 1,600 (63.8%) | 908 (36.2%) |
| Mining, Quarrying, & Extraction | 322 (89.7%) | 37 (10.3%) |
| Construction | 15,796 (89.1%) | 1,937 (10.9%) |
| Manufacturing | 13,483 (75.8%) | 4,314 (24.2%) |
| Wholesale Trade | 6,024 (76.0%) | 1,904 (24.0%) |
| Retail Trade | 15,361 (53.8%) | 13,196 (46.2%) |
| Transportation & Warehousing | 9,275 (79.8%) | 2,340 (20.2%) |
| Utilities | 1,990 (71.3%) | 801 (28.7%) |
| Information | 2,494 (57.9%) | 1,813 (42.1%) |
| Finance & Insurance | 4,699 (40.2%) | 6,983 (59.8%) |
| Real Estate, Rental & Leasing | 2,905 (49.6%) | 2,954 (50.4%) |
| Professional & Scientific | 9,454 (56.7%) | 7,213 (43.3%) |
| Enterprise Management | 81 (32.5%) | 168 (67.5%) |
| Administrative & Support | 5,984 (63.4%) | 3,454 (36.6%) |
| Educational Services | 7,553 (33.7%) | 14,881 (66.3%) |
| Health Care & Social Assistance | 10,362 (24.3%) | 32,212 (75.7%) |
| Arts, Entertainment & Recreation | 2,495 (45.6%) | 2,972 (54.4%) |
| Accommodation & Food Services | 8,893 (49.5%) | 9,061 (50.5%) |
| Public Administration | 6,361 (56.5%) | 4,901 (43.5%) |
| Total | 130,726 (52.4%) | 118,512 (47.5%) |
Education in Spokane County
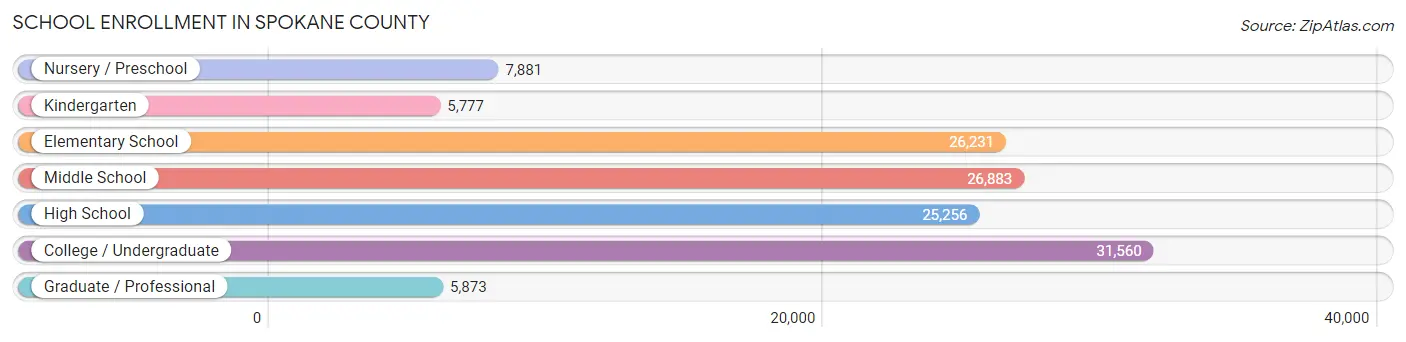
School Enrollment in Spokane County
The most common levels of schooling among the 129,461 students in Spokane County are college / undergraduate (31,560 | 24.4%), middle school (26,883 | 20.8%), and elementary school (26,231 | 20.3%).
| School Level | # Students | % Students |
| Nursery / Preschool | 7,881 | 6.1% |
| Kindergarten | 5,777 | 4.5% |
| Elementary School | 26,231 | 20.3% |
| Middle School | 26,883 | 20.8% |
| High School | 25,256 | 19.5% |
| College / Undergraduate | 31,560 | 24.4% |
| Graduate / Professional | 5,873 | 4.5% |
| Total | 129,461 | 100.0% |
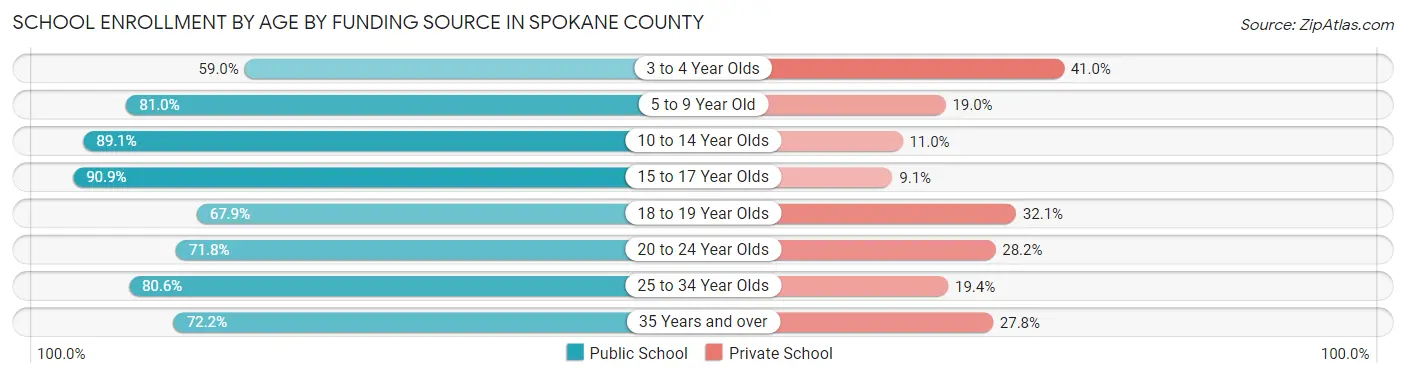
School Enrollment by Age by Funding Source in Spokane County
Out of a total of 129,461 students who are enrolled in schools in Spokane County, 24,468 (18.9%) attend a private institution, while the remaining 104,993 (81.1%) are enrolled in public schools. The age group of 3 to 4 year olds has the highest likelihood of being enrolled in private schools, with 2,299 (41.0% in the age bracket) enrolled. Conversely, the age group of 15 to 17 year olds has the lowest likelihood of being enrolled in a private school, with 17,611 (90.9% in the age bracket) attending a public institution.
| Age Bracket | Public School | Private School |
| 3 to 4 Year Olds | 3,311 (59.0%) | 2,299 (41.0%) |
| 5 to 9 Year Old | 24,815 (81.0%) | 5,804 (19.0%) |
| 10 to 14 Year Olds | 29,086 (89.0%) | 3,576 (11.0%) |
| 15 to 17 Year Olds | 17,611 (90.9%) | 1,755 (9.1%) |
| 18 to 19 Year Olds | 6,808 (67.9%) | 3,215 (32.1%) |
| 20 to 24 Year Olds | 10,179 (71.8%) | 4,006 (28.2%) |
| 25 to 34 Year Olds | 8,165 (80.6%) | 1,970 (19.4%) |
| 35 Years and over | 4,954 (72.2%) | 1,907 (27.8%) |
| Total | 104,993 (81.1%) | 24,468 (18.9%) |
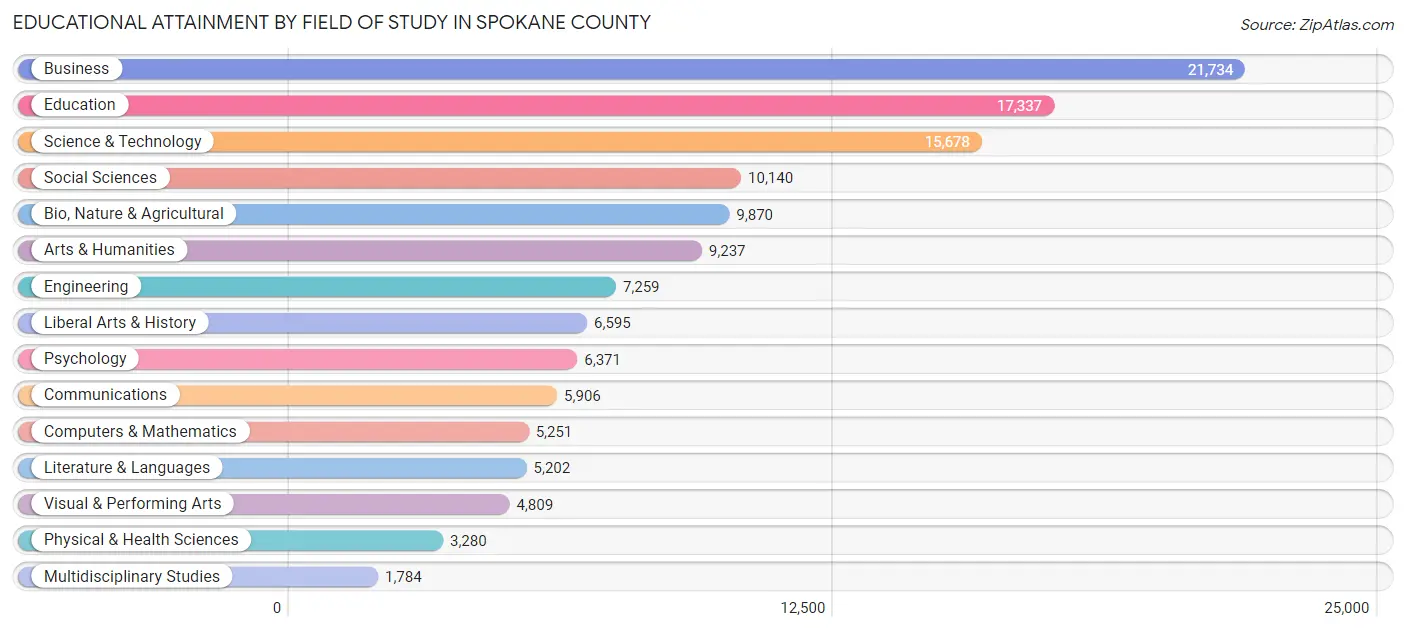
Educational Attainment by Field of Study in Spokane County
Business (21,734 | 16.7%), education (17,337 | 13.3%), science & technology (15,678 | 12.0%), social sciences (10,140 | 7.8%), and bio, nature & agricultural (9,870 | 7.6%) are the most common fields of study among 130,453 individuals in Spokane County who have obtained a bachelor's degree or higher.
| Field of Study | # Graduates | % Graduates |
| Computers & Mathematics | 5,251 | 4.0% |
| Bio, Nature & Agricultural | 9,870 | 7.6% |
| Physical & Health Sciences | 3,280 | 2.5% |
| Psychology | 6,371 | 4.9% |
| Social Sciences | 10,140 | 7.8% |
| Engineering | 7,259 | 5.6% |
| Multidisciplinary Studies | 1,784 | 1.4% |
| Science & Technology | 15,678 | 12.0% |
| Business | 21,734 | 16.7% |
| Education | 17,337 | 13.3% |
| Literature & Languages | 5,202 | 4.0% |
| Liberal Arts & History | 6,595 | 5.1% |
| Visual & Performing Arts | 4,809 | 3.7% |
| Communications | 5,906 | 4.5% |
| Arts & Humanities | 9,237 | 7.1% |
| Total | 130,453 | 100.0% |
Transportation & Commute in Spokane County
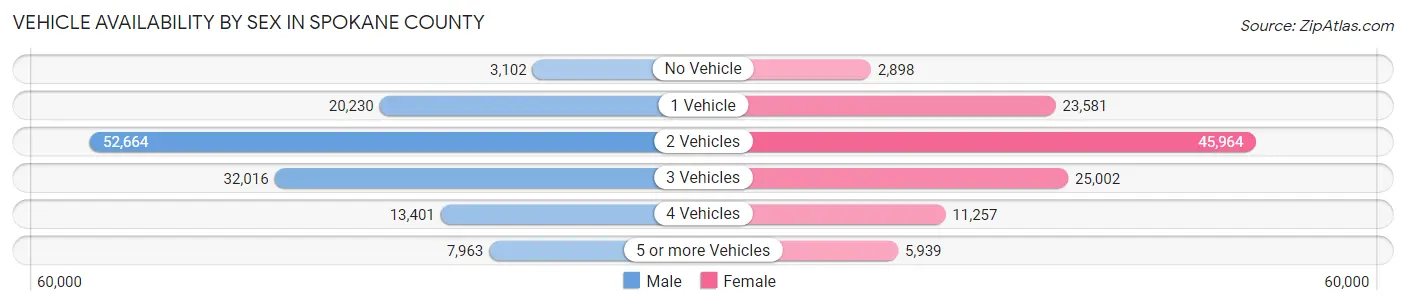
Vehicle Availability by Sex in Spokane County
The most prevalent vehicle ownership categories in Spokane County are males with 2 vehicles (52,664, accounting for 40.7%) and females with 2 vehicles (45,964, making up 45.9%).
| Vehicles Available | Male | Female |
| No Vehicle | 3,102 (2.4%) | 2,898 (2.5%) |
| 1 Vehicle | 20,230 (15.6%) | 23,581 (20.6%) |
| 2 Vehicles | 52,664 (40.7%) | 45,964 (40.1%) |
| 3 Vehicles | 32,016 (24.7%) | 25,002 (21.8%) |
| 4 Vehicles | 13,401 (10.4%) | 11,257 (9.8%) |
| 5 or more Vehicles | 7,963 (6.1%) | 5,939 (5.2%) |
| Total | 129,376 (100.0%) | 114,641 (100.0%) |
Commute Time in Spokane County
The most frequently occuring commute durations in Spokane County are 15 to 19 minutes (42,593 commuters, 19.7%), 20 to 24 minutes (39,360 commuters, 18.2%), and 10 to 14 minutes (31,124 commuters, 14.4%).
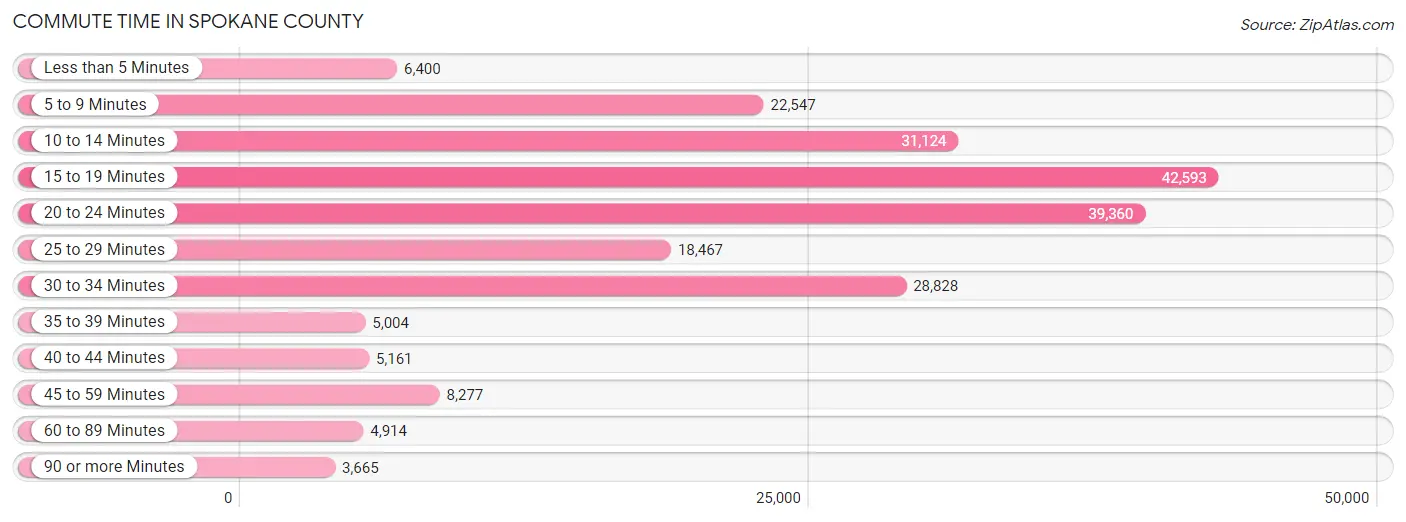
| Commute Time | # Commuters | % Commuters |
| Less than 5 Minutes | 6,400 | 3.0% |
| 5 to 9 Minutes | 22,547 | 10.4% |
| 10 to 14 Minutes | 31,124 | 14.4% |
| 15 to 19 Minutes | 42,593 | 19.7% |
| 20 to 24 Minutes | 39,360 | 18.2% |
| 25 to 29 Minutes | 18,467 | 8.5% |
| 30 to 34 Minutes | 28,828 | 13.3% |
| 35 to 39 Minutes | 5,004 | 2.3% |
| 40 to 44 Minutes | 5,161 | 2.4% |
| 45 to 59 Minutes | 8,277 | 3.8% |
| 60 to 89 Minutes | 4,914 | 2.3% |
| 90 or more Minutes | 3,665 | 1.7% |
Commute Time by Sex in Spokane County
The most common commute times in Spokane County are 15 to 19 minutes (22,952 commuters, 19.6%) for males and 15 to 19 minutes (19,641 commuters, 19.8%) for females.
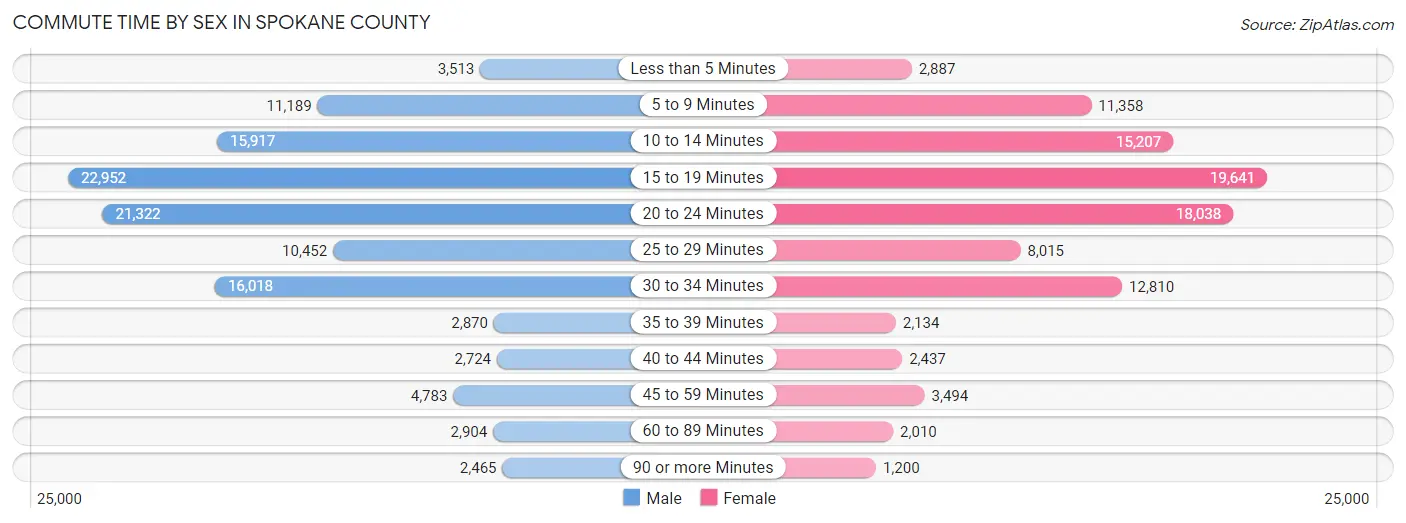
| Commute Time | Male | Female |
| Less than 5 Minutes | 3,513 (3.0%) | 2,887 (2.9%) |
| 5 to 9 Minutes | 11,189 (9.6%) | 11,358 (11.5%) |
| 10 to 14 Minutes | 15,917 (13.6%) | 15,207 (15.3%) |
| 15 to 19 Minutes | 22,952 (19.6%) | 19,641 (19.8%) |
| 20 to 24 Minutes | 21,322 (18.2%) | 18,038 (18.2%) |
| 25 to 29 Minutes | 10,452 (8.9%) | 8,015 (8.1%) |
| 30 to 34 Minutes | 16,018 (13.7%) | 12,810 (12.9%) |
| 35 to 39 Minutes | 2,870 (2.5%) | 2,134 (2.1%) |
| 40 to 44 Minutes | 2,724 (2.3%) | 2,437 (2.5%) |
| 45 to 59 Minutes | 4,783 (4.1%) | 3,494 (3.5%) |
| 60 to 89 Minutes | 2,904 (2.5%) | 2,010 (2.0%) |
| 90 or more Minutes | 2,465 (2.1%) | 1,200 (1.2%) |
Time of Departure to Work by Sex in Spokane County
The most frequent times of departure to work in Spokane County are 7:00 AM to 7:29 AM (15,590, 13.3%) for males and 7:00 AM to 7:29 AM (15,314, 15.4%) for females.
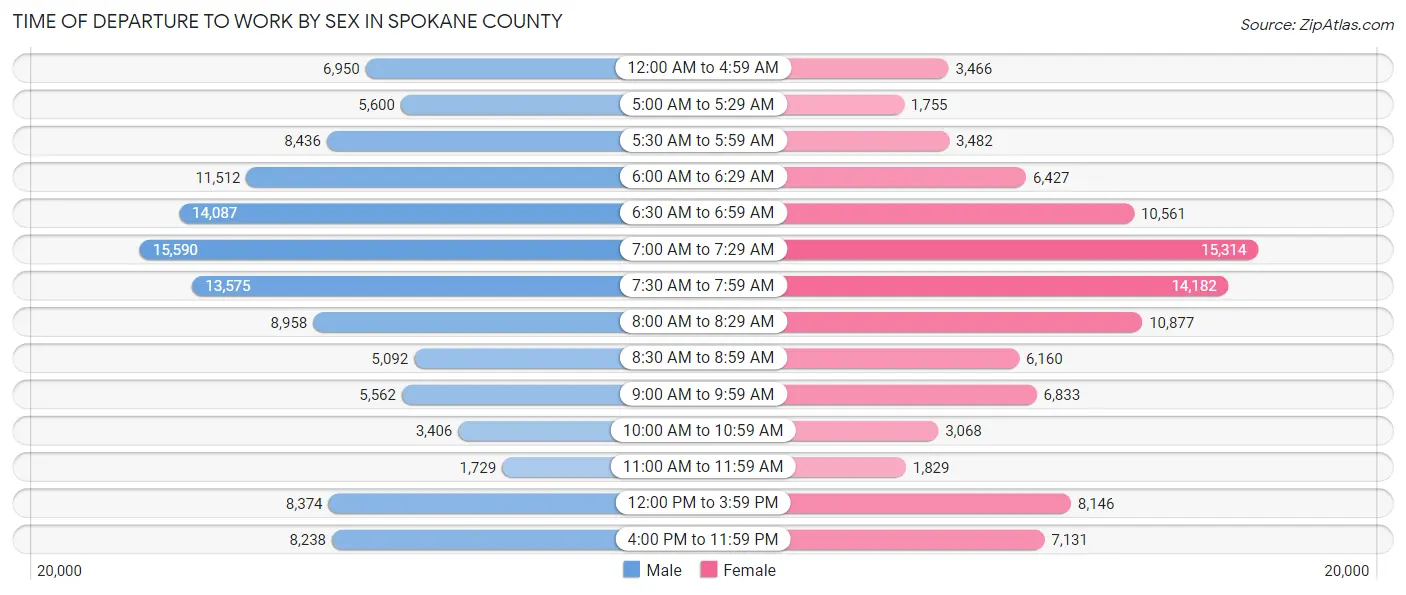
| Time of Departure | Male | Female |
| 12:00 AM to 4:59 AM | 6,950 (5.9%) | 3,466 (3.5%) |
| 5:00 AM to 5:29 AM | 5,600 (4.8%) | 1,755 (1.8%) |
| 5:30 AM to 5:59 AM | 8,436 (7.2%) | 3,482 (3.5%) |
| 6:00 AM to 6:29 AM | 11,512 (9.8%) | 6,427 (6.5%) |
| 6:30 AM to 6:59 AM | 14,087 (12.0%) | 10,561 (10.6%) |
| 7:00 AM to 7:29 AM | 15,590 (13.3%) | 15,314 (15.4%) |
| 7:30 AM to 7:59 AM | 13,575 (11.6%) | 14,182 (14.3%) |
| 8:00 AM to 8:29 AM | 8,958 (7.6%) | 10,877 (11.0%) |
| 8:30 AM to 8:59 AM | 5,092 (4.3%) | 6,160 (6.2%) |
| 9:00 AM to 9:59 AM | 5,562 (4.8%) | 6,833 (6.9%) |
| 10:00 AM to 10:59 AM | 3,406 (2.9%) | 3,068 (3.1%) |
| 11:00 AM to 11:59 AM | 1,729 (1.5%) | 1,829 (1.8%) |
| 12:00 PM to 3:59 PM | 8,374 (7.1%) | 8,146 (8.2%) |
| 4:00 PM to 11:59 PM | 8,238 (7.0%) | 7,131 (7.2%) |
| Total | 117,109 (100.0%) | 99,231 (100.0%) |
Housing Occupancy in Spokane County
Occupancy by Ownership in Spokane County
Of the total 213,524 dwellings in Spokane County, owner-occupied units account for 136,125 (63.7%), while renter-occupied units make up 77,399 (36.2%).
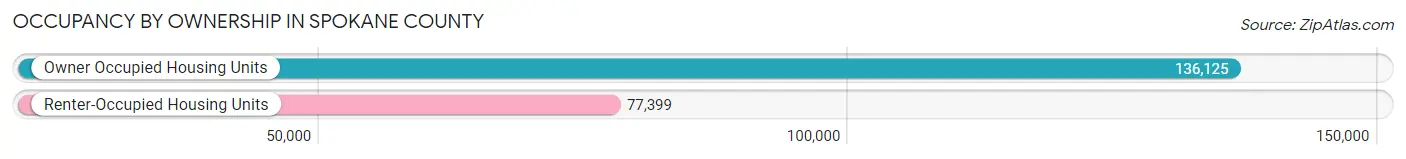
| Occupancy | # Housing Units | % Housing Units |
| Owner Occupied Housing Units | 136,125 | 63.7% |
| Renter-Occupied Housing Units | 77,399 | 36.2% |
| Total Occupied Housing Units | 213,524 | 100.0% |
Occupancy by Household Size in Spokane County
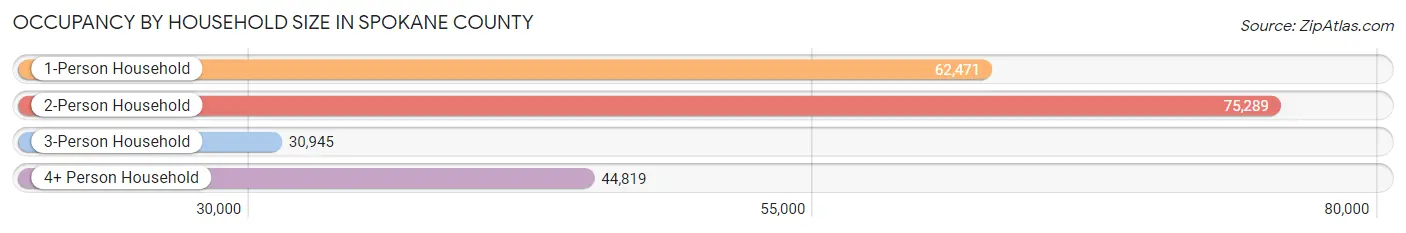
| Household Size | # Housing Units | % Housing Units |
| 1-Person Household | 62,471 | 29.3% |
| 2-Person Household | 75,289 | 35.3% |
| 3-Person Household | 30,945 | 14.5% |
| 4+ Person Household | 44,819 | 21.0% |
| Total Housing Units | 213,524 | 100.0% |
Occupancy by Ownership by Household Size in Spokane County
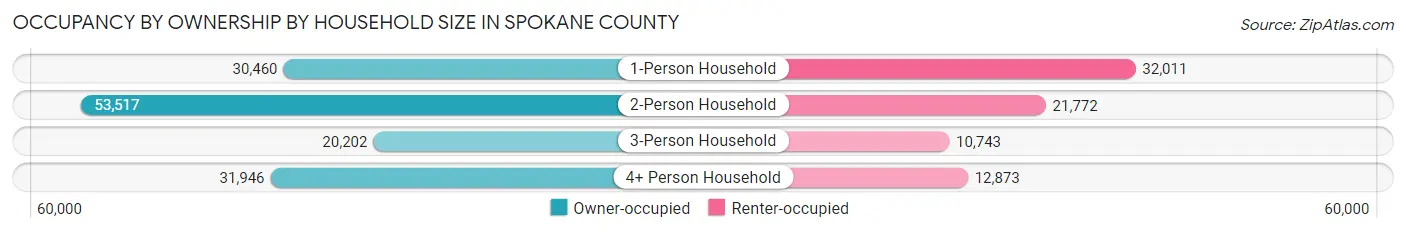
| Household Size | Owner-occupied | Renter-occupied |
| 1-Person Household | 30,460 (48.8%) | 32,011 (51.2%) |
| 2-Person Household | 53,517 (71.1%) | 21,772 (28.9%) |
| 3-Person Household | 20,202 (65.3%) | 10,743 (34.7%) |
| 4+ Person Household | 31,946 (71.3%) | 12,873 (28.7%) |
| Total Housing Units | 136,125 (63.7%) | 77,399 (36.2%) |
Occupancy by Educational Attainment in Spokane County
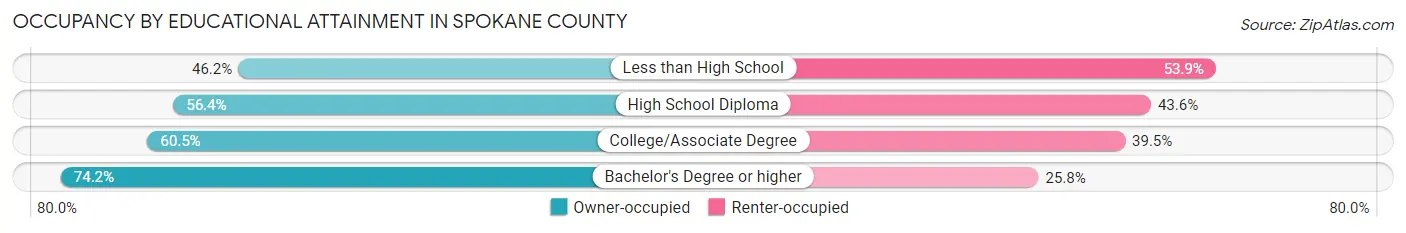
| Household Size | Owner-occupied | Renter-occupied |
| Less than High School | 4,444 (46.2%) | 5,185 (53.8%) |
| High School Diploma | 24,346 (56.4%) | 18,813 (43.6%) |
| College/Associate Degree | 52,916 (60.5%) | 34,523 (39.5%) |
| Bachelor's Degree or higher | 54,419 (74.2%) | 18,878 (25.8%) |
Occupancy by Age of Householder in Spokane County
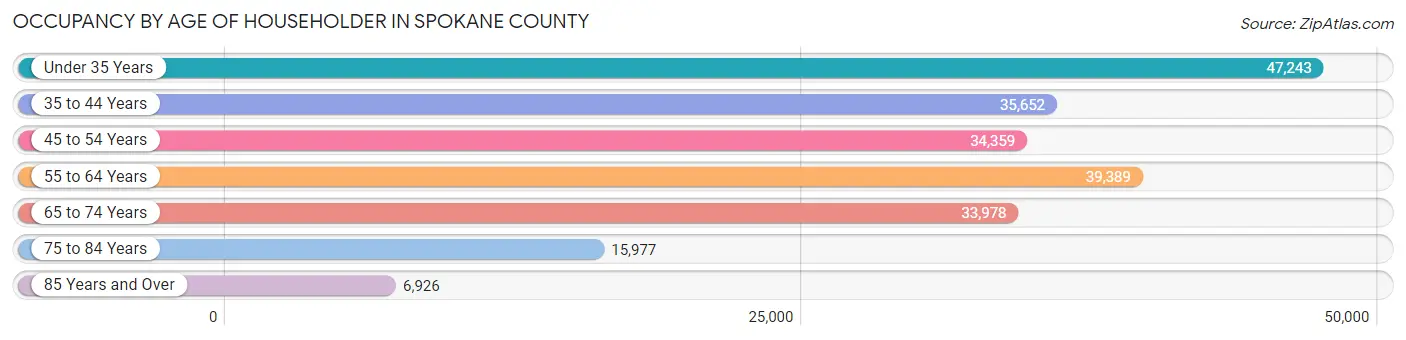
| Age Bracket | # Households | % Households |
| Under 35 Years | 47,243 | 22.1% |
| 35 to 44 Years | 35,652 | 16.7% |
| 45 to 54 Years | 34,359 | 16.1% |
| 55 to 64 Years | 39,389 | 18.4% |
| 65 to 74 Years | 33,978 | 15.9% |
| 75 to 84 Years | 15,977 | 7.5% |
| 85 Years and Over | 6,926 | 3.2% |
| Total | 213,524 | 100.0% |
Housing Finances in Spokane County
Median Income by Occupancy in Spokane County
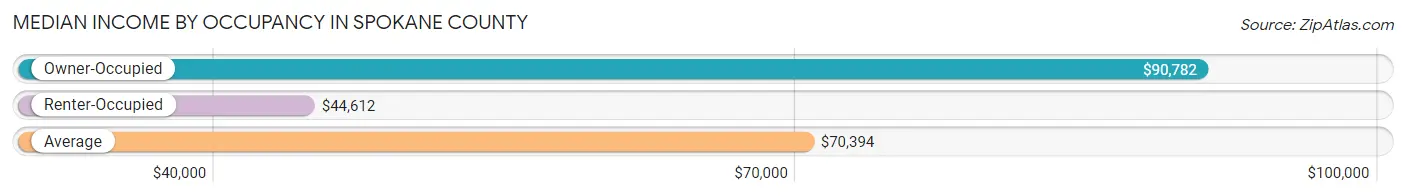
| Occupancy Type | # Households | Median Income |
| Owner-Occupied | 136,125 (63.7%) | $90,782 |
| Renter-Occupied | 77,399 (36.2%) | $44,612 |
| Average | 213,524 (100.0%) | $70,394 |
Occupancy by Householder Income Bracket in Spokane County
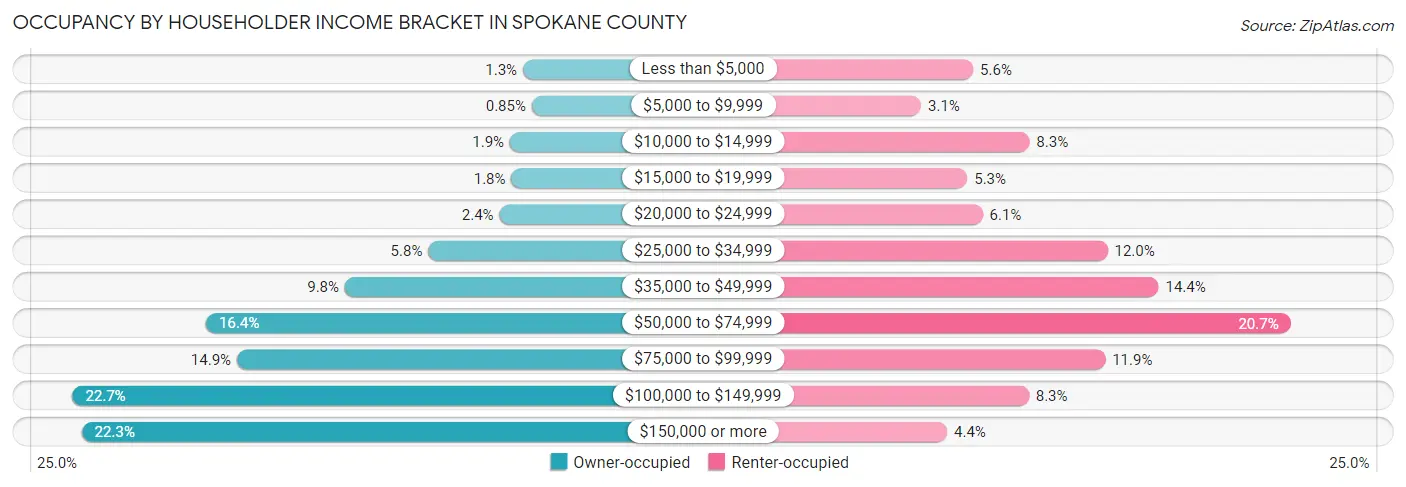
| Income Bracket | Owner-occupied | Renter-occupied |
| Less than $5,000 | 1,728 (1.3%) | 4,332 (5.6%) |
| $5,000 to $9,999 | 1,155 (0.9%) | 2,412 (3.1%) |
| $10,000 to $14,999 | 2,577 (1.9%) | 6,406 (8.3%) |
| $15,000 to $19,999 | 2,478 (1.8%) | 4,118 (5.3%) |
| $20,000 to $24,999 | 3,247 (2.4%) | 4,684 (6.0%) |
| $25,000 to $34,999 | 7,873 (5.8%) | 9,288 (12.0%) |
| $35,000 to $49,999 | 13,274 (9.8%) | 11,169 (14.4%) |
| $50,000 to $74,999 | 22,266 (16.4%) | 16,031 (20.7%) |
| $75,000 to $99,999 | 20,266 (14.9%) | 9,200 (11.9%) |
| $100,000 to $149,999 | 30,922 (22.7%) | 6,385 (8.3%) |
| $150,000 or more | 30,339 (22.3%) | 3,374 (4.4%) |
| Total | 136,125 (100.0%) | 77,399 (100.0%) |
Monthly Housing Cost Tiers in Spokane County
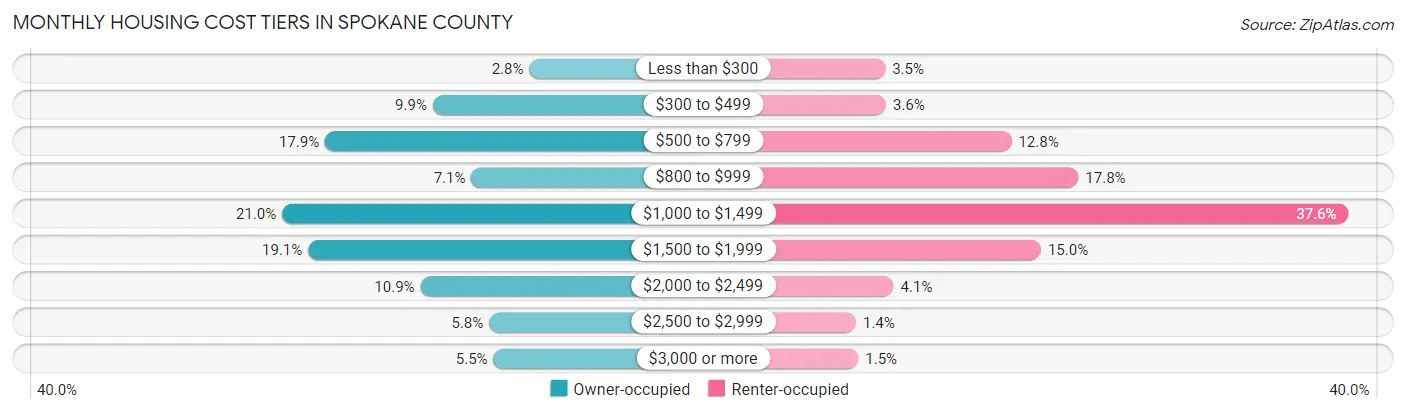
| Monthly Cost | Owner-occupied | Renter-occupied |
| Less than $300 | 3,846 (2.8%) | 2,722 (3.5%) |
| $300 to $499 | 13,534 (9.9%) | 2,770 (3.6%) |
| $500 to $799 | 24,320 (17.9%) | 9,923 (12.8%) |
| $800 to $999 | 9,671 (7.1%) | 13,736 (17.7%) |
| $1,000 to $1,499 | 28,640 (21.0%) | 29,128 (37.6%) |
| $1,500 to $1,999 | 26,021 (19.1%) | 11,603 (15.0%) |
| $2,000 to $2,499 | 14,767 (10.8%) | 3,203 (4.1%) |
| $2,500 to $2,999 | 7,885 (5.8%) | 1,057 (1.4%) |
| $3,000 or more | 7,441 (5.5%) | 1,195 (1.5%) |
| Total | 136,125 (100.0%) | 77,399 (100.0%) |
Physical Housing Characteristics in Spokane County
Housing Structures in Spokane County
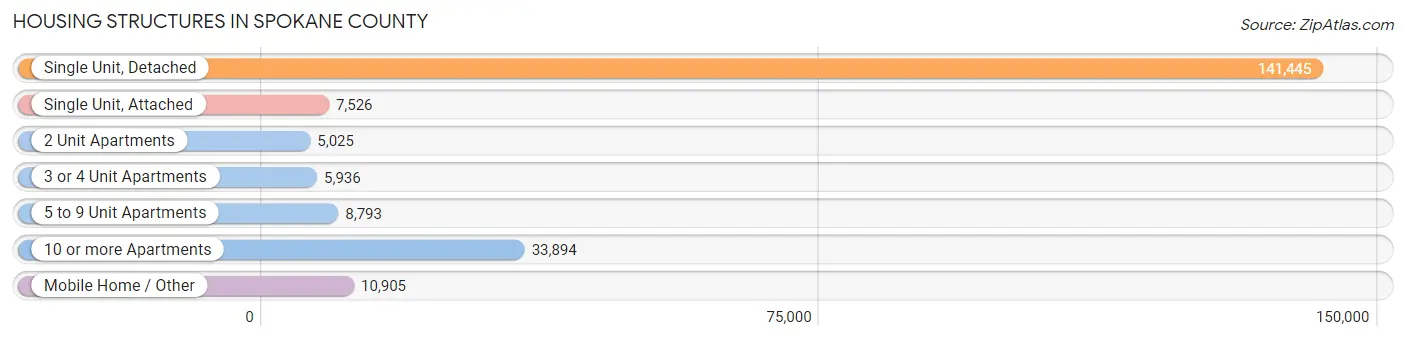
| Structure Type | # Housing Units | % Housing Units |
| Single Unit, Detached | 141,445 | 66.2% |
| Single Unit, Attached | 7,526 | 3.5% |
| 2 Unit Apartments | 5,025 | 2.4% |
| 3 or 4 Unit Apartments | 5,936 | 2.8% |
| 5 to 9 Unit Apartments | 8,793 | 4.1% |
| 10 or more Apartments | 33,894 | 15.9% |
| Mobile Home / Other | 10,905 | 5.1% |
| Total | 213,524 | 100.0% |
Housing Structures by Occupancy in Spokane County
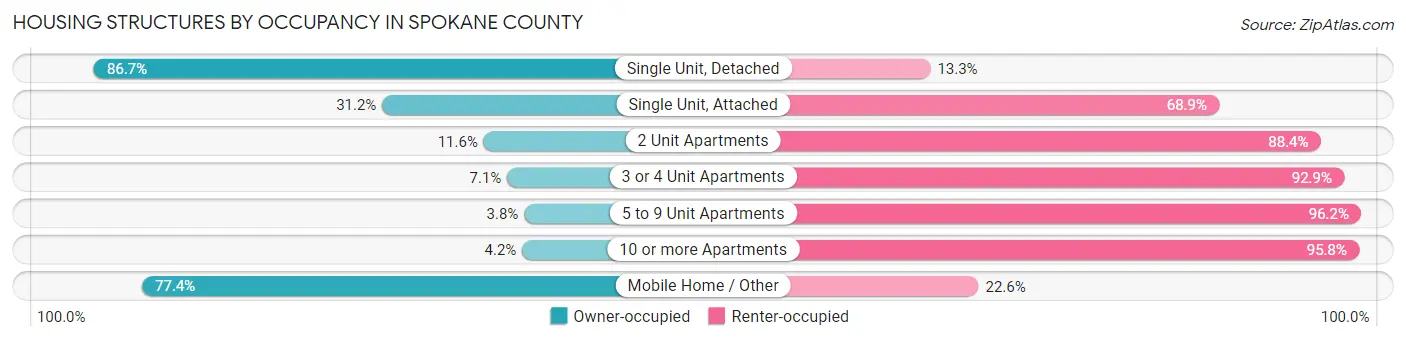
| Structure Type | Owner-occupied | Renter-occupied |
| Single Unit, Detached | 122,580 (86.7%) | 18,865 (13.3%) |
| Single Unit, Attached | 2,344 (31.1%) | 5,182 (68.9%) |
| 2 Unit Apartments | 583 (11.6%) | 4,442 (88.4%) |
| 3 or 4 Unit Apartments | 420 (7.1%) | 5,516 (92.9%) |
| 5 to 9 Unit Apartments | 335 (3.8%) | 8,458 (96.2%) |
| 10 or more Apartments | 1,422 (4.2%) | 32,472 (95.8%) |
| Mobile Home / Other | 8,441 (77.4%) | 2,464 (22.6%) |
| Total | 136,125 (63.7%) | 77,399 (36.2%) |
Housing Structures by Number of Rooms in Spokane County
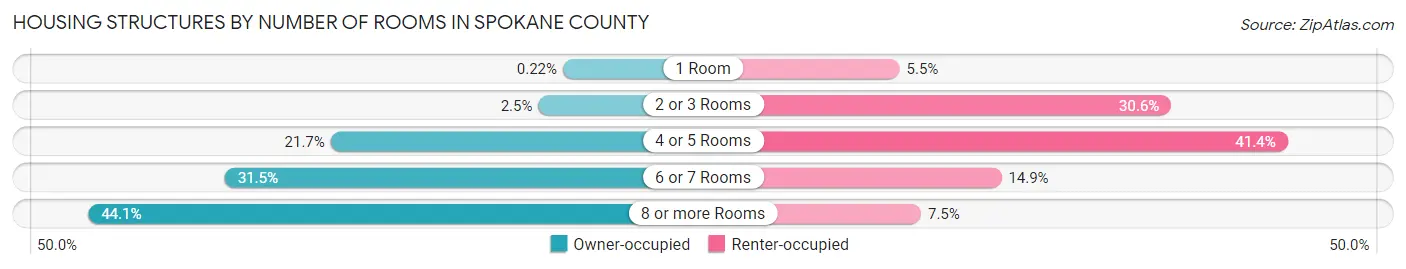
| Number of Rooms | Owner-occupied | Renter-occupied |
| 1 Room | 299 (0.2%) | 4,275 (5.5%) |
| 2 or 3 Rooms | 3,389 (2.5%) | 23,707 (30.6%) |
| 4 or 5 Rooms | 29,534 (21.7%) | 32,046 (41.4%) |
| 6 or 7 Rooms | 42,853 (31.5%) | 11,567 (14.9%) |
| 8 or more Rooms | 60,050 (44.1%) | 5,804 (7.5%) |
| Total | 136,125 (100.0%) | 77,399 (100.0%) |
Housing Structure by Heating Type in Spokane County
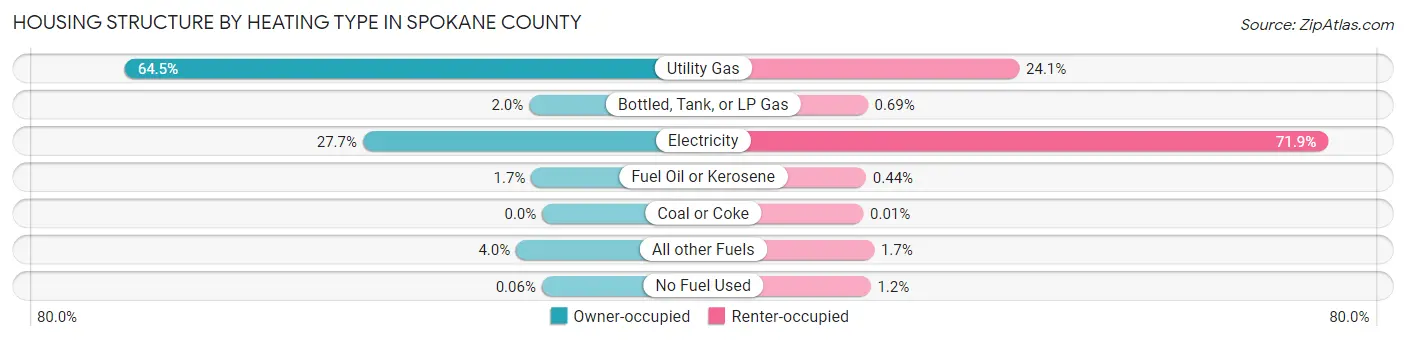
| Heating Type | Owner-occupied | Renter-occupied |
| Utility Gas | 87,797 (64.5%) | 18,678 (24.1%) |
| Bottled, Tank, or LP Gas | 2,735 (2.0%) | 532 (0.7%) |
| Electricity | 37,736 (27.7%) | 55,645 (71.9%) |
| Fuel Oil or Kerosene | 2,292 (1.7%) | 342 (0.4%) |
| Coal or Coke | 0 (0.0%) | 6 (0.0%) |
| All other Fuels | 5,482 (4.0%) | 1,308 (1.7%) |
| No Fuel Used | 83 (0.1%) | 888 (1.1%) |
| Total | 136,125 (100.0%) | 77,399 (100.0%) |
Household Vehicle Usage in Spokane County
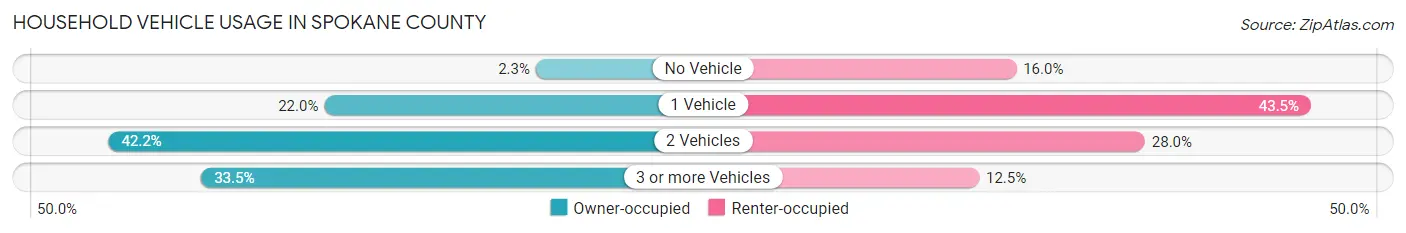
| Vehicles per Household | Owner-occupied | Renter-occupied |
| No Vehicle | 3,108 (2.3%) | 12,377 (16.0%) |
| 1 Vehicle | 29,992 (22.0%) | 33,661 (43.5%) |
| 2 Vehicles | 57,405 (42.2%) | 21,669 (28.0%) |
| 3 or more Vehicles | 45,620 (33.5%) | 9,692 (12.5%) |
| Total | 136,125 (100.0%) | 77,399 (100.0%) |
Real Estate & Mortgages in Spokane County
Real Estate and Mortgage Overview in Spokane County
| Characteristic | Without Mortgage | With Mortgage |
| Housing Units | 46,864 | 89,261 |
| Median Property Value | $304,700 | $343,400 |
| Median Household Income | $67,063 | $22,853 |
| Monthly Housing Costs | $577 | $7,350 |
| Real Estate Taxes | $2,887 | $1,909 |
Property Value by Mortgage Status in Spokane County
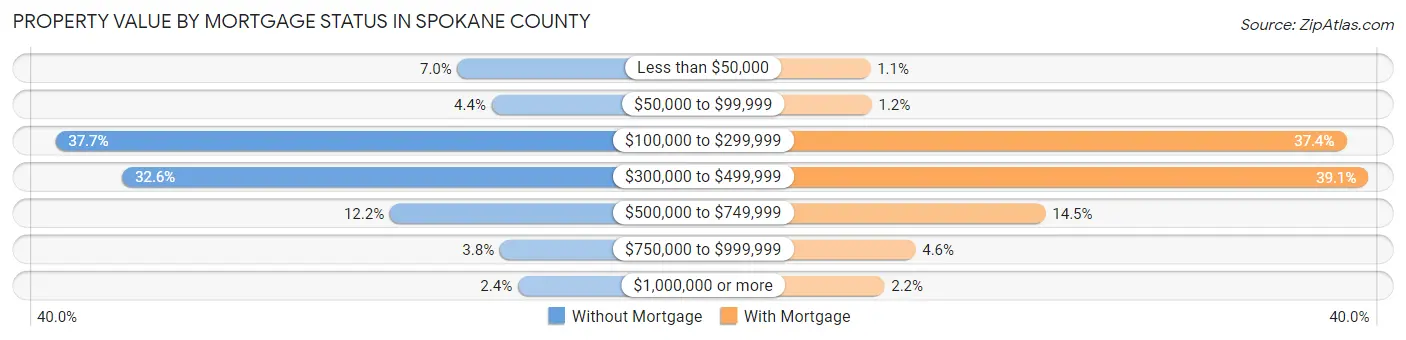
| Property Value | Without Mortgage | With Mortgage |
| Less than $50,000 | 3,287 (7.0%) | 996 (1.1%) |
| $50,000 to $99,999 | 2,066 (4.4%) | 1,089 (1.2%) |
| $100,000 to $299,999 | 17,648 (37.7%) | 33,374 (37.4%) |
| $300,000 to $499,999 | 15,266 (32.6%) | 34,877 (39.1%) |
| $500,000 to $749,999 | 5,699 (12.2%) | 12,907 (14.5%) |
| $750,000 to $999,999 | 1,770 (3.8%) | 4,063 (4.5%) |
| $1,000,000 or more | 1,128 (2.4%) | 1,955 (2.2%) |
| Total | 46,864 (100.0%) | 89,261 (100.0%) |
Household Income by Mortgage Status in Spokane County
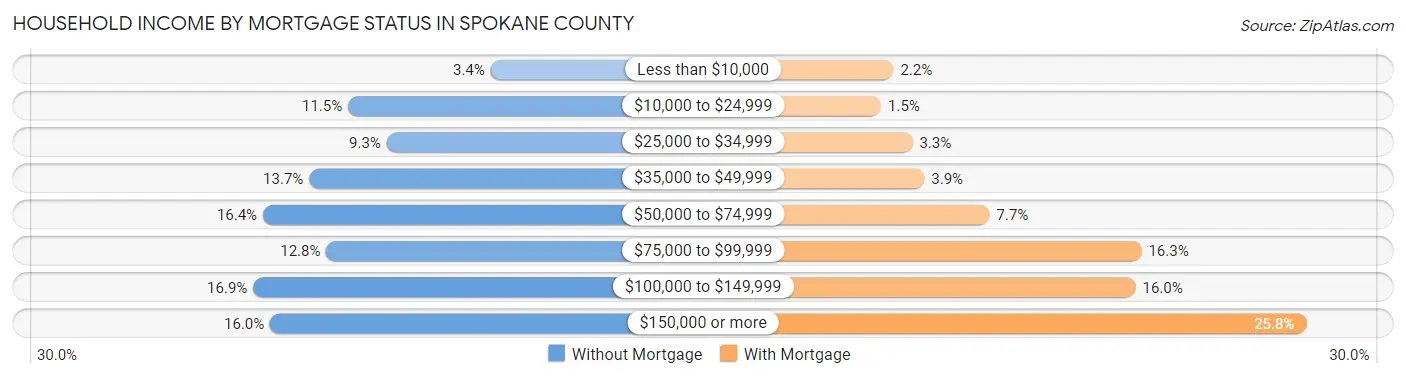
| Household Income | Without Mortgage | With Mortgage |
| Less than $10,000 | 1,579 (3.4%) | 1,940 (2.2%) |
| $10,000 to $24,999 | 5,399 (11.5%) | 1,304 (1.5%) |
| $25,000 to $34,999 | 4,364 (9.3%) | 2,903 (3.3%) |
| $35,000 to $49,999 | 6,440 (13.7%) | 3,509 (3.9%) |
| $50,000 to $74,999 | 7,678 (16.4%) | 6,834 (7.7%) |
| $75,000 to $99,999 | 5,980 (12.8%) | 14,588 (16.3%) |
| $100,000 to $149,999 | 7,938 (16.9%) | 14,286 (16.0%) |
| $150,000 or more | 7,486 (16.0%) | 22,984 (25.8%) |
| Total | 46,864 (100.0%) | 89,261 (100.0%) |
Property Value to Household Income Ratio in Spokane County
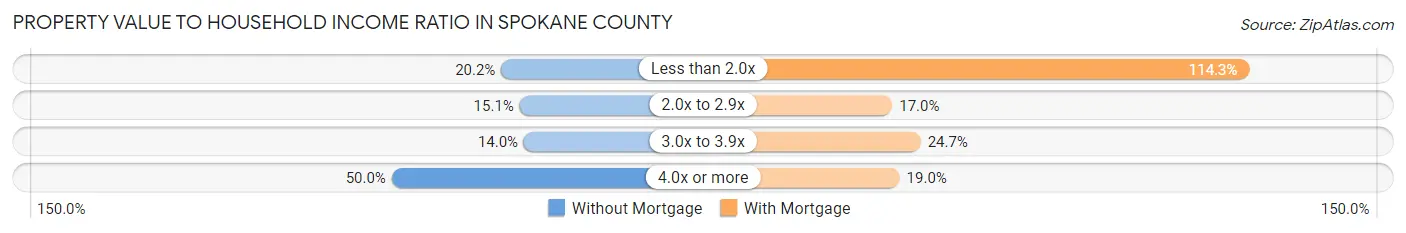
| Value-to-Income Ratio | Without Mortgage | With Mortgage |
| Less than 2.0x | 9,447 (20.2%) | 101,984 (114.3%) |
| 2.0x to 2.9x | 7,093 (15.1%) | 15,175 (17.0%) |
| 3.0x to 3.9x | 6,546 (14.0%) | 22,072 (24.7%) |
| 4.0x or more | 23,430 (50.0%) | 16,963 (19.0%) |
| Total | 46,864 (100.0%) | 89,261 (100.0%) |
Real Estate Taxes by Mortgage Status in Spokane County
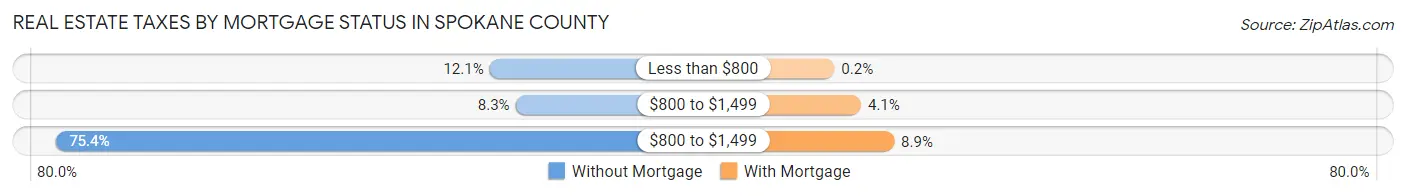
| Property Taxes | Without Mortgage | With Mortgage |
| Less than $800 | 5,656 (12.1%) | 182 (0.2%) |
| $800 to $1,499 | 3,879 (8.3%) | 3,650 (4.1%) |
| $800 to $1,499 | 35,320 (75.4%) | 7,974 (8.9%) |
| Total | 46,864 (100.0%) | 89,261 (100.0%) |
Health & Disability in Spokane County
Health Insurance Coverage by Age in Spokane County
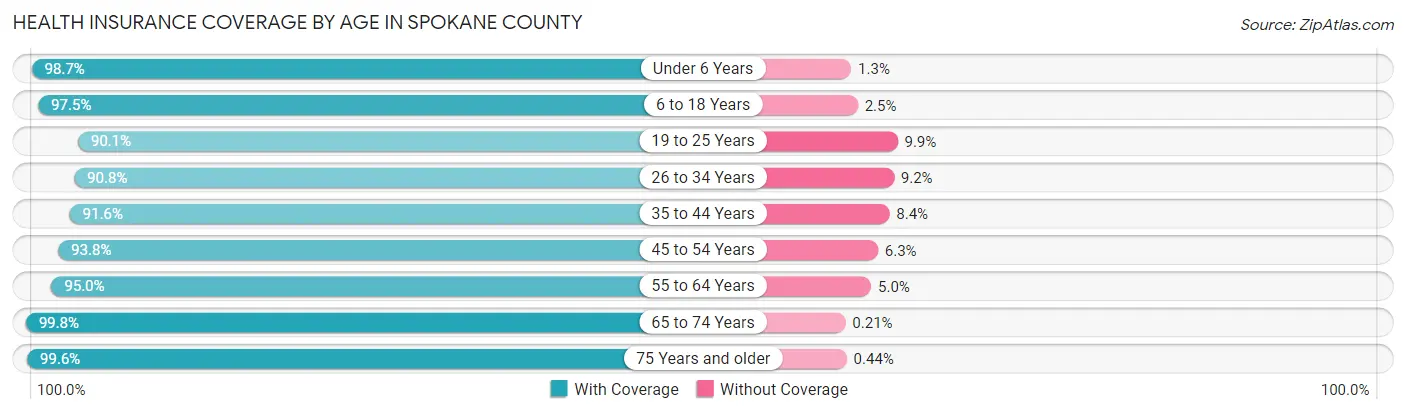
| Age Bracket | With Coverage | Without Coverage |
| Under 6 Years | 36,589 (98.7%) | 474 (1.3%) |
| 6 to 18 Years | 84,333 (97.5%) | 2,163 (2.5%) |
| 19 to 25 Years | 44,824 (90.1%) | 4,943 (9.9%) |
| 26 to 34 Years | 63,247 (90.8%) | 6,442 (9.2%) |
| 35 to 44 Years | 62,534 (91.6%) | 5,731 (8.4%) |
| 45 to 54 Years | 58,065 (93.8%) | 3,870 (6.2%) |
| 55 to 64 Years | 64,318 (95.0%) | 3,383 (5.0%) |
| 65 to 74 Years | 54,062 (99.8%) | 115 (0.2%) |
| 75 Years and older | 33,893 (99.6%) | 149 (0.4%) |
| Total | 501,865 (94.9%) | 27,270 (5.1%) |
Health Insurance Coverage by Citizenship Status in Spokane County
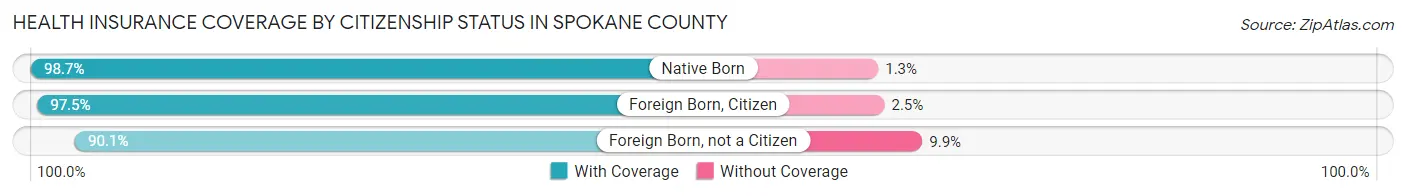
| Citizenship Status | With Coverage | Without Coverage |
| Native Born | 36,589 (98.7%) | 474 (1.3%) |
| Foreign Born, Citizen | 84,333 (97.5%) | 2,163 (2.5%) |
| Foreign Born, not a Citizen | 44,824 (90.1%) | 4,943 (9.9%) |
Health Insurance Coverage by Household Income in Spokane County
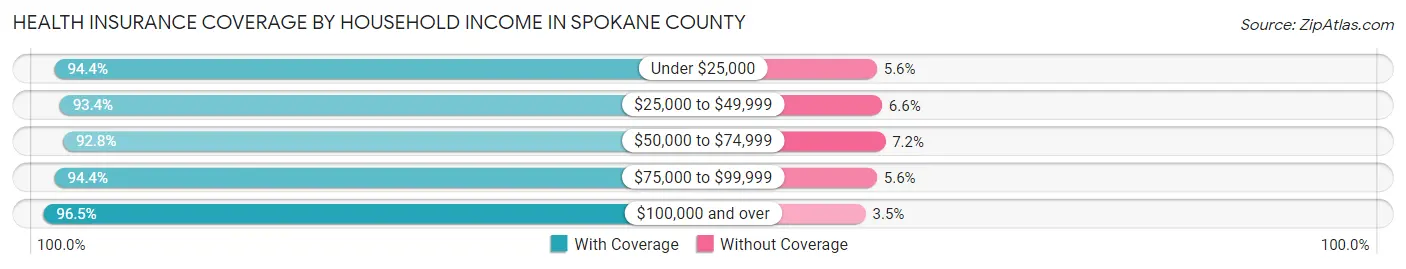
| Household Income | With Coverage | Without Coverage |
| Under $25,000 | 50,854 (94.4%) | 3,031 (5.6%) |
| $25,000 to $49,999 | 73,497 (93.4%) | 5,173 (6.6%) |
| $50,000 to $74,999 | 84,851 (92.8%) | 6,583 (7.2%) |
| $75,000 to $99,999 | 72,421 (94.4%) | 4,323 (5.6%) |
| $100,000 and over | 211,574 (96.5%) | 7,715 (3.5%) |
Public vs Private Health Insurance Coverage by Age in Spokane County
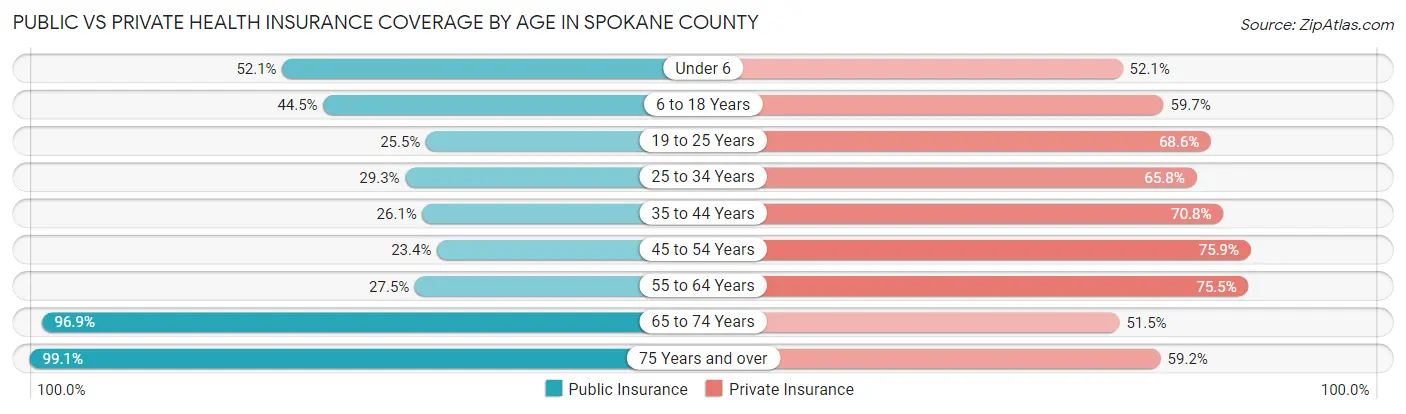
| Age Bracket | Public Insurance | Private Insurance |
| Under 6 | 19,324 (52.1%) | 19,317 (52.1%) |
| 6 to 18 Years | 38,515 (44.5%) | 51,667 (59.7%) |
| 19 to 25 Years | 12,672 (25.5%) | 34,118 (68.6%) |
| 25 to 34 Years | 20,432 (29.3%) | 45,885 (65.8%) |
| 35 to 44 Years | 17,831 (26.1%) | 48,348 (70.8%) |
| 45 to 54 Years | 14,499 (23.4%) | 47,020 (75.9%) |
| 55 to 64 Years | 18,626 (27.5%) | 51,111 (75.5%) |
| 65 to 74 Years | 52,470 (96.9%) | 27,922 (51.5%) |
| 75 Years and over | 33,722 (99.1%) | 20,149 (59.2%) |
| Total | 228,091 (43.1%) | 345,537 (65.3%) |
Disability Status by Sex by Age in Spokane County
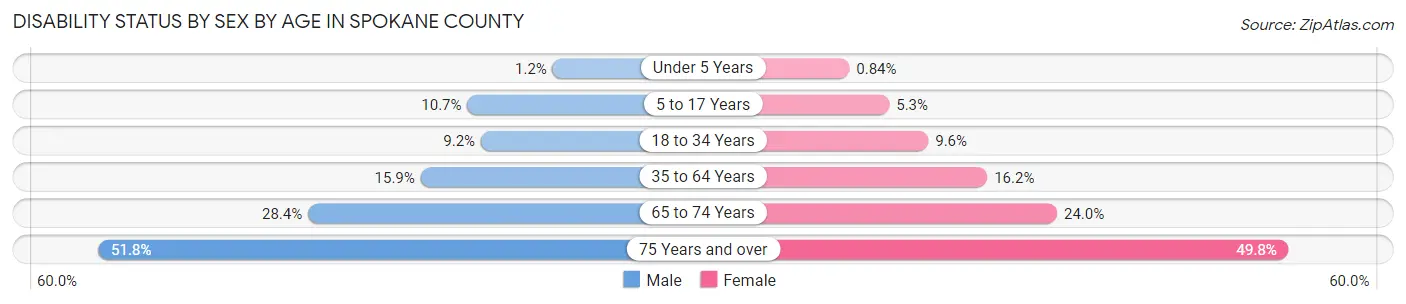
| Age Bracket | Male | Female |
| Under 5 Years | 186 (1.2%) | 127 (0.8%) |
| 5 to 17 Years | 4,728 (10.7%) | 2,214 (5.3%) |
| 18 to 34 Years | 5,847 (9.2%) | 6,037 (9.6%) |
| 35 to 64 Years | 15,655 (15.9%) | 16,109 (16.2%) |
| 65 to 74 Years | 7,308 (28.4%) | 6,825 (24.0%) |
| 75 Years and over | 7,355 (51.8%) | 9,876 (49.8%) |
Disability Class by Sex by Age in Spokane County
Disability Class: Hearing Difficulty
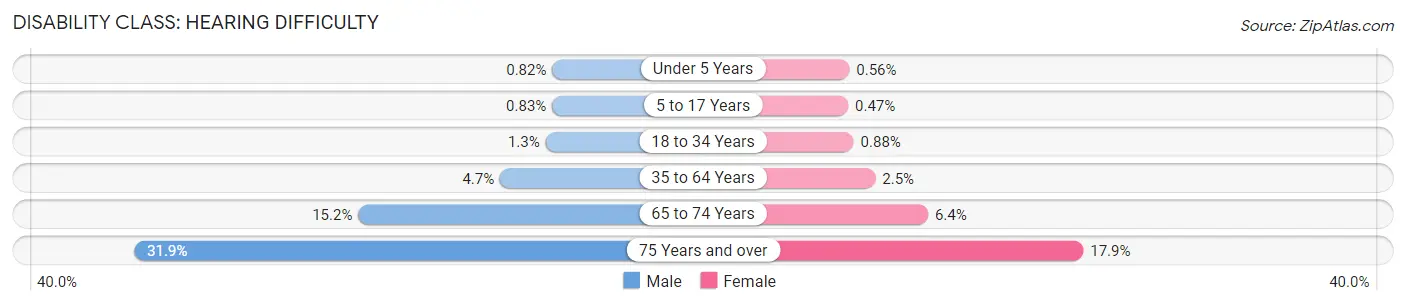
| Age Bracket | Male | Female |
| Under 5 Years | 128 (0.8%) | 84 (0.6%) |
| 5 to 17 Years | 369 (0.8%) | 196 (0.5%) |
| 18 to 34 Years | 841 (1.3%) | 551 (0.9%) |
| 35 to 64 Years | 4,631 (4.7%) | 2,472 (2.5%) |
| 65 to 74 Years | 3,915 (15.2%) | 1,822 (6.4%) |
| 75 Years and over | 4,523 (31.9%) | 3,559 (17.9%) |
Disability Class: Vision Difficulty
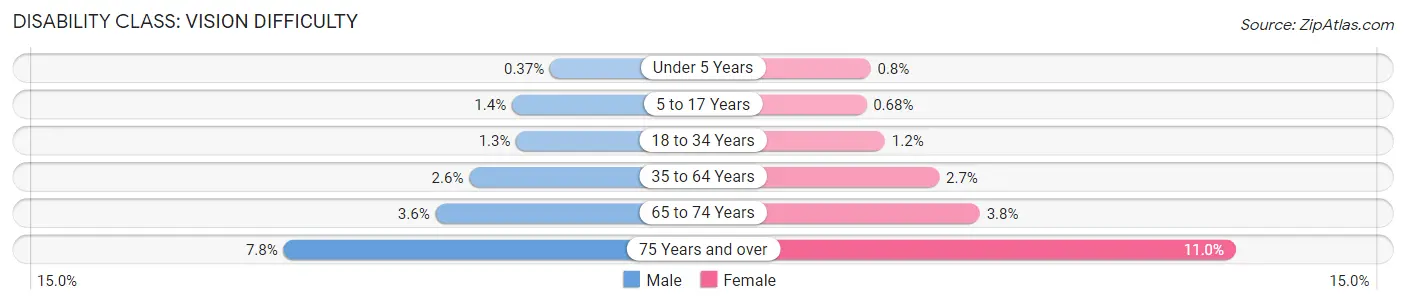
| Age Bracket | Male | Female |
| Under 5 Years | 58 (0.4%) | 120 (0.8%) |
| 5 to 17 Years | 631 (1.4%) | 283 (0.7%) |
| 18 to 34 Years | 834 (1.3%) | 753 (1.2%) |
| 35 to 64 Years | 2,579 (2.6%) | 2,695 (2.7%) |
| 65 to 74 Years | 916 (3.6%) | 1,093 (3.8%) |
| 75 Years and over | 1,106 (7.8%) | 2,177 (11.0%) |
Disability Class: Cognitive Difficulty
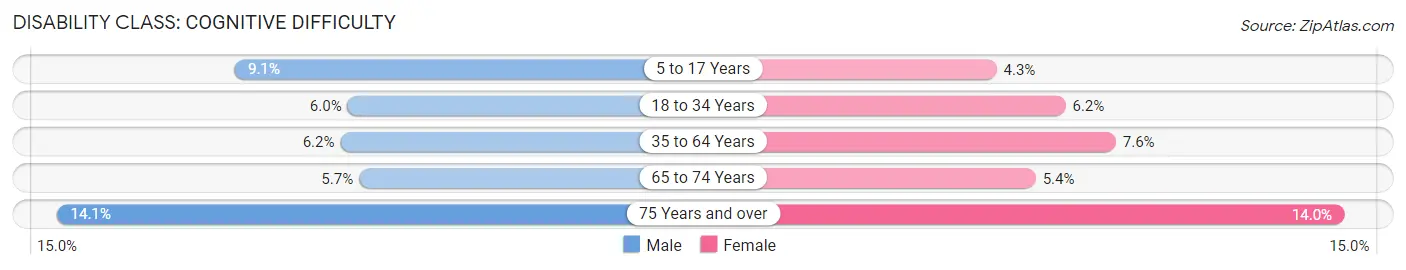
| Age Bracket | Male | Female |
| 5 to 17 Years | 4,045 (9.1%) | 1,802 (4.3%) |
| 18 to 34 Years | 3,830 (6.0%) | 3,906 (6.2%) |
| 35 to 64 Years | 6,117 (6.2%) | 7,594 (7.6%) |
| 65 to 74 Years | 1,462 (5.7%) | 1,538 (5.4%) |
| 75 Years and over | 1,998 (14.1%) | 2,775 (14.0%) |
Disability Class: Ambulatory Difficulty
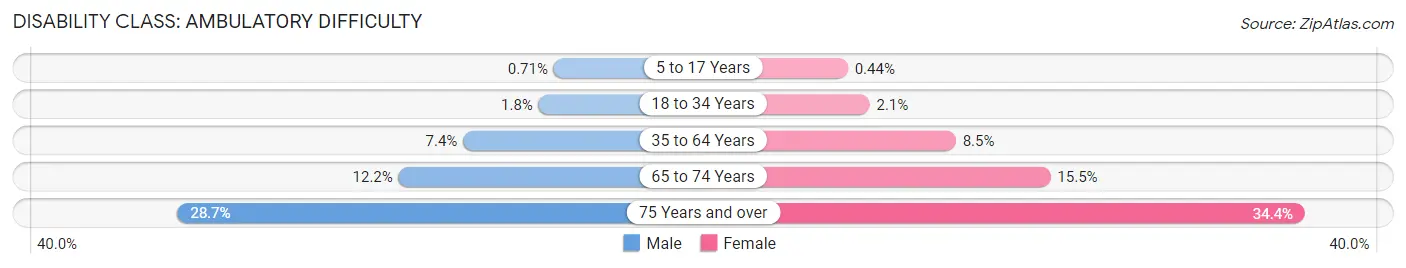
| Age Bracket | Male | Female |
| 5 to 17 Years | 313 (0.7%) | 183 (0.4%) |
| 18 to 34 Years | 1,164 (1.8%) | 1,289 (2.1%) |
| 35 to 64 Years | 7,324 (7.4%) | 8,412 (8.5%) |
| 65 to 74 Years | 3,144 (12.2%) | 4,410 (15.5%) |
| 75 Years and over | 4,068 (28.7%) | 6,824 (34.4%) |
Disability Class: Self-Care Difficulty
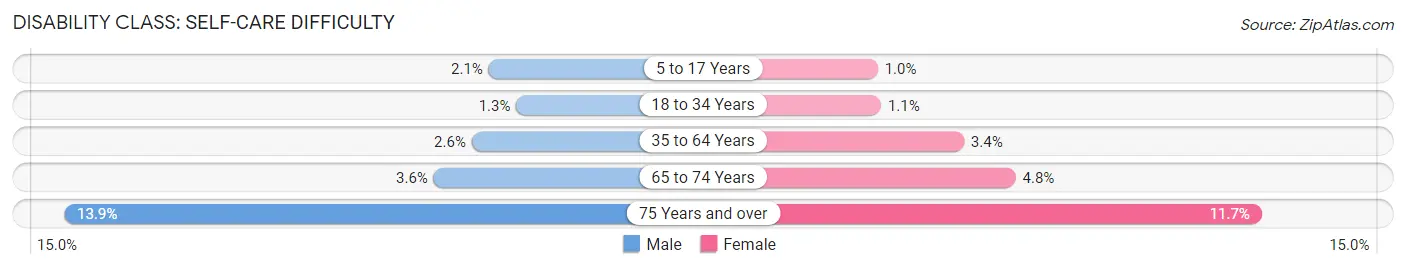
| Age Bracket | Male | Female |
| 5 to 17 Years | 919 (2.1%) | 419 (1.0%) |
| 18 to 34 Years | 834 (1.3%) | 684 (1.1%) |
| 35 to 64 Years | 2,515 (2.5%) | 3,379 (3.4%) |
| 65 to 74 Years | 927 (3.6%) | 1,378 (4.8%) |
| 75 Years and over | 1,973 (13.9%) | 2,321 (11.7%) |
Technology Access in Spokane County
Computing Device Access in Spokane County
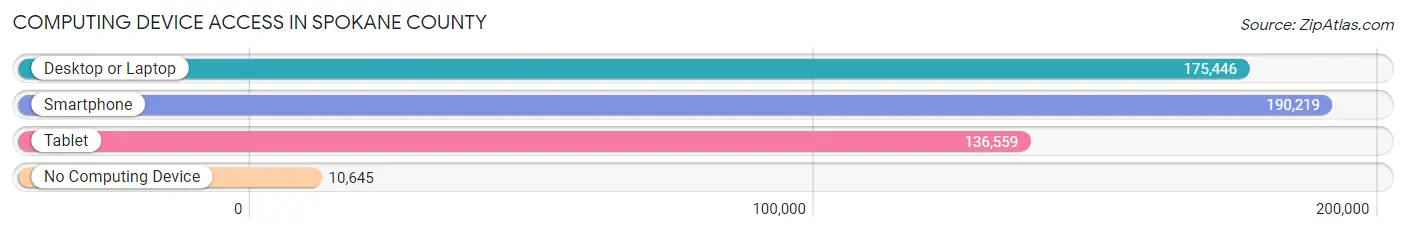
| Device Type | # Households | % Households |
| Desktop or Laptop | 175,446 | 82.2% |
| Smartphone | 190,219 | 89.1% |
| Tablet | 136,559 | 63.9% |
| No Computing Device | 10,645 | 5.0% |
| Total | 213,524 | 100.0% |
Internet Access in Spokane County
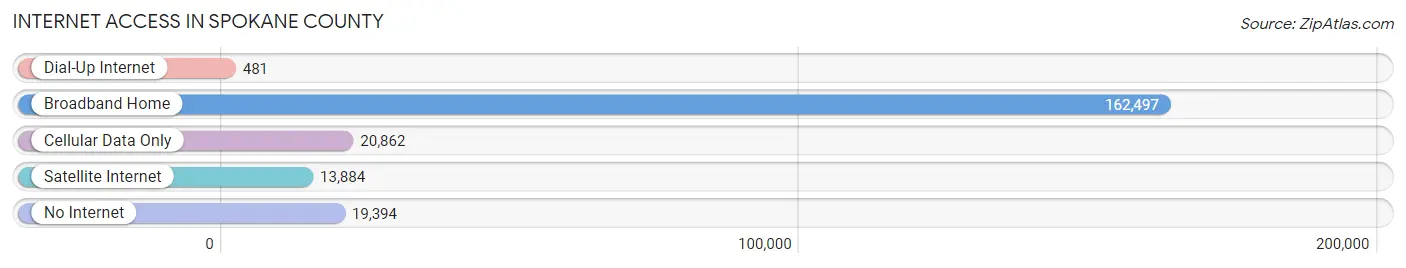
| Internet Type | # Households | % Households |
| Dial-Up Internet | 481 | 0.2% |
| Broadband Home | 162,497 | 76.1% |
| Cellular Data Only | 20,862 | 9.8% |
| Satellite Internet | 13,884 | 6.5% |
| No Internet | 19,394 | 9.1% |
| Total | 213,524 | 100.0% |
Spokane County Summary
Spokane County is located in the eastern part of Washington State, and is the second most populous county in the state. It is bordered by the Columbia River to the north, the Spokane River to the east, and the Idaho border to the east. The county seat is Spokane, the largest city in the county. Spokane County covers an area of 1,769 square miles and has a population of 498,948 as of the 2020 census.
History
The area that is now Spokane County was originally inhabited by the Spokane Tribe of Native Americans. The first European settlers arrived in the area in the late 1800s, and the county was officially established in 1858. The county was named after the Spokane River, which was named by the Native Americans for the fish that were abundant in the river.
In the late 1800s, the area experienced a population boom due to the discovery of gold and silver in the area. This led to the establishment of several mining towns, including Spokane, which was founded in 1881. The city quickly grew to become the largest city in the county, and the county seat.
In the early 1900s, Spokane County experienced a period of economic growth due to the development of the timber and railroad industries. The county also became a major agricultural center, with wheat, apples, and other crops being grown in the area.
Geography
Spokane County is located in the eastern part of Washington State, and is bordered by the Columbia River to the north, the Spokane River to the east, and the Idaho border to the east. The county covers an area of 1,769 square miles and has a population of 498,948 as of the 2020 census.
The county is mostly mountainous, with the Cascade Mountains to the west and the Rocky Mountains to the east. The Spokane River runs through the county, and there are several lakes, including Lake Coeur d'Alene, Lake Roosevelt, and Lake Spokane.
Economy
The economy of Spokane County is largely based on agriculture, manufacturing, and tourism. The county is home to several large companies, including Kaiser Aluminum, Avista Corporation, and Itron.
Agriculture is a major industry in the county, with wheat, apples, and other crops being grown in the area. The county is also home to several wineries, and is a popular destination for wine tours.
Manufacturing is also an important part of the economy, with several large companies located in the county. These include Kaiser Aluminum, Avista Corporation, and Itron.
Tourism is also a major industry in the county, with several popular attractions, including Riverfront Park, the Spokane Falls, and the Spokane Valley Mall. The county is also home to several ski resorts, including Mount Spokane and 49 Degrees North.
Demographics
As of the 2020 census, the population of Spokane County was 498,948. The population is predominantly white (86.2%), with smaller percentages of African Americans (3.2%), Asians (3.1%), and Native Americans (1.2%). The median household income is $54,845, and the median home value is $223,400. The unemployment rate is 4.2%.
Conclusion
Spokane County is located in the eastern part of Washington State, and is the second most populous county in the state. It is bordered by the Columbia River to the north, the Spokane River to the east, and the Idaho border to the east. The county covers an area of 1,769 square miles and has a population of 498,948 as of the 2020 census. The economy of the county is largely based on agriculture, manufacturing, and tourism, and the population is predominantly white.
Common Questions
What is the Total Population of Spokane County?
Total Population of Spokane County is 538,711.
What is the Total Male Population of Spokane County?
Total Male Population of Spokane County is 269,376.
What is the Total Female Population of Spokane County?
Total Female Population of Spokane County is 269,335.
What is the Ratio of Males per 100 Females in Spokane County?
There are 100.02 Males per 100 Females in Spokane County.
What is the Ratio of Females per 100 Males in Spokane County?
There are 99.98 Females per 100 Males in Spokane County.
What is the Median Population Age in Spokane County?
Median Population Age in Spokane County is 38.0 Years.
What is the Average Family Size in Spokane County
Average Family Size in Spokane County is 3.0 People.
What is the Average Household Size in Spokane County
Average Household Size in Spokane County is 2.5 People.
What is Per Capita Income in Spokane County?
Per Capita income in Spokane County is $38,052.
What is the Median Family Income in Spokane County?
Median Family Income in Spokane County is $89,846.
What is the Median Household income in Spokane County?
Median Household Income in Spokane County is $70,394.
What is Income or Wage Gap in Spokane County?
Income or Wage Gap in Spokane County is 25.1%.
Women in Spokane County earn 74.9 cents for every dollar earned by a man.
What is Family Income Deficit in Spokane County?
Family Income Deficit in Spokane County is $11,310.
Families that are below poverty line in Spokane County earn $11,310 less on average than the poverty threshold level.
What is Inequality or Gini Index in Spokane County?
Inequality or Gini Index in Spokane County is 0.45.
How Large is the Labor Force in Spokane County?
There are 268,012 People in the Labor Forcein in Spokane County.
What is the Percentage of People in the Labor Force in Spokane County?
61.7% of People are in the Labor Force in Spokane County.
What is the Unemployment Rate in Spokane County?
Unemployment Rate in Spokane County is 5.8%.