Okanogan County, WA
Okanogan County Map
Okanogan County Overview
42,336
TOTAL POPULATION
21,632
MALE POPULATION
20,704
FEMALE POPULATION
104.48
MALES / 100 FEMALES
95.71
FEMALES / 100 MALES
42.9
MEDIAN AGE
2.8
AVG FAMILY SIZE
2.4
AVG HOUSEHOLD SIZE
$29,777
PER CAPITA INCOME
$68,585
AVG FAMILY INCOME
$58,218
AVG HOUSEHOLD INCOME
18.7%
WAGE / INCOME GAP [ % ]
81.3¢/ $1
WAGE / INCOME GAP [ $ ]
$10,359
FAMILY INCOME DEFICIT
0.42
INEQUALITY / GINI INDEX
18,982
LABOR FORCE [ PEOPLE ]
56.3%
PERCENT IN LABOR FORCE
5.8%
UNEMPLOYMENT RATE
Okanogan County Area Codes
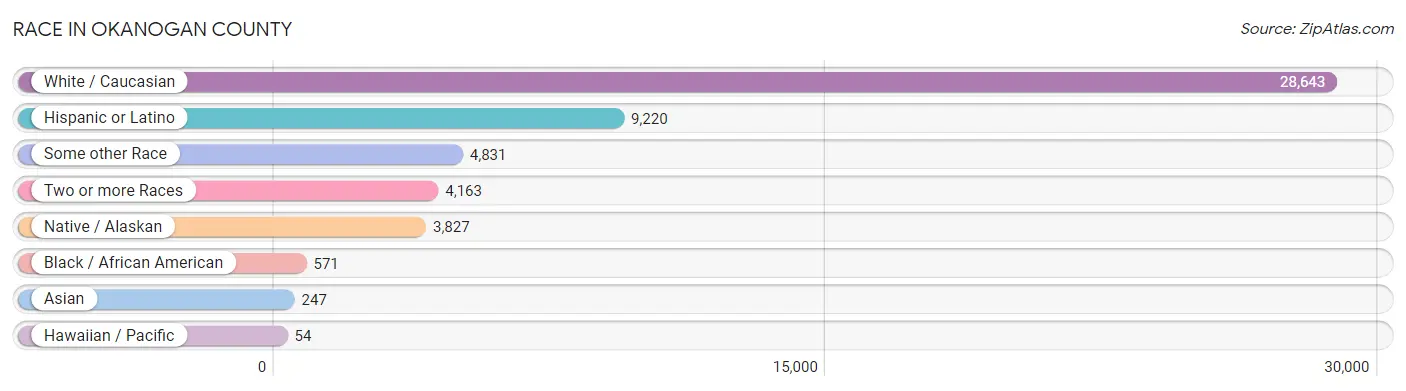
Race in Okanogan County
The most populous races in Okanogan County are White / Caucasian (28,643 | 67.7%), Hispanic or Latino (9,220 | 21.8%), and Some other Race (4,831 | 11.4%).
| Race | # Population | % Population |
| Asian | 247 | 0.6% |
| Black / African American | 571 | 1.3% |
| Hawaiian / Pacific | 54 | 0.1% |
| Hispanic or Latino | 9,220 | 21.8% |
| Native / Alaskan | 3,827 | 9.0% |
| White / Caucasian | 28,643 | 67.7% |
| Two or more Races | 4,163 | 9.8% |
| Some other Race | 4,831 | 11.4% |
| Total | 42,336 | 100.0% |
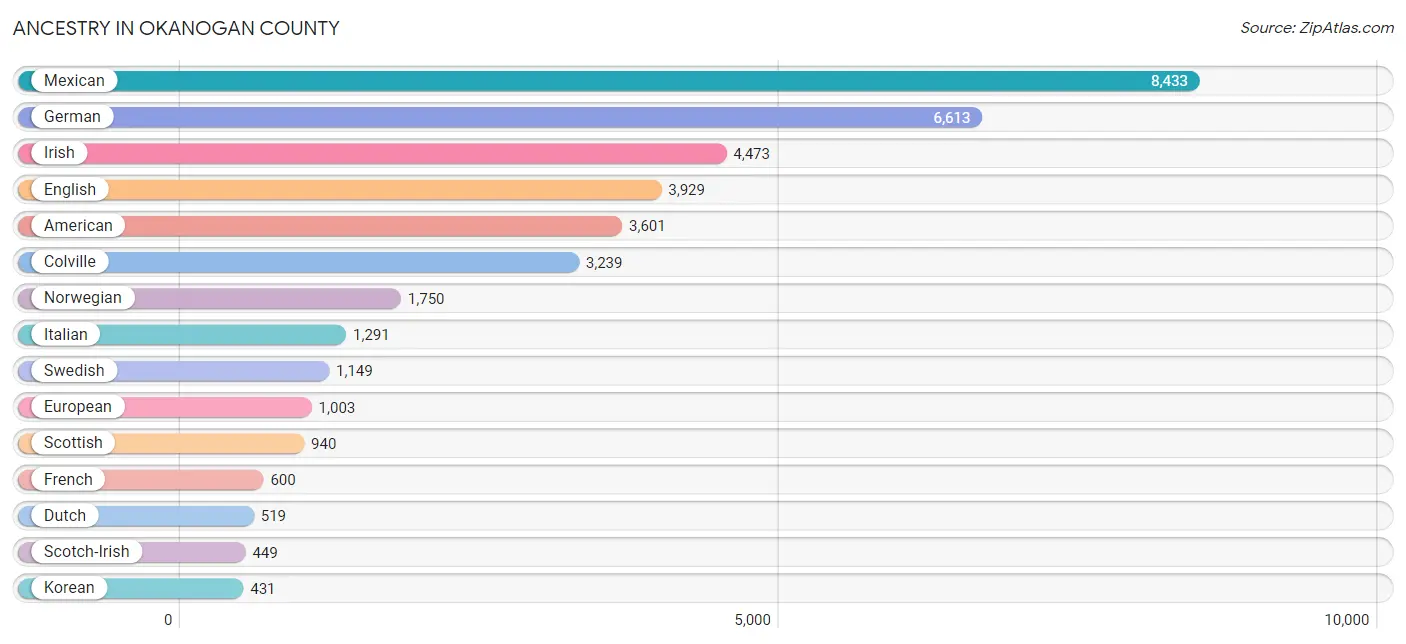
Ancestry in Okanogan County
The most populous ancestries reported in Okanogan County are Mexican (8,433 | 19.9%), German (6,613 | 15.6%), Irish (4,473 | 10.6%), English (3,929 | 9.3%), and American (3,601 | 8.5%), together accounting for 63.9% of all Okanogan County residents.
| Ancestry | # Population | % Population |
| African | 17 | 0.0% |
| Alaska Native | 35 | 0.1% |
| Alaskan Athabascan | 3 | 0.0% |
| Aleut | 17 | 0.0% |
| American | 3,601 | 8.5% |
| Apache | 128 | 0.3% |
| Arab | 75 | 0.2% |
| Austrian | 44 | 0.1% |
| Basque | 145 | 0.3% |
| Bhutanese | 124 | 0.3% |
| Blackfeet | 48 | 0.1% |
| British | 274 | 0.6% |
| Burmese | 68 | 0.2% |
| Cajun | 22 | 0.1% |
| Canadian | 85 | 0.2% |
| Celtic | 41 | 0.1% |
| Central American | 316 | 0.7% |
| Cherokee | 197 | 0.5% |
| Cheyenne | 14 | 0.0% |
| Chickasaw | 5 | 0.0% |
| Chilean | 4 | 0.0% |
| Chippewa | 15 | 0.0% |
| Choctaw | 19 | 0.0% |
| Colombian | 30 | 0.1% |
| Colville | 3,239 | 7.6% |
| Costa Rican | 27 | 0.1% |
| Creek | 2 | 0.0% |
| Croatian | 73 | 0.2% |
| Cuban | 10 | 0.0% |
| Czech | 31 | 0.1% |
| Czechoslovakian | 21 | 0.1% |
| Danish | 195 | 0.5% |
| Delaware | 23 | 0.1% |
| Dutch | 519 | 1.2% |
| Eastern European | 95 | 0.2% |
| English | 3,929 | 9.3% |
| European | 1,003 | 2.4% |
| Finnish | 78 | 0.2% |
| French | 600 | 1.4% |
| French American Indian | 52 | 0.1% |
| French Canadian | 300 | 0.7% |
| German | 6,613 | 15.6% |
| Greek | 99 | 0.2% |
| Guamanian / Chamorro | 6 | 0.0% |
| Guatemalan | 59 | 0.1% |
| Hungarian | 60 | 0.1% |
| Icelander | 16 | 0.0% |
| Indian (Asian) | 8 | 0.0% |
| Inupiat | 3 | 0.0% |
| Irish | 4,473 | 10.6% |
| Italian | 1,291 | 3.0% |
| Jamaican | 413 | 1.0% |
| Korean | 431 | 1.0% |
| Laotian | 16 | 0.0% |
| Lebanese | 48 | 0.1% |
| Malaysian | 9 | 0.0% |
| Mexican | 8,433 | 19.9% |
| Mexican American Indian | 139 | 0.3% |
| Native Hawaiian | 162 | 0.4% |
| Navajo | 15 | 0.0% |
| Northern European | 155 | 0.4% |
| Norwegian | 1,750 | 4.1% |
| Osage | 1 | 0.0% |
| Paiute | 10 | 0.0% |
| Pakistani | 30 | 0.1% |
| Pennsylvania German | 2 | 0.0% |
| Polish | 267 | 0.6% |
| Portuguese | 83 | 0.2% |
| Pueblo | 2 | 0.0% |
| Puerto Rican | 178 | 0.4% |
| Puget Sound Salish | 89 | 0.2% |
| Romanian | 14 | 0.0% |
| Russian | 118 | 0.3% |
| Salvadoran | 230 | 0.5% |
| Scandinavian | 359 | 0.9% |
| Scotch-Irish | 449 | 1.1% |
| Scottish | 940 | 2.2% |
| Seminole | 4 | 0.0% |
| Sioux | 120 | 0.3% |
| Slovak | 18 | 0.0% |
| Slovene | 43 | 0.1% |
| South African | 10 | 0.0% |
| South American | 45 | 0.1% |
| Spanish | 190 | 0.4% |
| Sri Lankan | 7 | 0.0% |
| Subsaharan African | 49 | 0.1% |
| Swedish | 1,149 | 2.7% |
| Swiss | 177 | 0.4% |
| Tlingit-Haida | 83 | 0.2% |
| Tongan | 17 | 0.0% |
| Turkish | 8 | 0.0% |
| Ukrainian | 34 | 0.1% |
| Ute | 120 | 0.3% |
| Venezuelan | 11 | 0.0% |
| Welsh | 273 | 0.6% |
| Yakama | 153 | 0.4% |
| Yaqui | 30 | 0.1% |
| Yugoslavian | 105 | 0.3% |
| Yup'ik | 34 | 0.1% | View All 99 Rows |
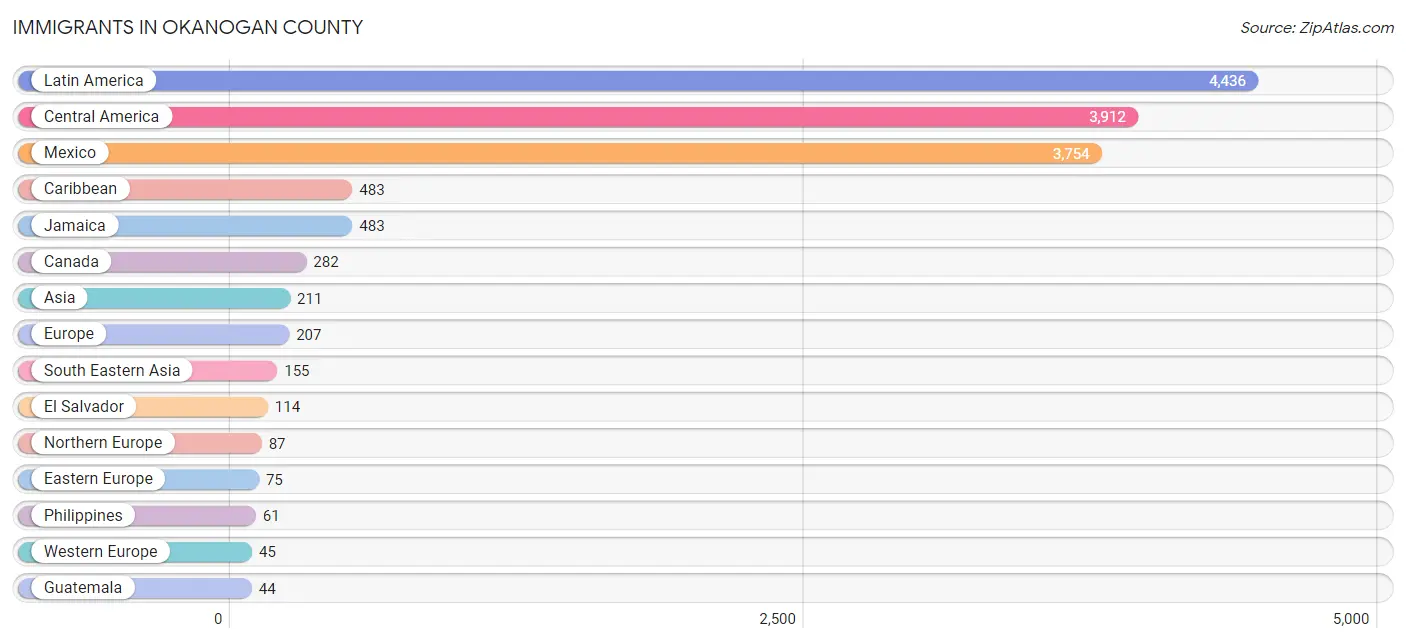
Immigrants in Okanogan County
The most numerous immigrant groups reported in Okanogan County came from Latin America (4,436 | 10.5%), Central America (3,912 | 9.2%), Mexico (3,754 | 8.9%), Caribbean (483 | 1.1%), and Jamaica (483 | 1.1%), together accounting for 30.9% of all Okanogan County residents.
| Immigration Origin | # Population | % Population |
| Africa | 32 | 0.1% |
| Asia | 211 | 0.5% |
| Australia | 9 | 0.0% |
| Canada | 282 | 0.7% |
| Caribbean | 483 | 1.1% |
| Central America | 3,912 | 9.2% |
| Colombia | 30 | 0.1% |
| Czechoslovakia | 25 | 0.1% |
| Eastern Africa | 27 | 0.1% |
| Eastern Asia | 26 | 0.1% |
| Eastern Europe | 75 | 0.2% |
| El Salvador | 114 | 0.3% |
| England | 27 | 0.1% |
| Europe | 207 | 0.5% |
| Germany | 34 | 0.1% |
| Guatemala | 44 | 0.1% |
| Hungary | 10 | 0.0% |
| Indonesia | 16 | 0.0% |
| Iran | 26 | 0.1% |
| Jamaica | 483 | 1.1% |
| Japan | 9 | 0.0% |
| Kenya | 27 | 0.1% |
| Korea | 17 | 0.0% |
| Latin America | 4,436 | 10.5% |
| Mexico | 3,754 | 8.9% |
| Morocco | 5 | 0.0% |
| Northern Africa | 5 | 0.0% |
| Northern Europe | 87 | 0.2% |
| Oceania | 9 | 0.0% |
| Philippines | 61 | 0.1% |
| Romania | 2 | 0.0% |
| Russia | 38 | 0.1% |
| South America | 41 | 0.1% |
| South Central Asia | 30 | 0.1% |
| South Eastern Asia | 155 | 0.4% |
| Sweden | 17 | 0.0% |
| Switzerland | 11 | 0.0% |
| Thailand | 38 | 0.1% |
| Venezuela | 11 | 0.0% |
| Vietnam | 18 | 0.0% |
| Western Europe | 45 | 0.1% | View All 41 Rows |
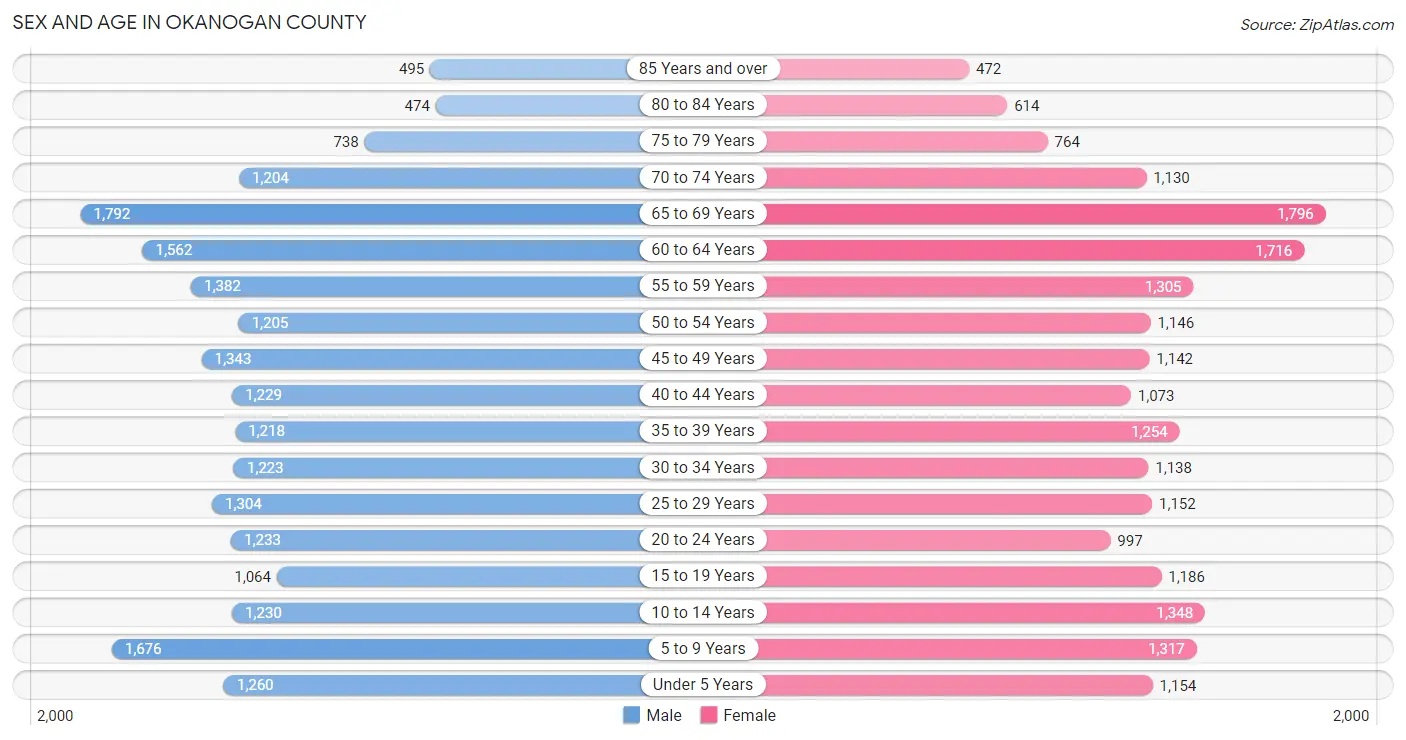
Sex and Age in Okanogan County
Sex and Age in Okanogan County
The most populous age groups in Okanogan County are 65 to 69 Years (1,792 | 8.3%) for men and 65 to 69 Years (1,796 | 8.7%) for women.
| Age Bracket | Male | Female |
| Under 5 Years | 1,260 (5.8%) | 1,154 (5.6%) |
| 5 to 9 Years | 1,676 (7.7%) | 1,317 (6.4%) |
| 10 to 14 Years | 1,230 (5.7%) | 1,348 (6.5%) |
| 15 to 19 Years | 1,064 (4.9%) | 1,186 (5.7%) |
| 20 to 24 Years | 1,233 (5.7%) | 997 (4.8%) |
| 25 to 29 Years | 1,304 (6.0%) | 1,152 (5.6%) |
| 30 to 34 Years | 1,223 (5.7%) | 1,138 (5.5%) |
| 35 to 39 Years | 1,218 (5.6%) | 1,254 (6.1%) |
| 40 to 44 Years | 1,229 (5.7%) | 1,073 (5.2%) |
| 45 to 49 Years | 1,343 (6.2%) | 1,142 (5.5%) |
| 50 to 54 Years | 1,205 (5.6%) | 1,146 (5.5%) |
| 55 to 59 Years | 1,382 (6.4%) | 1,305 (6.3%) |
| 60 to 64 Years | 1,562 (7.2%) | 1,716 (8.3%) |
| 65 to 69 Years | 1,792 (8.3%) | 1,796 (8.7%) |
| 70 to 74 Years | 1,204 (5.6%) | 1,130 (5.5%) |
| 75 to 79 Years | 738 (3.4%) | 764 (3.7%) |
| 80 to 84 Years | 474 (2.2%) | 614 (3.0%) |
| 85 Years and over | 495 (2.3%) | 472 (2.3%) |
| Total | 21,632 (100.0%) | 20,704 (100.0%) |
Families and Households in Okanogan County
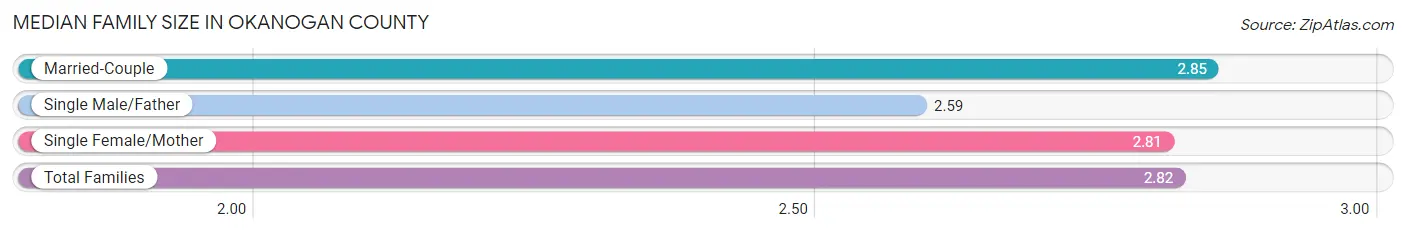
Median Family Size in Okanogan County
The median family size in Okanogan County is 2.82 persons per family, with married-couple families (8,538 | 74.3%) accounting for the largest median family size of 2.85 persons per family. On the other hand, single male/father families (1,016 | 8.8%) represent the smallest median family size with 2.59 persons per family.
| Family Type | # Families | Family Size |
| Married-Couple | 8,538 (74.3%) | 2.85 |
| Single Male/Father | 1,016 (8.8%) | 2.59 |
| Single Female/Mother | 1,932 (16.8%) | 2.81 |
| Total Families | 11,486 (100.0%) | 2.82 |
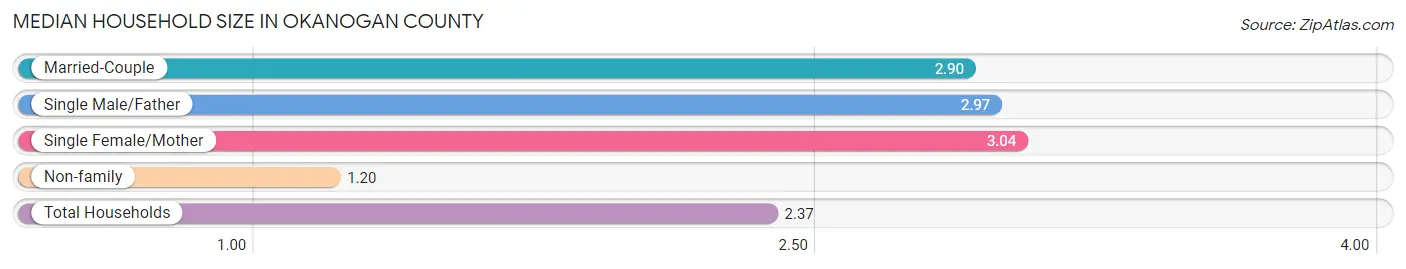
Median Household Size in Okanogan County
The median household size in Okanogan County is 2.37 persons per household, with single female/mother households (1,932 | 11.4%) accounting for the largest median household size of 3.04 persons per household. non-family households (5,519 | 32.5%) represent the smallest median household size with 1.20 persons per household.
| Household Type | # Households | Household Size |
| Married-Couple | 8,538 (50.2%) | 2.90 |
| Single Male/Father | 1,016 (6.0%) | 2.97 |
| Single Female/Mother | 1,932 (11.4%) | 3.04 |
| Non-family | 5,519 (32.5%) | 1.20 |
| Total Households | 17,005 (100.0%) | 2.37 |
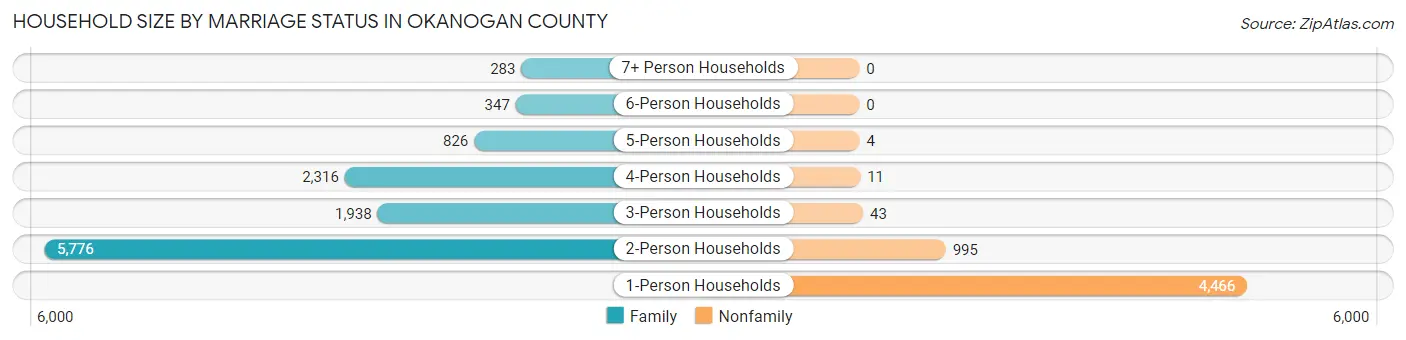
Household Size by Marriage Status in Okanogan County
Out of a total of 17,005 households in Okanogan County, 11,486 (67.5%) are family households, while 5,519 (32.5%) are nonfamily households. The most numerous type of family households are 2-person households, comprising 5,776, and the most common type of nonfamily households are 1-person households, comprising 4,466.
| Household Size | Family Households | Nonfamily Households |
| 1-Person Households | - | 4,466 (26.3%) |
| 2-Person Households | 5,776 (34.0%) | 995 (5.9%) |
| 3-Person Households | 1,938 (11.4%) | 43 (0.3%) |
| 4-Person Households | 2,316 (13.6%) | 11 (0.1%) |
| 5-Person Households | 826 (4.9%) | 4 (0.0%) |
| 6-Person Households | 347 (2.0%) | 0 (0.0%) |
| 7+ Person Households | 283 (1.7%) | 0 (0.0%) |
| Total | 11,486 (67.5%) | 5,519 (32.5%) |
Female Fertility in Okanogan County
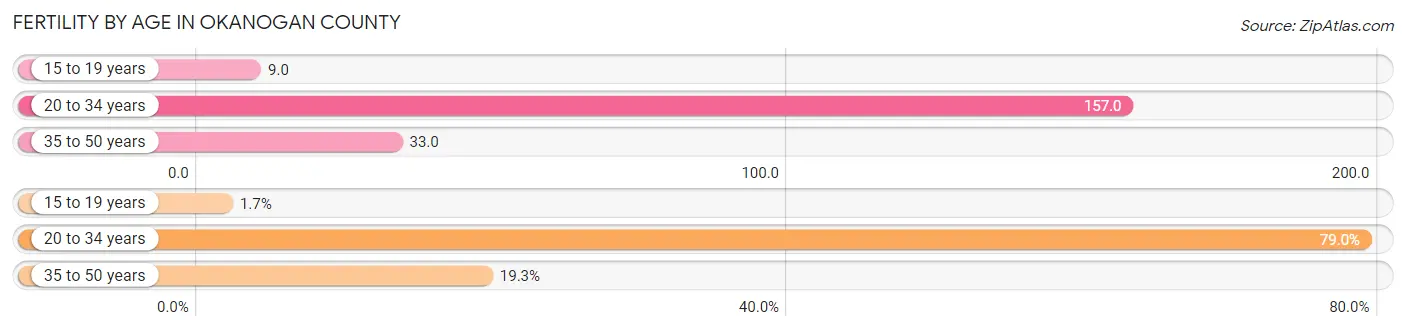
Fertility by Age in Okanogan County
Average fertility rate in Okanogan County is 79.0 births per 1,000 women. Women in the age bracket of 20 to 34 years have the highest fertility rate with 157.0 births per 1,000 women. Women in the age bracket of 20 to 34 years acount for 79.0% of all women with births.
| Age Bracket | Women with Births | Births / 1,000 Women |
| 15 to 19 years | 11 (1.7%) | 9.0 |
| 20 to 34 years | 515 (79.0%) | 157.0 |
| 35 to 50 years | 126 (19.3%) | 33.0 |
| Total | 652 (100.0%) | 79.0 |
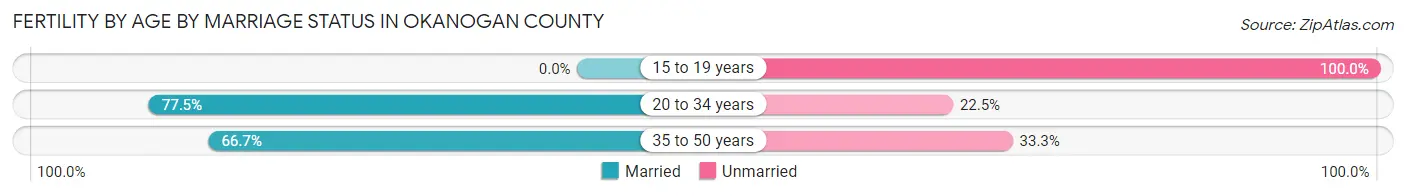
Fertility by Age by Marriage Status in Okanogan County
74.1% of women with births (652) in Okanogan County are married. The highest percentage of unmarried women with births falls into 15 to 19 years age bracket with 100.0% of them unmarried at the time of birth, while the lowest percentage of unmarried women with births belong to 20 to 34 years age bracket with 22.5% of them unmarried.
| Age Bracket | Married | Unmarried |
| 15 to 19 years | 0 (0.0%) | 11 (100.0%) |
| 20 to 34 years | 399 (77.5%) | 116 (22.5%) |
| 35 to 50 years | 84 (66.7%) | 42 (33.3%) |
| Total | 483 (74.1%) | 169 (25.9%) |
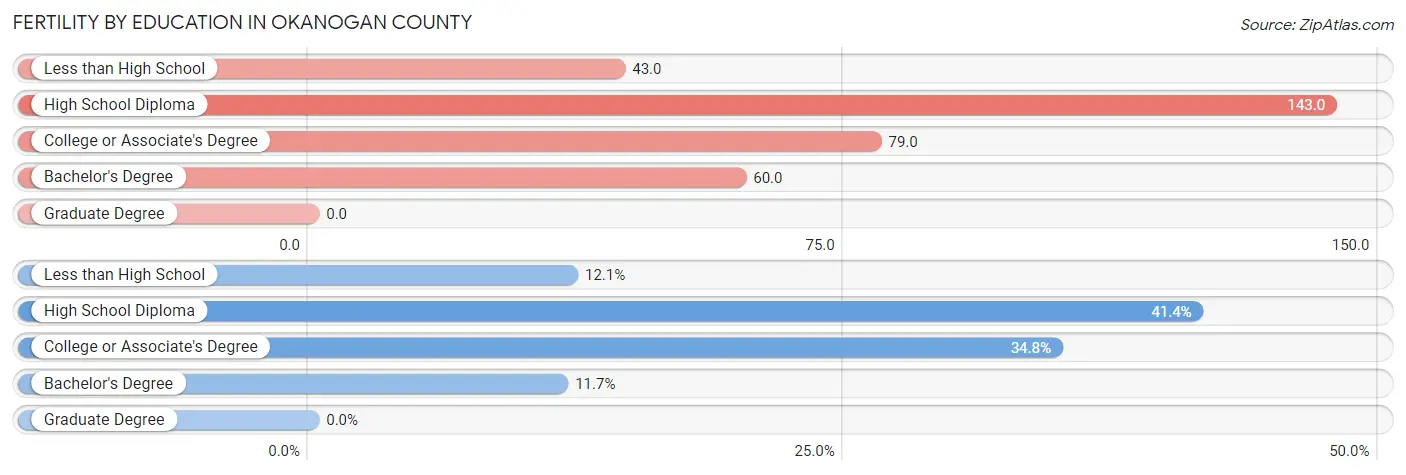
Fertility by Education in Okanogan County
| Educational Attainment | Women with Births | Births / 1,000 Women |
| Less than High School | 79 (12.1%) | 43.0 |
| High School Diploma | 270 (41.4%) | 143.0 |
| College or Associate's Degree | 227 (34.8%) | 79.0 |
| Bachelor's Degree | 76 (11.7%) | 60.0 |
| Graduate Degree | 0 (0.0%) | 0.0 |
| Total | 652 (100.0%) | 79.0 |
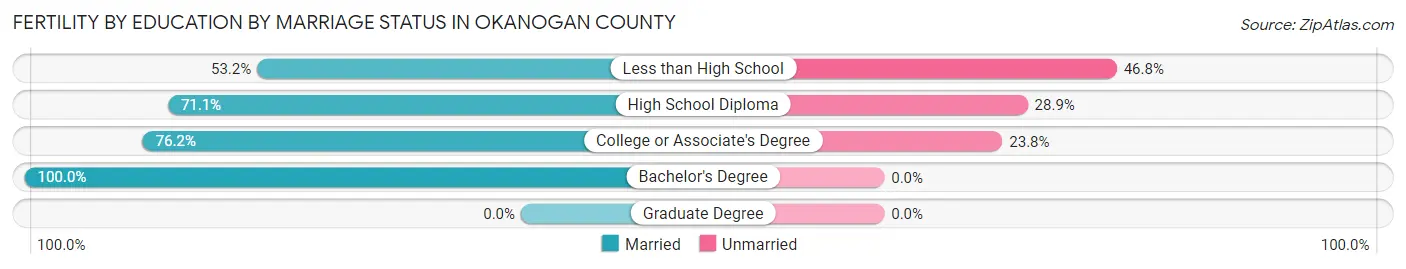
Fertility by Education by Marriage Status in Okanogan County
25.9% of women with births in Okanogan County are unmarried. Women with the educational attainment of bachelor's degree are most likely to be married with 100.0% of them married at childbirth, while women with the educational attainment of less than high school are least likely to be married with 46.8% of them unmarried at childbirth.
| Educational Attainment | Married | Unmarried |
| Less than High School | 42 (53.2%) | 37 (46.8%) |
| High School Diploma | 192 (71.1%) | 78 (28.9%) |
| College or Associate's Degree | 173 (76.2%) | 54 (23.8%) |
| Bachelor's Degree | 76 (100.0%) | 0 (0.0%) |
| Graduate Degree | 0 (0.0%) | 0 (0.0%) |
| Total | 483 (74.1%) | 169 (25.9%) |
Income in Okanogan County
Income Overview in Okanogan County
Per Capita Income in Okanogan County is $29,777, while median incomes of families and households are $68,585 and $58,218 respectively.
| Characteristic | Number | Measure |
| Per Capita Income | 42,336 | $29,777 |
| Median Family Income | 11,486 | $68,585 |
| Mean Family Income | 11,486 | $84,355 |
| Median Household Income | 17,005 | $58,218 |
| Mean Household Income | 17,005 | $73,238 |
| Income Deficit | 11,486 | $10,359 |
| Wage / Income Gap (%) | 42,336 | 18.72% |
| Wage / Income Gap ($) | 42,336 | 81.28¢ per $1 |
| Gini / Inequality Index | 42,336 | 0.42 |
Earnings by Sex in Okanogan County
Average Earnings in Okanogan County are $34,627, $37,089 for men and $30,146 for women, a difference of 18.7%.
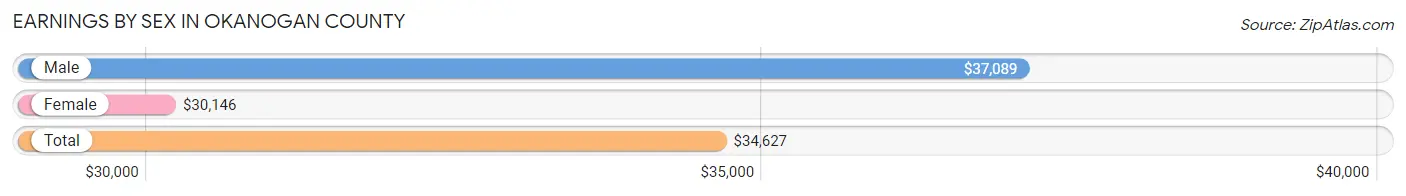
| Sex | Number | Average Earnings |
| Male | 11,032 (54.0%) | $37,089 |
| Female | 9,392 (46.0%) | $30,146 |
| Total | 20,424 (100.0%) | $34,627 |
Earnings by Sex by Income Bracket in Okanogan County
The most common earnings brackets in Okanogan County are $100,000+ for men (1,052 | 9.5%) and $25,000 to $29,999 for women (1,081 | 11.5%).
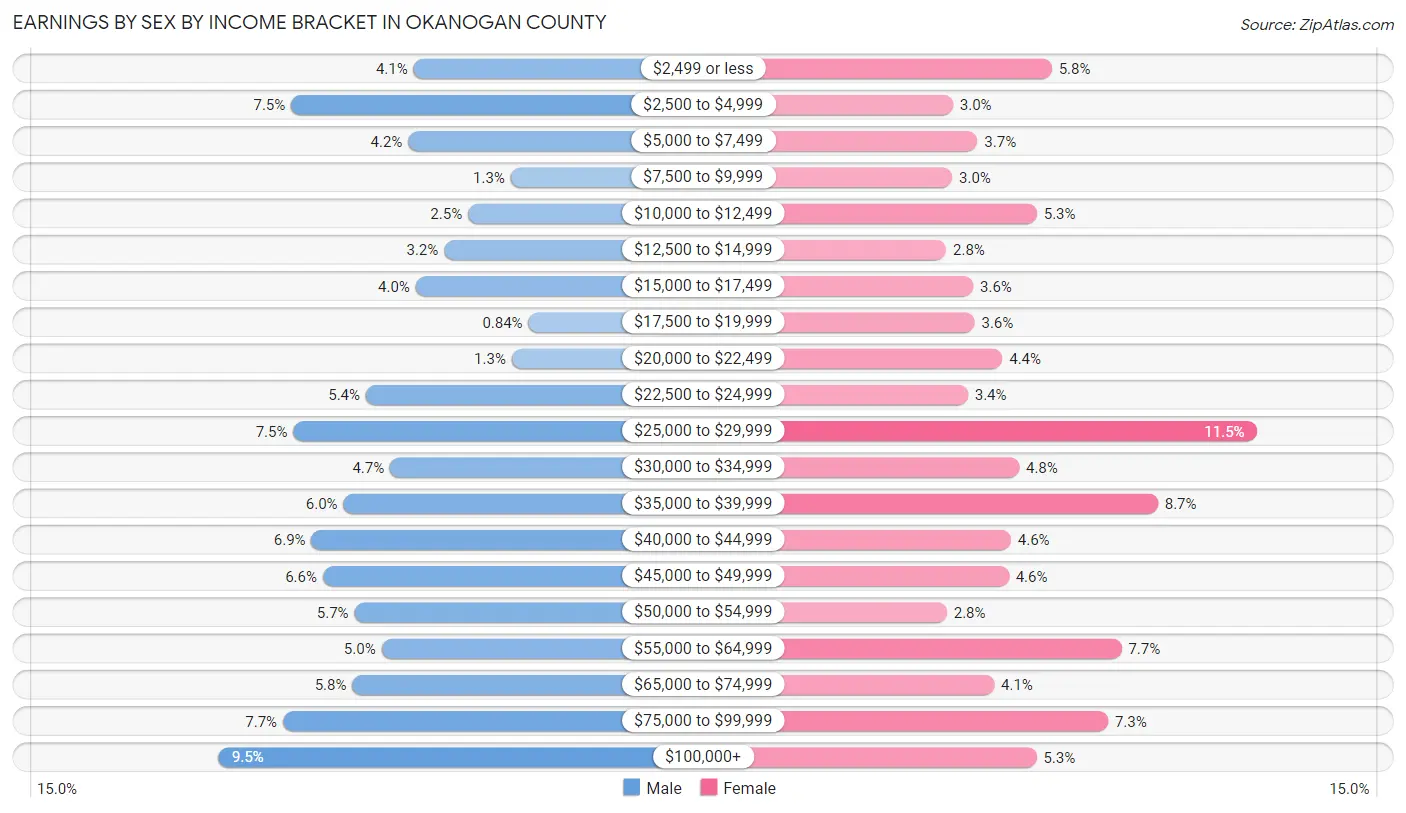
| Income | Male | Female |
| $2,499 or less | 449 (4.1%) | 541 (5.8%) |
| $2,500 to $4,999 | 829 (7.5%) | 280 (3.0%) |
| $5,000 to $7,499 | 465 (4.2%) | 345 (3.7%) |
| $7,500 to $9,999 | 148 (1.3%) | 278 (3.0%) |
| $10,000 to $12,499 | 280 (2.5%) | 502 (5.3%) |
| $12,500 to $14,999 | 354 (3.2%) | 262 (2.8%) |
| $15,000 to $17,499 | 442 (4.0%) | 333 (3.5%) |
| $17,500 to $19,999 | 93 (0.8%) | 337 (3.6%) |
| $20,000 to $22,499 | 144 (1.3%) | 410 (4.4%) |
| $22,500 to $24,999 | 597 (5.4%) | 319 (3.4%) |
| $25,000 to $29,999 | 822 (7.4%) | 1,081 (11.5%) |
| $30,000 to $34,999 | 522 (4.7%) | 455 (4.8%) |
| $35,000 to $39,999 | 666 (6.0%) | 821 (8.7%) |
| $40,000 to $44,999 | 766 (6.9%) | 433 (4.6%) |
| $45,000 to $49,999 | 730 (6.6%) | 427 (4.5%) |
| $50,000 to $54,999 | 632 (5.7%) | 264 (2.8%) |
| $55,000 to $64,999 | 548 (5.0%) | 725 (7.7%) |
| $65,000 to $74,999 | 639 (5.8%) | 389 (4.1%) |
| $75,000 to $99,999 | 854 (7.7%) | 689 (7.3%) |
| $100,000+ | 1,052 (9.5%) | 501 (5.3%) |
| Total | 11,032 (100.0%) | 9,392 (100.0%) |
Earnings by Sex by Educational Attainment in Okanogan County
Average earnings in Okanogan County are $42,634 for men and $35,245 for women, a difference of 17.3%. Men with an educational attainment of graduate degree enjoy the highest average annual earnings of $73,750, while those with less than high school education earn the least with $30,596. Women with an educational attainment of graduate degree earn the most with the average annual earnings of $64,091, while those with less than high school education have the smallest earnings of $23,389.
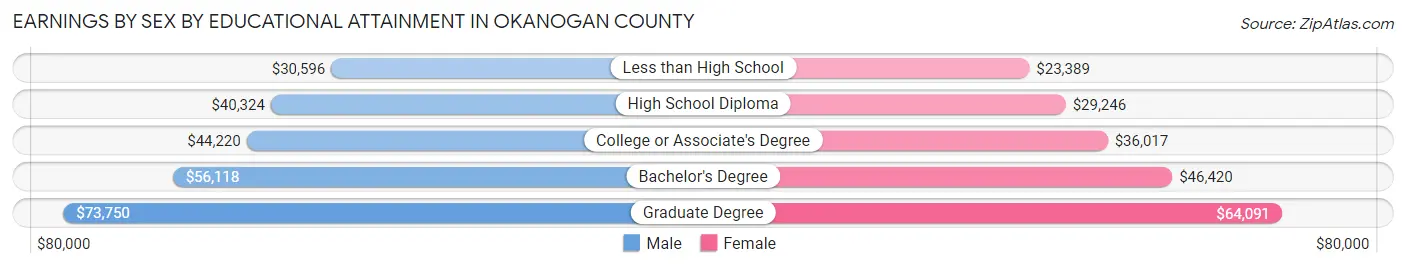
| Educational Attainment | Male Income | Female Income |
| Less than High School | $30,596 | $23,389 |
| High School Diploma | $40,324 | $29,246 |
| College or Associate's Degree | $44,220 | $36,017 |
| Bachelor's Degree | $56,118 | $46,420 |
| Graduate Degree | $73,750 | $64,091 |
| Total | $42,634 | $35,245 |
Family Income in Okanogan County
Family Income Brackets in Okanogan County
According to the Okanogan County family income data, there are 2,171 families falling into the $50,000 to $74,999 income range, which is the most common income bracket and makes up 18.9% of all families. Conversely, the $10,000 to $14,999 income bracket is the least frequent group with only 322 families (2.8%) belonging to this category.
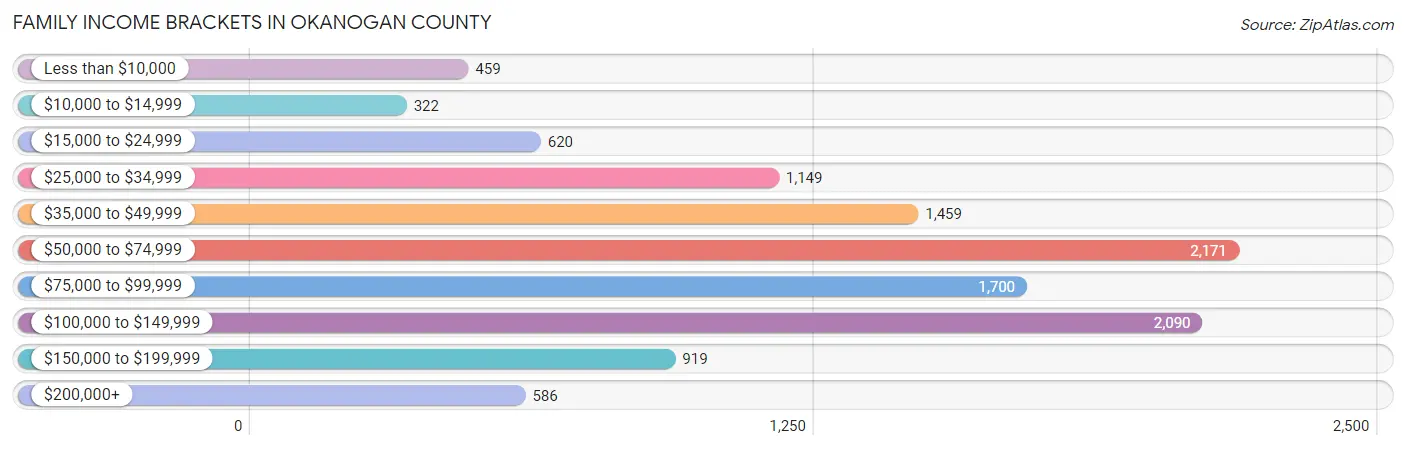
| Income Bracket | # Families | % Families |
| Less than $10,000 | 459 | 4.0% |
| $10,000 to $14,999 | 322 | 2.8% |
| $15,000 to $24,999 | 620 | 5.4% |
| $25,000 to $34,999 | 1,149 | 10.0% |
| $35,000 to $49,999 | 1,459 | 12.7% |
| $50,000 to $74,999 | 2,171 | 18.9% |
| $75,000 to $99,999 | 1,700 | 14.8% |
| $100,000 to $149,999 | 2,090 | 18.2% |
| $150,000 to $199,999 | 919 | 8.0% |
| $200,000+ | 586 | 5.1% |
Family Income by Famaliy Size in Okanogan County
4-person families (2,140 | 18.6%) account for the highest median family income in Okanogan County with $79,979 per family, while 2-person families (6,160 | 53.6%) have the highest median income of $33,480 per family member.
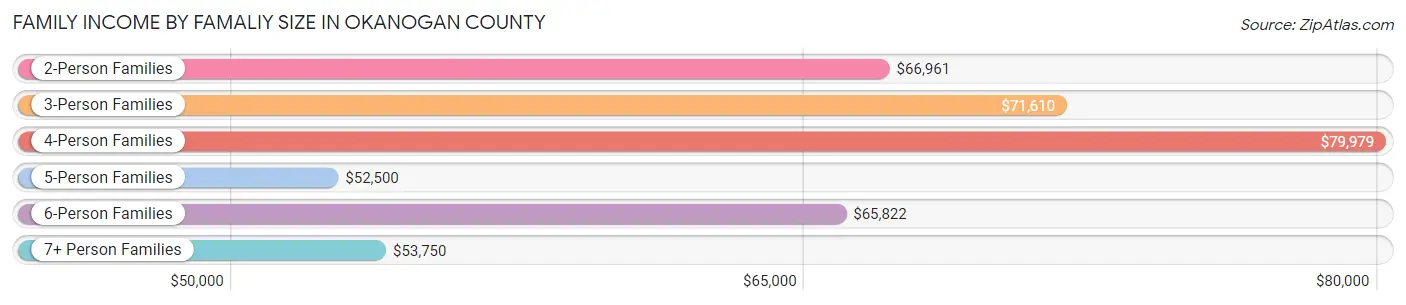
| Income Bracket | # Families | Median Income |
| 2-Person Families | 6,160 (53.6%) | $66,961 |
| 3-Person Families | 1,995 (17.4%) | $71,610 |
| 4-Person Families | 2,140 (18.6%) | $79,979 |
| 5-Person Families | 686 (6.0%) | $52,500 |
| 6-Person Families | 263 (2.3%) | $65,822 |
| 7+ Person Families | 242 (2.1%) | $53,750 |
| Total | 11,486 (100.0%) | $68,585 |
Family Income by Number of Earners in Okanogan County
The median family income in Okanogan County is $68,585, with families comprising 3+ earners (839) having the highest median family income of $124,866, while families with no earners (2,642) have the lowest median family income of $48,253, accounting for 7.3% and 23.0% of families, respectively.
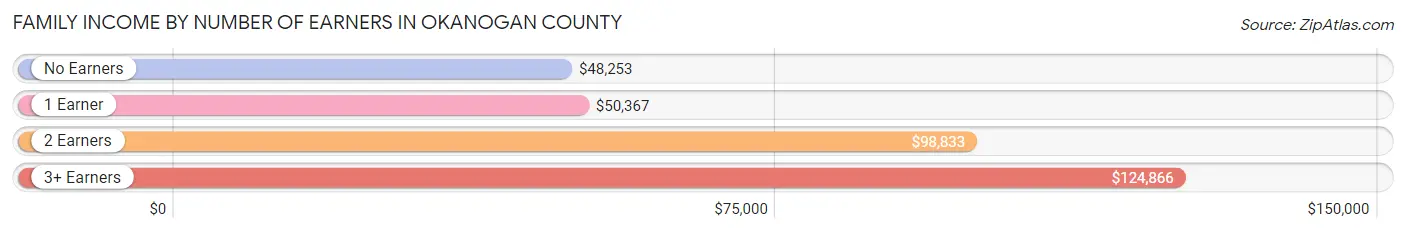
| Number of Earners | # Families | Median Income |
| No Earners | 2,642 (23.0%) | $48,253 |
| 1 Earner | 4,059 (35.3%) | $50,367 |
| 2 Earners | 3,946 (34.4%) | $98,833 |
| 3+ Earners | 839 (7.3%) | $124,866 |
| Total | 11,486 (100.0%) | $68,585 |
Household Income in Okanogan County
Household Income Brackets in Okanogan County
With 3,078 households falling in the category, the $50,000 to $74,999 income range is the most frequent in Okanogan County, accounting for 18.1% of all households. In contrast, only 646 households (3.8%) fall into the $200,000+ income bracket, making it the least populous group.
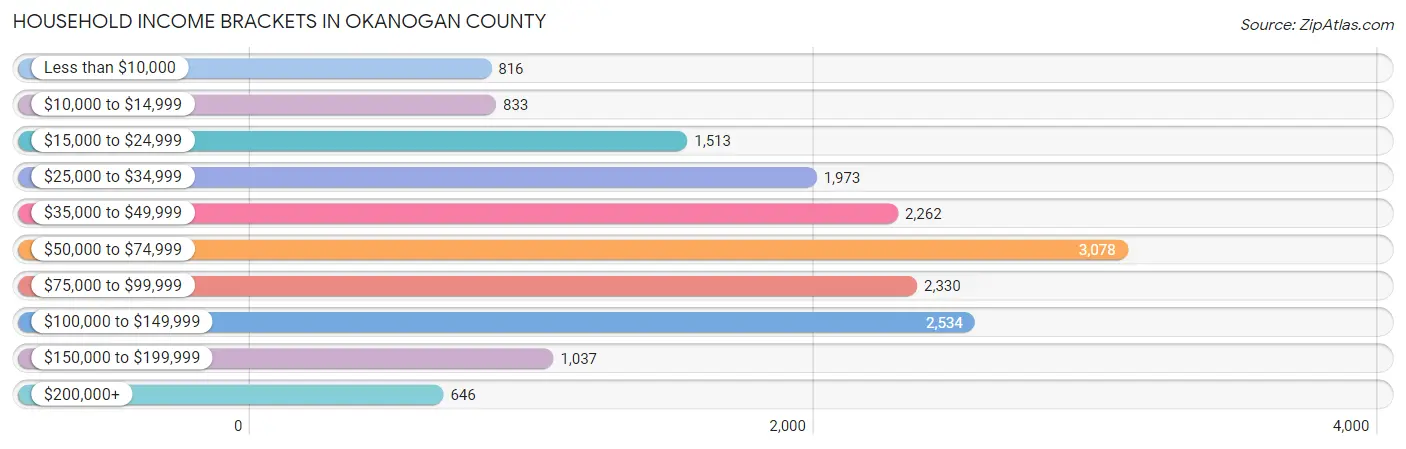
| Income Bracket | # Households | % Households |
| Less than $10,000 | 816 | 4.8% |
| $10,000 to $14,999 | 833 | 4.9% |
| $15,000 to $24,999 | 1,513 | 8.9% |
| $25,000 to $34,999 | 1,973 | 11.6% |
| $35,000 to $49,999 | 2,262 | 13.3% |
| $50,000 to $74,999 | 3,078 | 18.1% |
| $75,000 to $99,999 | 2,330 | 13.7% |
| $100,000 to $149,999 | 2,534 | 14.9% |
| $150,000 to $199,999 | 1,037 | 6.1% |
| $200,000+ | 646 | 3.8% |
Household Income by Householder Age in Okanogan County
The median household income in Okanogan County is $58,218, with the highest median household income of $68,594 found in the 45 to 64 years age bracket for the primary householder. A total of 6,096 households (35.8%) fall into this category. Meanwhile, the 15 to 24 years age bracket for the primary householder has the lowest median household income of $40,720, with 495 households (2.9%) in this group.
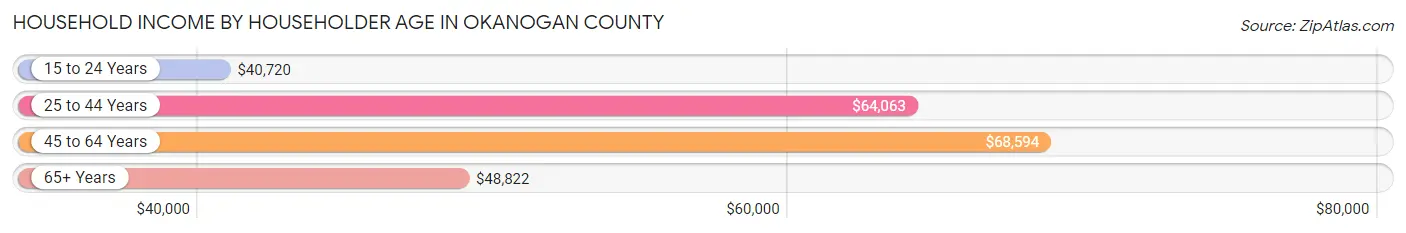
| Income Bracket | # Households | Median Income |
| 15 to 24 Years | 495 (2.9%) | $40,720 |
| 25 to 44 Years | 4,437 (26.1%) | $64,063 |
| 45 to 64 Years | 6,096 (35.8%) | $68,594 |
| 65+ Years | 5,977 (35.1%) | $48,822 |
| Total | 17,005 (100.0%) | $58,218 |
Poverty in Okanogan County
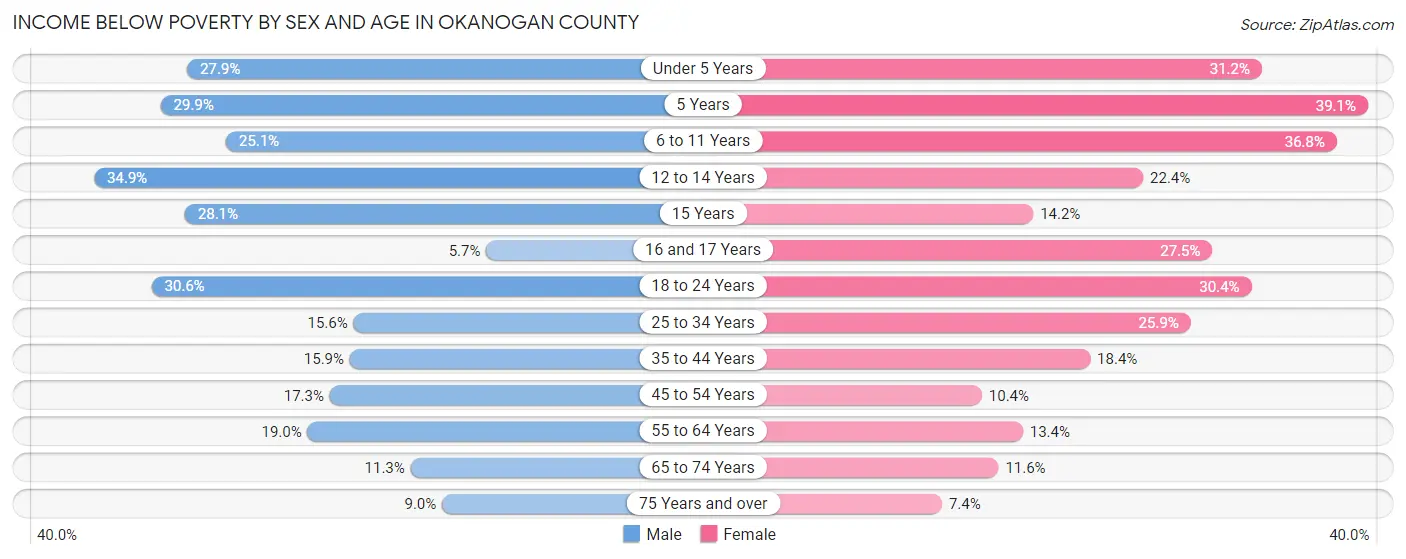
Income Below Poverty by Sex and Age in Okanogan County
With 18.5% poverty level for males and 19.2% for females among the residents of Okanogan County, 12 to 14 year old males and 5 year old females are the most vulnerable to poverty, with 245 males (34.8%) and 66 females (39.1%) in their respective age groups living below the poverty level.
| Age Bracket | Male | Female |
| Under 5 Years | 345 (27.9%) | 329 (31.2%) |
| 5 Years | 140 (29.9%) | 66 (39.1%) |
| 6 to 11 Years | 406 (25.1%) | 660 (36.7%) |
| 12 to 14 Years | 245 (34.8%) | 151 (22.4%) |
| 15 Years | 77 (28.1%) | 51 (14.2%) |
| 16 and 17 Years | 32 (5.7%) | 129 (27.5%) |
| 18 to 24 Years | 441 (30.6%) | 406 (30.4%) |
| 25 to 34 Years | 386 (15.6%) | 592 (25.9%) |
| 35 to 44 Years | 383 (15.9%) | 429 (18.4%) |
| 45 to 54 Years | 439 (17.3%) | 237 (10.4%) |
| 55 to 64 Years | 554 (19.0%) | 404 (13.4%) |
| 65 to 74 Years | 333 (11.3%) | 339 (11.6%) |
| 75 Years and over | 149 (9.0%) | 130 (7.4%) |
| Total | 3,930 (18.5%) | 3,923 (19.2%) |
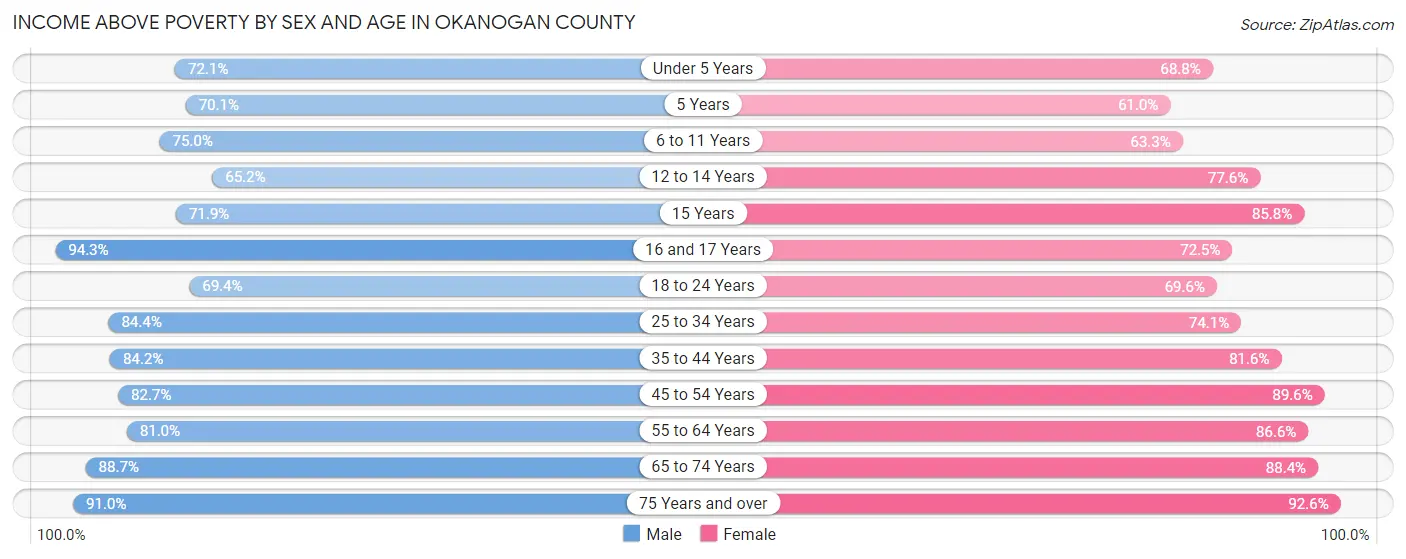
Income Above Poverty by Sex and Age in Okanogan County
According to the poverty statistics in Okanogan County, males aged 16 and 17 years and females aged 75 years and over are the age groups that are most secure financially, with 94.3% of males and 92.6% of females in these age groups living above the poverty line.
| Age Bracket | Male | Female |
| Under 5 Years | 890 (72.1%) | 726 (68.8%) |
| 5 Years | 328 (70.1%) | 103 (61.0%) |
| 6 to 11 Years | 1,215 (75.0%) | 1,136 (63.2%) |
| 12 to 14 Years | 458 (65.1%) | 524 (77.6%) |
| 15 Years | 197 (71.9%) | 308 (85.8%) |
| 16 and 17 Years | 527 (94.3%) | 340 (72.5%) |
| 18 to 24 Years | 1,001 (69.4%) | 929 (69.6%) |
| 25 to 34 Years | 2,092 (84.4%) | 1,694 (74.1%) |
| 35 to 44 Years | 2,034 (84.2%) | 1,898 (81.6%) |
| 45 to 54 Years | 2,092 (82.7%) | 2,041 (89.6%) |
| 55 to 64 Years | 2,363 (81.0%) | 2,601 (86.6%) |
| 65 to 74 Years | 2,604 (88.7%) | 2,577 (88.4%) |
| 75 Years and over | 1,507 (91.0%) | 1,618 (92.6%) |
| Total | 17,308 (81.5%) | 16,495 (80.8%) |
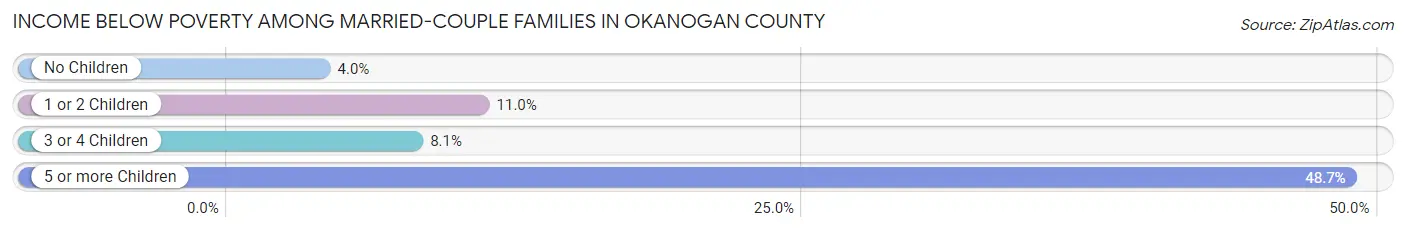
Income Below Poverty Among Married-Couple Families in Okanogan County
The poverty statistics for married-couple families in Okanogan County show that 7.0% or 601 of the total 8,538 families live below the poverty line. Families with 5 or more children have the highest poverty rate of 48.7%, comprising of 76 families. On the other hand, families with no children have the lowest poverty rate of 4.0%, which includes 222 families.
| Children | Above Poverty | Below Poverty |
| No Children | 5,287 (96.0%) | 222 (4.0%) |
| 1 or 2 Children | 2,205 (89.0%) | 271 (11.0%) |
| 3 or 4 Children | 365 (91.9%) | 32 (8.1%) |
| 5 or more Children | 80 (51.3%) | 76 (48.7%) |
| Total | 7,937 (93.0%) | 601 (7.0%) |
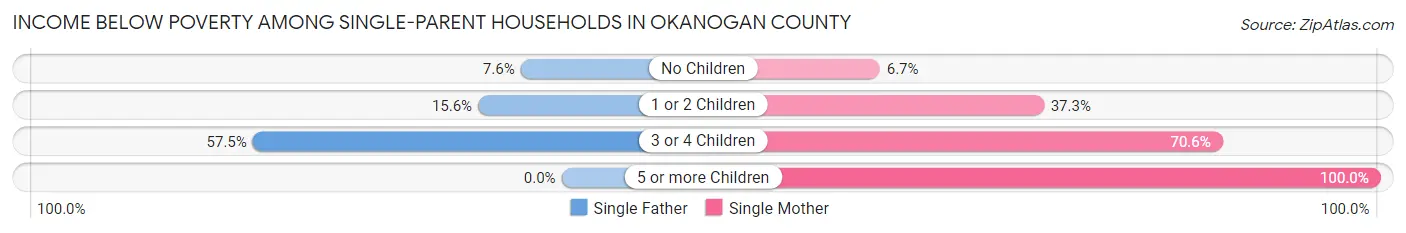
Income Below Poverty Among Single-Parent Households in Okanogan County
According to the poverty data in Okanogan County, 20.3% or 206 single-father households and 37.7% or 728 single-mother households are living below the poverty line. Among single-father households, those with 3 or 4 children have the highest poverty rate, with 107 households (57.5%) experiencing poverty. Likewise, among single-mother households, those with 5 or more children have the highest poverty rate, with 73 households (100.0%) falling below the poverty line.
| Children | Single Father | Single Mother |
| No Children | 29 (7.6%) | 29 (6.7%) |
| 1 or 2 Children | 70 (15.6%) | 427 (37.3%) |
| 3 or 4 Children | 107 (57.5%) | 199 (70.6%) |
| 5 or more Children | 0 (0.0%) | 73 (100.0%) |
| Total | 206 (20.3%) | 728 (37.7%) |
Income Below Poverty Among Married-Couple vs Single-Parent Households in Okanogan County
The poverty data for Okanogan County shows that 601 of the married-couple family households (7.0%) and 934 of the single-parent households (31.7%) are living below the poverty level. Within the married-couple family households, those with 5 or more children have the highest poverty rate, with 76 households (48.7%) falling below the poverty line. Among the single-parent households, those with 5 or more children have the highest poverty rate, with 73 household (100.0%) living below poverty.
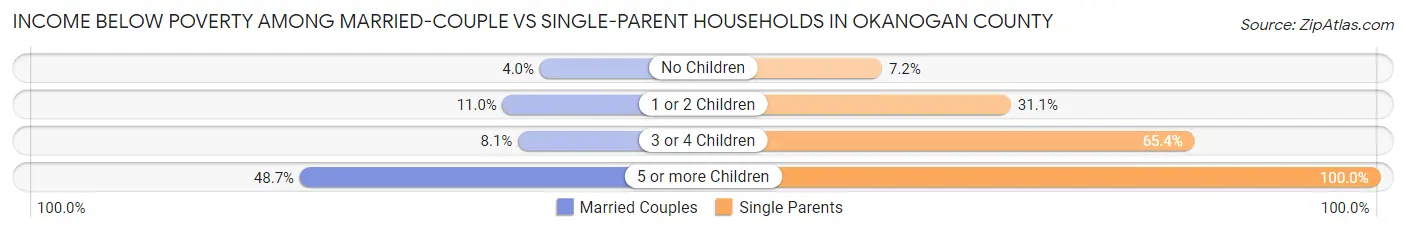
| Children | Married-Couple Families | Single-Parent Households |
| No Children | 222 (4.0%) | 58 (7.1%) |
| 1 or 2 Children | 271 (11.0%) | 497 (31.1%) |
| 3 or 4 Children | 32 (8.1%) | 306 (65.4%) |
| 5 or more Children | 76 (48.7%) | 73 (100.0%) |
| Total | 601 (7.0%) | 934 (31.7%) |
Employment Characteristics in Okanogan County
Employment by Class of Employer in Okanogan County
Among the 17,501 employed individuals in Okanogan County, private company employees (9,517 | 54.4%), local government employees (2,064 | 11.8%), and not-for-profit organizations (1,499 | 8.6%) make up the most common classes of employment.
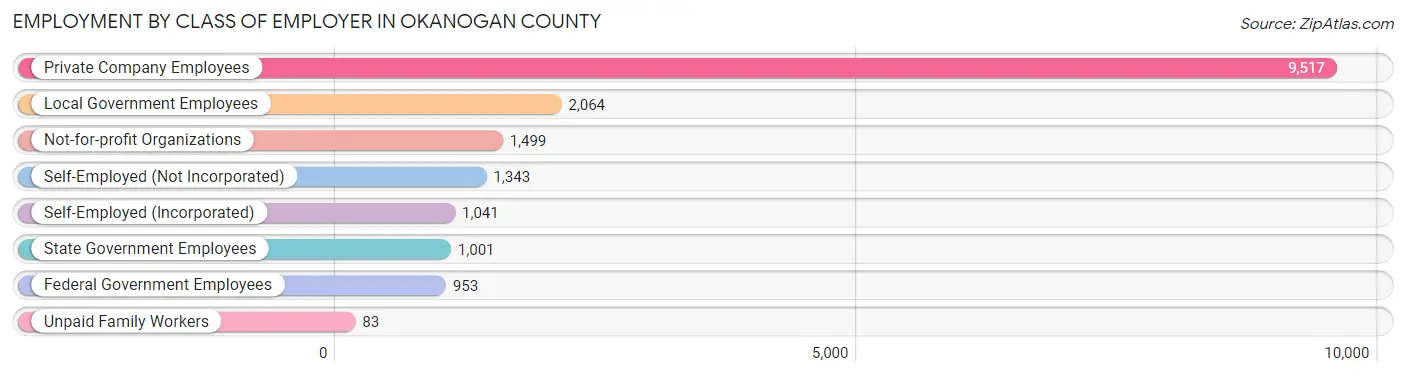
| Employer Class | # Employees | % Employees |
| Private Company Employees | 9,517 | 54.4% |
| Self-Employed (Incorporated) | 1,041 | 5.9% |
| Self-Employed (Not Incorporated) | 1,343 | 7.7% |
| Not-for-profit Organizations | 1,499 | 8.6% |
| Local Government Employees | 2,064 | 11.8% |
| State Government Employees | 1,001 | 5.7% |
| Federal Government Employees | 953 | 5.4% |
| Unpaid Family Workers | 83 | 0.5% |
| Total | 17,501 | 100.0% |
Employment Status by Age in Okanogan County
According to the labor force statistics for Okanogan County, out of the total population over 16 years of age (33,715), 56.3% or 18,982 individuals are in the labor force, with 5.8% or 1,101 of them unemployed. The age group with the highest labor force participation rate is 45 to 54 years, with 85.4% or 4,130 individuals in the labor force. Within the labor force, the 16 to 19 years age range has the highest percentage of unemployed individuals, with 27.2% or 162 of them being unemployed.
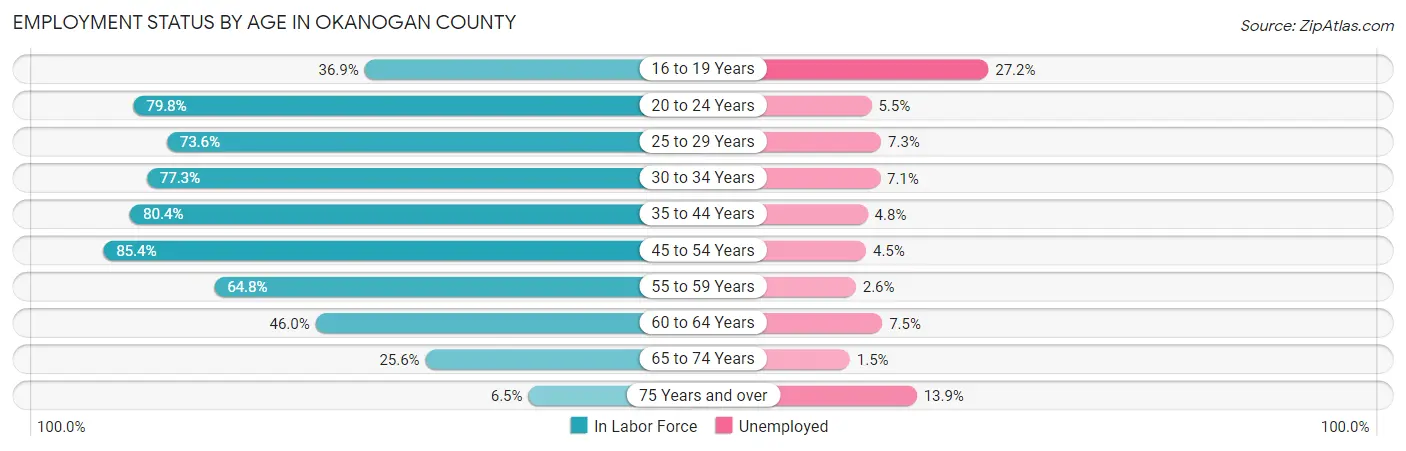
| Age Bracket | In Labor Force | Unemployed |
| 16 to 19 Years | 596 (36.9%) | 162 (27.2%) |
| 20 to 24 Years | 1,780 (79.8%) | 98 (5.5%) |
| 25 to 29 Years | 1,808 (73.6%) | 132 (7.3%) |
| 30 to 34 Years | 1,825 (77.3%) | 130 (7.1%) |
| 35 to 44 Years | 3,838 (80.4%) | 184 (4.8%) |
| 45 to 54 Years | 4,130 (85.4%) | 186 (4.5%) |
| 55 to 59 Years | 1,741 (64.8%) | 45 (2.6%) |
| 60 to 64 Years | 1,508 (46.0%) | 113 (7.5%) |
| 65 to 74 Years | 1,516 (25.6%) | 23 (1.5%) |
| 75 Years and over | 231 (6.5%) | 32 (13.9%) |
| Total | 18,982 (56.3%) | 1,101 (5.8%) |
Employment Status by Educational Attainment in Okanogan County
According to labor force statistics for Okanogan County, 72.8% of individuals (14,845) out of the total population between 25 and 64 years of age (20,392) are in the labor force, with 5.3% or 787 of them being unemployed. The group with the highest labor force participation rate are those with the educational attainment of bachelor's degree or higher, with 78.3% or 3,326 individuals in the labor force. Within the labor force, individuals with less than high school education have the highest percentage of unemployment, with 9.3% or 203 of them being unemployed.
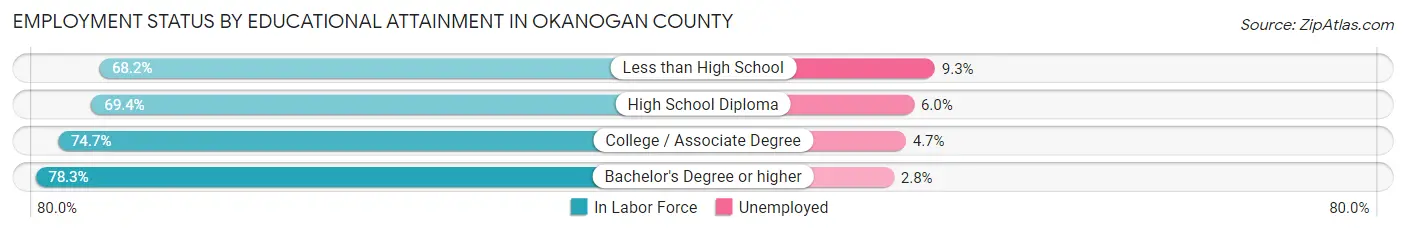
| Educational Attainment | In Labor Force | Unemployed |
| Less than High School | 2,181 (68.2%) | 297 (9.3%) |
| High School Diploma | 4,226 (69.4%) | 365 (6.0%) |
| College / Associate Degree | 5,122 (74.7%) | 322 (4.7%) |
| Bachelor's Degree or higher | 3,326 (78.3%) | 119 (2.8%) |
| Total | 14,845 (72.8%) | 1,081 (5.3%) |
Employment Occupations by Sex in Okanogan County
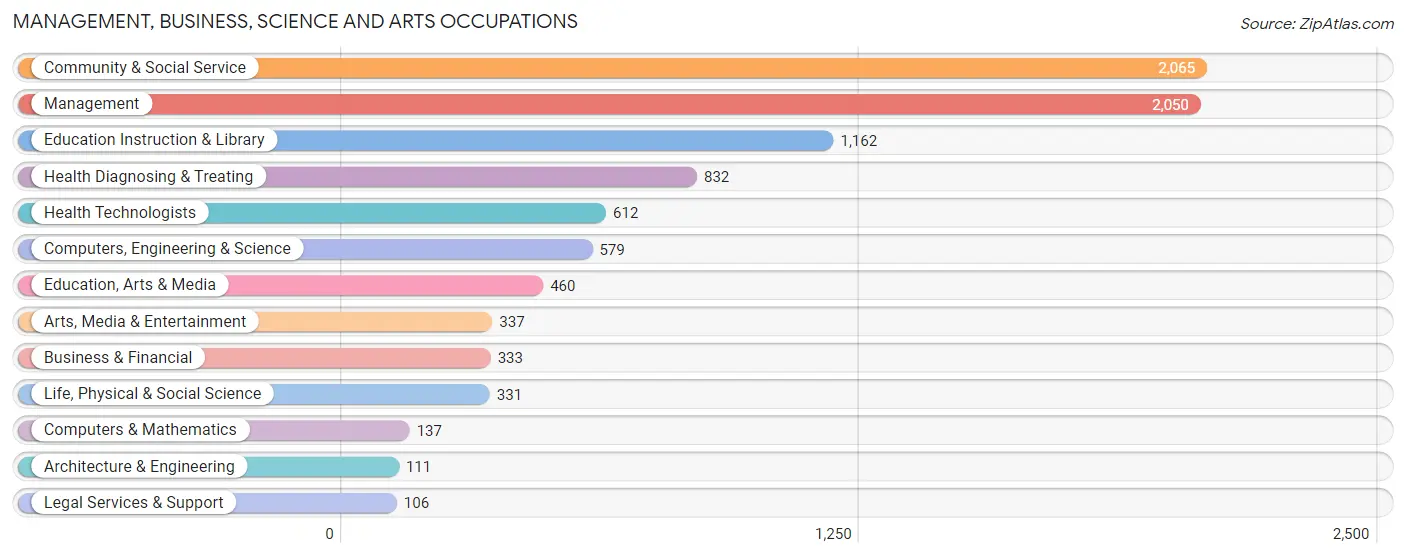
Management, Business, Science and Arts Occupations
The most common Management, Business, Science and Arts occupations in Okanogan County are Community & Social Service (2,065 | 11.7%), Management (2,050 | 11.6%), Education Instruction & Library (1,162 | 6.6%), Health Diagnosing & Treating (832 | 4.7%), and Health Technologists (612 | 3.5%).
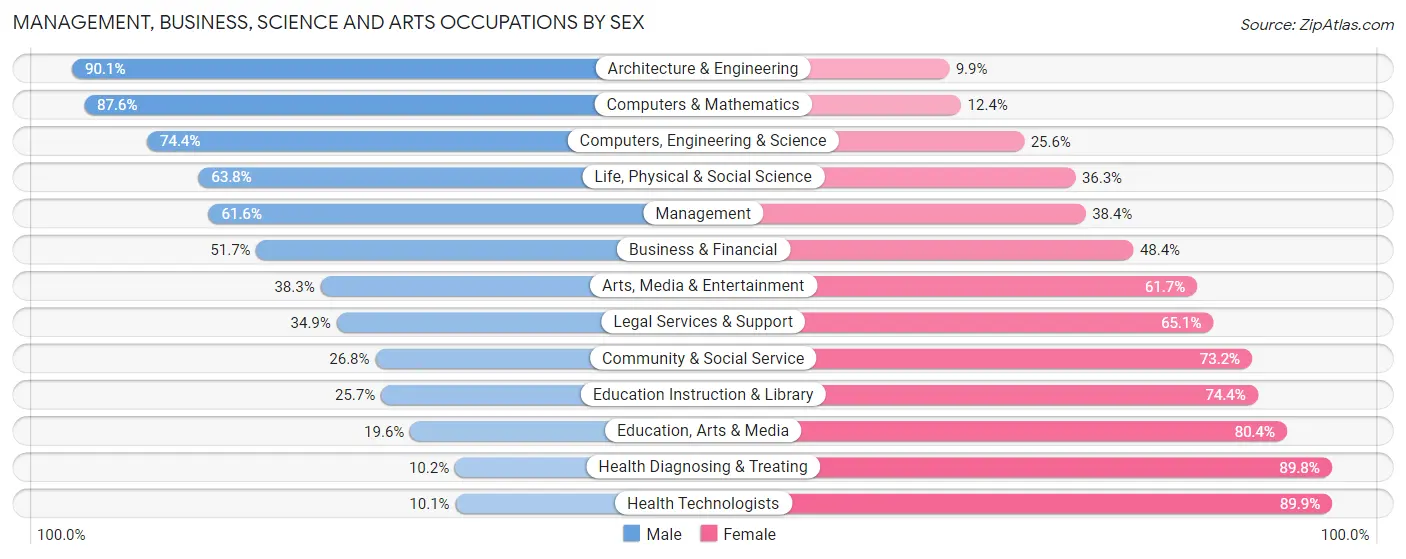
Management, Business, Science and Arts Occupations by Sex
Within the Management, Business, Science and Arts occupations in Okanogan County, the most male-oriented occupations are Architecture & Engineering (90.1%), Computers & Mathematics (87.6%), and Computers, Engineering & Science (74.4%), while the most female-oriented occupations are Health Technologists (89.9%), Health Diagnosing & Treating (89.8%), and Education, Arts & Media (80.4%).
| Occupation | Male | Female |
| Management | 1,263 (61.6%) | 787 (38.4%) |
| Business & Financial | 172 (51.6%) | 161 (48.3%) |
| Computers, Engineering & Science | 431 (74.4%) | 148 (25.6%) |
| Computers & Mathematics | 120 (87.6%) | 17 (12.4%) |
| Architecture & Engineering | 100 (90.1%) | 11 (9.9%) |
| Life, Physical & Social Science | 211 (63.7%) | 120 (36.2%) |
| Community & Social Service | 554 (26.8%) | 1,511 (73.2%) |
| Education, Arts & Media | 90 (19.6%) | 370 (80.4%) |
| Legal Services & Support | 37 (34.9%) | 69 (65.1%) |
| Education Instruction & Library | 298 (25.7%) | 864 (74.4%) |
| Arts, Media & Entertainment | 129 (38.3%) | 208 (61.7%) |
| Health Diagnosing & Treating | 85 (10.2%) | 747 (89.8%) |
| Health Technologists | 62 (10.1%) | 550 (89.9%) |
| Total (Category) | 2,505 (42.7%) | 3,354 (57.3%) |
| Total (Overall) | 9,630 (54.4%) | 8,084 (45.6%) |
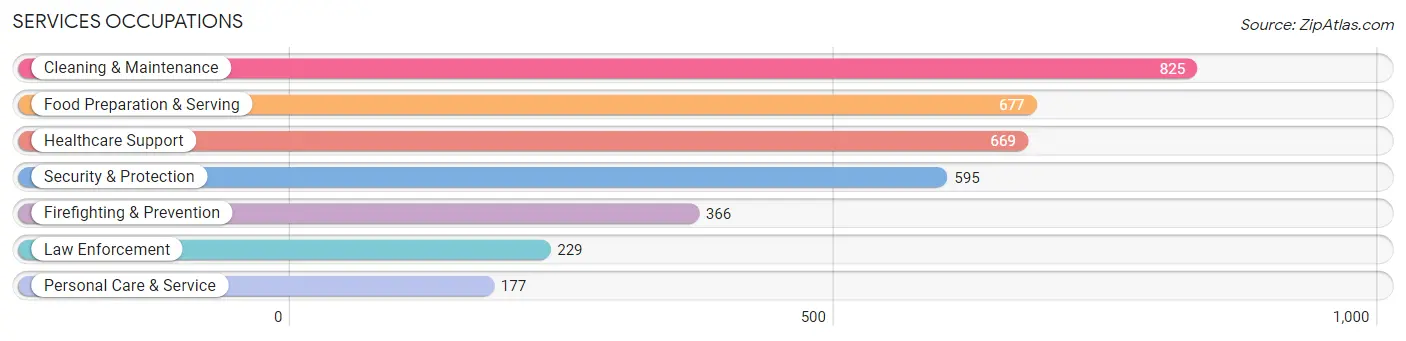
Services Occupations
The most common Services occupations in Okanogan County are Cleaning & Maintenance (825 | 4.7%), Food Preparation & Serving (677 | 3.8%), Healthcare Support (669 | 3.8%), Security & Protection (595 | 3.4%), and Firefighting & Prevention (366 | 2.1%).
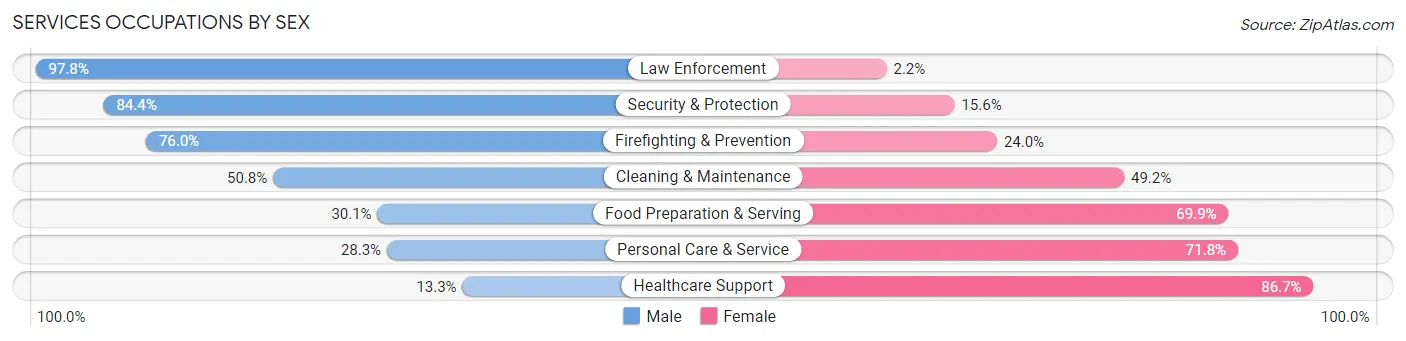
Services Occupations by Sex
Within the Services occupations in Okanogan County, the most male-oriented occupations are Law Enforcement (97.8%), Security & Protection (84.4%), and Firefighting & Prevention (76.0%), while the most female-oriented occupations are Healthcare Support (86.7%), Personal Care & Service (71.8%), and Food Preparation & Serving (69.9%).
| Occupation | Male | Female |
| Healthcare Support | 89 (13.3%) | 580 (86.7%) |
| Security & Protection | 502 (84.4%) | 93 (15.6%) |
| Firefighting & Prevention | 278 (76.0%) | 88 (24.0%) |
| Law Enforcement | 224 (97.8%) | 5 (2.2%) |
| Food Preparation & Serving | 204 (30.1%) | 473 (69.9%) |
| Cleaning & Maintenance | 419 (50.8%) | 406 (49.2%) |
| Personal Care & Service | 50 (28.2%) | 127 (71.8%) |
| Total (Category) | 1,264 (42.9%) | 1,679 (57.1%) |
| Total (Overall) | 9,630 (54.4%) | 8,084 (45.6%) |
Sales and Office Occupations
The most common Sales and Office occupations in Okanogan County are Office & Administration (1,552 | 8.8%), and Sales & Related (1,541 | 8.7%).
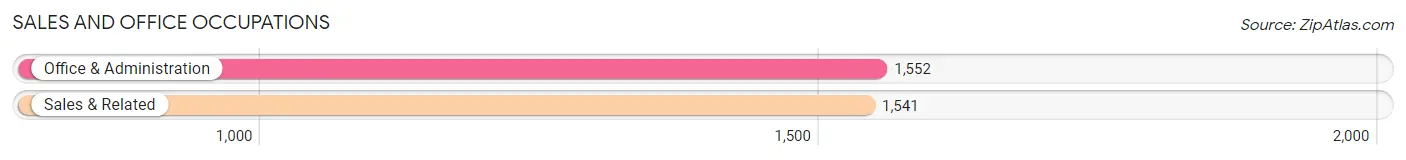
Sales and Office Occupations by Sex

| Occupation | Male | Female |
| Sales & Related | 820 (53.2%) | 721 (46.8%) |
| Office & Administration | 183 (11.8%) | 1,369 (88.2%) |
| Total (Category) | 1,003 (32.4%) | 2,090 (67.6%) |
| Total (Overall) | 9,630 (54.4%) | 8,084 (45.6%) |
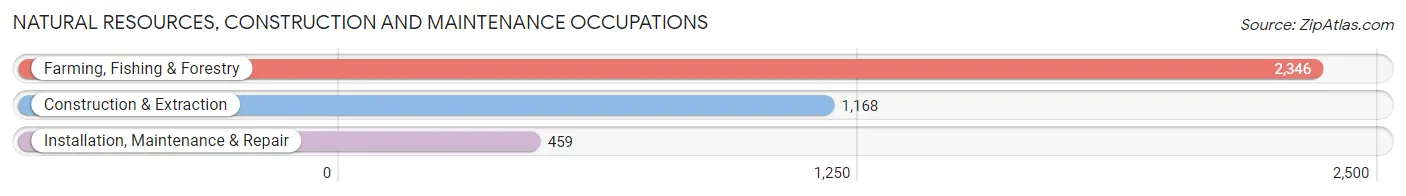
Natural Resources, Construction and Maintenance Occupations
The most common Natural Resources, Construction and Maintenance occupations in Okanogan County are Farming, Fishing & Forestry (2,346 | 13.2%), Construction & Extraction (1,168 | 6.6%), and Installation, Maintenance & Repair (459 | 2.6%).
Natural Resources, Construction and Maintenance Occupations by Sex
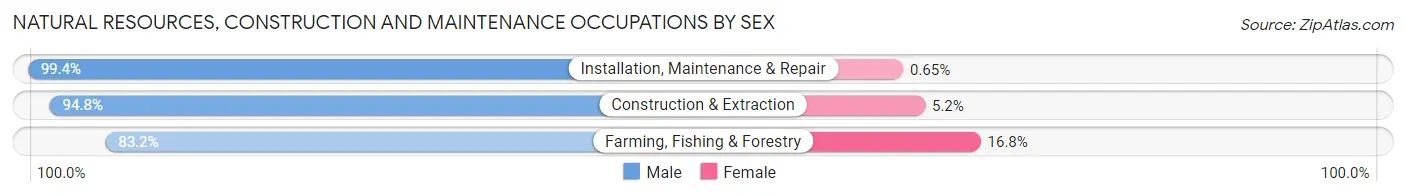
| Occupation | Male | Female |
| Farming, Fishing & Forestry | 1,952 (83.2%) | 394 (16.8%) |
| Construction & Extraction | 1,107 (94.8%) | 61 (5.2%) |
| Installation, Maintenance & Repair | 456 (99.4%) | 3 (0.6%) |
| Total (Category) | 3,515 (88.5%) | 458 (11.5%) |
| Total (Overall) | 9,630 (54.4%) | 8,084 (45.6%) |
Production, Transportation and Moving Occupations
The most common Production, Transportation and Moving occupations in Okanogan County are Production (714 | 4.0%), Material Moving (704 | 4.0%), and Transportation (428 | 2.4%).
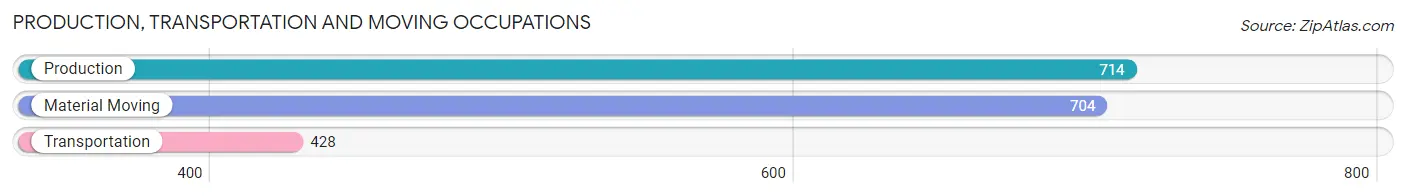
Production, Transportation and Moving Occupations by Sex
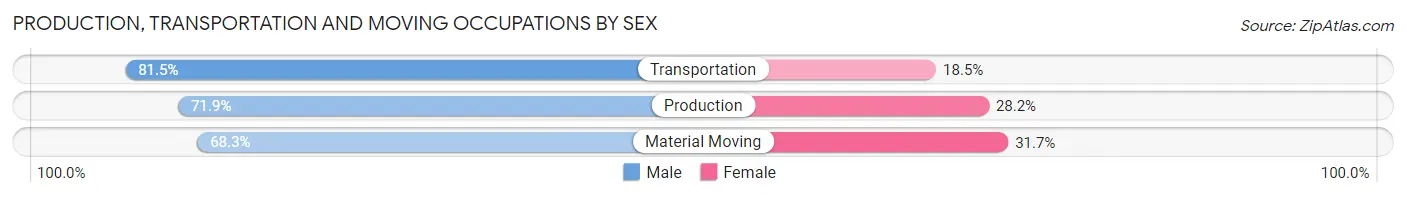
| Occupation | Male | Female |
| Production | 513 (71.9%) | 201 (28.1%) |
| Transportation | 349 (81.5%) | 79 (18.5%) |
| Material Moving | 481 (68.3%) | 223 (31.7%) |
| Total (Category) | 1,343 (72.8%) | 503 (27.3%) |
| Total (Overall) | 9,630 (54.4%) | 8,084 (45.6%) |
Employment Industries by Sex in Okanogan County
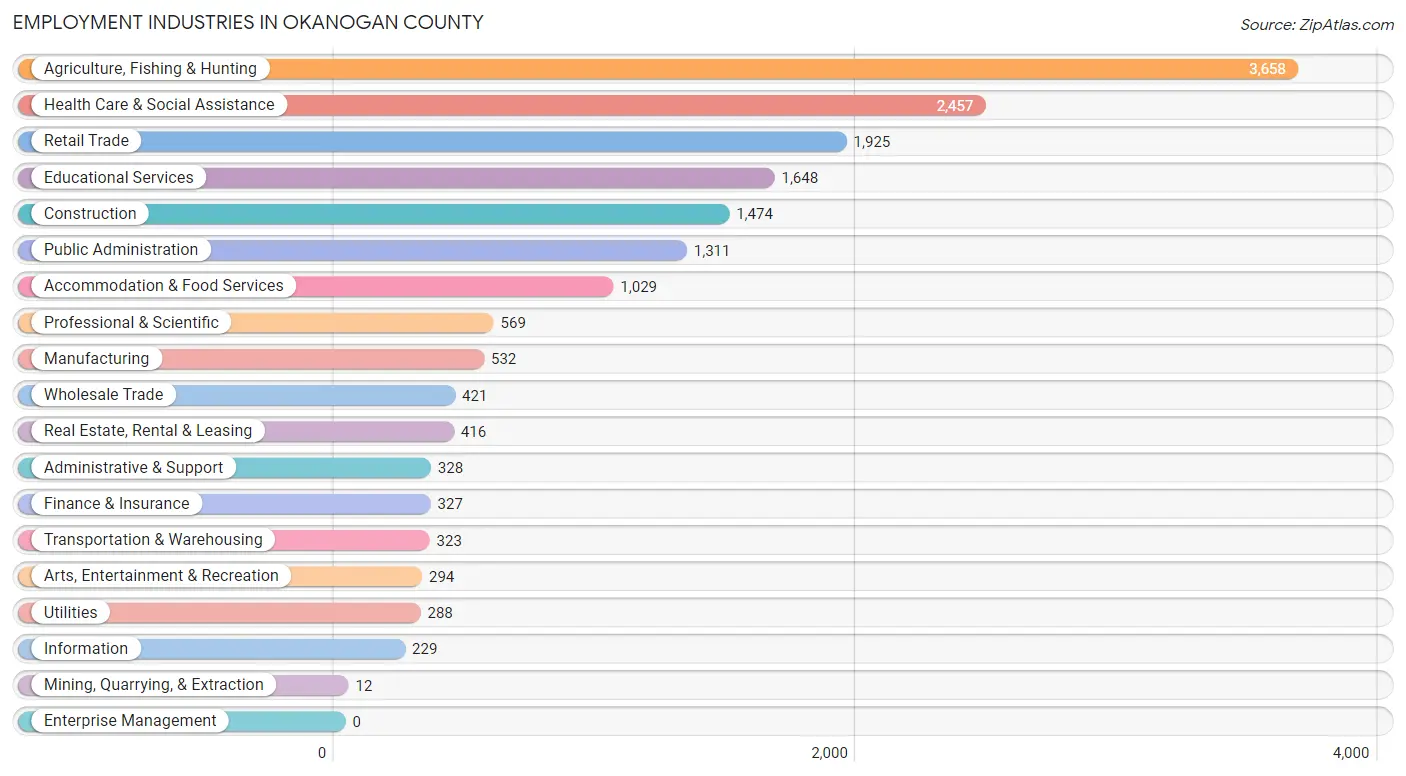
Employment Industries in Okanogan County
The major employment industries in Okanogan County include Agriculture, Fishing & Hunting (3,658 | 20.6%), Health Care & Social Assistance (2,457 | 13.9%), Retail Trade (1,925 | 10.9%), Educational Services (1,648 | 9.3%), and Construction (1,474 | 8.3%).
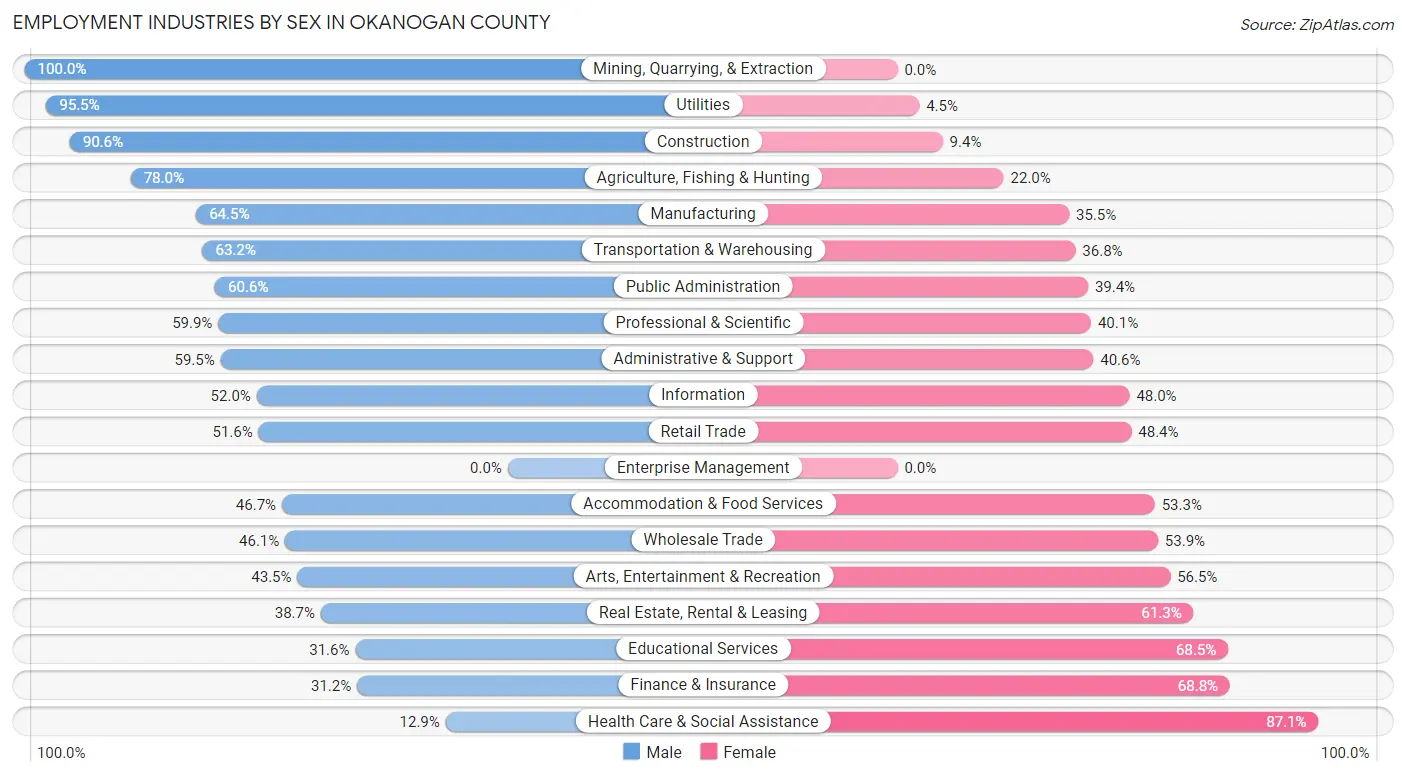
Employment Industries by Sex in Okanogan County
The Okanogan County industries that see more men than women are Mining, Quarrying, & Extraction (100.0%), Utilities (95.5%), and Construction (90.6%), whereas the industries that tend to have a higher number of women are Health Care & Social Assistance (87.1%), Finance & Insurance (68.8%), and Educational Services (68.4%).
| Industry | Male | Female |
| Agriculture, Fishing & Hunting | 2,854 (78.0%) | 804 (22.0%) |
| Mining, Quarrying, & Extraction | 12 (100.0%) | 0 (0.0%) |
| Construction | 1,336 (90.6%) | 138 (9.4%) |
| Manufacturing | 343 (64.5%) | 189 (35.5%) |
| Wholesale Trade | 194 (46.1%) | 227 (53.9%) |
| Retail Trade | 993 (51.6%) | 932 (48.4%) |
| Transportation & Warehousing | 204 (63.2%) | 119 (36.8%) |
| Utilities | 275 (95.5%) | 13 (4.5%) |
| Information | 119 (52.0%) | 110 (48.0%) |
| Finance & Insurance | 102 (31.2%) | 225 (68.8%) |
| Real Estate, Rental & Leasing | 161 (38.7%) | 255 (61.3%) |
| Professional & Scientific | 341 (59.9%) | 228 (40.1%) |
| Enterprise Management | 0 (0.0%) | 0 (0.0%) |
| Administrative & Support | 195 (59.5%) | 133 (40.6%) |
| Educational Services | 520 (31.6%) | 1,128 (68.4%) |
| Health Care & Social Assistance | 316 (12.9%) | 2,141 (87.1%) |
| Arts, Entertainment & Recreation | 128 (43.5%) | 166 (56.5%) |
| Accommodation & Food Services | 481 (46.7%) | 548 (53.3%) |
| Public Administration | 794 (60.6%) | 517 (39.4%) |
| Total | 9,630 (54.4%) | 8,084 (45.6%) |
Education in Okanogan County
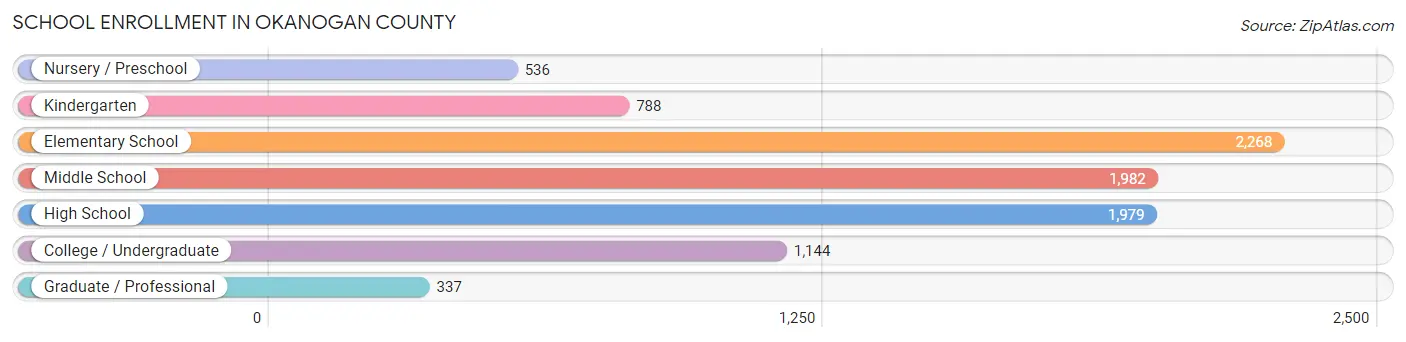
School Enrollment in Okanogan County
The most common levels of schooling among the 9,034 students in Okanogan County are elementary school (2,268 | 25.1%), middle school (1,982 | 21.9%), and high school (1,979 | 21.9%).
| School Level | # Students | % Students |
| Nursery / Preschool | 536 | 5.9% |
| Kindergarten | 788 | 8.7% |
| Elementary School | 2,268 | 25.1% |
| Middle School | 1,982 | 21.9% |
| High School | 1,979 | 21.9% |
| College / Undergraduate | 1,144 | 12.7% |
| Graduate / Professional | 337 | 3.7% |
| Total | 9,034 | 100.0% |
School Enrollment by Age by Funding Source in Okanogan County
Out of a total of 9,034 students who are enrolled in schools in Okanogan County, 1,111 (12.3%) attend a private institution, while the remaining 7,923 (87.7%) are enrolled in public schools. The age group of 3 to 4 year olds has the highest likelihood of being enrolled in private schools, with 136 (42.9% in the age bracket) enrolled. Conversely, the age group of 15 to 17 year olds has the lowest likelihood of being enrolled in a private school, with 1,556 (95.1% in the age bracket) attending a public institution.
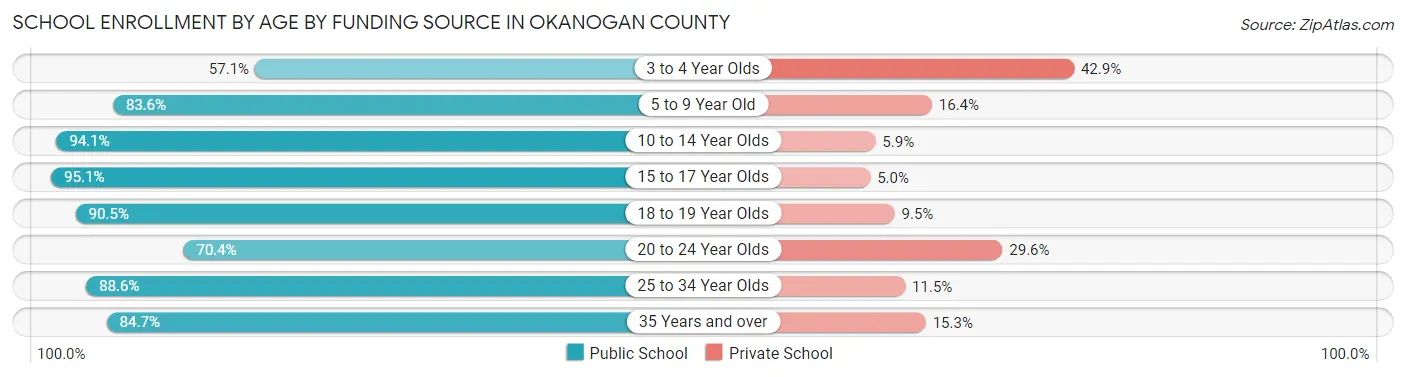
| Age Bracket | Public School | Private School |
| 3 to 4 Year Olds | 181 (57.1%) | 136 (42.9%) |
| 5 to 9 Year Old | 2,441 (83.6%) | 480 (16.4%) |
| 10 to 14 Year Olds | 2,309 (94.1%) | 145 (5.9%) |
| 15 to 17 Year Olds | 1,556 (95.1%) | 81 (5.0%) |
| 18 to 19 Year Olds | 353 (90.5%) | 37 (9.5%) |
| 20 to 24 Year Olds | 224 (70.4%) | 94 (29.6%) |
| 25 to 34 Year Olds | 379 (88.5%) | 49 (11.5%) |
| 35 Years and over | 482 (84.7%) | 87 (15.3%) |
| Total | 7,923 (87.7%) | 1,111 (12.3%) |
Educational Attainment by Field of Study in Okanogan County
Education (1,288 | 17.2%), bio, nature & agricultural (1,089 | 14.6%), social sciences (647 | 8.7%), science & technology (624 | 8.4%), and business (616 | 8.2%) are the most common fields of study among 7,475 individuals in Okanogan County who have obtained a bachelor's degree or higher.
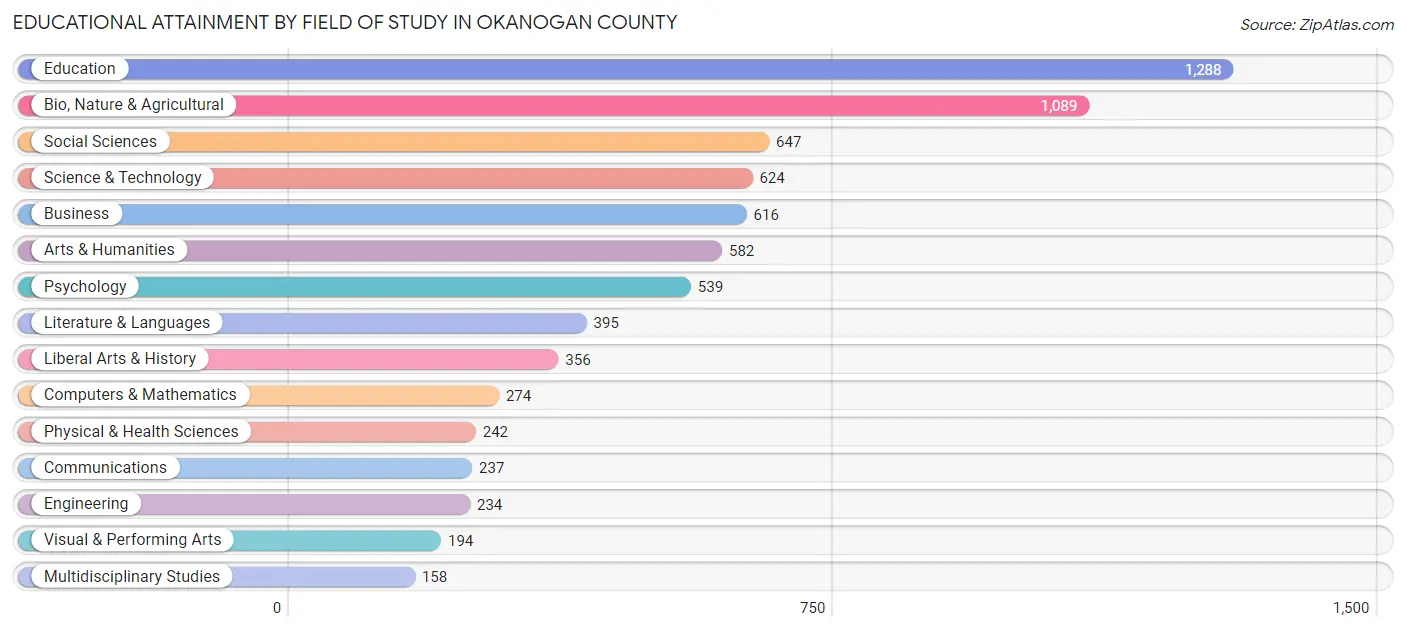
| Field of Study | # Graduates | % Graduates |
| Computers & Mathematics | 274 | 3.7% |
| Bio, Nature & Agricultural | 1,089 | 14.6% |
| Physical & Health Sciences | 242 | 3.2% |
| Psychology | 539 | 7.2% |
| Social Sciences | 647 | 8.7% |
| Engineering | 234 | 3.1% |
| Multidisciplinary Studies | 158 | 2.1% |
| Science & Technology | 624 | 8.4% |
| Business | 616 | 8.2% |
| Education | 1,288 | 17.2% |
| Literature & Languages | 395 | 5.3% |
| Liberal Arts & History | 356 | 4.8% |
| Visual & Performing Arts | 194 | 2.6% |
| Communications | 237 | 3.2% |
| Arts & Humanities | 582 | 7.8% |
| Total | 7,475 | 100.0% |
Transportation & Commute in Okanogan County
Vehicle Availability by Sex in Okanogan County
The most prevalent vehicle ownership categories in Okanogan County are males with 2 vehicles (2,628, accounting for 32.0%) and females with 2 vehicles (2,643, making up 33.4%).
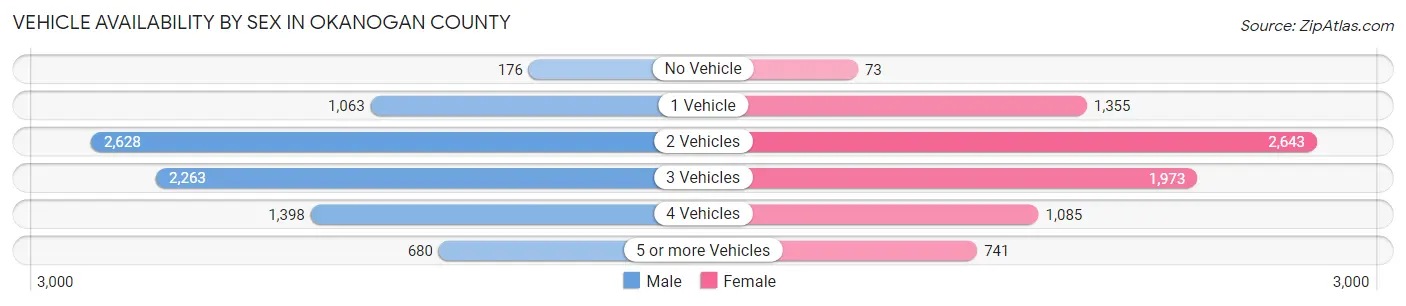
| Vehicles Available | Male | Female |
| No Vehicle | 176 (2.1%) | 73 (0.9%) |
| 1 Vehicle | 1,063 (13.0%) | 1,355 (17.2%) |
| 2 Vehicles | 2,628 (32.0%) | 2,643 (33.6%) |
| 3 Vehicles | 2,263 (27.6%) | 1,973 (25.1%) |
| 4 Vehicles | 1,398 (17.0%) | 1,085 (13.8%) |
| 5 or more Vehicles | 680 (8.3%) | 741 (9.4%) |
| Total | 8,208 (100.0%) | 7,870 (100.0%) |
Commute Time in Okanogan County
The most frequently occuring commute durations in Okanogan County are 5 to 9 minutes (2,851 commuters, 18.6%), 10 to 14 minutes (2,467 commuters, 16.1%), and 15 to 19 minutes (2,024 commuters, 13.2%).
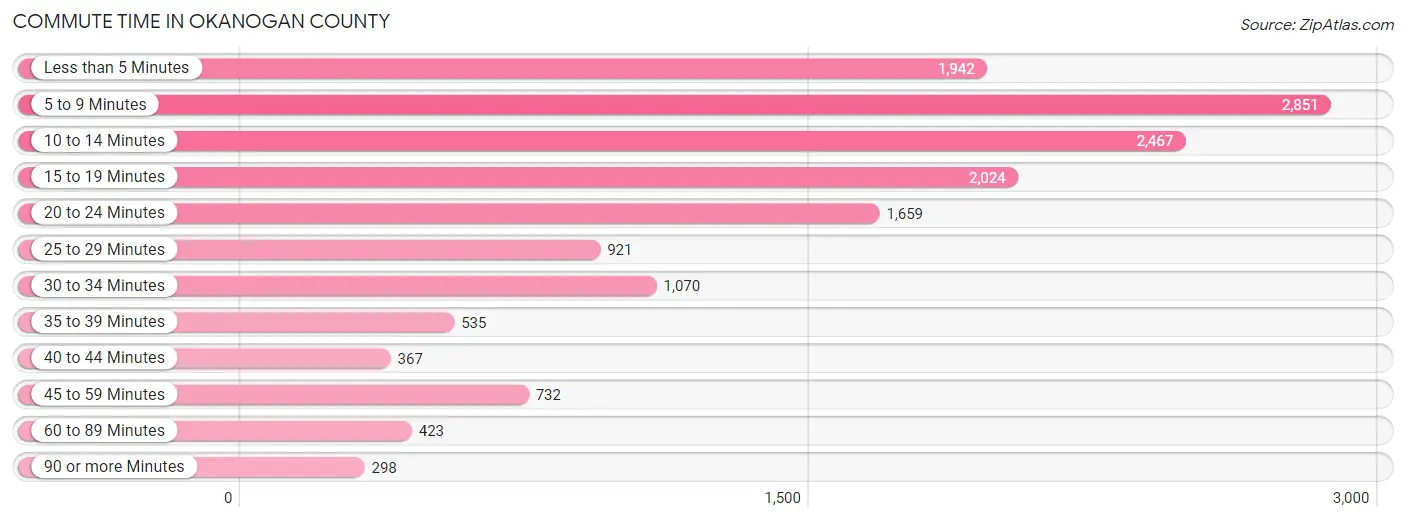
| Commute Time | # Commuters | % Commuters |
| Less than 5 Minutes | 1,942 | 12.7% |
| 5 to 9 Minutes | 2,851 | 18.6% |
| 10 to 14 Minutes | 2,467 | 16.1% |
| 15 to 19 Minutes | 2,024 | 13.2% |
| 20 to 24 Minutes | 1,659 | 10.8% |
| 25 to 29 Minutes | 921 | 6.0% |
| 30 to 34 Minutes | 1,070 | 7.0% |
| 35 to 39 Minutes | 535 | 3.5% |
| 40 to 44 Minutes | 367 | 2.4% |
| 45 to 59 Minutes | 732 | 4.8% |
| 60 to 89 Minutes | 423 | 2.8% |
| 90 or more Minutes | 298 | 1.9% |
Commute Time by Sex in Okanogan County
The most common commute times in Okanogan County are 10 to 14 minutes (1,337 commuters, 16.4%) for males and 5 to 9 minutes (1,599 commuters, 22.4%) for females.
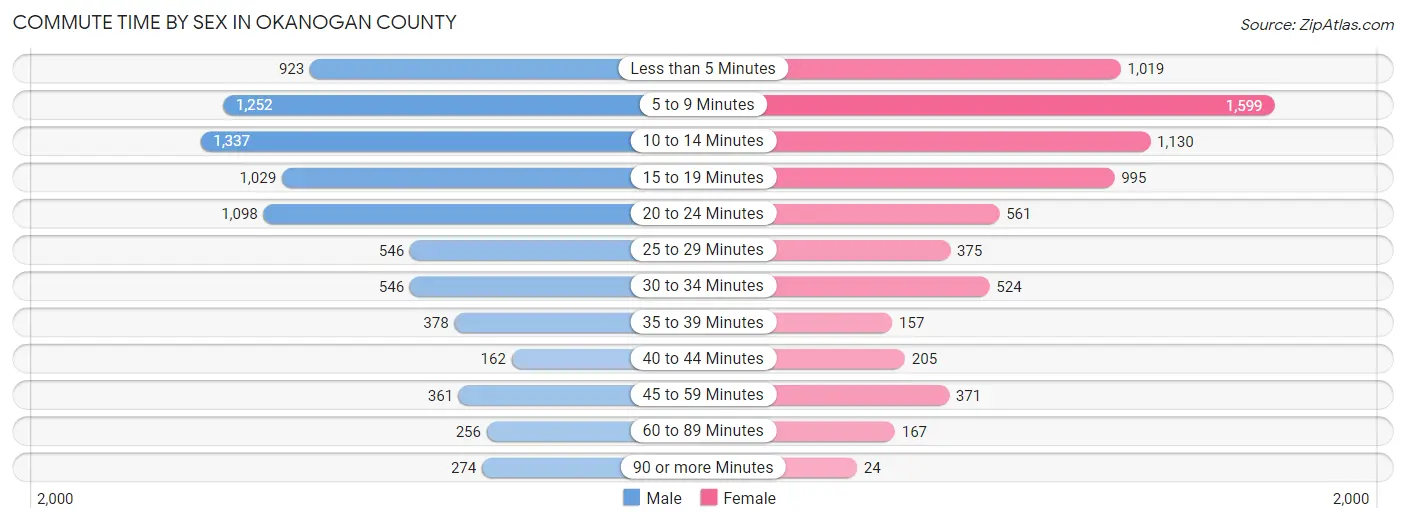
| Commute Time | Male | Female |
| Less than 5 Minutes | 923 (11.3%) | 1,019 (14.3%) |
| 5 to 9 Minutes | 1,252 (15.3%) | 1,599 (22.4%) |
| 10 to 14 Minutes | 1,337 (16.4%) | 1,130 (15.9%) |
| 15 to 19 Minutes | 1,029 (12.6%) | 995 (14.0%) |
| 20 to 24 Minutes | 1,098 (13.5%) | 561 (7.9%) |
| 25 to 29 Minutes | 546 (6.7%) | 375 (5.3%) |
| 30 to 34 Minutes | 546 (6.7%) | 524 (7.3%) |
| 35 to 39 Minutes | 378 (4.6%) | 157 (2.2%) |
| 40 to 44 Minutes | 162 (2.0%) | 205 (2.9%) |
| 45 to 59 Minutes | 361 (4.4%) | 371 (5.2%) |
| 60 to 89 Minutes | 256 (3.1%) | 167 (2.3%) |
| 90 or more Minutes | 274 (3.4%) | 24 (0.3%) |
Time of Departure to Work by Sex in Okanogan County
The most frequent times of departure to work in Okanogan County are 7:00 AM to 7:29 AM (1,556, 19.1%) for males and 7:00 AM to 7:29 AM (1,265, 17.7%) for females.
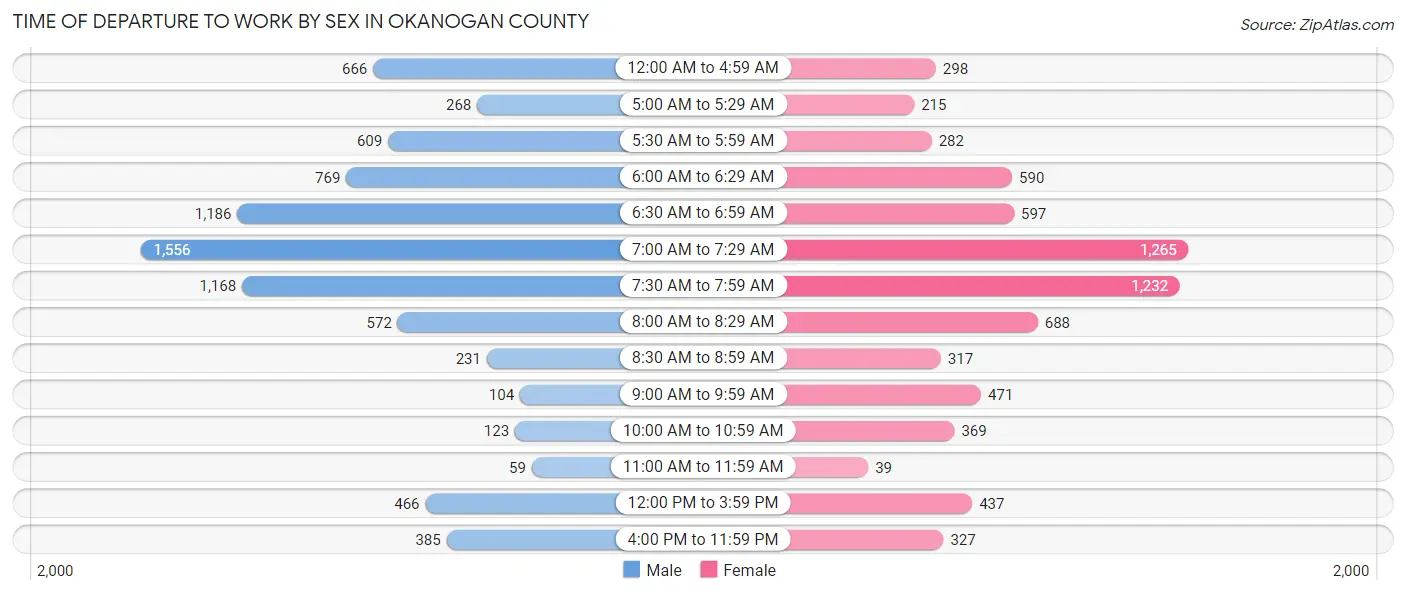
| Time of Departure | Male | Female |
| 12:00 AM to 4:59 AM | 666 (8.2%) | 298 (4.2%) |
| 5:00 AM to 5:29 AM | 268 (3.3%) | 215 (3.0%) |
| 5:30 AM to 5:59 AM | 609 (7.5%) | 282 (4.0%) |
| 6:00 AM to 6:29 AM | 769 (9.4%) | 590 (8.3%) |
| 6:30 AM to 6:59 AM | 1,186 (14.5%) | 597 (8.4%) |
| 7:00 AM to 7:29 AM | 1,556 (19.1%) | 1,265 (17.7%) |
| 7:30 AM to 7:59 AM | 1,168 (14.3%) | 1,232 (17.3%) |
| 8:00 AM to 8:29 AM | 572 (7.0%) | 688 (9.7%) |
| 8:30 AM to 8:59 AM | 231 (2.8%) | 317 (4.4%) |
| 9:00 AM to 9:59 AM | 104 (1.3%) | 471 (6.6%) |
| 10:00 AM to 10:59 AM | 123 (1.5%) | 369 (5.2%) |
| 11:00 AM to 11:59 AM | 59 (0.7%) | 39 (0.5%) |
| 12:00 PM to 3:59 PM | 466 (5.7%) | 437 (6.1%) |
| 4:00 PM to 11:59 PM | 385 (4.7%) | 327 (4.6%) |
| Total | 8,162 (100.0%) | 7,127 (100.0%) |
Housing Occupancy in Okanogan County
Occupancy by Ownership in Okanogan County
Of the total 17,005 dwellings in Okanogan County, owner-occupied units account for 11,867 (69.8%), while renter-occupied units make up 5,138 (30.2%).
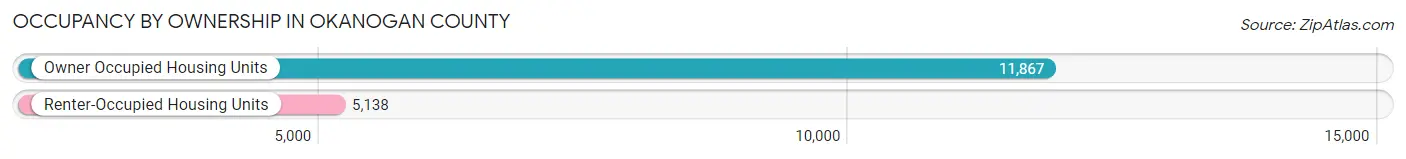
| Occupancy | # Housing Units | % Housing Units |
| Owner Occupied Housing Units | 11,867 | 69.8% |
| Renter-Occupied Housing Units | 5,138 | 30.2% |
| Total Occupied Housing Units | 17,005 | 100.0% |
Occupancy by Household Size in Okanogan County
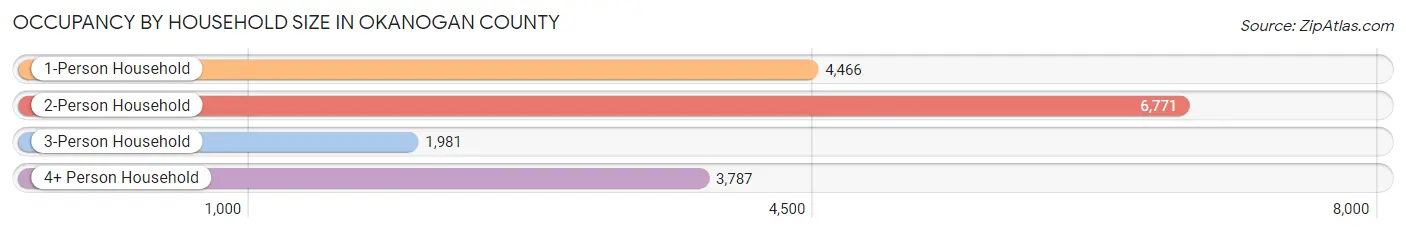
| Household Size | # Housing Units | % Housing Units |
| 1-Person Household | 4,466 | 26.3% |
| 2-Person Household | 6,771 | 39.8% |
| 3-Person Household | 1,981 | 11.7% |
| 4+ Person Household | 3,787 | 22.3% |
| Total Housing Units | 17,005 | 100.0% |
Occupancy by Ownership by Household Size in Okanogan County
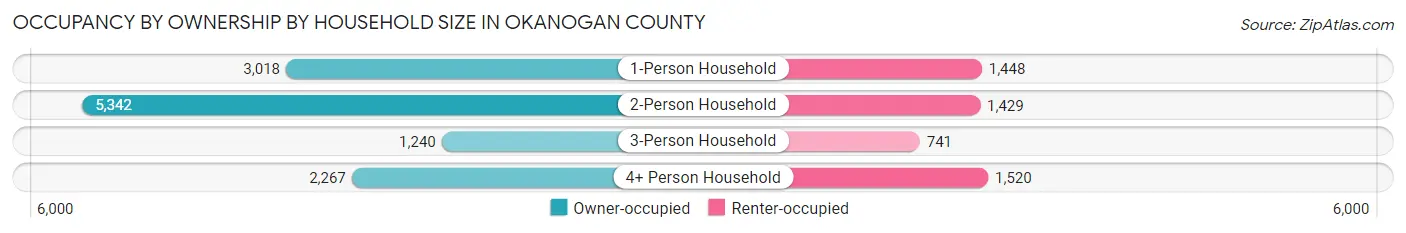
| Household Size | Owner-occupied | Renter-occupied |
| 1-Person Household | 3,018 (67.6%) | 1,448 (32.4%) |
| 2-Person Household | 5,342 (78.9%) | 1,429 (21.1%) |
| 3-Person Household | 1,240 (62.6%) | 741 (37.4%) |
| 4+ Person Household | 2,267 (59.9%) | 1,520 (40.1%) |
| Total Housing Units | 11,867 (69.8%) | 5,138 (30.2%) |
Occupancy by Educational Attainment in Okanogan County
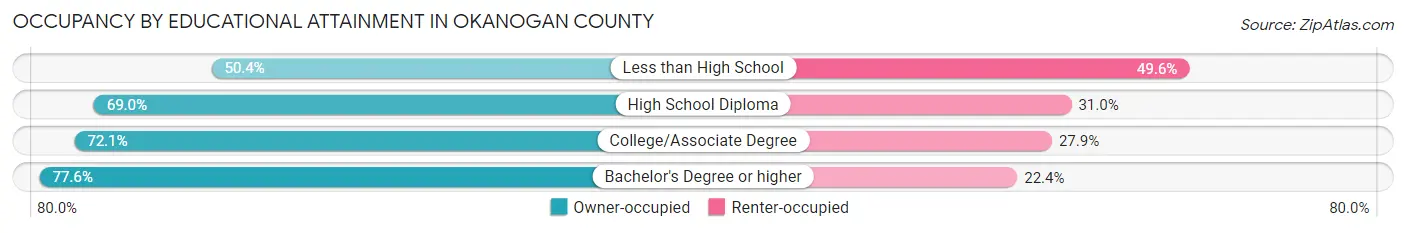
| Household Size | Owner-occupied | Renter-occupied |
| Less than High School | 1,130 (50.4%) | 1,114 (49.6%) |
| High School Diploma | 3,037 (69.0%) | 1,363 (31.0%) |
| College/Associate Degree | 4,484 (72.1%) | 1,734 (27.9%) |
| Bachelor's Degree or higher | 3,216 (77.6%) | 927 (22.4%) |
Occupancy by Age of Householder in Okanogan County
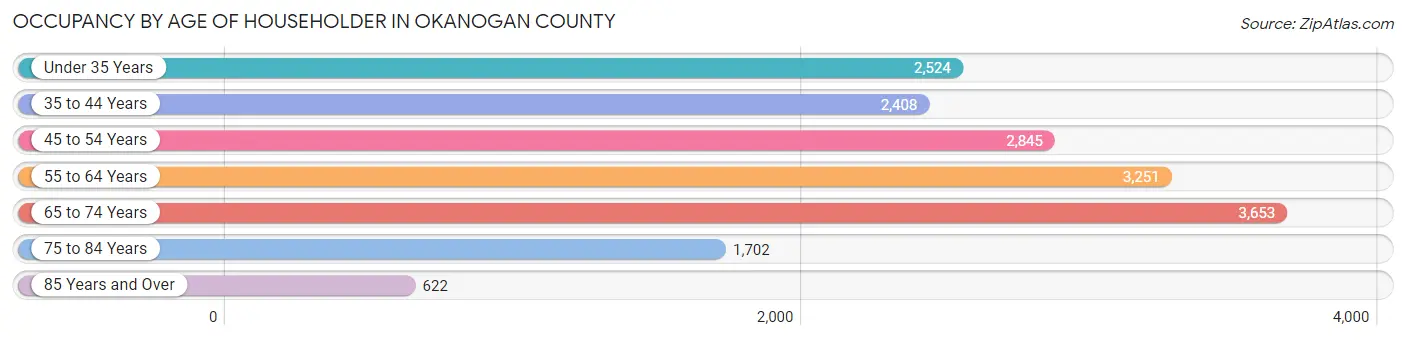
| Age Bracket | # Households | % Households |
| Under 35 Years | 2,524 | 14.8% |
| 35 to 44 Years | 2,408 | 14.2% |
| 45 to 54 Years | 2,845 | 16.7% |
| 55 to 64 Years | 3,251 | 19.1% |
| 65 to 74 Years | 3,653 | 21.5% |
| 75 to 84 Years | 1,702 | 10.0% |
| 85 Years and Over | 622 | 3.7% |
| Total | 17,005 | 100.0% |
Housing Finances in Okanogan County
Median Income by Occupancy in Okanogan County
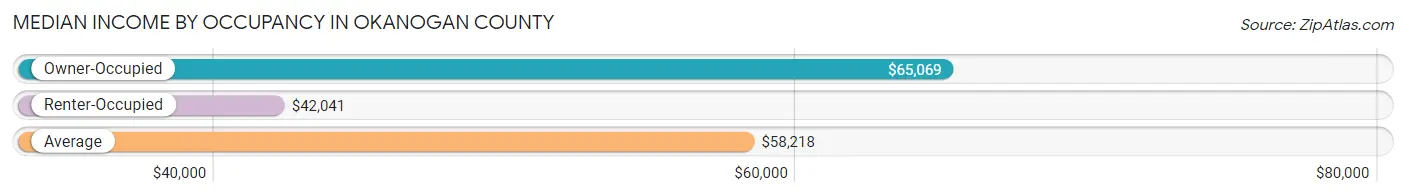
| Occupancy Type | # Households | Median Income |
| Owner-Occupied | 11,867 (69.8%) | $65,069 |
| Renter-Occupied | 5,138 (30.2%) | $42,041 |
| Average | 17,005 (100.0%) | $58,218 |
Occupancy by Householder Income Bracket in Okanogan County
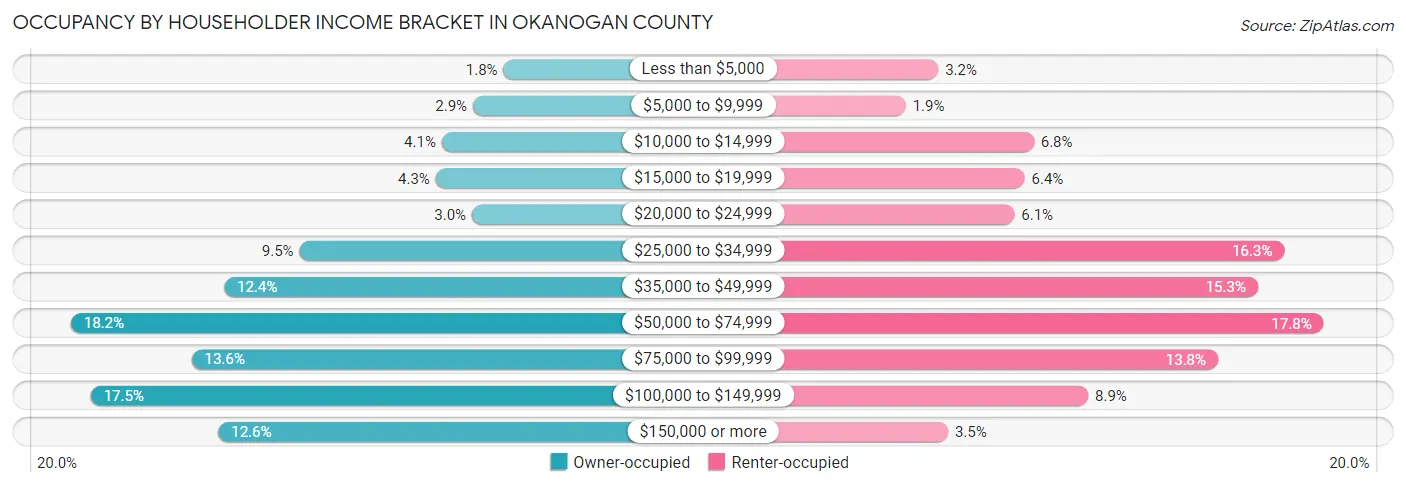
| Income Bracket | Owner-occupied | Renter-occupied |
| Less than $5,000 | 209 (1.8%) | 162 (3.2%) |
| $5,000 to $9,999 | 347 (2.9%) | 98 (1.9%) |
| $10,000 to $14,999 | 488 (4.1%) | 349 (6.8%) |
| $15,000 to $19,999 | 515 (4.3%) | 331 (6.4%) |
| $20,000 to $24,999 | 351 (3.0%) | 311 (6.0%) |
| $25,000 to $34,999 | 1,131 (9.5%) | 839 (16.3%) |
| $35,000 to $49,999 | 1,471 (12.4%) | 787 (15.3%) |
| $50,000 to $74,999 | 2,164 (18.2%) | 916 (17.8%) |
| $75,000 to $99,999 | 1,619 (13.6%) | 709 (13.8%) |
| $100,000 to $149,999 | 2,074 (17.5%) | 455 (8.9%) |
| $150,000 or more | 1,498 (12.6%) | 181 (3.5%) |
| Total | 11,867 (100.0%) | 5,138 (100.0%) |
Monthly Housing Cost Tiers in Okanogan County
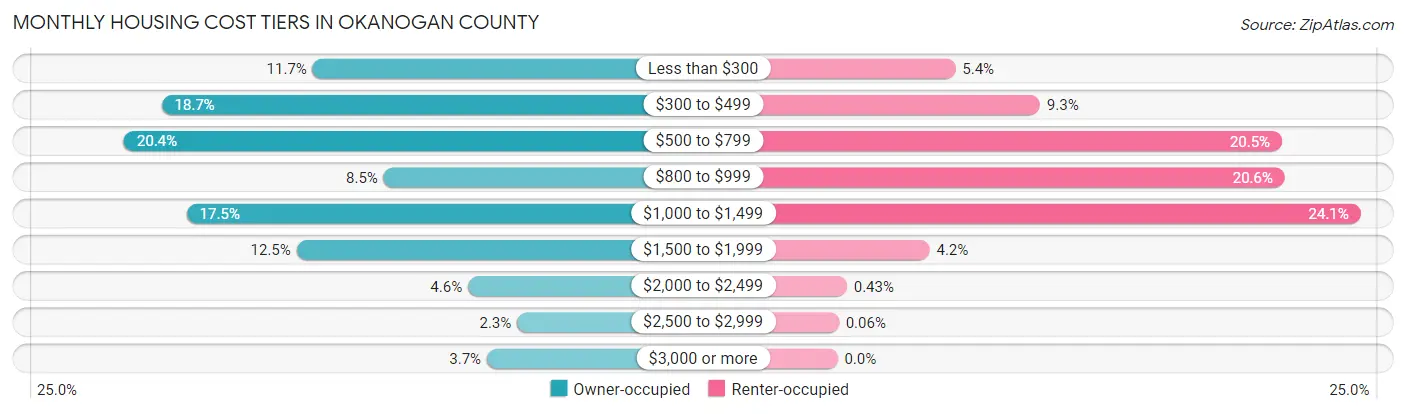
| Monthly Cost | Owner-occupied | Renter-occupied |
| Less than $300 | 1,393 (11.7%) | 279 (5.4%) |
| $300 to $499 | 2,219 (18.7%) | 479 (9.3%) |
| $500 to $799 | 2,424 (20.4%) | 1,051 (20.5%) |
| $800 to $999 | 1,005 (8.5%) | 1,058 (20.6%) |
| $1,000 to $1,499 | 2,082 (17.5%) | 1,237 (24.1%) |
| $1,500 to $1,999 | 1,481 (12.5%) | 218 (4.2%) |
| $2,000 to $2,499 | 545 (4.6%) | 22 (0.4%) |
| $2,500 to $2,999 | 276 (2.3%) | 3 (0.1%) |
| $3,000 or more | 442 (3.7%) | 0 (0.0%) |
| Total | 11,867 (100.0%) | 5,138 (100.0%) |
Physical Housing Characteristics in Okanogan County
Housing Structures in Okanogan County
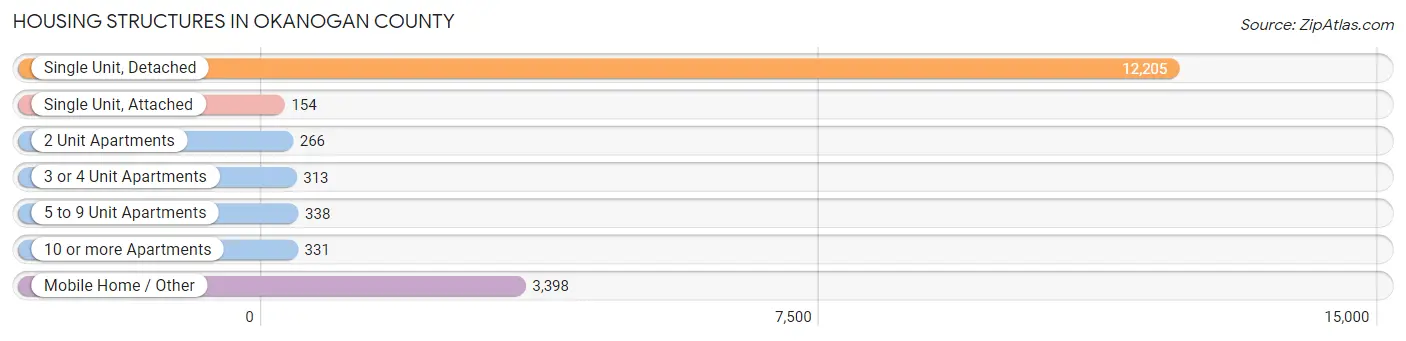
| Structure Type | # Housing Units | % Housing Units |
| Single Unit, Detached | 12,205 | 71.8% |
| Single Unit, Attached | 154 | 0.9% |
| 2 Unit Apartments | 266 | 1.6% |
| 3 or 4 Unit Apartments | 313 | 1.8% |
| 5 to 9 Unit Apartments | 338 | 2.0% |
| 10 or more Apartments | 331 | 1.9% |
| Mobile Home / Other | 3,398 | 20.0% |
| Total | 17,005 | 100.0% |
Housing Structures by Occupancy in Okanogan County
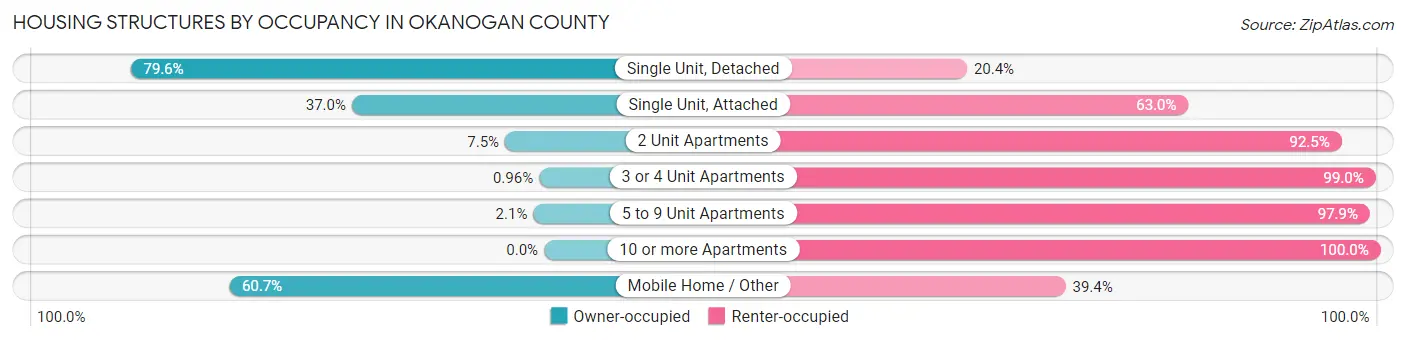
| Structure Type | Owner-occupied | Renter-occupied |
| Single Unit, Detached | 9,719 (79.6%) | 2,486 (20.4%) |
| Single Unit, Attached | 57 (37.0%) | 97 (63.0%) |
| 2 Unit Apartments | 20 (7.5%) | 246 (92.5%) |
| 3 or 4 Unit Apartments | 3 (1.0%) | 310 (99.0%) |
| 5 to 9 Unit Apartments | 7 (2.1%) | 331 (97.9%) |
| 10 or more Apartments | 0 (0.0%) | 331 (100.0%) |
| Mobile Home / Other | 2,061 (60.7%) | 1,337 (39.4%) |
| Total | 11,867 (69.8%) | 5,138 (30.2%) |
Housing Structures by Number of Rooms in Okanogan County
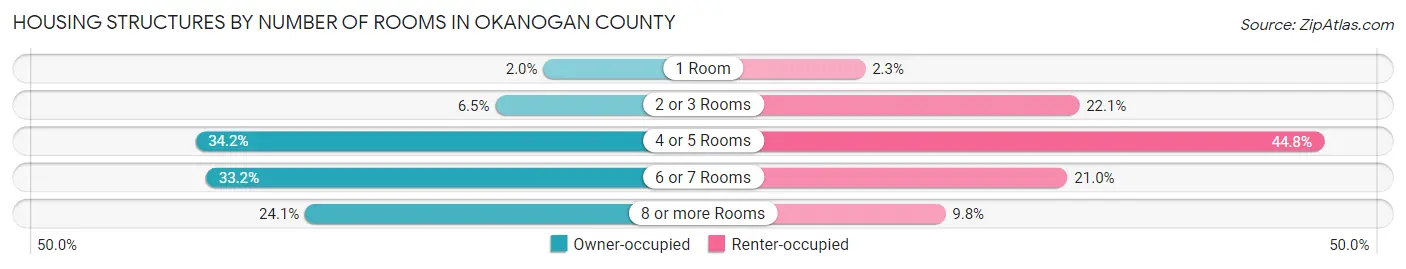
| Number of Rooms | Owner-occupied | Renter-occupied |
| 1 Room | 240 (2.0%) | 120 (2.3%) |
| 2 or 3 Rooms | 768 (6.5%) | 1,137 (22.1%) |
| 4 or 5 Rooms | 4,061 (34.2%) | 2,299 (44.8%) |
| 6 or 7 Rooms | 3,944 (33.2%) | 1,081 (21.0%) |
| 8 or more Rooms | 2,854 (24.0%) | 501 (9.8%) |
| Total | 11,867 (100.0%) | 5,138 (100.0%) |
Housing Structure by Heating Type in Okanogan County
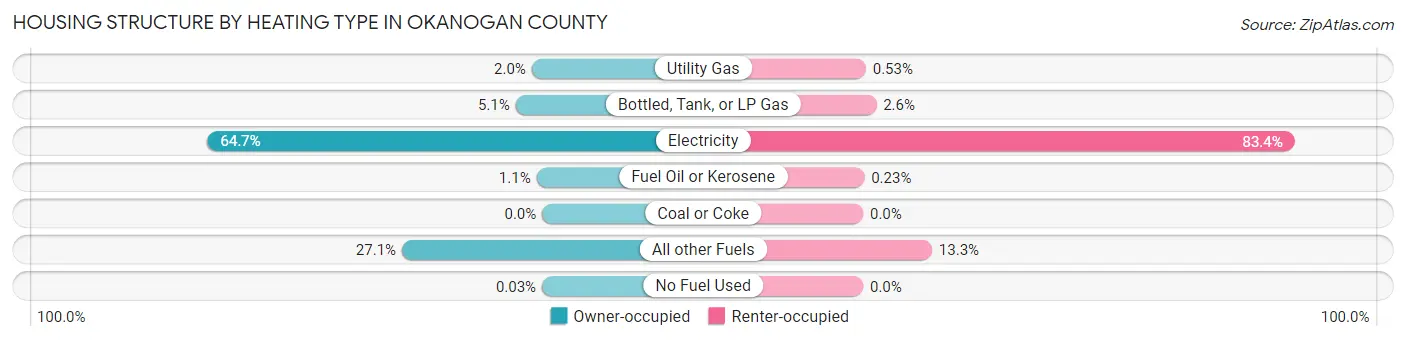
| Heating Type | Owner-occupied | Renter-occupied |
| Utility Gas | 238 (2.0%) | 27 (0.5%) |
| Bottled, Tank, or LP Gas | 607 (5.1%) | 131 (2.5%) |
| Electricity | 7,676 (64.7%) | 4,284 (83.4%) |
| Fuel Oil or Kerosene | 128 (1.1%) | 12 (0.2%) |
| Coal or Coke | 0 (0.0%) | 0 (0.0%) |
| All other Fuels | 3,215 (27.1%) | 684 (13.3%) |
| No Fuel Used | 3 (0.0%) | 0 (0.0%) |
| Total | 11,867 (100.0%) | 5,138 (100.0%) |
Household Vehicle Usage in Okanogan County
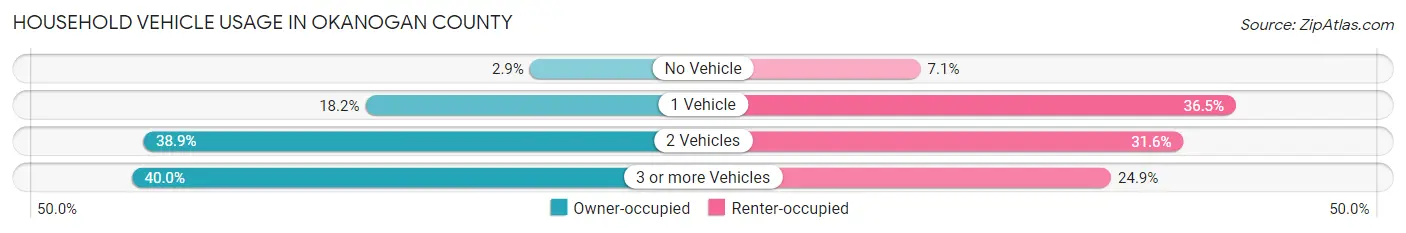
| Vehicles per Household | Owner-occupied | Renter-occupied |
| No Vehicle | 339 (2.9%) | 363 (7.1%) |
| 1 Vehicle | 2,160 (18.2%) | 1,875 (36.5%) |
| 2 Vehicles | 4,620 (38.9%) | 1,623 (31.6%) |
| 3 or more Vehicles | 4,748 (40.0%) | 1,277 (24.8%) |
| Total | 11,867 (100.0%) | 5,138 (100.0%) |
Real Estate & Mortgages in Okanogan County
Real Estate and Mortgage Overview in Okanogan County
| Characteristic | Without Mortgage | With Mortgage |
| Housing Units | 6,427 | 5,440 |
| Median Property Value | $232,200 | $280,300 |
| Median Household Income | $49,622 | $989 |
| Monthly Housing Costs | $469 | $440 |
| Real Estate Taxes | $1,849 | $301 |
Property Value by Mortgage Status in Okanogan County
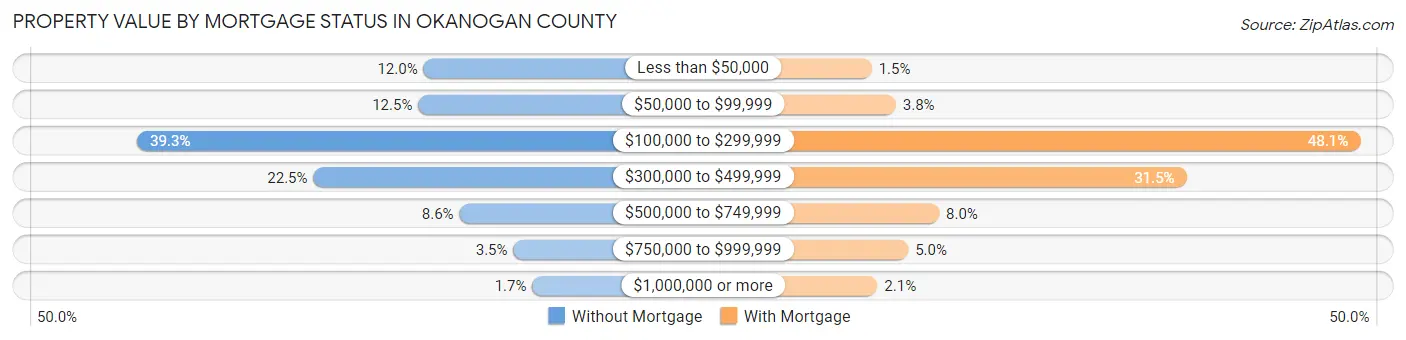
| Property Value | Without Mortgage | With Mortgage |
| Less than $50,000 | 772 (12.0%) | 84 (1.5%) |
| $50,000 to $99,999 | 804 (12.5%) | 209 (3.8%) |
| $100,000 to $299,999 | 2,525 (39.3%) | 2,614 (48.0%) |
| $300,000 to $499,999 | 1,446 (22.5%) | 1,714 (31.5%) |
| $500,000 to $749,999 | 552 (8.6%) | 433 (8.0%) |
| $750,000 to $999,999 | 222 (3.5%) | 273 (5.0%) |
| $1,000,000 or more | 106 (1.7%) | 113 (2.1%) |
| Total | 6,427 (100.0%) | 5,440 (100.0%) |
Household Income by Mortgage Status in Okanogan County
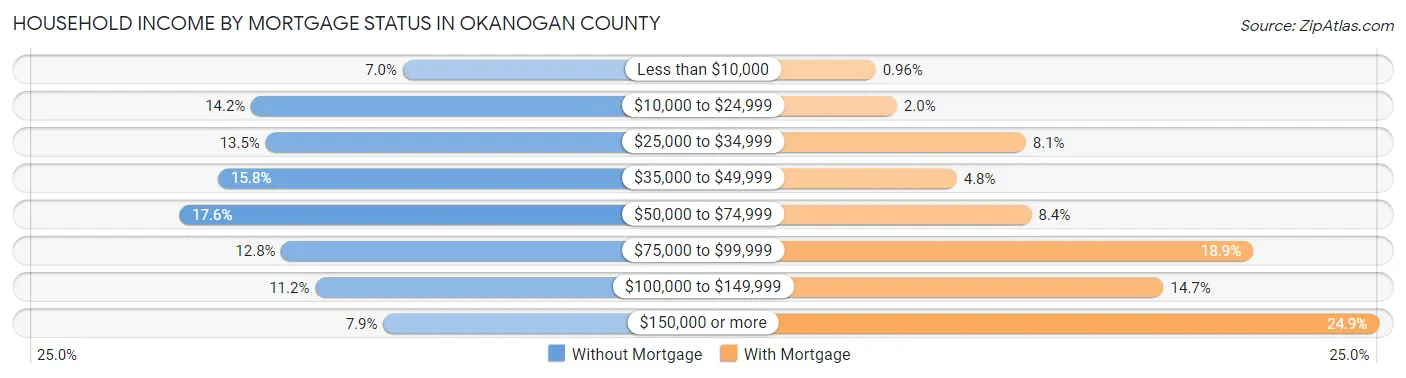
| Household Income | Without Mortgage | With Mortgage |
| Less than $10,000 | 449 (7.0%) | 52 (1.0%) |
| $10,000 to $24,999 | 913 (14.2%) | 107 (2.0%) |
| $25,000 to $34,999 | 869 (13.5%) | 441 (8.1%) |
| $35,000 to $49,999 | 1,015 (15.8%) | 262 (4.8%) |
| $50,000 to $74,999 | 1,134 (17.6%) | 456 (8.4%) |
| $75,000 to $99,999 | 821 (12.8%) | 1,030 (18.9%) |
| $100,000 to $149,999 | 717 (11.2%) | 798 (14.7%) |
| $150,000 or more | 509 (7.9%) | 1,357 (24.9%) |
| Total | 6,427 (100.0%) | 5,440 (100.0%) |
Property Value to Household Income Ratio in Okanogan County
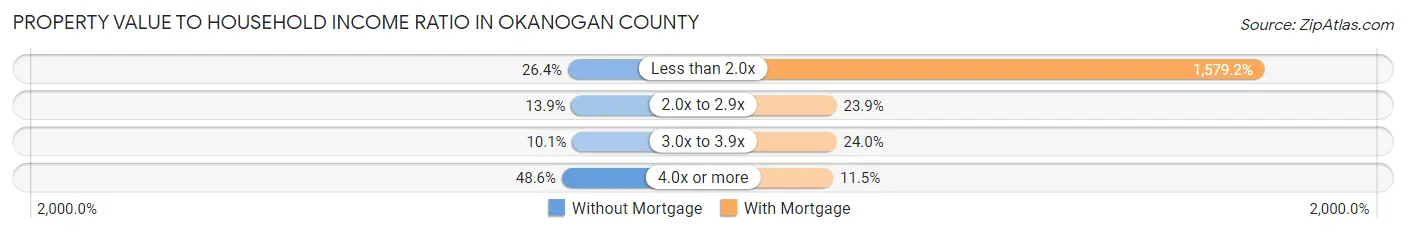
| Value-to-Income Ratio | Without Mortgage | With Mortgage |
| Less than 2.0x | 1,697 (26.4%) | 85,909 (1,579.2%) |
| 2.0x to 2.9x | 894 (13.9%) | 1,302 (23.9%) |
| 3.0x to 3.9x | 648 (10.1%) | 1,308 (24.0%) |
| 4.0x or more | 3,126 (48.6%) | 628 (11.5%) |
| Total | 6,427 (100.0%) | 5,440 (100.0%) |
Real Estate Taxes by Mortgage Status in Okanogan County
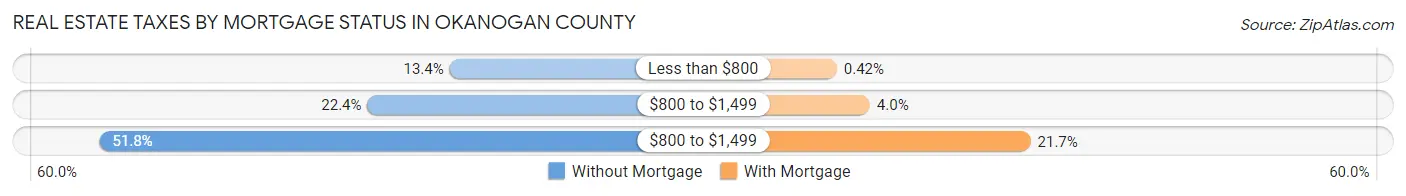
| Property Taxes | Without Mortgage | With Mortgage |
| Less than $800 | 863 (13.4%) | 23 (0.4%) |
| $800 to $1,499 | 1,442 (22.4%) | 220 (4.0%) |
| $800 to $1,499 | 3,329 (51.8%) | 1,178 (21.6%) |
| Total | 6,427 (100.0%) | 5,440 (100.0%) |
Health & Disability in Okanogan County
Health Insurance Coverage by Age in Okanogan County
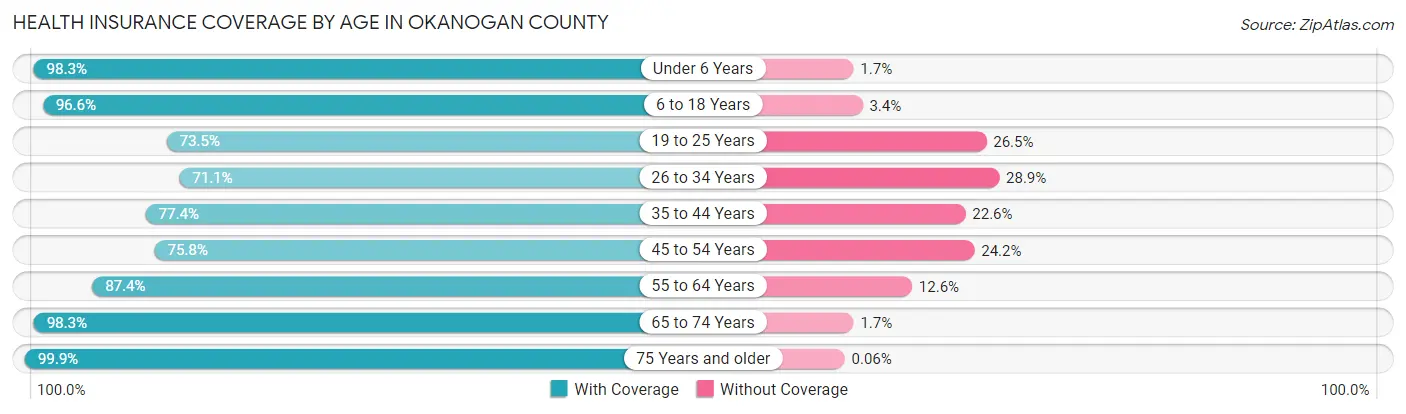
| Age Bracket | With Coverage | Without Coverage |
| Under 6 Years | 3,071 (98.3%) | 53 (1.7%) |
| 6 to 18 Years | 6,638 (96.6%) | 233 (3.4%) |
| 19 to 25 Years | 2,091 (73.5%) | 753 (26.5%) |
| 26 to 34 Years | 3,052 (71.1%) | 1,239 (28.9%) |
| 35 to 44 Years | 3,649 (77.4%) | 1,064 (22.6%) |
| 45 to 54 Years | 3,588 (75.8%) | 1,148 (24.2%) |
| 55 to 64 Years | 5,175 (87.4%) | 747 (12.6%) |
| 65 to 74 Years | 5,753 (98.3%) | 100 (1.7%) |
| 75 Years and older | 3,402 (99.9%) | 2 (0.1%) |
| Total | 36,419 (87.2%) | 5,339 (12.8%) |
Health Insurance Coverage by Citizenship Status in Okanogan County
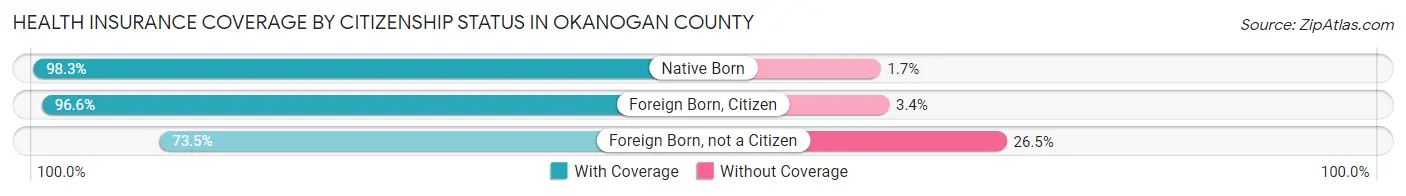
| Citizenship Status | With Coverage | Without Coverage |
| Native Born | 3,071 (98.3%) | 53 (1.7%) |
| Foreign Born, Citizen | 6,638 (96.6%) | 233 (3.4%) |
| Foreign Born, not a Citizen | 2,091 (73.5%) | 753 (26.5%) |
Health Insurance Coverage by Household Income in Okanogan County
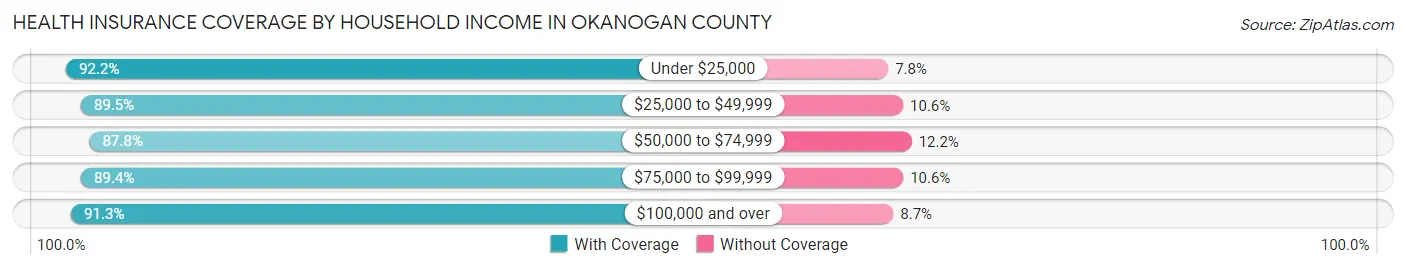
| Household Income | With Coverage | Without Coverage |
| Under $25,000 | 5,037 (92.2%) | 424 (7.8%) |
| $25,000 to $49,999 | 8,484 (89.4%) | 1,001 (10.5%) |
| $50,000 to $74,999 | 6,420 (87.8%) | 889 (12.2%) |
| $75,000 to $99,999 | 5,328 (89.4%) | 630 (10.6%) |
| $100,000 and over | 10,876 (91.3%) | 1,039 (8.7%) |
Public vs Private Health Insurance Coverage by Age in Okanogan County
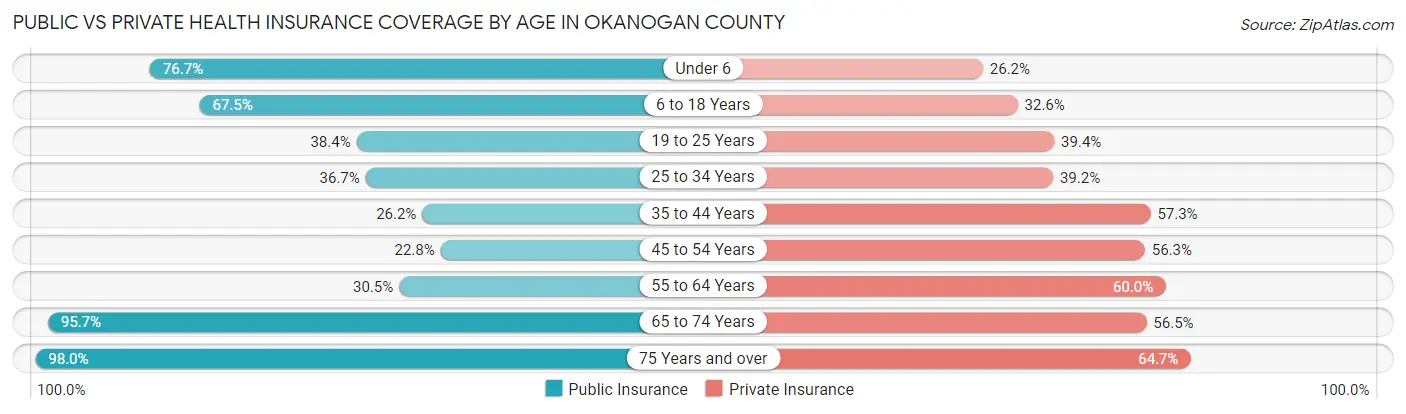
| Age Bracket | Public Insurance | Private Insurance |
| Under 6 | 2,397 (76.7%) | 818 (26.2%) |
| 6 to 18 Years | 4,639 (67.5%) | 2,242 (32.6%) |
| 19 to 25 Years | 1,092 (38.4%) | 1,121 (39.4%) |
| 25 to 34 Years | 1,575 (36.7%) | 1,682 (39.2%) |
| 35 to 44 Years | 1,235 (26.2%) | 2,700 (57.3%) |
| 45 to 54 Years | 1,080 (22.8%) | 2,664 (56.2%) |
| 55 to 64 Years | 1,806 (30.5%) | 3,553 (60.0%) |
| 65 to 74 Years | 5,601 (95.7%) | 3,309 (56.5%) |
| 75 Years and over | 3,336 (98.0%) | 2,202 (64.7%) |
| Total | 22,761 (54.5%) | 20,291 (48.6%) |
Disability Status by Sex by Age in Okanogan County
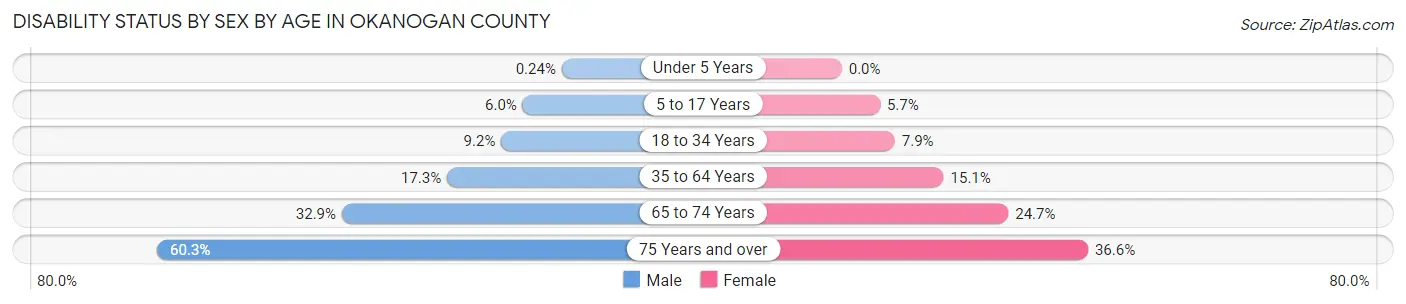
| Age Bracket | Male | Female |
| Under 5 Years | 3 (0.2%) | 0 (0.0%) |
| 5 to 17 Years | 226 (6.0%) | 198 (5.7%) |
| 18 to 34 Years | 360 (9.2%) | 282 (7.9%) |
| 35 to 64 Years | 1,346 (17.3%) | 1,146 (15.1%) |
| 65 to 74 Years | 966 (32.9%) | 721 (24.7%) |
| 75 Years and over | 999 (60.3%) | 639 (36.6%) |
Disability Class by Sex by Age in Okanogan County
Disability Class: Hearing Difficulty
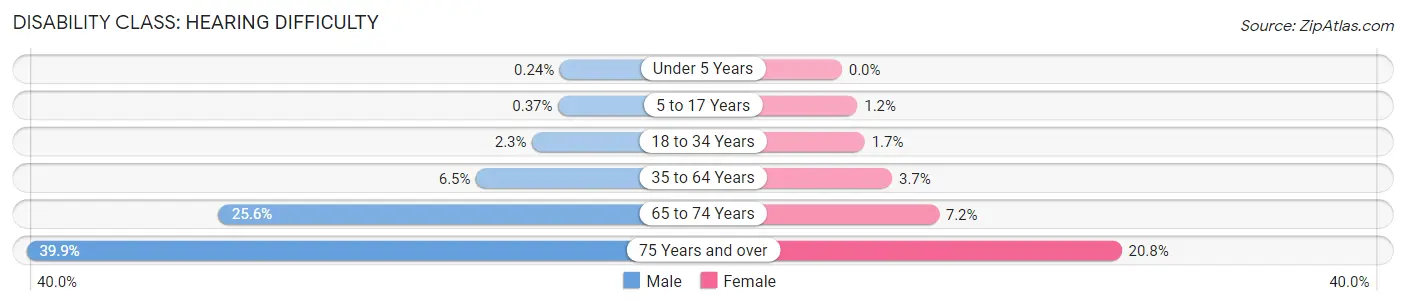
| Age Bracket | Male | Female |
| Under 5 Years | 3 (0.2%) | 0 (0.0%) |
| 5 to 17 Years | 14 (0.4%) | 40 (1.1%) |
| 18 to 34 Years | 90 (2.3%) | 61 (1.7%) |
| 35 to 64 Years | 503 (6.5%) | 283 (3.7%) |
| 65 to 74 Years | 751 (25.6%) | 210 (7.2%) |
| 75 Years and over | 660 (39.9%) | 363 (20.8%) |
Disability Class: Vision Difficulty
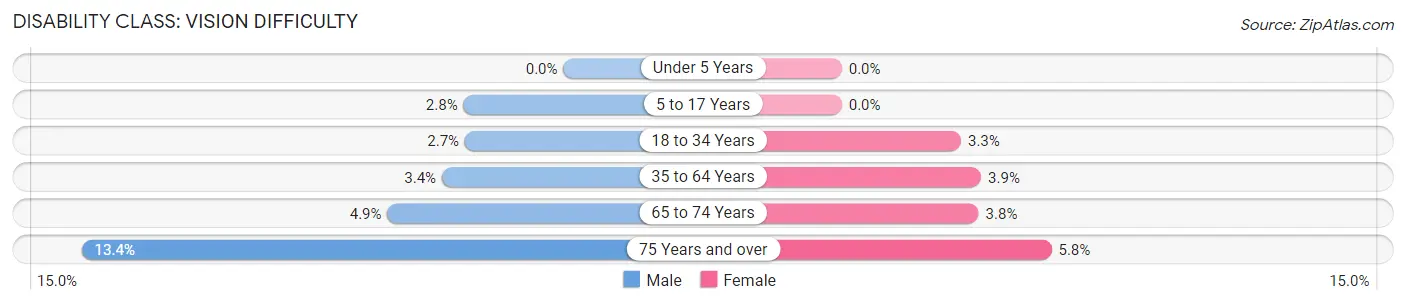
| Age Bracket | Male | Female |
| Under 5 Years | 0 (0.0%) | 0 (0.0%) |
| 5 to 17 Years | 104 (2.8%) | 0 (0.0%) |
| 18 to 34 Years | 107 (2.7%) | 119 (3.3%) |
| 35 to 64 Years | 263 (3.4%) | 294 (3.9%) |
| 65 to 74 Years | 144 (4.9%) | 111 (3.8%) |
| 75 Years and over | 222 (13.4%) | 102 (5.8%) |
Disability Class: Cognitive Difficulty
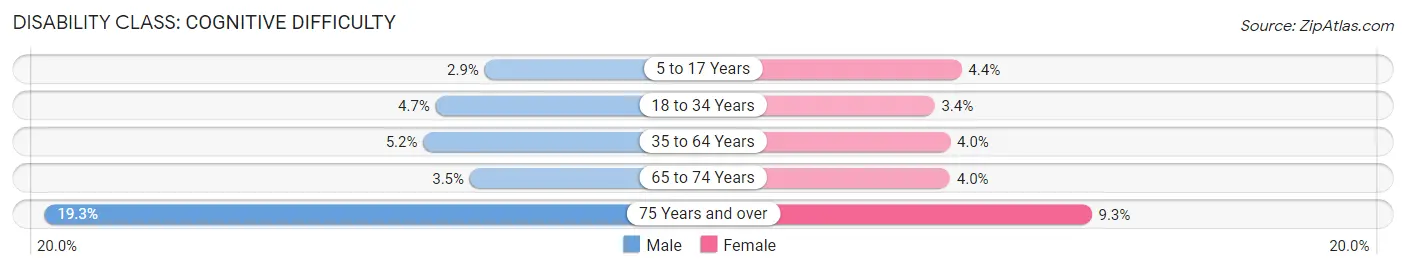
| Age Bracket | Male | Female |
| 5 to 17 Years | 109 (2.9%) | 155 (4.4%) |
| 18 to 34 Years | 185 (4.7%) | 123 (3.4%) |
| 35 to 64 Years | 405 (5.2%) | 305 (4.0%) |
| 65 to 74 Years | 102 (3.5%) | 117 (4.0%) |
| 75 Years and over | 319 (19.3%) | 162 (9.3%) |
Disability Class: Ambulatory Difficulty
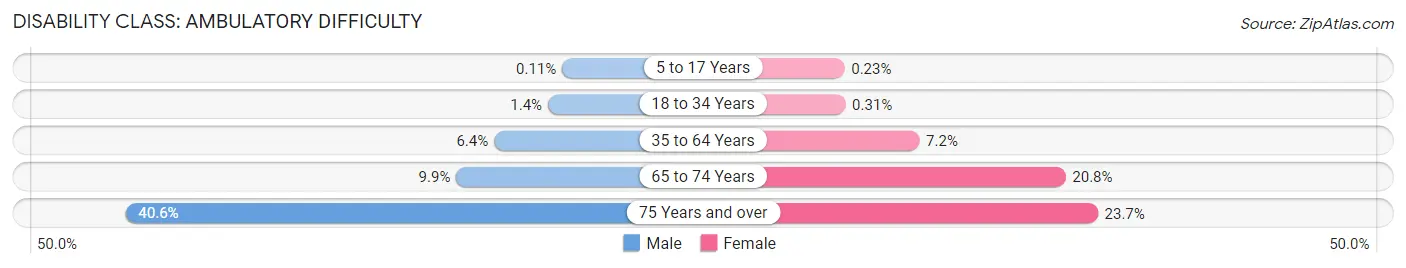
| Age Bracket | Male | Female |
| 5 to 17 Years | 4 (0.1%) | 8 (0.2%) |
| 18 to 34 Years | 56 (1.4%) | 11 (0.3%) |
| 35 to 64 Years | 501 (6.4%) | 544 (7.2%) |
| 65 to 74 Years | 292 (9.9%) | 605 (20.7%) |
| 75 Years and over | 673 (40.6%) | 415 (23.7%) |
Disability Class: Self-Care Difficulty
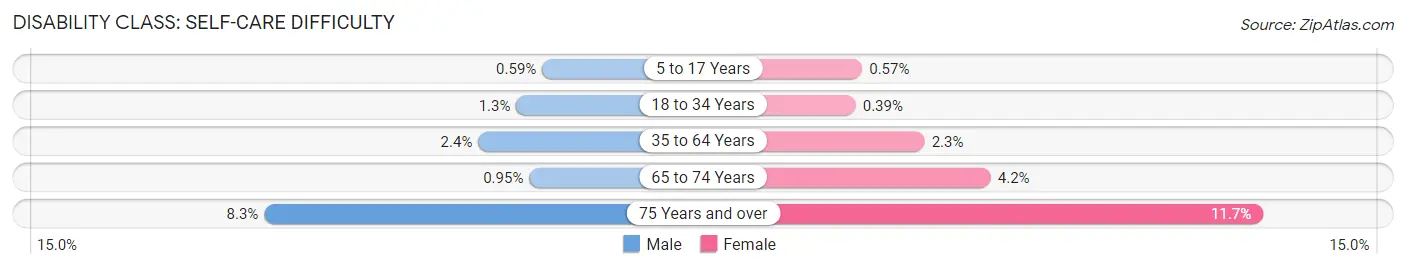
| Age Bracket | Male | Female |
| 5 to 17 Years | 22 (0.6%) | 20 (0.6%) |
| 18 to 34 Years | 51 (1.3%) | 14 (0.4%) |
| 35 to 64 Years | 185 (2.4%) | 175 (2.3%) |
| 65 to 74 Years | 28 (0.9%) | 121 (4.2%) |
| 75 Years and over | 138 (8.3%) | 205 (11.7%) |
Technology Access in Okanogan County
Computing Device Access in Okanogan County
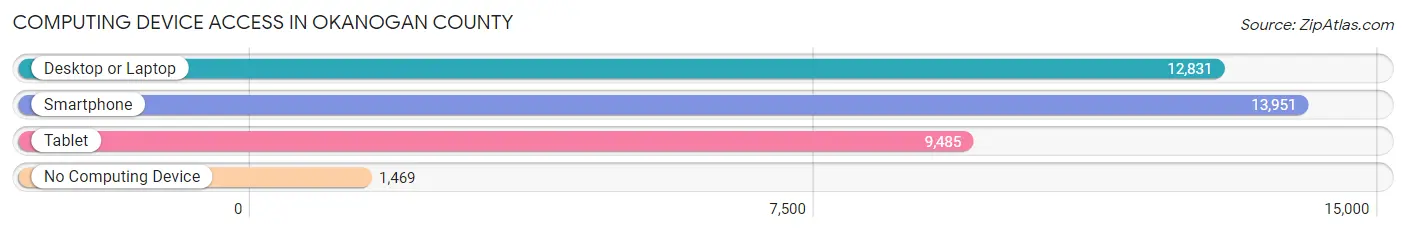
| Device Type | # Households | % Households |
| Desktop or Laptop | 12,831 | 75.4% |
| Smartphone | 13,951 | 82.0% |
| Tablet | 9,485 | 55.8% |
| No Computing Device | 1,469 | 8.6% |
| Total | 17,005 | 100.0% |
Internet Access in Okanogan County
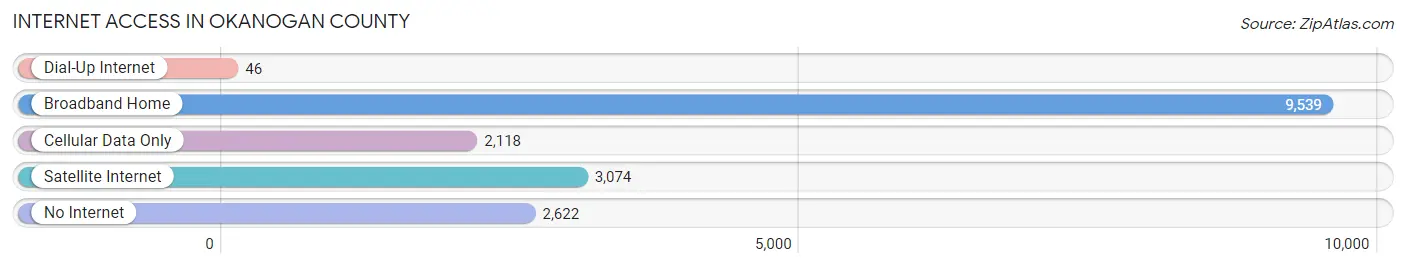
| Internet Type | # Households | % Households |
| Dial-Up Internet | 46 | 0.3% |
| Broadband Home | 9,539 | 56.1% |
| Cellular Data Only | 2,118 | 12.5% |
| Satellite Internet | 3,074 | 18.1% |
| No Internet | 2,622 | 15.4% |
| Total | 17,005 | 100.0% |
Okanogan County Summary
Okanogan County is located in the north-central region of Washington State, and is the largest county in the state by area. It is bordered by the Columbia River to the north, the Okanogan River to the east, the Columbia River to the south, and the Cascade Mountains to the west. The county seat is Okanogan, and the largest city is Omak.
History
The area that is now Okanogan County was originally inhabited by the Okanagan people, a Salish-speaking tribe. The first European settlers arrived in the area in the late 1800s, and the county was officially established in 1888. The county was named after the Okanagan people, and the name is derived from the Salish word for “rendezvous”.
The county was initially an agricultural area, with the main crops being wheat, apples, and hops. In the early 1900s, the area began to develop into a mining and timber industry, and the population began to grow. The county was also home to several Native American reservations, including the Colville Indian Reservation and the Confederated Tribes of the Colville Reservation.
Geography
Okanogan County is located in the north-central region of Washington State, and is the largest county in the state by area. It is bordered by the Columbia River to the north, the Okanogan River to the east, the Columbia River to the south, and the Cascade Mountains to the west. The county is mostly mountainous, with the Okanogan Highlands in the north and the Cascade Mountains in the west. The highest point in the county is Mount Bonaparte, which has an elevation of 8,200 feet.
The county is home to several lakes, including Lake Osoyoos, Lake Chelan, and Lake Pateros. The county also contains several rivers, including the Okanogan River, the Similkameen River, and the Methow River.
Economy
Okanogan County’s economy is largely based on agriculture, forestry, and tourism. The county is home to several wineries, and is a popular destination for outdoor recreation. The county is also home to several Native American reservations, which contribute to the local economy.
The county is home to several large employers, including the Okanogan County Public Utility District, the Okanogan County Sheriff’s Office, and the Okanogan County School District. The county is also home to several small businesses, including restaurants, retail stores, and service providers.
Demographics
As of the 2010 census, the population of Okanogan County was 41,120. The population is largely white (90.2%), with small percentages of Native American (4.2%), Hispanic (2.7%), and Asian (1.2%) populations. The median household income is $41,945, and the median age is 41.
Conclusion
Okanogan County is a large county located in the north-central region of Washington State. It is bordered by the Columbia River to the north, the Okanogan River to the east, the Columbia River to the south, and the Cascade Mountains to the west. The county is largely agricultural, with a focus on forestry, tourism, and Native American reservations. The population is largely white, with small percentages of Native American, Hispanic, and Asian populations. The median household income is $41,945, and the median age is 41.
Common Questions
What is the Total Population of Okanogan County?
Total Population of Okanogan County is 42,336.
What is the Total Male Population of Okanogan County?
Total Male Population of Okanogan County is 21,632.
What is the Total Female Population of Okanogan County?
Total Female Population of Okanogan County is 20,704.
What is the Ratio of Males per 100 Females in Okanogan County?
There are 104.48 Males per 100 Females in Okanogan County.
What is the Ratio of Females per 100 Males in Okanogan County?
There are 95.71 Females per 100 Males in Okanogan County.
What is the Median Population Age in Okanogan County?
Median Population Age in Okanogan County is 42.9 Years.
What is the Average Family Size in Okanogan County
Average Family Size in Okanogan County is 2.8 People.
What is the Average Household Size in Okanogan County
Average Household Size in Okanogan County is 2.4 People.
What is Per Capita Income in Okanogan County?
Per Capita income in Okanogan County is $29,777.
What is the Median Family Income in Okanogan County?
Median Family Income in Okanogan County is $68,585.
What is the Median Household income in Okanogan County?
Median Household Income in Okanogan County is $58,218.
What is Income or Wage Gap in Okanogan County?
Income or Wage Gap in Okanogan County is 18.7%.
Women in Okanogan County earn 81.3 cents for every dollar earned by a man.
What is Family Income Deficit in Okanogan County?
Family Income Deficit in Okanogan County is $10,359.
Families that are below poverty line in Okanogan County earn $10,359 less on average than the poverty threshold level.
What is Inequality or Gini Index in Okanogan County?
Inequality or Gini Index in Okanogan County is 0.42.
How Large is the Labor Force in Okanogan County?
There are 18,982 People in the Labor Forcein in Okanogan County.
What is the Percentage of People in the Labor Force in Okanogan County?
56.3% of People are in the Labor Force in Okanogan County.
What is the Unemployment Rate in Okanogan County?
Unemployment Rate in Okanogan County is 5.8%.