Klickitat County, WA
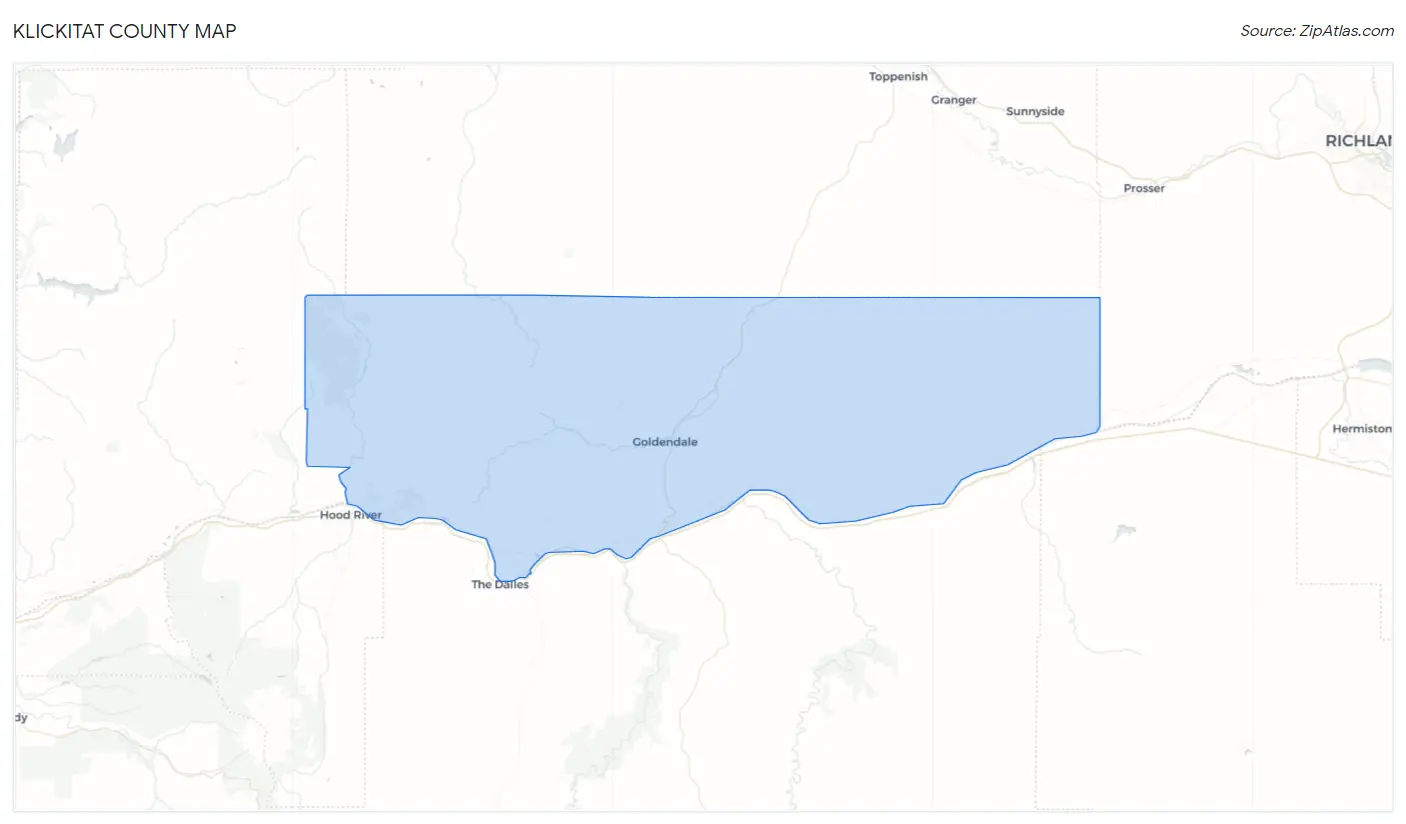
Klickitat County Map
Klickitat County Overview
22,798
TOTAL POPULATION
11,635
MALE POPULATION
11,163
FEMALE POPULATION
104.23
MALES / 100 FEMALES
95.94
FEMALES / 100 MALES
47.0
MEDIAN AGE
2.9
AVG FAMILY SIZE
2.3
AVG HOUSEHOLD SIZE
$38,760
PER CAPITA INCOME
$80,000
AVG FAMILY INCOME
$66,581
AVG HOUSEHOLD INCOME
39.2%
WAGE / INCOME GAP [ % ]
60.8¢/ $1
WAGE / INCOME GAP [ $ ]
$9,945
FAMILY INCOME DEFICIT
0.46
INEQUALITY / GINI INDEX
10,258
LABOR FORCE [ PEOPLE ]
53.8%
PERCENT IN LABOR FORCE
6.9%
UNEMPLOYMENT RATE
Klickitat County Area Codes
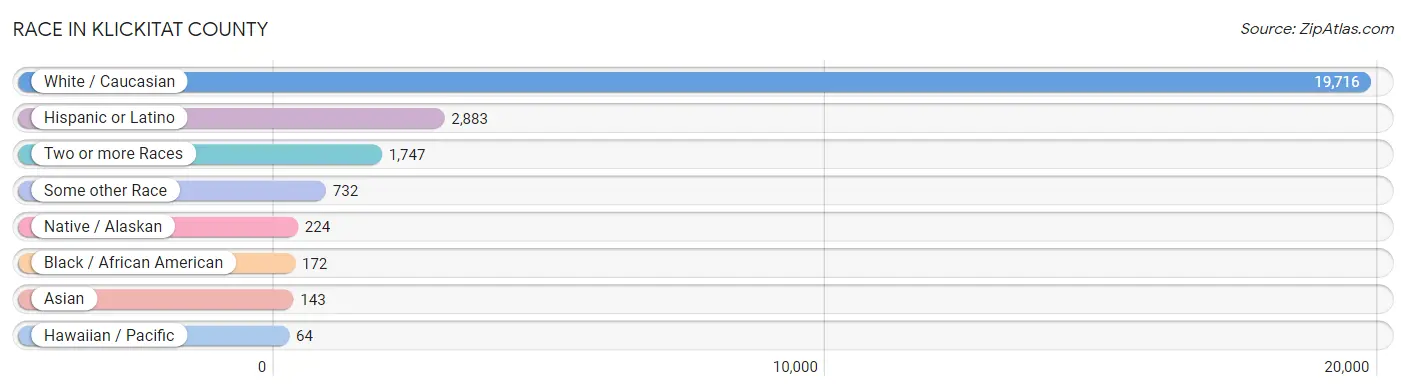
Race in Klickitat County
The most populous races in Klickitat County are White / Caucasian (19,716 | 86.5%), Hispanic or Latino (2,883 | 12.7%), and Two or more Races (1,747 | 7.7%).
| Race | # Population | % Population |
| Asian | 143 | 0.6% |
| Black / African American | 172 | 0.7% |
| Hawaiian / Pacific | 64 | 0.3% |
| Hispanic or Latino | 2,883 | 12.7% |
| Native / Alaskan | 224 | 1.0% |
| White / Caucasian | 19,716 | 86.5% |
| Two or more Races | 1,747 | 7.7% |
| Some other Race | 732 | 3.2% |
| Total | 22,798 | 100.0% |
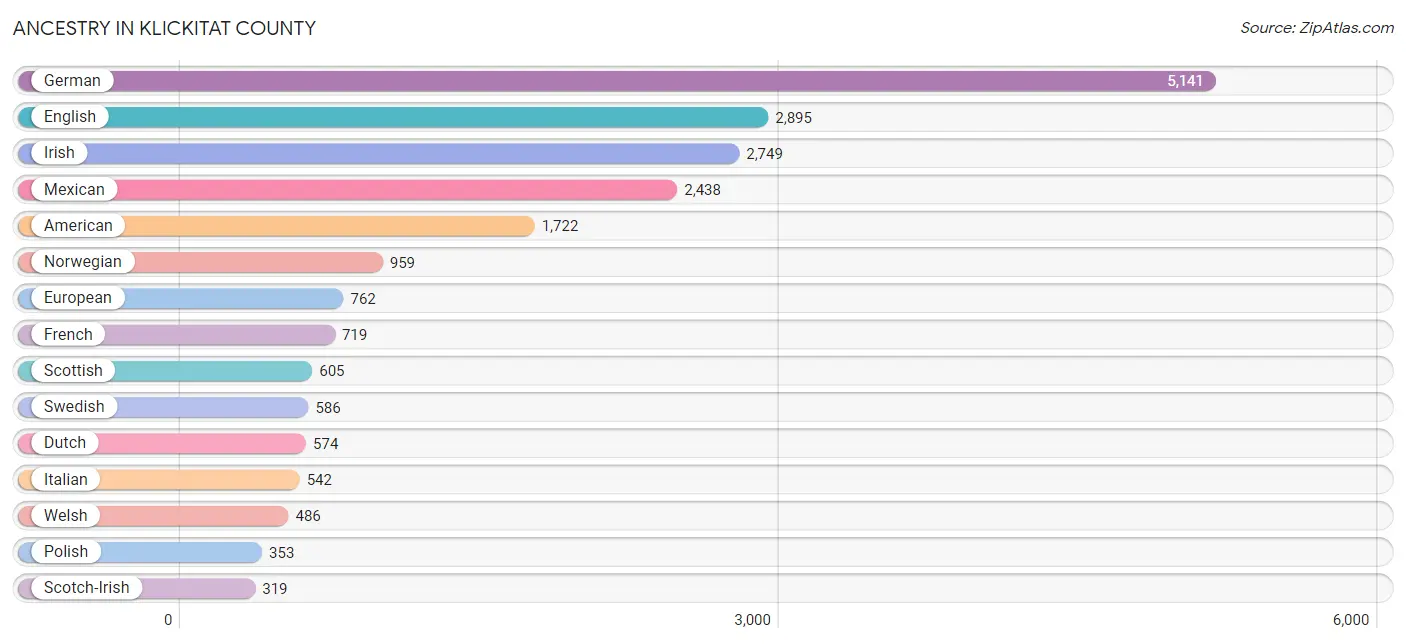
Ancestry in Klickitat County
The most populous ancestries reported in Klickitat County are German (5,141 | 22.6%), English (2,895 | 12.7%), Irish (2,749 | 12.1%), Mexican (2,438 | 10.7%), and American (1,722 | 7.5%), together accounting for 65.6% of all Klickitat County residents.
| Ancestry | # Population | % Population |
| African | 3 | 0.0% |
| American | 1,722 | 7.5% |
| Arab | 64 | 0.3% |
| Argentinean | 27 | 0.1% |
| Armenian | 5 | 0.0% |
| Australian | 9 | 0.0% |
| Austrian | 11 | 0.1% |
| Basque | 11 | 0.1% |
| Bhutanese | 76 | 0.3% |
| Blackfeet | 22 | 0.1% |
| British | 205 | 0.9% |
| Bulgarian | 4 | 0.0% |
| Burmese | 11 | 0.1% |
| Cambodian | 10 | 0.0% |
| Canadian | 61 | 0.3% |
| Central American | 168 | 0.7% |
| Cherokee | 52 | 0.2% |
| Chickasaw | 2 | 0.0% |
| Chilean | 5 | 0.0% |
| Chippewa | 62 | 0.3% |
| Choctaw | 1 | 0.0% |
| Colombian | 28 | 0.1% |
| Colville | 43 | 0.2% |
| Costa Rican | 10 | 0.0% |
| Creek | 19 | 0.1% |
| Croatian | 21 | 0.1% |
| Cuban | 26 | 0.1% |
| Czech | 201 | 0.9% |
| Danish | 254 | 1.1% |
| Delaware | 32 | 0.1% |
| Dominican | 5 | 0.0% |
| Dutch | 574 | 2.5% |
| Eastern European | 26 | 0.1% |
| Egyptian | 13 | 0.1% |
| English | 2,895 | 12.7% |
| Estonian | 8 | 0.0% |
| European | 762 | 3.3% |
| Finnish | 208 | 0.9% |
| French | 719 | 3.2% |
| French American Indian | 6 | 0.0% |
| French Canadian | 146 | 0.6% |
| German | 5,141 | 22.6% |
| Ghanaian | 1 | 0.0% |
| Greek | 64 | 0.3% |
| Guamanian / Chamorro | 4 | 0.0% |
| Guatemalan | 3 | 0.0% |
| Haitian | 84 | 0.4% |
| Honduran | 155 | 0.7% |
| Hungarian | 83 | 0.4% |
| Indian (Asian) | 33 | 0.1% |
| Inupiat | 100 | 0.4% |
| Irish | 2,749 | 12.1% |
| Italian | 542 | 2.4% |
| Korean | 37 | 0.2% |
| Latvian | 2 | 0.0% |
| Mexican | 2,438 | 10.7% |
| Mongolian | 110 | 0.5% |
| Native Hawaiian | 70 | 0.3% |
| Nigerian | 11 | 0.1% |
| Northern European | 86 | 0.4% |
| Norwegian | 959 | 4.2% |
| Ottawa | 39 | 0.2% |
| Paiute | 17 | 0.1% |
| Pakistani | 17 | 0.1% |
| Pennsylvania German | 12 | 0.1% |
| Polish | 353 | 1.5% |
| Portuguese | 152 | 0.7% |
| Pueblo | 11 | 0.1% |
| Puerto Rican | 27 | 0.1% |
| Romanian | 139 | 0.6% |
| Russian | 59 | 0.3% |
| Samoan | 4 | 0.0% |
| Scandinavian | 168 | 0.7% |
| Scotch-Irish | 319 | 1.4% |
| Scottish | 605 | 2.6% |
| Serbian | 32 | 0.1% |
| Sioux | 4 | 0.0% |
| Slovak | 14 | 0.1% |
| Slovene | 3 | 0.0% |
| South American | 63 | 0.3% |
| Spaniard | 23 | 0.1% |
| Spanish | 69 | 0.3% |
| Subsaharan African | 15 | 0.1% |
| Swedish | 586 | 2.6% |
| Swiss | 203 | 0.9% |
| Syrian | 51 | 0.2% |
| Thai | 31 | 0.1% |
| Tlingit-Haida | 110 | 0.5% |
| Turkish | 10 | 0.0% |
| Ukrainian | 10 | 0.0% |
| Welsh | 486 | 2.1% |
| Yakama | 113 | 0.5% |
| Yugoslavian | 13 | 0.1% |
| Yup'ik | 27 | 0.1% | View All 94 Rows |
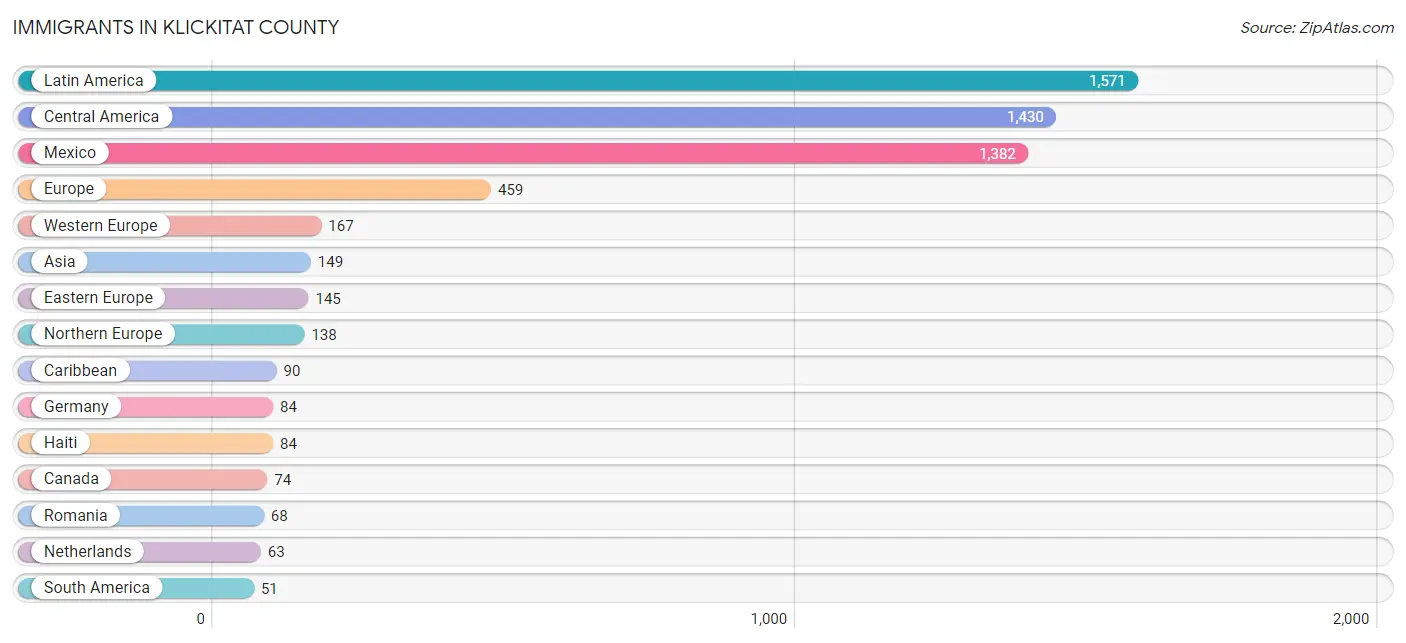
Immigrants in Klickitat County
The most numerous immigrant groups reported in Klickitat County came from Latin America (1,571 | 6.9%), Central America (1,430 | 6.3%), Mexico (1,382 | 6.1%), Europe (459 | 2.0%), and Western Europe (167 | 0.7%), together accounting for 22.0% of all Klickitat County residents.
| Immigration Origin | # Population | % Population |
| Africa | 39 | 0.2% |
| Argentina | 20 | 0.1% |
| Asia | 149 | 0.6% |
| Australia | 9 | 0.0% |
| Austria | 11 | 0.1% |
| Bulgaria | 4 | 0.0% |
| Canada | 74 | 0.3% |
| Caribbean | 90 | 0.4% |
| Central America | 1,430 | 6.3% |
| Chile | 5 | 0.0% |
| China | 12 | 0.1% |
| Colombia | 26 | 0.1% |
| Czechoslovakia | 43 | 0.2% |
| Denmark | 13 | 0.1% |
| Dominican Republic | 5 | 0.0% |
| Eastern Africa | 2 | 0.0% |
| Eastern Asia | 45 | 0.2% |
| Eastern Europe | 145 | 0.6% |
| Egypt | 13 | 0.1% |
| England | 16 | 0.1% |
| Europe | 459 | 2.0% |
| France | 9 | 0.0% |
| Germany | 84 | 0.4% |
| Haiti | 84 | 0.4% |
| Honduras | 48 | 0.2% |
| India | 31 | 0.1% |
| Indonesia | 3 | 0.0% |
| Italy | 9 | 0.0% |
| Japan | 33 | 0.1% |
| Latin America | 1,571 | 6.9% |
| Malaysia | 24 | 0.1% |
| Mexico | 1,382 | 6.1% |
| Morocco | 8 | 0.0% |
| Netherlands | 63 | 0.3% |
| Northern Africa | 21 | 0.1% |
| Northern Europe | 138 | 0.6% |
| Norway | 48 | 0.2% |
| Oceania | 12 | 0.1% |
| Philippines | 13 | 0.1% |
| Romania | 68 | 0.3% |
| Russia | 30 | 0.1% |
| South Africa | 16 | 0.1% |
| South America | 51 | 0.2% |
| South Central Asia | 31 | 0.1% |
| South Eastern Asia | 40 | 0.2% |
| Southern Europe | 9 | 0.0% |
| Trinidad and Tobago | 1 | 0.0% |
| Turkey | 33 | 0.1% |
| Western Asia | 33 | 0.1% |
| Western Europe | 167 | 0.7% | View All 50 Rows |
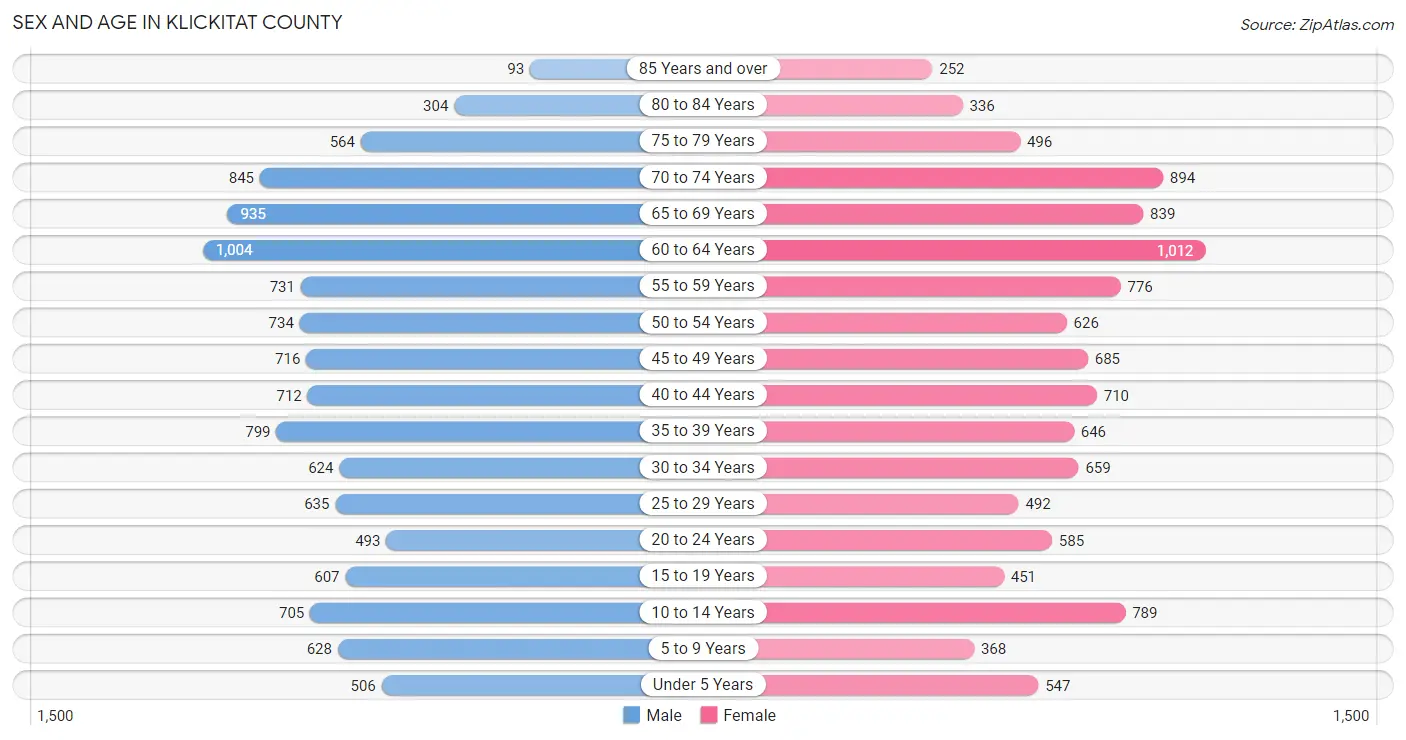
Sex and Age in Klickitat County
Sex and Age in Klickitat County
The most populous age groups in Klickitat County are 60 to 64 Years (1,004 | 8.6%) for men and 60 to 64 Years (1,012 | 9.1%) for women.
| Age Bracket | Male | Female |
| Under 5 Years | 506 (4.3%) | 547 (4.9%) |
| 5 to 9 Years | 628 (5.4%) | 368 (3.3%) |
| 10 to 14 Years | 705 (6.1%) | 789 (7.1%) |
| 15 to 19 Years | 607 (5.2%) | 451 (4.0%) |
| 20 to 24 Years | 493 (4.2%) | 585 (5.2%) |
| 25 to 29 Years | 635 (5.5%) | 492 (4.4%) |
| 30 to 34 Years | 624 (5.4%) | 659 (5.9%) |
| 35 to 39 Years | 799 (6.9%) | 646 (5.8%) |
| 40 to 44 Years | 712 (6.1%) | 710 (6.4%) |
| 45 to 49 Years | 716 (6.1%) | 685 (6.1%) |
| 50 to 54 Years | 734 (6.3%) | 626 (5.6%) |
| 55 to 59 Years | 731 (6.3%) | 776 (7.0%) |
| 60 to 64 Years | 1,004 (8.6%) | 1,012 (9.1%) |
| 65 to 69 Years | 935 (8.0%) | 839 (7.5%) |
| 70 to 74 Years | 845 (7.3%) | 894 (8.0%) |
| 75 to 79 Years | 564 (4.9%) | 496 (4.4%) |
| 80 to 84 Years | 304 (2.6%) | 336 (3.0%) |
| 85 Years and over | 93 (0.8%) | 252 (2.3%) |
| Total | 11,635 (100.0%) | 11,163 (100.0%) |
Families and Households in Klickitat County
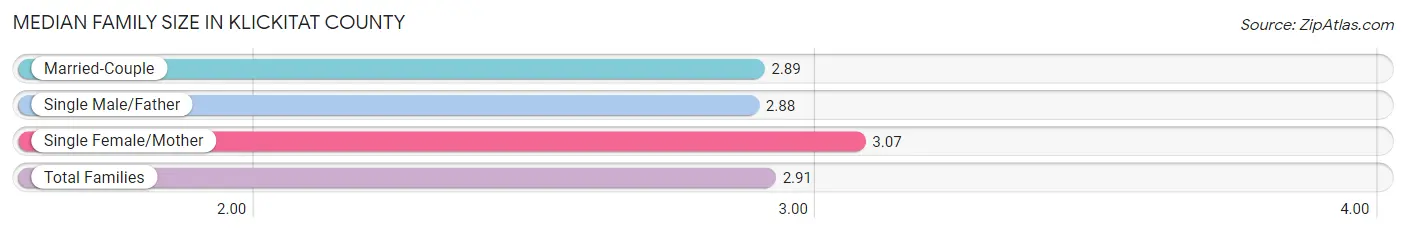
Median Family Size in Klickitat County
The median family size in Klickitat County is 2.91 persons per family, with single female/mother families (644 | 11.2%) accounting for the largest median family size of 3.07 persons per family. On the other hand, single male/father families (337 | 5.8%) represent the smallest median family size with 2.88 persons per family.
| Family Type | # Families | Family Size |
| Married-Couple | 4,797 (83.0%) | 2.89 |
| Single Male/Father | 337 (5.8%) | 2.88 |
| Single Female/Mother | 644 (11.2%) | 3.07 |
| Total Families | 5,778 (100.0%) | 2.91 |
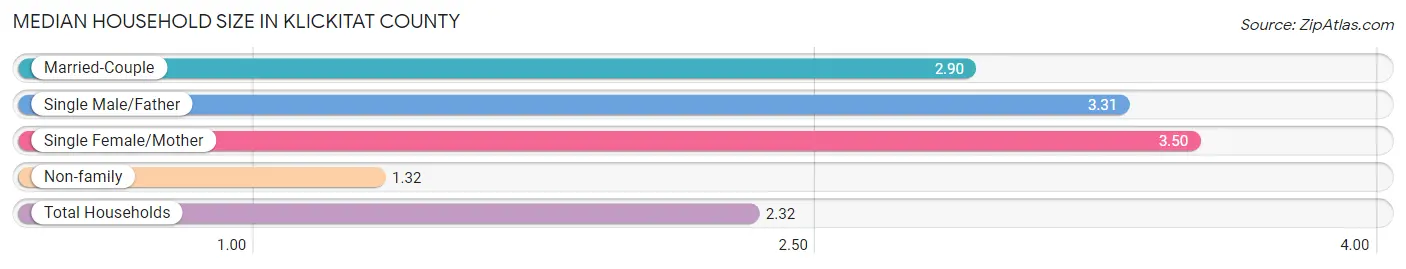
Median Household Size in Klickitat County
The median household size in Klickitat County is 2.32 persons per household, with single female/mother households (644 | 6.7%) accounting for the largest median household size of 3.5 persons per household. non-family households (3,840 | 39.9%) represent the smallest median household size with 1.32 persons per household.
| Household Type | # Households | Household Size |
| Married-Couple | 4,797 (49.9%) | 2.90 |
| Single Male/Father | 337 (3.5%) | 3.31 |
| Single Female/Mother | 644 (6.7%) | 3.50 |
| Non-family | 3,840 (39.9%) | 1.32 |
| Total Households | 9,618 (100.0%) | 2.32 |
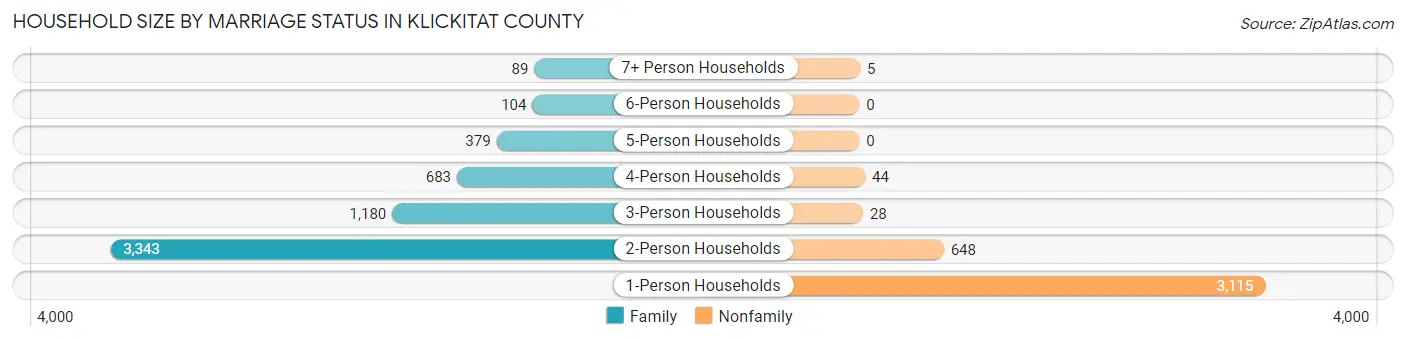
Household Size by Marriage Status in Klickitat County
Out of a total of 9,618 households in Klickitat County, 5,778 (60.1%) are family households, while 3,840 (39.9%) are nonfamily households. The most numerous type of family households are 2-person households, comprising 3,343, and the most common type of nonfamily households are 1-person households, comprising 3,115.
| Household Size | Family Households | Nonfamily Households |
| 1-Person Households | - | 3,115 (32.4%) |
| 2-Person Households | 3,343 (34.8%) | 648 (6.7%) |
| 3-Person Households | 1,180 (12.3%) | 28 (0.3%) |
| 4-Person Households | 683 (7.1%) | 44 (0.5%) |
| 5-Person Households | 379 (3.9%) | 0 (0.0%) |
| 6-Person Households | 104 (1.1%) | 0 (0.0%) |
| 7+ Person Households | 89 (0.9%) | 5 (0.1%) |
| Total | 5,778 (60.1%) | 3,840 (39.9%) |
Female Fertility in Klickitat County
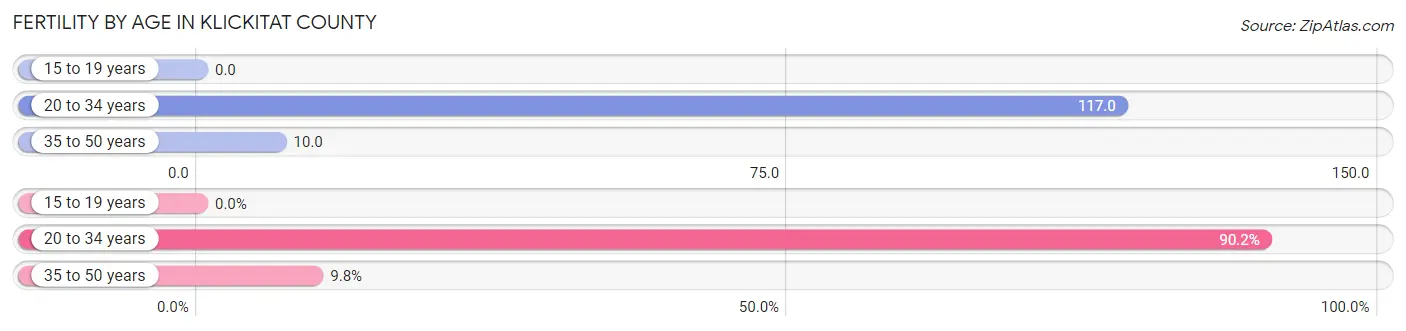
Fertility by Age in Klickitat County
Average fertility rate in Klickitat County is 53.0 births per 1,000 women. Women in the age bracket of 20 to 34 years have the highest fertility rate with 117.0 births per 1,000 women. Women in the age bracket of 20 to 34 years acount for 90.2% of all women with births.
| Age Bracket | Women with Births | Births / 1,000 Women |
| 15 to 19 years | 0 (0.0%) | 0.0 |
| 20 to 34 years | 203 (90.2%) | 117.0 |
| 35 to 50 years | 22 (9.8%) | 10.0 |
| Total | 225 (100.0%) | 53.0 |
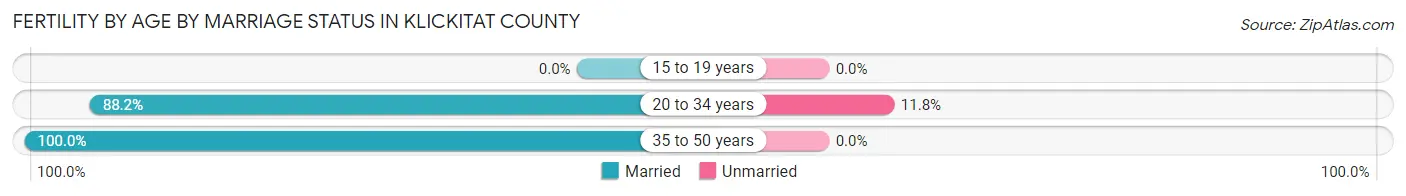
Fertility by Age by Marriage Status in Klickitat County
89.3% of women with births (225) in Klickitat County are married. The highest percentage of unmarried women with births falls into 20 to 34 years age bracket with 11.8% of them unmarried at the time of birth, while the lowest percentage of unmarried women with births belong to 35 to 50 years age bracket with 0.0% of them unmarried.
| Age Bracket | Married | Unmarried |
| 15 to 19 years | 0 (0.0%) | 0 (0.0%) |
| 20 to 34 years | 179 (88.2%) | 24 (11.8%) |
| 35 to 50 years | 22 (100.0%) | 0 (0.0%) |
| Total | 201 (89.3%) | 24 (10.7%) |
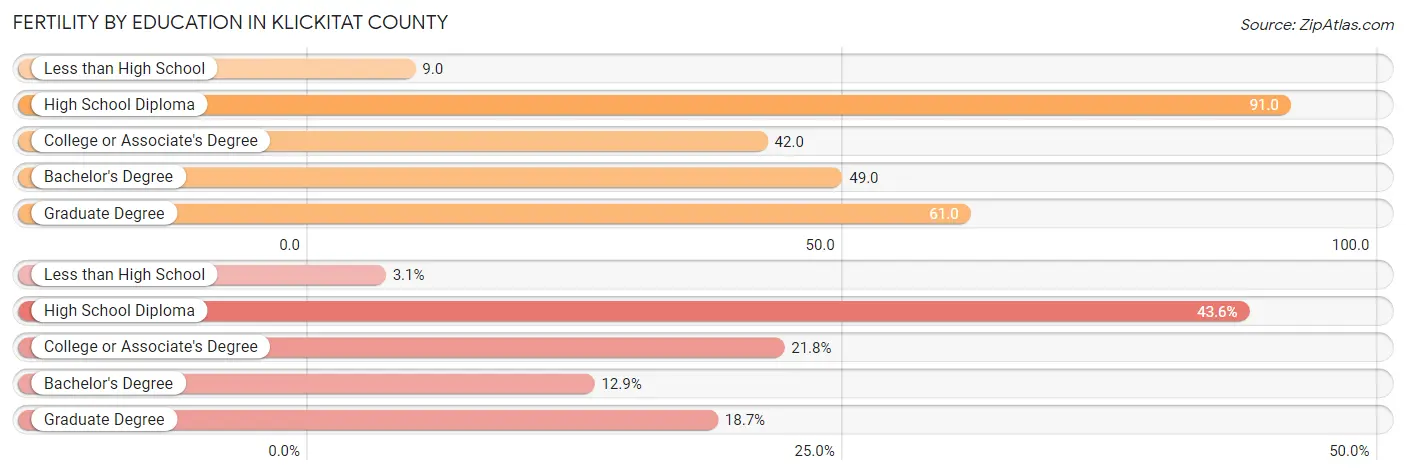
Fertility by Education in Klickitat County
Average fertility rate in Klickitat County is 53.0 births per 1,000 women. Women with the education attainment of high school diploma have the highest fertility rate of 91.0 births per 1,000 women, while women with the education attainment of less than high school have the lowest fertility at 9.0 births per 1,000 women. Women with the education attainment of high school diploma represent 43.6% of all women with births.
| Educational Attainment | Women with Births | Births / 1,000 Women |
| Less than High School | 7 (3.1%) | 9.0 |
| High School Diploma | 98 (43.6%) | 91.0 |
| College or Associate's Degree | 49 (21.8%) | 42.0 |
| Bachelor's Degree | 29 (12.9%) | 49.0 |
| Graduate Degree | 42 (18.7%) | 61.0 |
| Total | 225 (100.0%) | 53.0 |
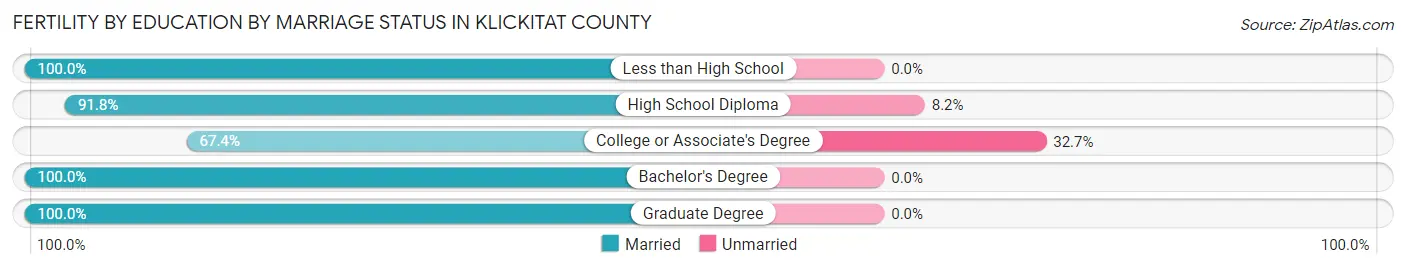
Fertility by Education by Marriage Status in Klickitat County
10.7% of women with births in Klickitat County are unmarried. Women with the educational attainment of less than high school are most likely to be married with 100.0% of them married at childbirth, while women with the educational attainment of college or associate's degree are least likely to be married with 32.7% of them unmarried at childbirth.
| Educational Attainment | Married | Unmarried |
| Less than High School | 7 (100.0%) | 0 (0.0%) |
| High School Diploma | 90 (91.8%) | 8 (8.2%) |
| College or Associate's Degree | 33 (67.3%) | 16 (32.7%) |
| Bachelor's Degree | 29 (100.0%) | 0 (0.0%) |
| Graduate Degree | 42 (100.0%) | 0 (0.0%) |
| Total | 201 (89.3%) | 24 (10.7%) |
Income in Klickitat County
Income Overview in Klickitat County
Per Capita Income in Klickitat County is $38,760, while median incomes of families and households are $80,000 and $66,581 respectively.
| Characteristic | Number | Measure |
| Per Capita Income | 22,798 | $38,760 |
| Median Family Income | 5,778 | $80,000 |
| Mean Family Income | 5,778 | $99,146 |
| Median Household Income | 9,618 | $66,581 |
| Mean Household Income | 9,618 | $88,585 |
| Income Deficit | 5,778 | $9,945 |
| Wage / Income Gap (%) | 22,798 | 39.23% |
| Wage / Income Gap ($) | 22,798 | 60.77¢ per $1 |
| Gini / Inequality Index | 22,798 | 0.46 |
Earnings by Sex in Klickitat County
Average Earnings in Klickitat County are $40,245, $51,821 for men and $31,490 for women, a difference of 39.2%.
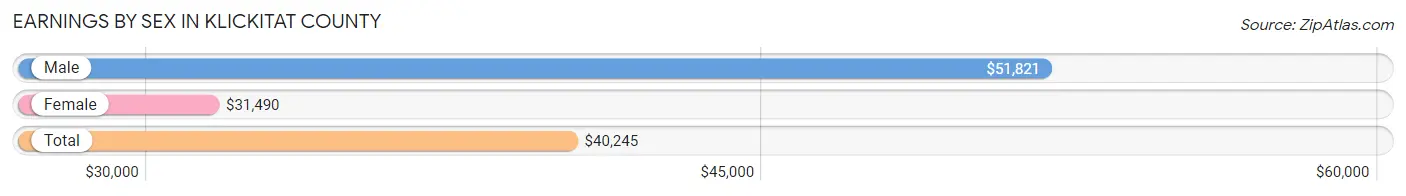
| Sex | Number | Average Earnings |
| Male | 6,123 (56.2%) | $51,821 |
| Female | 4,763 (43.8%) | $31,490 |
| Total | 10,886 (100.0%) | $40,245 |
Earnings by Sex by Income Bracket in Klickitat County
The most common earnings brackets in Klickitat County are $100,000+ for men (1,041 | 17.0%) and $75,000 to $99,999 for women (480 | 10.1%).
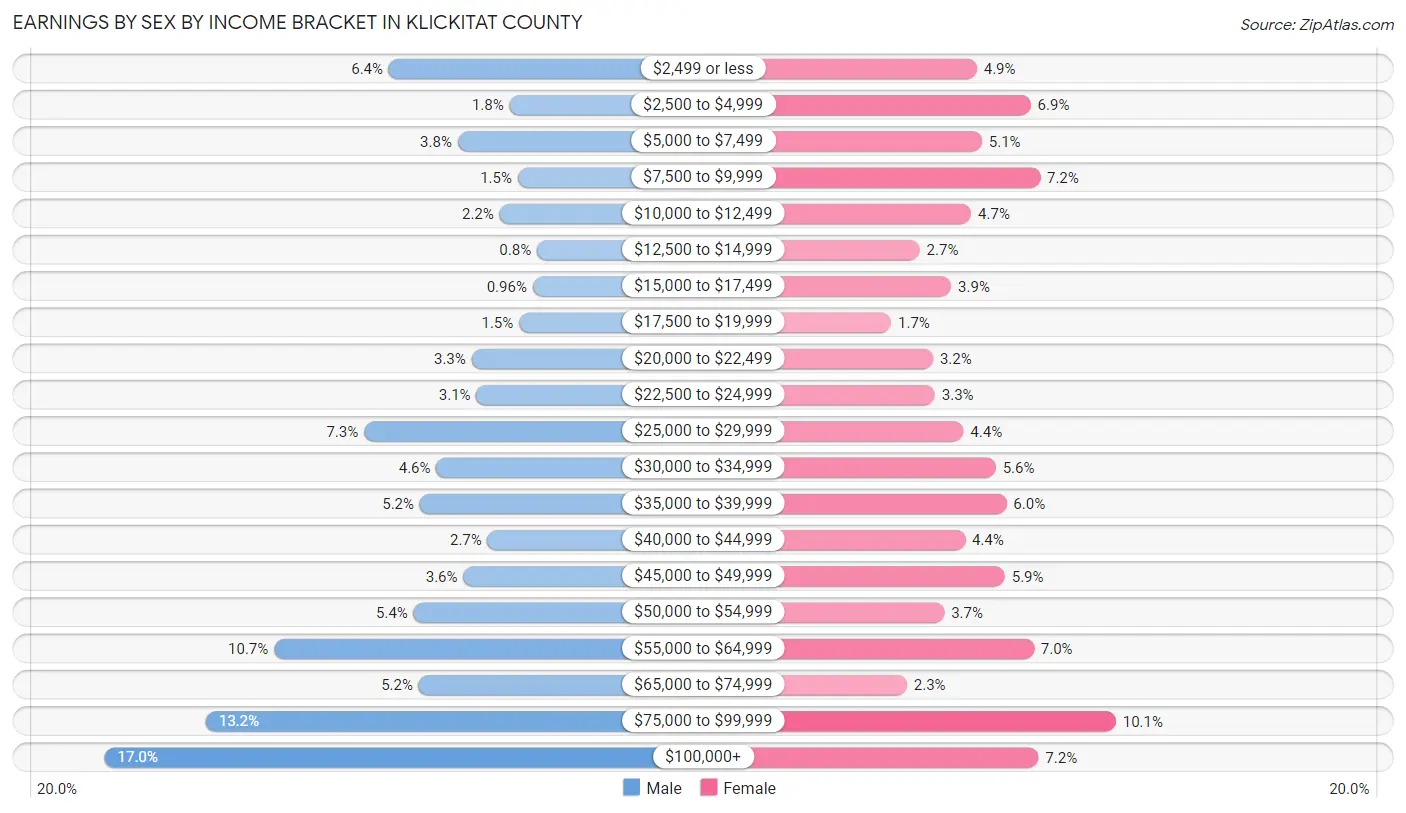
| Income | Male | Female |
| $2,499 or less | 389 (6.4%) | 232 (4.9%) |
| $2,500 to $4,999 | 112 (1.8%) | 328 (6.9%) |
| $5,000 to $7,499 | 231 (3.8%) | 241 (5.1%) |
| $7,500 to $9,999 | 93 (1.5%) | 345 (7.2%) |
| $10,000 to $12,499 | 135 (2.2%) | 222 (4.7%) |
| $12,500 to $14,999 | 49 (0.8%) | 130 (2.7%) |
| $15,000 to $17,499 | 59 (1.0%) | 186 (3.9%) |
| $17,500 to $19,999 | 90 (1.5%) | 79 (1.7%) |
| $20,000 to $22,499 | 199 (3.3%) | 154 (3.2%) |
| $22,500 to $24,999 | 188 (3.1%) | 157 (3.3%) |
| $25,000 to $29,999 | 446 (7.3%) | 208 (4.4%) |
| $30,000 to $34,999 | 280 (4.6%) | 266 (5.6%) |
| $35,000 to $39,999 | 318 (5.2%) | 285 (6.0%) |
| $40,000 to $44,999 | 162 (2.6%) | 211 (4.4%) |
| $45,000 to $49,999 | 218 (3.6%) | 282 (5.9%) |
| $50,000 to $54,999 | 332 (5.4%) | 174 (3.6%) |
| $55,000 to $64,999 | 652 (10.6%) | 334 (7.0%) |
| $65,000 to $74,999 | 320 (5.2%) | 107 (2.2%) |
| $75,000 to $99,999 | 809 (13.2%) | 480 (10.1%) |
| $100,000+ | 1,041 (17.0%) | 342 (7.2%) |
| Total | 6,123 (100.0%) | 4,763 (100.0%) |
Earnings by Sex by Educational Attainment in Klickitat County
Average earnings in Klickitat County are $55,333 for men and $36,203 for women, a difference of 34.6%. Men with an educational attainment of graduate degree enjoy the highest average annual earnings of $87,031, while those with less than high school education earn the least with $30,984. Women with an educational attainment of graduate degree earn the most with the average annual earnings of $68,750, while those with high school diploma education have the smallest earnings of $22,745.
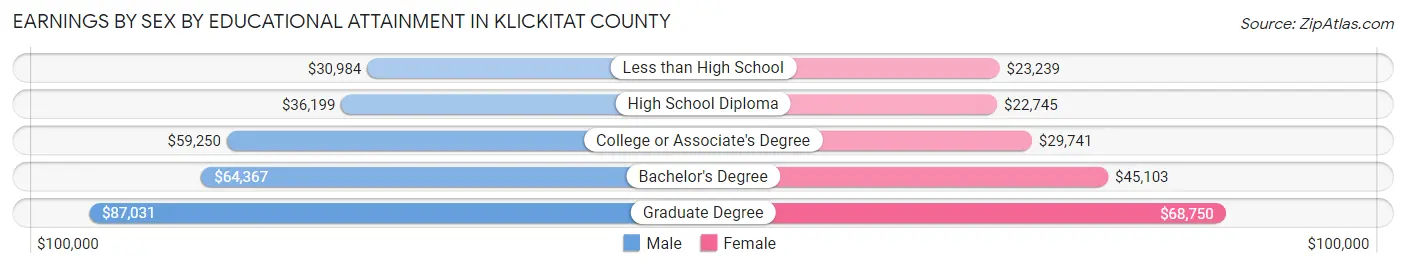
| Educational Attainment | Male Income | Female Income |
| Less than High School | $30,984 | $23,239 |
| High School Diploma | $36,199 | $22,745 |
| College or Associate's Degree | $59,250 | $29,741 |
| Bachelor's Degree | $64,367 | $45,103 |
| Graduate Degree | $87,031 | $68,750 |
| Total | $55,333 | $36,203 |
Family Income in Klickitat County
Family Income Brackets in Klickitat County
According to the Klickitat County family income data, there are 1,184 families falling into the $100,000 to $149,999 income range, which is the most common income bracket and makes up 20.5% of all families. Conversely, the $10,000 to $14,999 income bracket is the least frequent group with only 156 families (2.7%) belonging to this category.
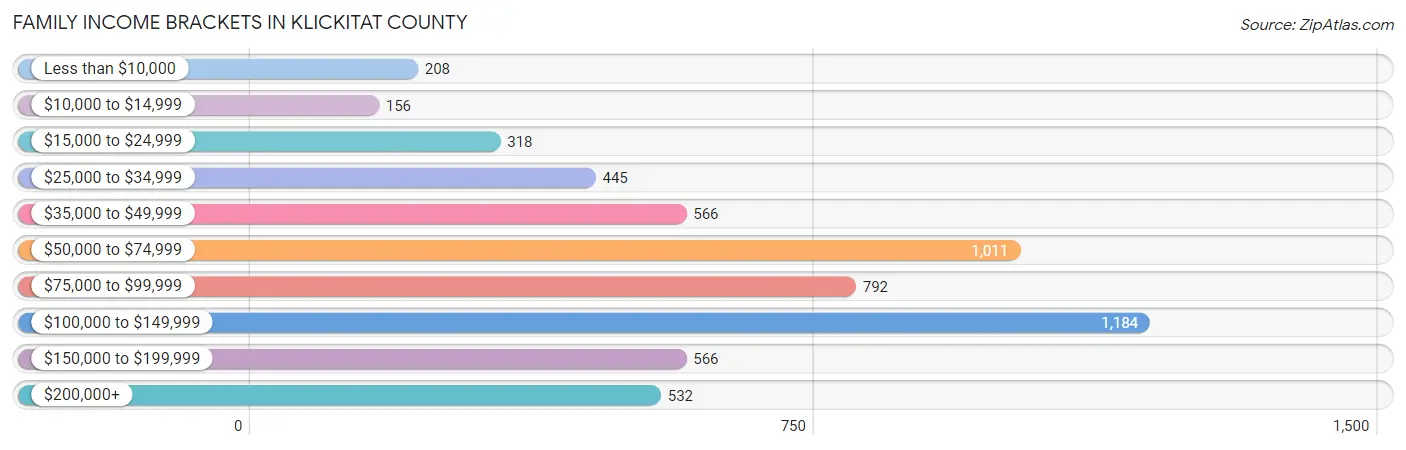
| Income Bracket | # Families | % Families |
| Less than $10,000 | 208 | 3.6% |
| $10,000 to $14,999 | 156 | 2.7% |
| $15,000 to $24,999 | 318 | 5.5% |
| $25,000 to $34,999 | 445 | 7.7% |
| $35,000 to $49,999 | 566 | 9.8% |
| $50,000 to $74,999 | 1,011 | 17.5% |
| $75,000 to $99,999 | 792 | 13.7% |
| $100,000 to $149,999 | 1,184 | 20.5% |
| $150,000 to $199,999 | 566 | 9.8% |
| $200,000+ | 532 | 9.2% |
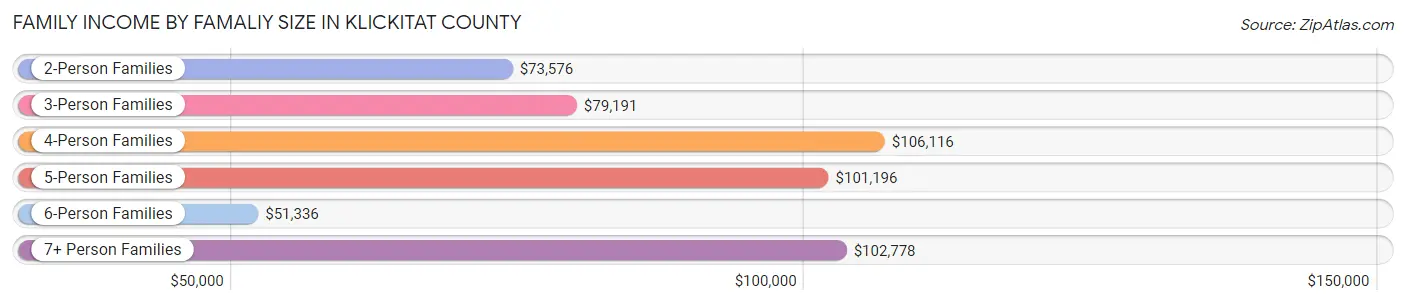
Family Income by Famaliy Size in Klickitat County
4-person families (629 | 10.9%) account for the highest median family income in Klickitat County with $106,116 per family, while 2-person families (3,493 | 60.5%) have the highest median income of $36,788 per family member.
| Income Bracket | # Families | Median Income |
| 2-Person Families | 3,493 (60.5%) | $73,576 |
| 3-Person Families | 1,151 (19.9%) | $79,191 |
| 4-Person Families | 629 (10.9%) | $106,116 |
| 5-Person Families | 314 (5.4%) | $101,196 |
| 6-Person Families | 109 (1.9%) | $51,336 |
| 7+ Person Families | 82 (1.4%) | $102,778 |
| Total | 5,778 (100.0%) | $80,000 |
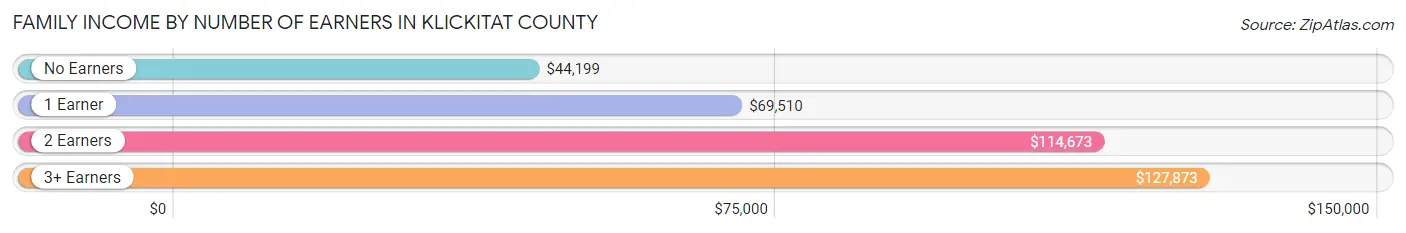
Family Income by Number of Earners in Klickitat County
The median family income in Klickitat County is $80,000, with families comprising 3+ earners (319) having the highest median family income of $127,873, while families with no earners (1,421) have the lowest median family income of $44,199, accounting for 5.5% and 24.6% of families, respectively.
| Number of Earners | # Families | Median Income |
| No Earners | 1,421 (24.6%) | $44,199 |
| 1 Earner | 2,139 (37.0%) | $69,510 |
| 2 Earners | 1,899 (32.9%) | $114,673 |
| 3+ Earners | 319 (5.5%) | $127,873 |
| Total | 5,778 (100.0%) | $80,000 |
Household Income in Klickitat County
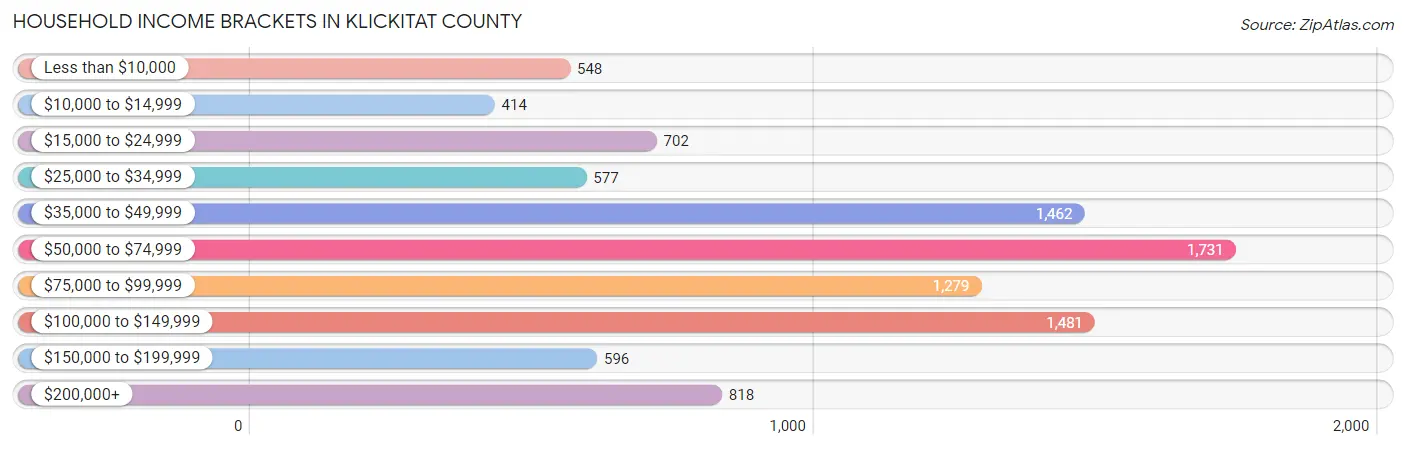
Household Income Brackets in Klickitat County
With 1,731 households falling in the category, the $50,000 to $74,999 income range is the most frequent in Klickitat County, accounting for 18.0% of all households. In contrast, only 414 households (4.3%) fall into the $10,000 to $14,999 income bracket, making it the least populous group.
| Income Bracket | # Households | % Households |
| Less than $10,000 | 548 | 5.7% |
| $10,000 to $14,999 | 414 | 4.3% |
| $15,000 to $24,999 | 702 | 7.3% |
| $25,000 to $34,999 | 577 | 6.0% |
| $35,000 to $49,999 | 1,462 | 15.2% |
| $50,000 to $74,999 | 1,731 | 18.0% |
| $75,000 to $99,999 | 1,279 | 13.3% |
| $100,000 to $149,999 | 1,481 | 15.4% |
| $150,000 to $199,999 | 596 | 6.2% |
| $200,000+ | 818 | 8.5% |
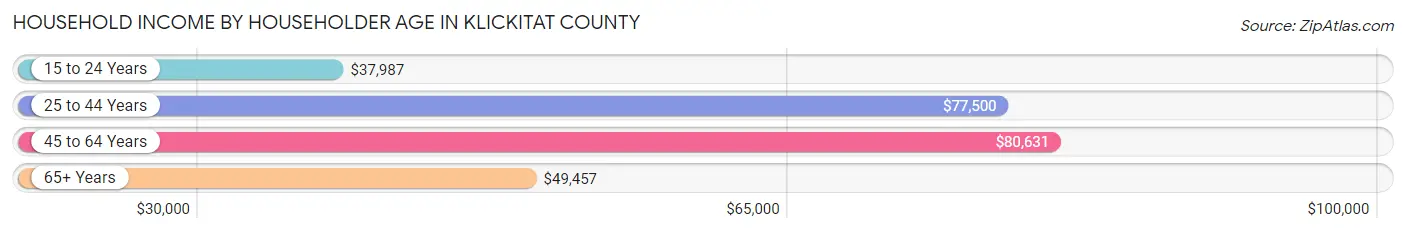
Household Income by Householder Age in Klickitat County
The median household income in Klickitat County is $66,581, with the highest median household income of $80,631 found in the 45 to 64 years age bracket for the primary householder. A total of 3,588 households (37.3%) fall into this category. Meanwhile, the 15 to 24 years age bracket for the primary householder has the lowest median household income of $37,987, with 243 households (2.5%) in this group.
| Income Bracket | # Households | Median Income |
| 15 to 24 Years | 243 (2.5%) | $37,987 |
| 25 to 44 Years | 2,238 (23.3%) | $77,500 |
| 45 to 64 Years | 3,588 (37.3%) | $80,631 |
| 65+ Years | 3,549 (36.9%) | $49,457 |
| Total | 9,618 (100.0%) | $66,581 |
Poverty in Klickitat County
Income Below Poverty by Sex and Age in Klickitat County
With 11.9% poverty level for males and 15.8% for females among the residents of Klickitat County, 6 to 11 year old males and 35 to 44 year old females are the most vulnerable to poverty, with 217 males (26.6%) and 397 females (29.3%) in their respective age groups living below the poverty level.
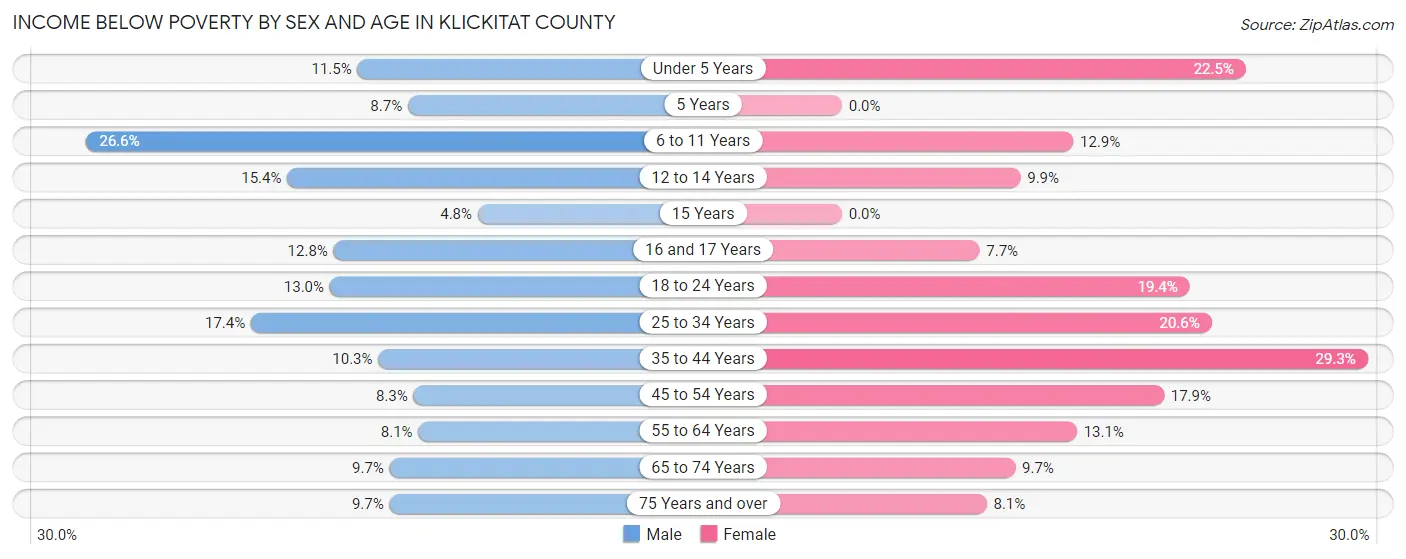
| Age Bracket | Male | Female |
| Under 5 Years | 58 (11.5%) | 123 (22.5%) |
| 5 Years | 9 (8.6%) | 0 (0.0%) |
| 6 to 11 Years | 217 (26.6%) | 72 (12.9%) |
| 12 to 14 Years | 63 (15.4%) | 50 (9.9%) |
| 15 Years | 6 (4.8%) | 0 (0.0%) |
| 16 and 17 Years | 38 (12.8%) | 21 (7.7%) |
| 18 to 24 Years | 85 (13.0%) | 135 (19.4%) |
| 25 to 34 Years | 219 (17.4%) | 237 (20.6%) |
| 35 to 44 Years | 154 (10.3%) | 397 (29.3%) |
| 45 to 54 Years | 121 (8.3%) | 235 (17.9%) |
| 55 to 64 Years | 140 (8.1%) | 233 (13.1%) |
| 65 to 74 Years | 172 (9.7%) | 167 (9.7%) |
| 75 Years and over | 93 (9.7%) | 87 (8.1%) |
| Total | 1,375 (11.9%) | 1,757 (15.8%) |
Income Above Poverty by Sex and Age in Klickitat County
According to the poverty statistics in Klickitat County, males aged 15 years and females aged 5 years are the age groups that are most secure financially, with 95.2% of males and 100.0% of females in these age groups living above the poverty line.
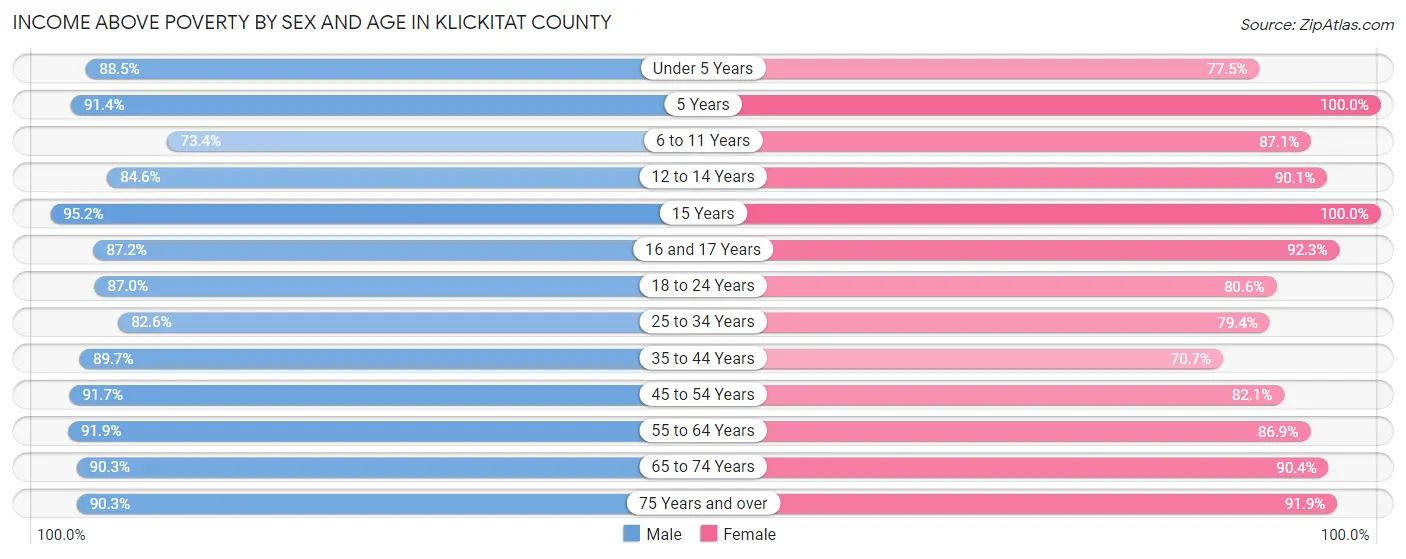
| Age Bracket | Male | Female |
| Under 5 Years | 448 (88.5%) | 424 (77.5%) |
| 5 Years | 95 (91.3%) | 95 (100.0%) |
| 6 to 11 Years | 600 (73.4%) | 487 (87.1%) |
| 12 to 14 Years | 347 (84.6%) | 453 (90.1%) |
| 15 Years | 120 (95.2%) | 62 (100.0%) |
| 16 and 17 Years | 259 (87.2%) | 253 (92.3%) |
| 18 to 24 Years | 569 (87.0%) | 562 (80.6%) |
| 25 to 34 Years | 1,040 (82.6%) | 914 (79.4%) |
| 35 to 44 Years | 1,341 (89.7%) | 959 (70.7%) |
| 45 to 54 Years | 1,329 (91.7%) | 1,076 (82.1%) |
| 55 to 64 Years | 1,595 (91.9%) | 1,549 (86.9%) |
| 65 to 74 Years | 1,607 (90.3%) | 1,564 (90.3%) |
| 75 Years and over | 868 (90.3%) | 993 (91.9%) |
| Total | 10,218 (88.1%) | 9,391 (84.2%) |
Income Below Poverty Among Married-Couple Families in Klickitat County
The poverty statistics for married-couple families in Klickitat County show that 3.7% or 177 of the total 4,797 families live below the poverty line. Families with 5 or more children have the highest poverty rate of 8.3%, comprising of 5 families. On the other hand, families with 1 or 2 children have the lowest poverty rate of 3.0%, which includes 28 families.
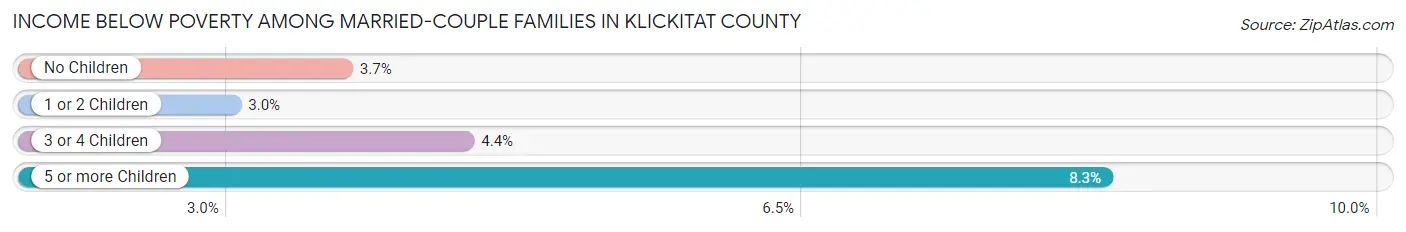
| Children | Above Poverty | Below Poverty |
| No Children | 3,301 (96.3%) | 127 (3.7%) |
| 1 or 2 Children | 898 (97.0%) | 28 (3.0%) |
| 3 or 4 Children | 366 (95.6%) | 17 (4.4%) |
| 5 or more Children | 55 (91.7%) | 5 (8.3%) |
| Total | 4,620 (96.3%) | 177 (3.7%) |
Income Below Poverty Among Single-Parent Households in Klickitat County
According to the poverty data in Klickitat County, 10.4% or 35 single-father households and 46.7% or 301 single-mother households are living below the poverty line. Among single-father households, those with no children have the highest poverty rate, with 18 households (22.5%) experiencing poverty. Likewise, among single-mother households, those with 1 or 2 children have the highest poverty rate, with 268 households (71.5%) falling below the poverty line.
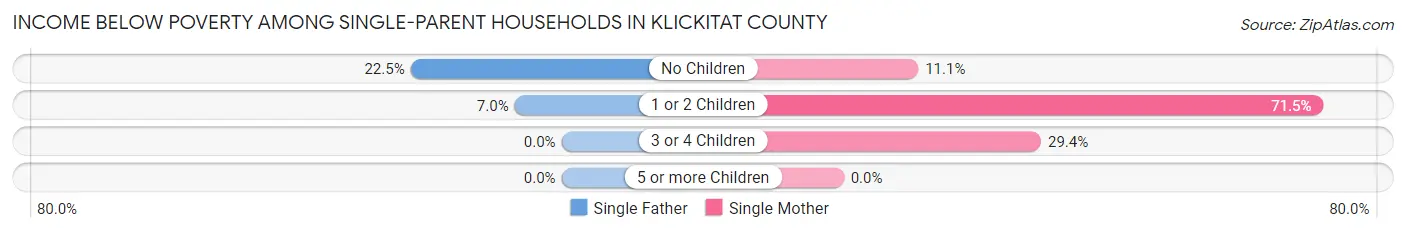
| Children | Single Father | Single Mother |
| No Children | 18 (22.5%) | 28 (11.1%) |
| 1 or 2 Children | 17 (7.0%) | 268 (71.5%) |
| 3 or 4 Children | 0 (0.0%) | 5 (29.4%) |
| 5 or more Children | 0 (0.0%) | 0 (0.0%) |
| Total | 35 (10.4%) | 301 (46.7%) |
Income Below Poverty Among Married-Couple vs Single-Parent Households in Klickitat County
The poverty data for Klickitat County shows that 177 of the married-couple family households (3.7%) and 336 of the single-parent households (34.3%) are living below the poverty level. Within the married-couple family households, those with 5 or more children have the highest poverty rate, with 5 households (8.3%) falling below the poverty line. Among the single-parent households, those with 1 or 2 children have the highest poverty rate, with 285 household (46.1%) living below poverty.
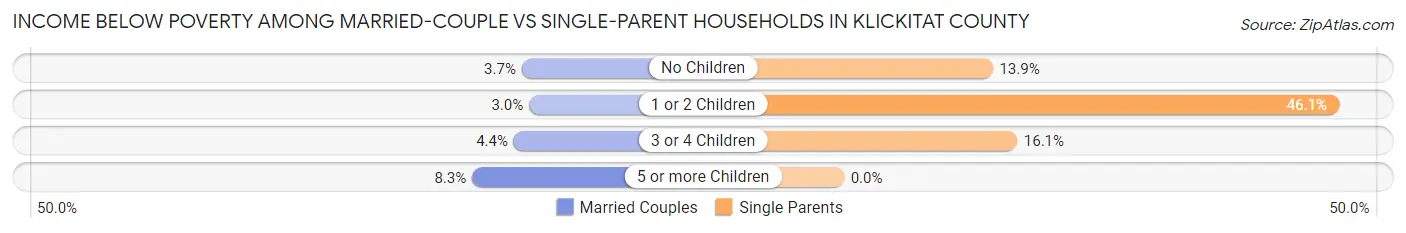
| Children | Married-Couple Families | Single-Parent Households |
| No Children | 127 (3.7%) | 46 (13.9%) |
| 1 or 2 Children | 28 (3.0%) | 285 (46.1%) |
| 3 or 4 Children | 17 (4.4%) | 5 (16.1%) |
| 5 or more Children | 5 (8.3%) | 0 (0.0%) |
| Total | 177 (3.7%) | 336 (34.3%) |
Employment Characteristics in Klickitat County
Employment by Class of Employer in Klickitat County
Among the 9,249 employed individuals in Klickitat County, private company employees (5,138 | 55.5%), local government employees (1,158 | 12.5%), and self-employed (incorporated) (956 | 10.3%) make up the most common classes of employment.
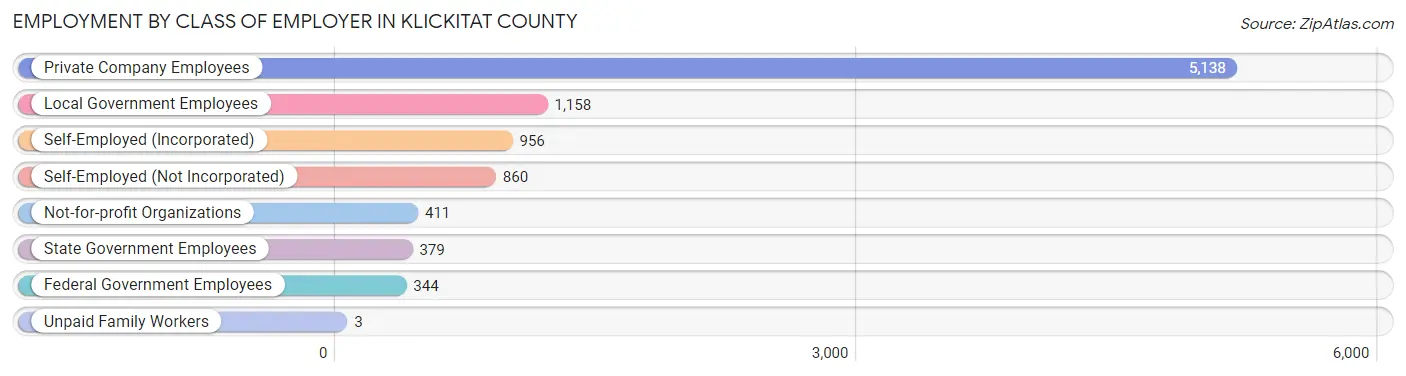
| Employer Class | # Employees | % Employees |
| Private Company Employees | 5,138 | 55.5% |
| Self-Employed (Incorporated) | 956 | 10.3% |
| Self-Employed (Not Incorporated) | 860 | 9.3% |
| Not-for-profit Organizations | 411 | 4.4% |
| Local Government Employees | 1,158 | 12.5% |
| State Government Employees | 379 | 4.1% |
| Federal Government Employees | 344 | 3.7% |
| Unpaid Family Workers | 3 | 0.0% |
| Total | 9,249 | 100.0% |
Employment Status by Age in Klickitat County
According to the labor force statistics for Klickitat County, out of the total population over 16 years of age (19,067), 53.8% or 10,258 individuals are in the labor force, with 6.9% or 708 of them unemployed. The age group with the highest labor force participation rate is 25 to 29 years, with 84.7% or 955 individuals in the labor force. Within the labor force, the 60 to 64 years age range has the highest percentage of unemployed individuals, with 11.2% or 108 of them being unemployed.
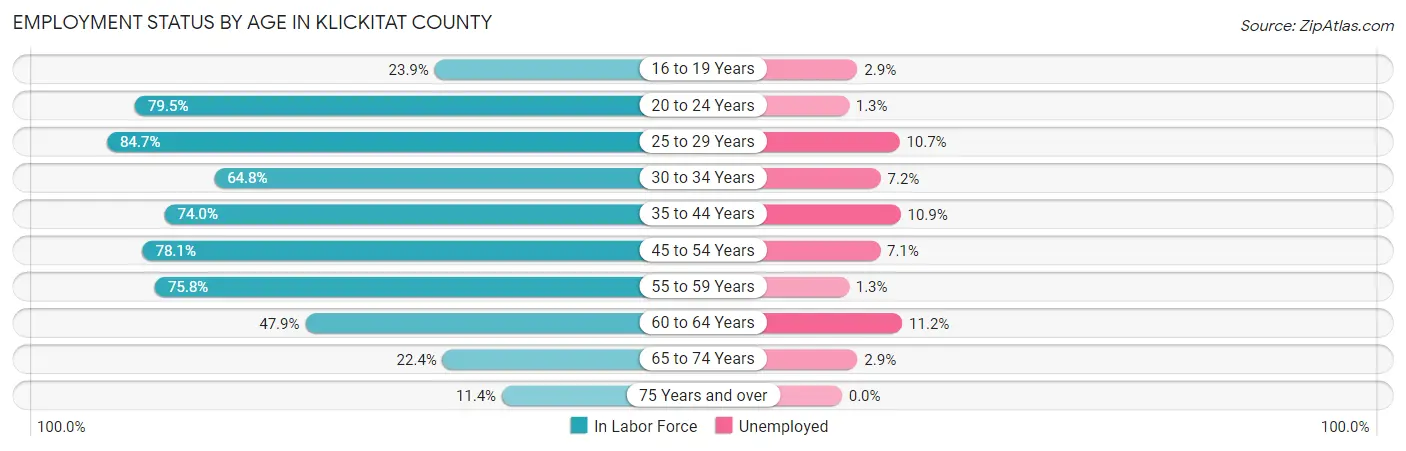
| Age Bracket | In Labor Force | Unemployed |
| 16 to 19 Years | 208 (23.9%) | 6 (2.9%) |
| 20 to 24 Years | 857 (79.5%) | 11 (1.3%) |
| 25 to 29 Years | 955 (84.7%) | 102 (10.7%) |
| 30 to 34 Years | 831 (64.8%) | 60 (7.2%) |
| 35 to 44 Years | 2,122 (74.0%) | 231 (10.9%) |
| 45 to 54 Years | 2,156 (78.1%) | 153 (7.1%) |
| 55 to 59 Years | 1,142 (75.8%) | 15 (1.3%) |
| 60 to 64 Years | 966 (47.9%) | 108 (11.2%) |
| 65 to 74 Years | 787 (22.4%) | 23 (2.9%) |
| 75 Years and over | 233 (11.4%) | 0 (0.0%) |
| Total | 10,258 (53.8%) | 708 (6.9%) |
Employment Status by Educational Attainment in Klickitat County
According to labor force statistics for Klickitat County, 70.7% of individuals (8,174) out of the total population between 25 and 64 years of age (11,561) are in the labor force, with 8.2% or 670 of them being unemployed. The group with the highest labor force participation rate are those with the educational attainment of bachelor's degree or higher, with 76.9% or 3,080 individuals in the labor force. Within the labor force, individuals with high school diploma education have the highest percentage of unemployment, with 12.4% or 229 of them being unemployed.
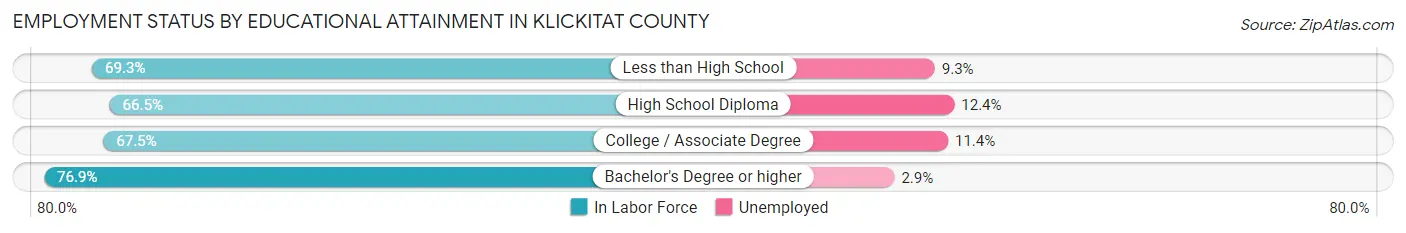
| Educational Attainment | In Labor Force | Unemployed |
| Less than High School | 900 (69.3%) | 121 (9.3%) |
| High School Diploma | 1,845 (66.5%) | 344 (12.4%) |
| College / Associate Degree | 2,351 (67.5%) | 397 (11.4%) |
| Bachelor's Degree or higher | 3,080 (76.9%) | 116 (2.9%) |
| Total | 8,174 (70.7%) | 948 (8.2%) |
Employment Occupations by Sex in Klickitat County
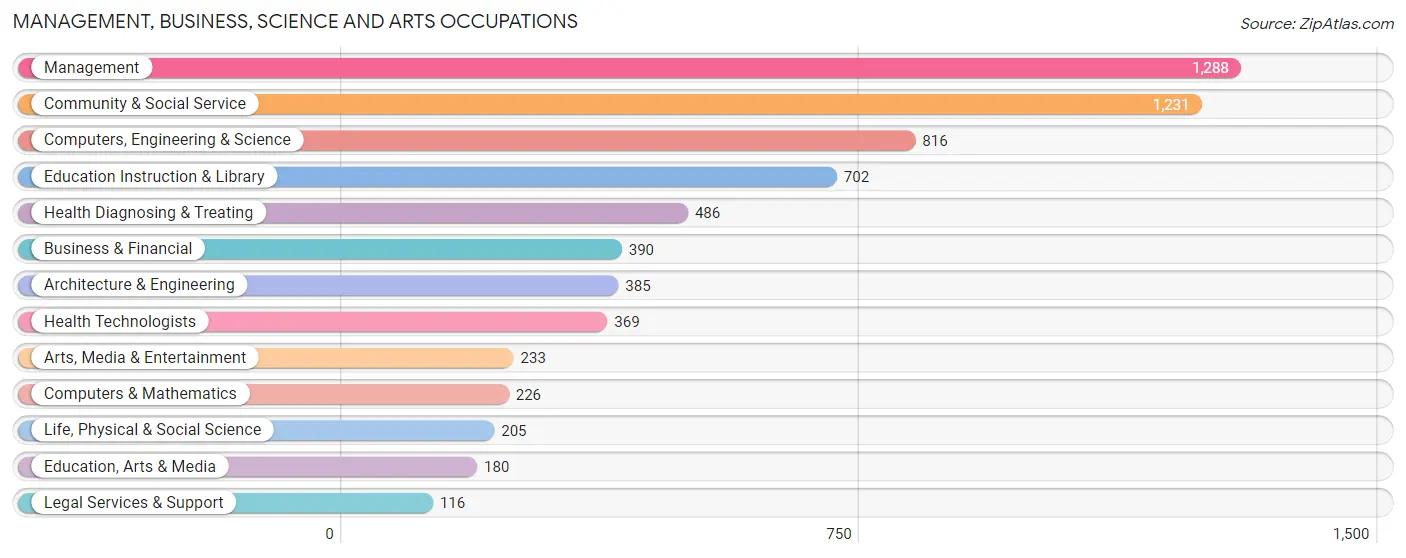
Management, Business, Science and Arts Occupations
The most common Management, Business, Science and Arts occupations in Klickitat County are Management (1,288 | 13.5%), Community & Social Service (1,231 | 12.9%), Computers, Engineering & Science (816 | 8.6%), Education Instruction & Library (702 | 7.3%), and Health Diagnosing & Treating (486 | 5.1%).
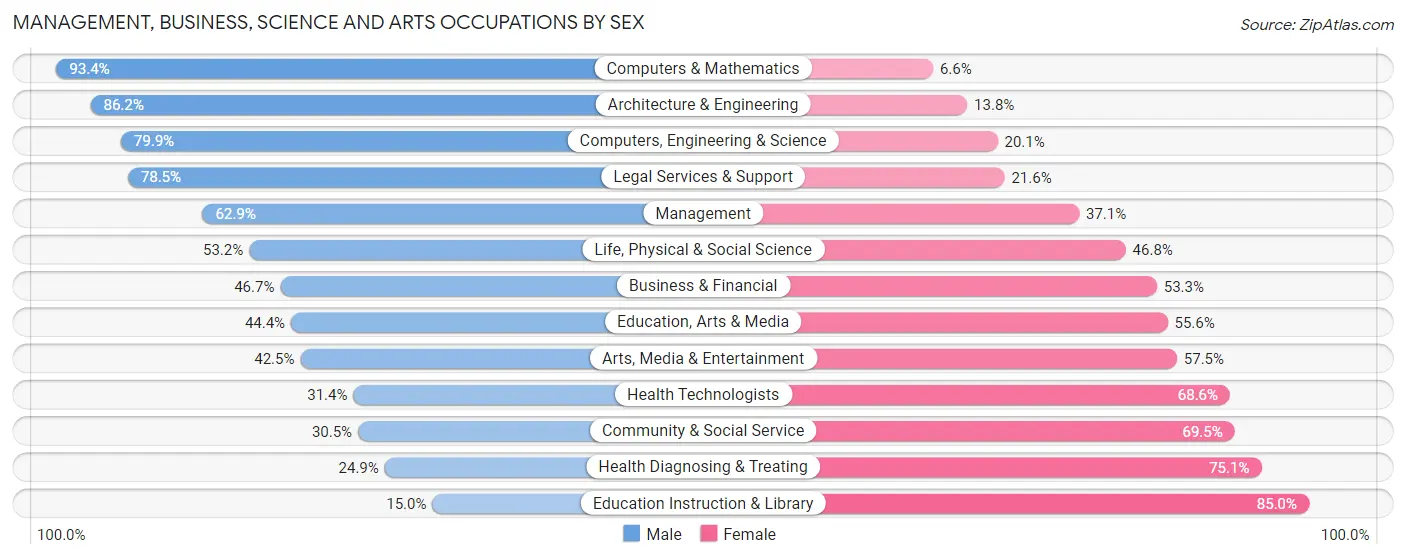
Management, Business, Science and Arts Occupations by Sex
Within the Management, Business, Science and Arts occupations in Klickitat County, the most male-oriented occupations are Computers & Mathematics (93.4%), Architecture & Engineering (86.2%), and Computers, Engineering & Science (79.9%), while the most female-oriented occupations are Education Instruction & Library (85.0%), Health Diagnosing & Treating (75.1%), and Community & Social Service (69.5%).
| Occupation | Male | Female |
| Management | 810 (62.9%) | 478 (37.1%) |
| Business & Financial | 182 (46.7%) | 208 (53.3%) |
| Computers, Engineering & Science | 652 (79.9%) | 164 (20.1%) |
| Computers & Mathematics | 211 (93.4%) | 15 (6.6%) |
| Architecture & Engineering | 332 (86.2%) | 53 (13.8%) |
| Life, Physical & Social Science | 109 (53.2%) | 96 (46.8%) |
| Community & Social Service | 375 (30.5%) | 856 (69.5%) |
| Education, Arts & Media | 80 (44.4%) | 100 (55.6%) |
| Legal Services & Support | 91 (78.4%) | 25 (21.5%) |
| Education Instruction & Library | 105 (15.0%) | 597 (85.0%) |
| Arts, Media & Entertainment | 99 (42.5%) | 134 (57.5%) |
| Health Diagnosing & Treating | 121 (24.9%) | 365 (75.1%) |
| Health Technologists | 116 (31.4%) | 253 (68.6%) |
| Total (Category) | 2,140 (50.8%) | 2,071 (49.2%) |
| Total (Overall) | 5,330 (55.8%) | 4,217 (44.2%) |
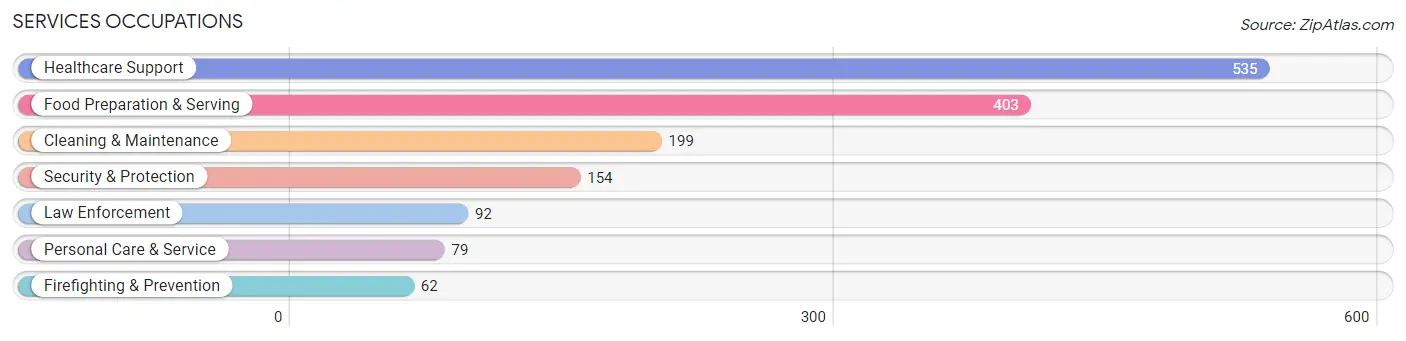
Services Occupations
The most common Services occupations in Klickitat County are Healthcare Support (535 | 5.6%), Food Preparation & Serving (403 | 4.2%), Cleaning & Maintenance (199 | 2.1%), Security & Protection (154 | 1.6%), and Law Enforcement (92 | 1.0%).
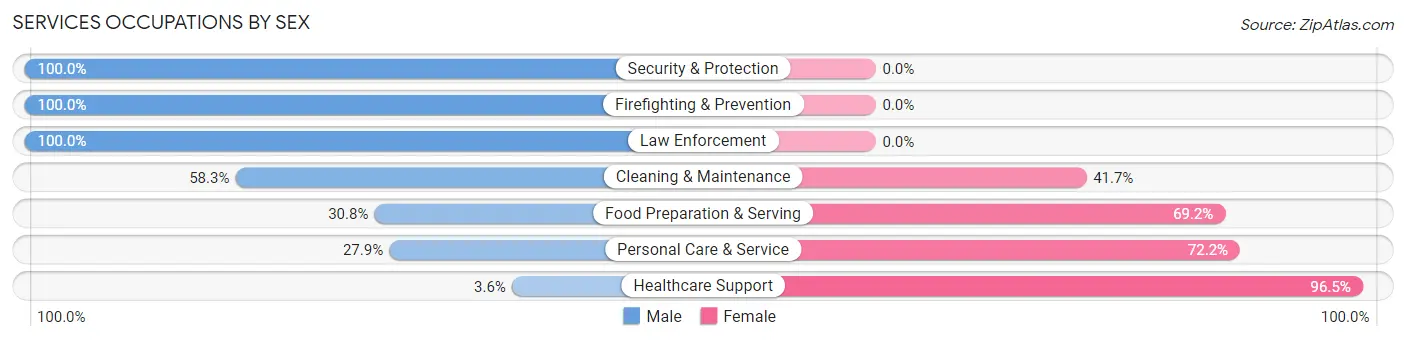
Services Occupations by Sex
Within the Services occupations in Klickitat County, the most male-oriented occupations are Security & Protection (100.0%), Firefighting & Prevention (100.0%), and Law Enforcement (100.0%), while the most female-oriented occupations are Healthcare Support (96.5%), Personal Care & Service (72.2%), and Food Preparation & Serving (69.2%).
| Occupation | Male | Female |
| Healthcare Support | 19 (3.5%) | 516 (96.5%) |
| Security & Protection | 154 (100.0%) | 0 (0.0%) |
| Firefighting & Prevention | 62 (100.0%) | 0 (0.0%) |
| Law Enforcement | 92 (100.0%) | 0 (0.0%) |
| Food Preparation & Serving | 124 (30.8%) | 279 (69.2%) |
| Cleaning & Maintenance | 116 (58.3%) | 83 (41.7%) |
| Personal Care & Service | 22 (27.9%) | 57 (72.2%) |
| Total (Category) | 435 (31.8%) | 935 (68.2%) |
| Total (Overall) | 5,330 (55.8%) | 4,217 (44.2%) |
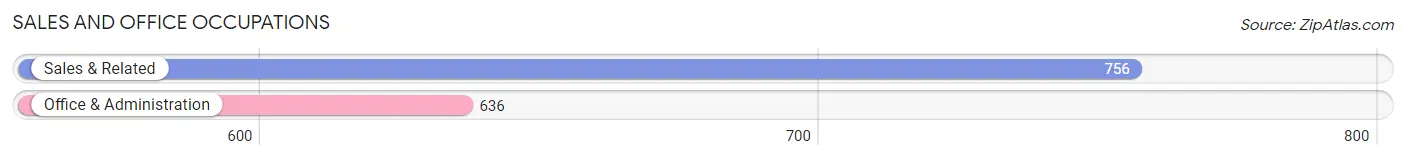
Sales and Office Occupations
The most common Sales and Office occupations in Klickitat County are Sales & Related (756 | 7.9%), and Office & Administration (636 | 6.7%).
Sales and Office Occupations by Sex
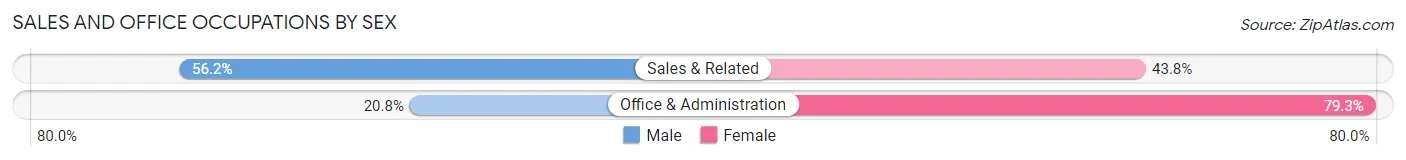
| Occupation | Male | Female |
| Sales & Related | 425 (56.2%) | 331 (43.8%) |
| Office & Administration | 132 (20.7%) | 504 (79.2%) |
| Total (Category) | 557 (40.0%) | 835 (60.0%) |
| Total (Overall) | 5,330 (55.8%) | 4,217 (44.2%) |
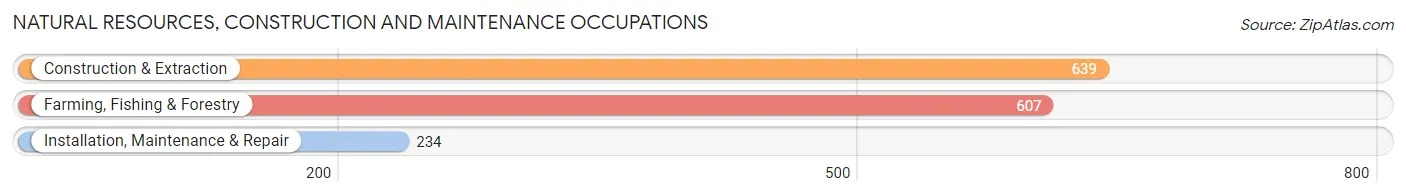
Natural Resources, Construction and Maintenance Occupations
The most common Natural Resources, Construction and Maintenance occupations in Klickitat County are Construction & Extraction (639 | 6.7%), Farming, Fishing & Forestry (607 | 6.4%), and Installation, Maintenance & Repair (234 | 2.5%).
Natural Resources, Construction and Maintenance Occupations by Sex
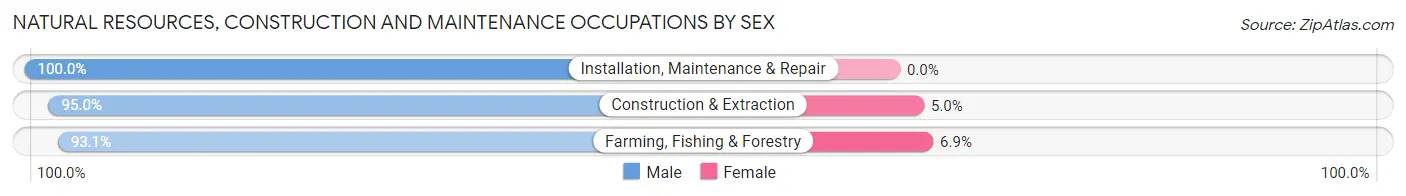
| Occupation | Male | Female |
| Farming, Fishing & Forestry | 565 (93.1%) | 42 (6.9%) |
| Construction & Extraction | 607 (95.0%) | 32 (5.0%) |
| Installation, Maintenance & Repair | 234 (100.0%) | 0 (0.0%) |
| Total (Category) | 1,406 (95.0%) | 74 (5.0%) |
| Total (Overall) | 5,330 (55.8%) | 4,217 (44.2%) |
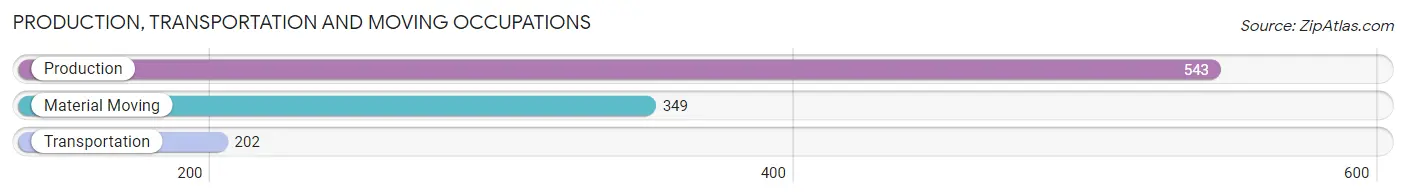
Production, Transportation and Moving Occupations
The most common Production, Transportation and Moving occupations in Klickitat County are Production (543 | 5.7%), Material Moving (349 | 3.7%), and Transportation (202 | 2.1%).
Production, Transportation and Moving Occupations by Sex
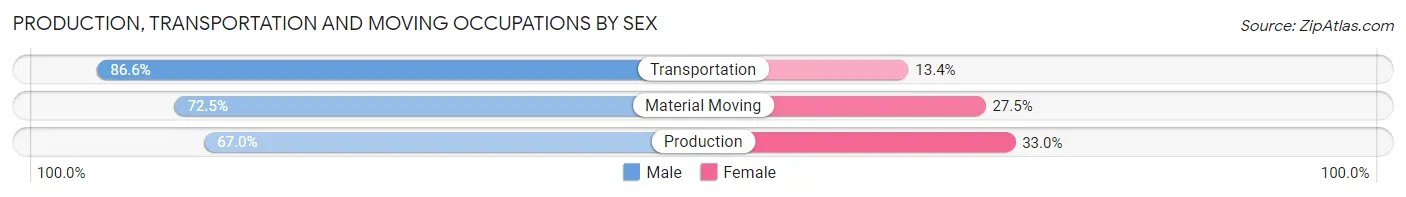
| Occupation | Male | Female |
| Production | 364 (67.0%) | 179 (33.0%) |
| Transportation | 175 (86.6%) | 27 (13.4%) |
| Material Moving | 253 (72.5%) | 96 (27.5%) |
| Total (Category) | 792 (72.4%) | 302 (27.6%) |
| Total (Overall) | 5,330 (55.8%) | 4,217 (44.2%) |
Employment Industries by Sex in Klickitat County
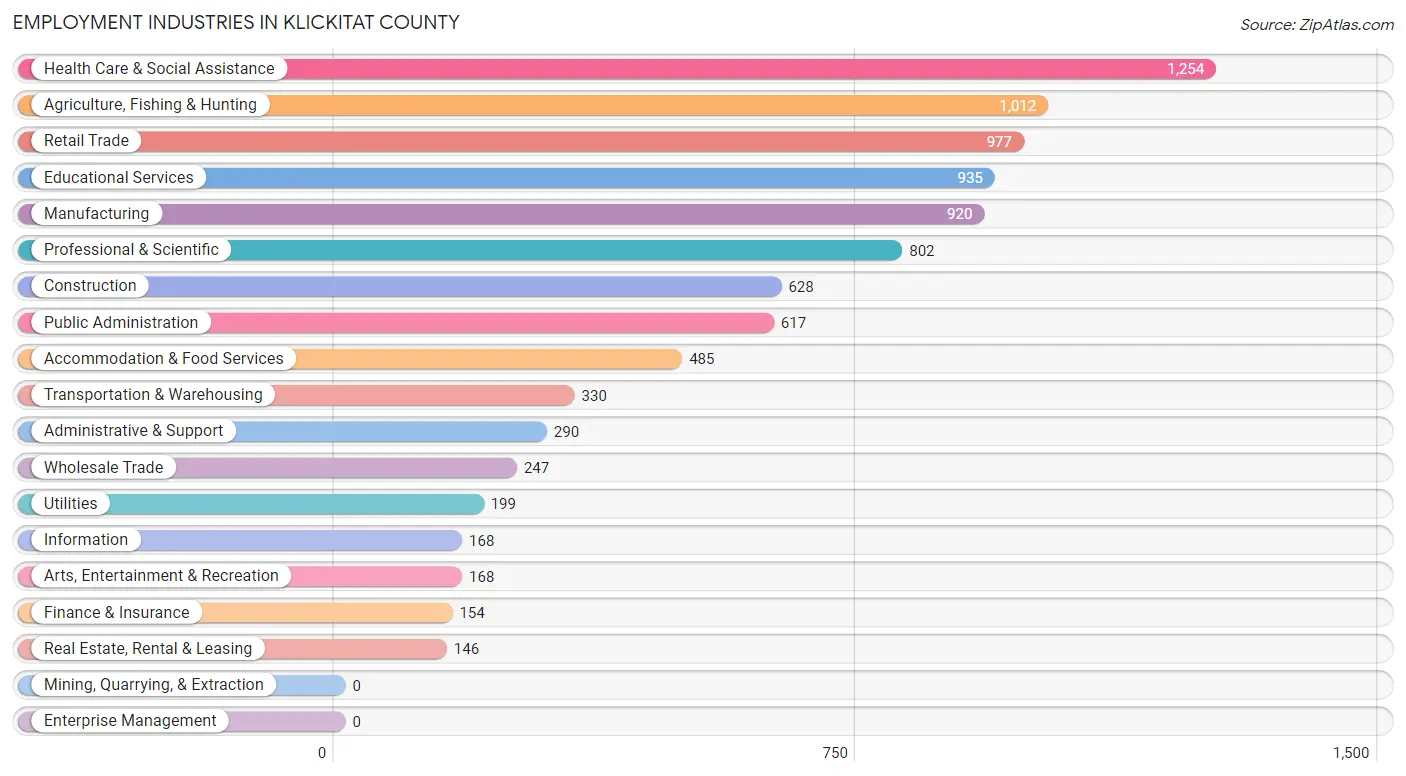
Employment Industries in Klickitat County
The major employment industries in Klickitat County include Health Care & Social Assistance (1,254 | 13.1%), Agriculture, Fishing & Hunting (1,012 | 10.6%), Retail Trade (977 | 10.2%), Educational Services (935 | 9.8%), and Manufacturing (920 | 9.6%).
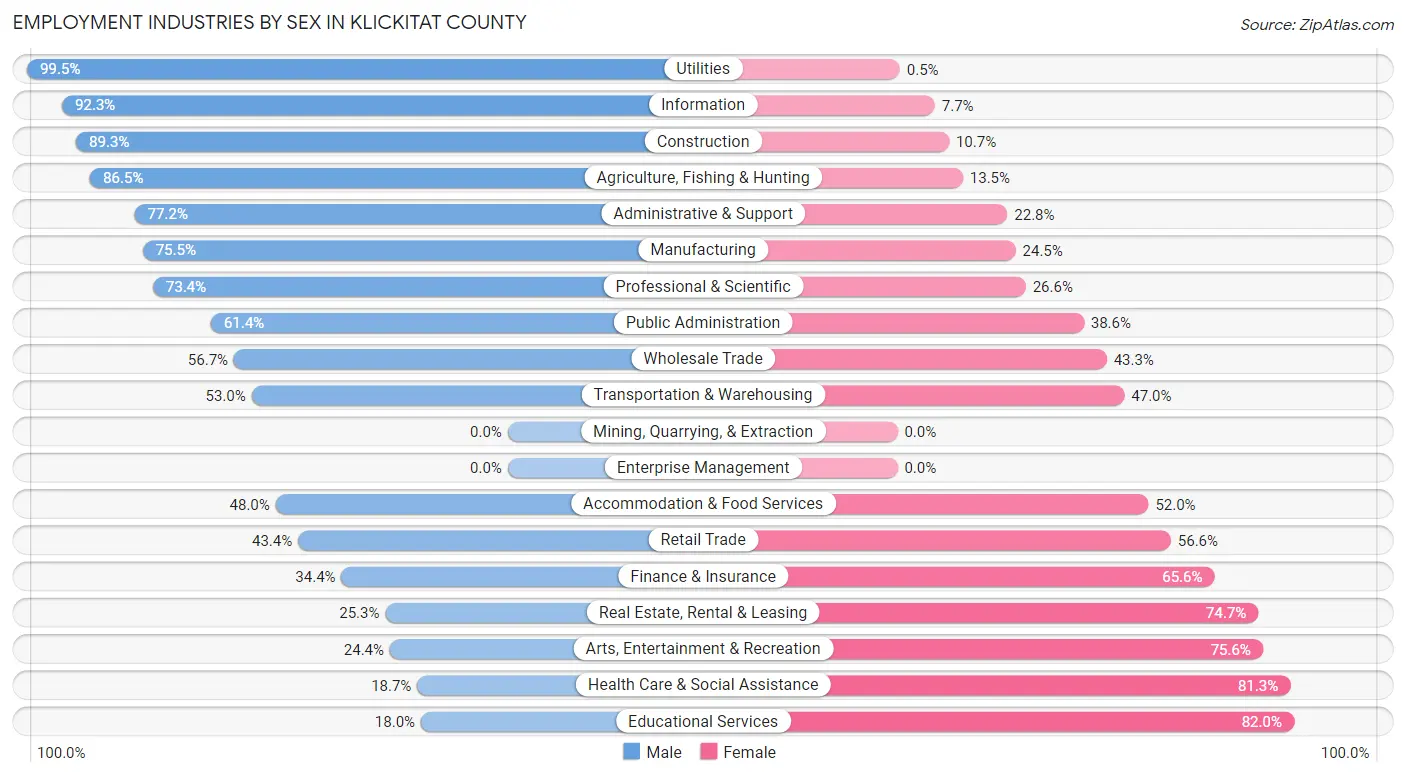
Employment Industries by Sex in Klickitat County
The Klickitat County industries that see more men than women are Utilities (99.5%), Information (92.3%), and Construction (89.3%), whereas the industries that tend to have a higher number of women are Educational Services (82.0%), Health Care & Social Assistance (81.3%), and Arts, Entertainment & Recreation (75.6%).
| Industry | Male | Female |
| Agriculture, Fishing & Hunting | 875 (86.5%) | 137 (13.5%) |
| Mining, Quarrying, & Extraction | 0 (0.0%) | 0 (0.0%) |
| Construction | 561 (89.3%) | 67 (10.7%) |
| Manufacturing | 695 (75.5%) | 225 (24.5%) |
| Wholesale Trade | 140 (56.7%) | 107 (43.3%) |
| Retail Trade | 424 (43.4%) | 553 (56.6%) |
| Transportation & Warehousing | 175 (53.0%) | 155 (47.0%) |
| Utilities | 198 (99.5%) | 1 (0.5%) |
| Information | 155 (92.3%) | 13 (7.7%) |
| Finance & Insurance | 53 (34.4%) | 101 (65.6%) |
| Real Estate, Rental & Leasing | 37 (25.3%) | 109 (74.7%) |
| Professional & Scientific | 589 (73.4%) | 213 (26.6%) |
| Enterprise Management | 0 (0.0%) | 0 (0.0%) |
| Administrative & Support | 224 (77.2%) | 66 (22.8%) |
| Educational Services | 168 (18.0%) | 767 (82.0%) |
| Health Care & Social Assistance | 235 (18.7%) | 1,019 (81.3%) |
| Arts, Entertainment & Recreation | 41 (24.4%) | 127 (75.6%) |
| Accommodation & Food Services | 233 (48.0%) | 252 (52.0%) |
| Public Administration | 379 (61.4%) | 238 (38.6%) |
| Total | 5,330 (55.8%) | 4,217 (44.2%) |
Education in Klickitat County
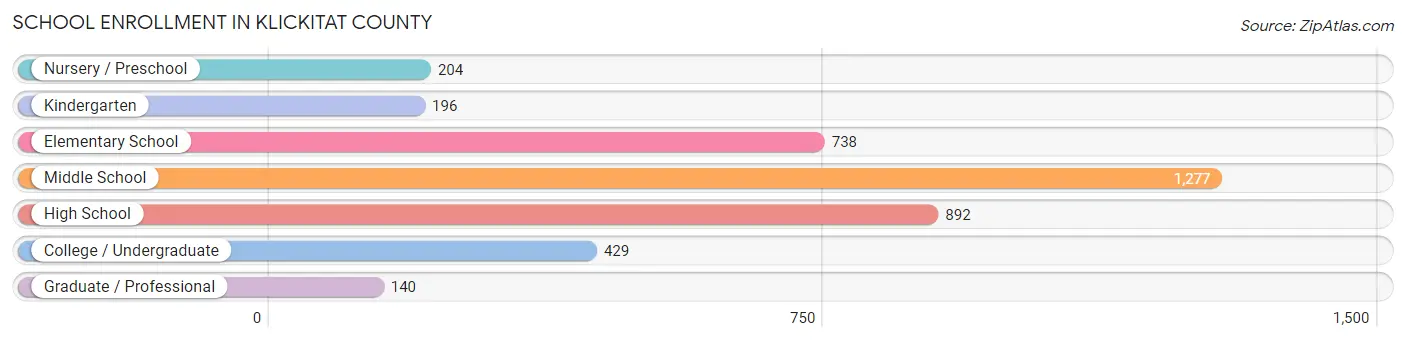
School Enrollment in Klickitat County
The most common levels of schooling among the 3,876 students in Klickitat County are middle school (1,277 | 33.0%), high school (892 | 23.0%), and elementary school (738 | 19.0%).
| School Level | # Students | % Students |
| Nursery / Preschool | 204 | 5.3% |
| Kindergarten | 196 | 5.1% |
| Elementary School | 738 | 19.0% |
| Middle School | 1,277 | 33.0% |
| High School | 892 | 23.0% |
| College / Undergraduate | 429 | 11.1% |
| Graduate / Professional | 140 | 3.6% |
| Total | 3,876 | 100.0% |
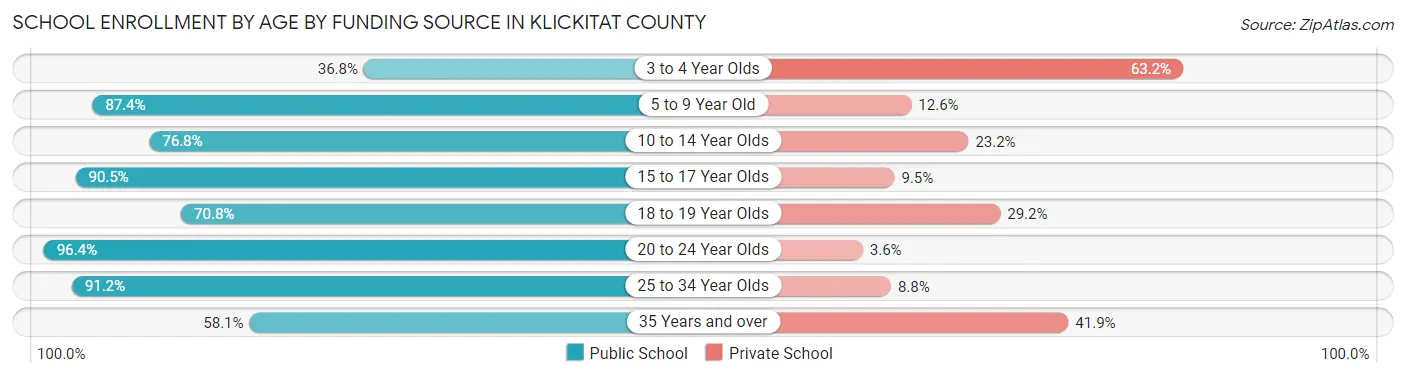
School Enrollment by Age by Funding Source in Klickitat County
Out of a total of 3,876 students who are enrolled in schools in Klickitat County, 752 (19.4%) attend a private institution, while the remaining 3,124 (80.6%) are enrolled in public schools. The age group of 3 to 4 year olds has the highest likelihood of being enrolled in private schools, with 103 (63.2% in the age bracket) enrolled. Conversely, the age group of 20 to 24 year olds has the lowest likelihood of being enrolled in a private school, with 189 (96.4% in the age bracket) attending a public institution.
| Age Bracket | Public School | Private School |
| 3 to 4 Year Olds | 60 (36.8%) | 103 (63.2%) |
| 5 to 9 Year Old | 789 (87.4%) | 114 (12.6%) |
| 10 to 14 Year Olds | 1,126 (76.8%) | 341 (23.2%) |
| 15 to 17 Year Olds | 630 (90.5%) | 66 (9.5%) |
| 18 to 19 Year Olds | 85 (70.8%) | 35 (29.2%) |
| 20 to 24 Year Olds | 189 (96.4%) | 7 (3.6%) |
| 25 to 34 Year Olds | 145 (91.2%) | 14 (8.8%) |
| 35 Years and over | 100 (58.1%) | 72 (41.9%) |
| Total | 3,124 (80.6%) | 752 (19.4%) |
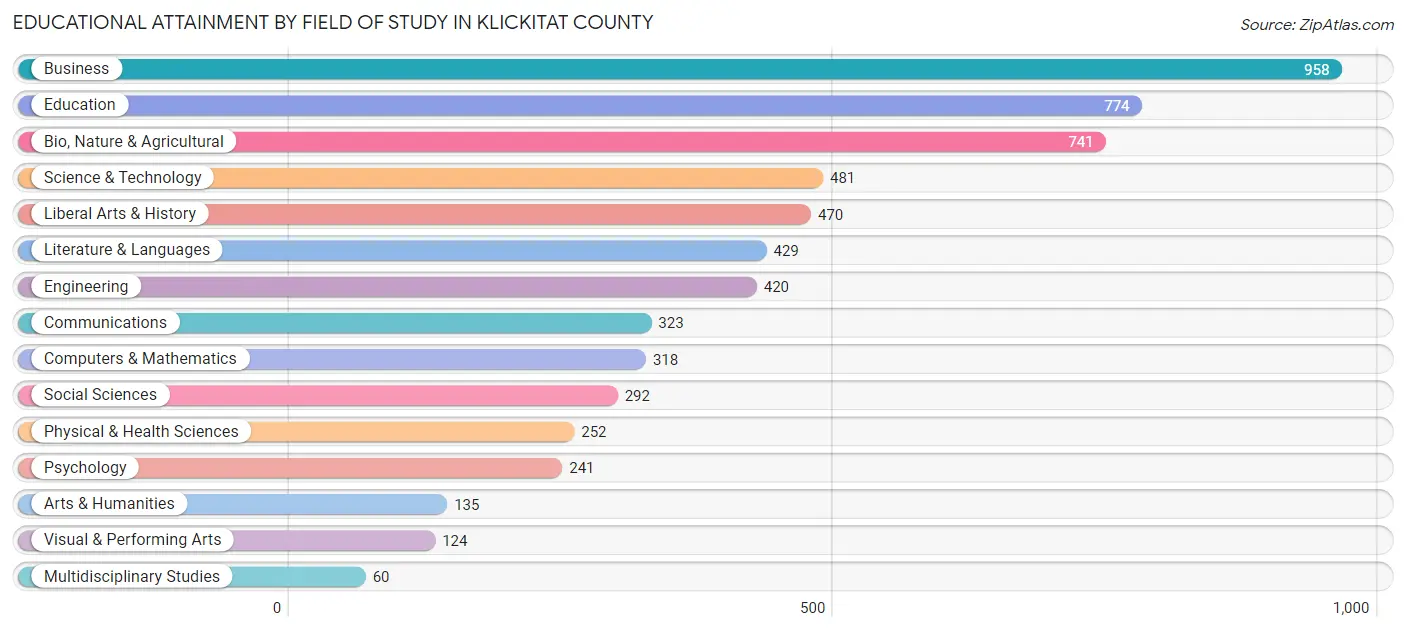
Educational Attainment by Field of Study in Klickitat County
Business (958 | 15.9%), education (774 | 12.9%), bio, nature & agricultural (741 | 12.3%), science & technology (481 | 8.0%), and liberal arts & history (470 | 7.8%) are the most common fields of study among 6,018 individuals in Klickitat County who have obtained a bachelor's degree or higher.
| Field of Study | # Graduates | % Graduates |
| Computers & Mathematics | 318 | 5.3% |
| Bio, Nature & Agricultural | 741 | 12.3% |
| Physical & Health Sciences | 252 | 4.2% |
| Psychology | 241 | 4.0% |
| Social Sciences | 292 | 4.9% |
| Engineering | 420 | 7.0% |
| Multidisciplinary Studies | 60 | 1.0% |
| Science & Technology | 481 | 8.0% |
| Business | 958 | 15.9% |
| Education | 774 | 12.9% |
| Literature & Languages | 429 | 7.1% |
| Liberal Arts & History | 470 | 7.8% |
| Visual & Performing Arts | 124 | 2.1% |
| Communications | 323 | 5.4% |
| Arts & Humanities | 135 | 2.2% |
| Total | 6,018 | 100.0% |
Transportation & Commute in Klickitat County
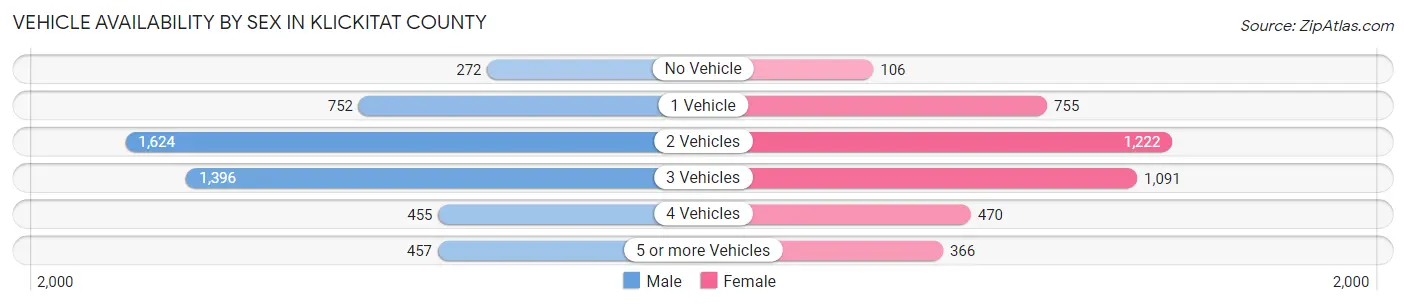
Vehicle Availability by Sex in Klickitat County
The most prevalent vehicle ownership categories in Klickitat County are males with 2 vehicles (1,624, accounting for 32.8%) and females with 2 vehicles (1,222, making up 40.5%).
| Vehicles Available | Male | Female |
| No Vehicle | 272 (5.5%) | 106 (2.6%) |
| 1 Vehicle | 752 (15.2%) | 755 (18.8%) |
| 2 Vehicles | 1,624 (32.8%) | 1,222 (30.5%) |
| 3 Vehicles | 1,396 (28.2%) | 1,091 (27.2%) |
| 4 Vehicles | 455 (9.2%) | 470 (11.7%) |
| 5 or more Vehicles | 457 (9.2%) | 366 (9.1%) |
| Total | 4,956 (100.0%) | 4,010 (100.0%) |
Commute Time in Klickitat County
The most frequently occuring commute durations in Klickitat County are 5 to 9 minutes (1,476 commuters, 19.3%), less than 5 minutes (1,145 commuters, 15.0%), and 15 to 19 minutes (990 commuters, 13.0%).
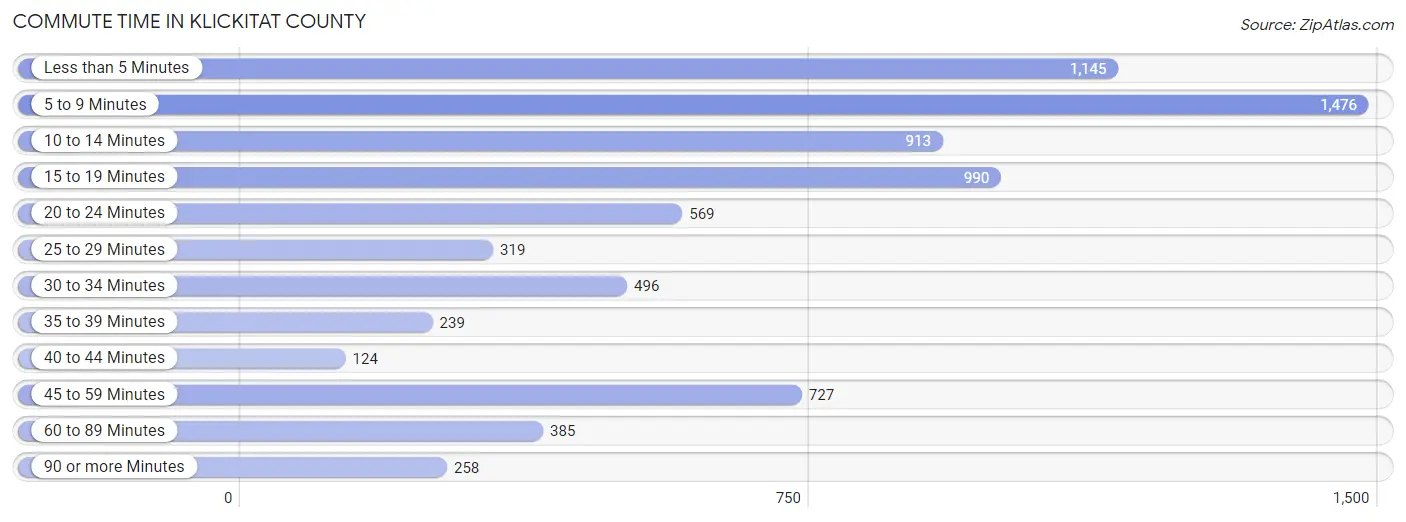
| Commute Time | # Commuters | % Commuters |
| Less than 5 Minutes | 1,145 | 15.0% |
| 5 to 9 Minutes | 1,476 | 19.3% |
| 10 to 14 Minutes | 913 | 11.9% |
| 15 to 19 Minutes | 990 | 13.0% |
| 20 to 24 Minutes | 569 | 7.4% |
| 25 to 29 Minutes | 319 | 4.2% |
| 30 to 34 Minutes | 496 | 6.5% |
| 35 to 39 Minutes | 239 | 3.1% |
| 40 to 44 Minutes | 124 | 1.6% |
| 45 to 59 Minutes | 727 | 9.5% |
| 60 to 89 Minutes | 385 | 5.0% |
| 90 or more Minutes | 258 | 3.4% |
Commute Time by Sex in Klickitat County
The most common commute times in Klickitat County are 5 to 9 minutes (1,013 commuters, 24.2%) for males and less than 5 minutes (644 commuters, 18.7%) for females.
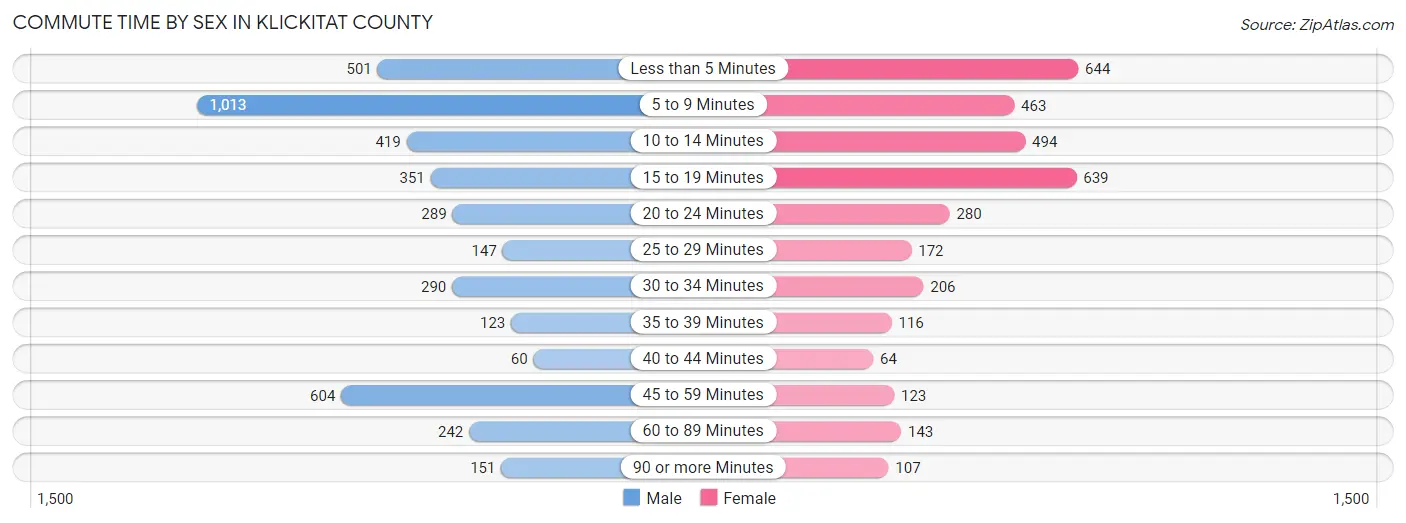
| Commute Time | Male | Female |
| Less than 5 Minutes | 501 (12.0%) | 644 (18.7%) |
| 5 to 9 Minutes | 1,013 (24.2%) | 463 (13.4%) |
| 10 to 14 Minutes | 419 (10.0%) | 494 (14.3%) |
| 15 to 19 Minutes | 351 (8.4%) | 639 (18.5%) |
| 20 to 24 Minutes | 289 (6.9%) | 280 (8.1%) |
| 25 to 29 Minutes | 147 (3.5%) | 172 (5.0%) |
| 30 to 34 Minutes | 290 (6.9%) | 206 (6.0%) |
| 35 to 39 Minutes | 123 (2.9%) | 116 (3.4%) |
| 40 to 44 Minutes | 60 (1.4%) | 64 (1.8%) |
| 45 to 59 Minutes | 604 (14.4%) | 123 (3.6%) |
| 60 to 89 Minutes | 242 (5.8%) | 143 (4.1%) |
| 90 or more Minutes | 151 (3.6%) | 107 (3.1%) |
Time of Departure to Work by Sex in Klickitat County
The most frequent times of departure to work in Klickitat County are 6:30 AM to 6:59 AM (668, 15.9%) for males and 7:00 AM to 7:29 AM (724, 21.0%) for females.
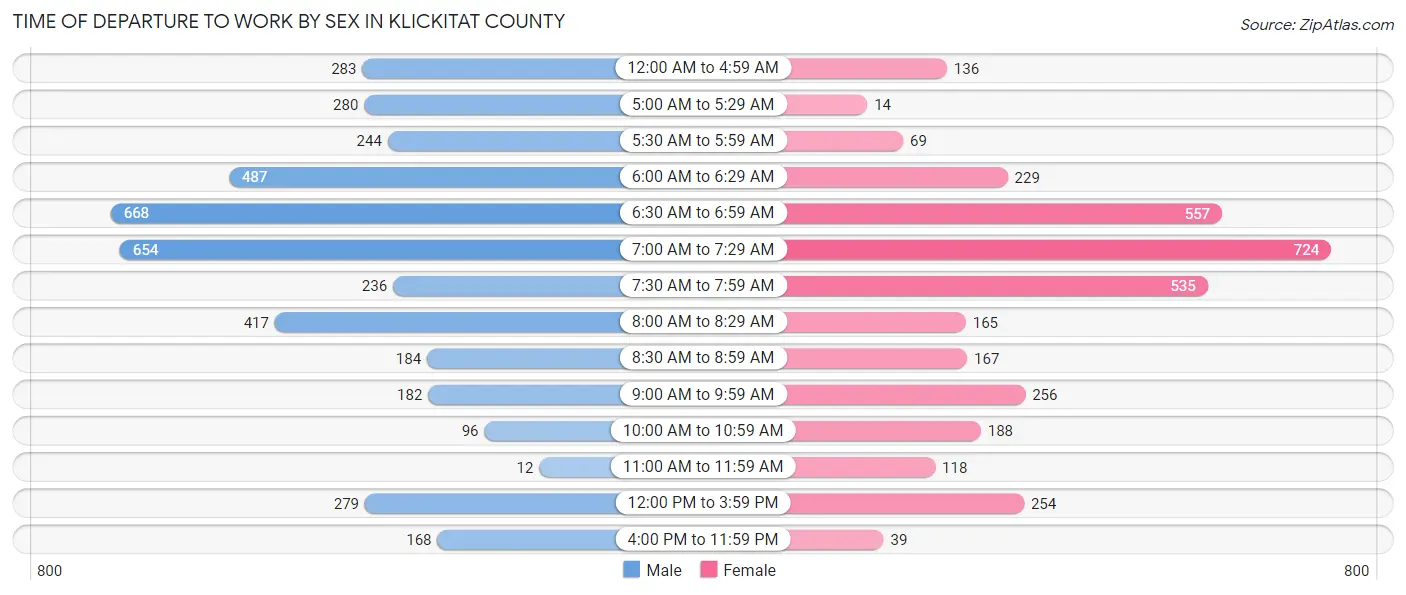
| Time of Departure | Male | Female |
| 12:00 AM to 4:59 AM | 283 (6.8%) | 136 (3.9%) |
| 5:00 AM to 5:29 AM | 280 (6.7%) | 14 (0.4%) |
| 5:30 AM to 5:59 AM | 244 (5.8%) | 69 (2.0%) |
| 6:00 AM to 6:29 AM | 487 (11.6%) | 229 (6.6%) |
| 6:30 AM to 6:59 AM | 668 (15.9%) | 557 (16.1%) |
| 7:00 AM to 7:29 AM | 654 (15.6%) | 724 (21.0%) |
| 7:30 AM to 7:59 AM | 236 (5.6%) | 535 (15.5%) |
| 8:00 AM to 8:29 AM | 417 (10.0%) | 165 (4.8%) |
| 8:30 AM to 8:59 AM | 184 (4.4%) | 167 (4.8%) |
| 9:00 AM to 9:59 AM | 182 (4.3%) | 256 (7.4%) |
| 10:00 AM to 10:59 AM | 96 (2.3%) | 188 (5.4%) |
| 11:00 AM to 11:59 AM | 12 (0.3%) | 118 (3.4%) |
| 12:00 PM to 3:59 PM | 279 (6.7%) | 254 (7.4%) |
| 4:00 PM to 11:59 PM | 168 (4.0%) | 39 (1.1%) |
| Total | 4,190 (100.0%) | 3,451 (100.0%) |
Housing Occupancy in Klickitat County
Occupancy by Ownership in Klickitat County
Of the total 9,618 dwellings in Klickitat County, owner-occupied units account for 7,213 (75.0%), while renter-occupied units make up 2,405 (25.0%).
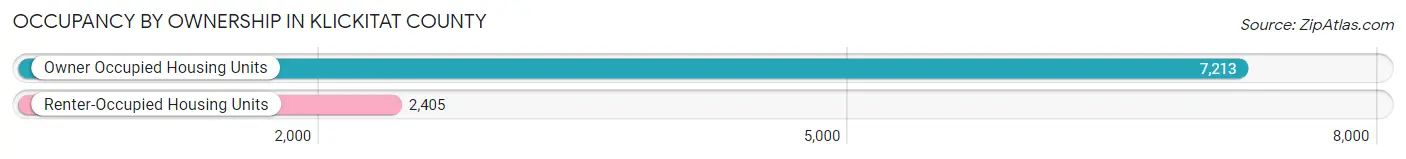
| Occupancy | # Housing Units | % Housing Units |
| Owner Occupied Housing Units | 7,213 | 75.0% |
| Renter-Occupied Housing Units | 2,405 | 25.0% |
| Total Occupied Housing Units | 9,618 | 100.0% |
Occupancy by Household Size in Klickitat County
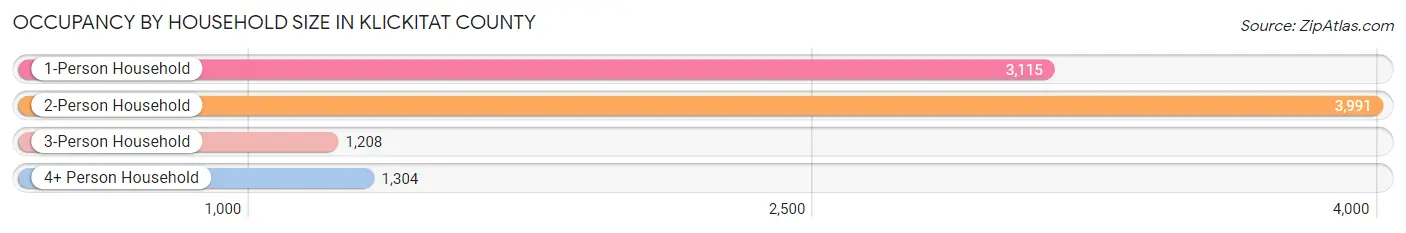
| Household Size | # Housing Units | % Housing Units |
| 1-Person Household | 3,115 | 32.4% |
| 2-Person Household | 3,991 | 41.5% |
| 3-Person Household | 1,208 | 12.6% |
| 4+ Person Household | 1,304 | 13.6% |
| Total Housing Units | 9,618 | 100.0% |
Occupancy by Ownership by Household Size in Klickitat County
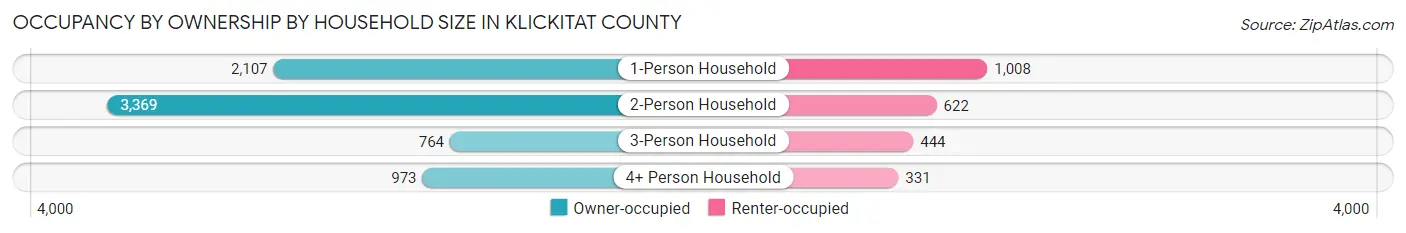
| Household Size | Owner-occupied | Renter-occupied |
| 1-Person Household | 2,107 (67.6%) | 1,008 (32.4%) |
| 2-Person Household | 3,369 (84.4%) | 622 (15.6%) |
| 3-Person Household | 764 (63.2%) | 444 (36.7%) |
| 4+ Person Household | 973 (74.6%) | 331 (25.4%) |
| Total Housing Units | 7,213 (75.0%) | 2,405 (25.0%) |
Occupancy by Educational Attainment in Klickitat County
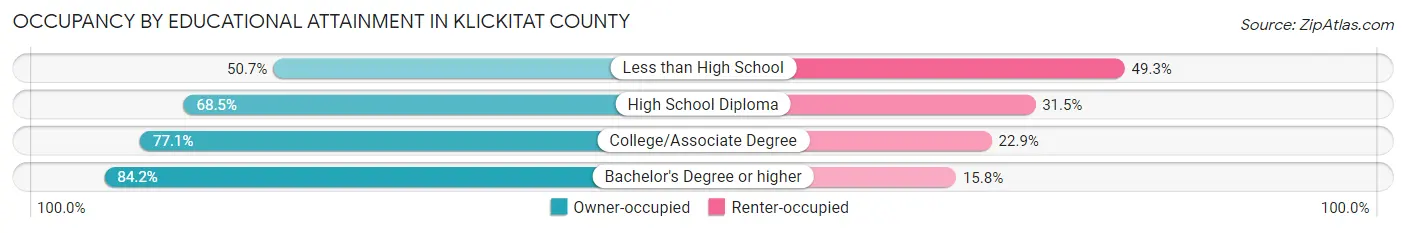
| Household Size | Owner-occupied | Renter-occupied |
| Less than High School | 416 (50.7%) | 404 (49.3%) |
| High School Diploma | 1,624 (68.5%) | 748 (31.5%) |
| College/Associate Degree | 2,572 (77.1%) | 764 (22.9%) |
| Bachelor's Degree or higher | 2,601 (84.2%) | 489 (15.8%) |
Occupancy by Age of Householder in Klickitat County
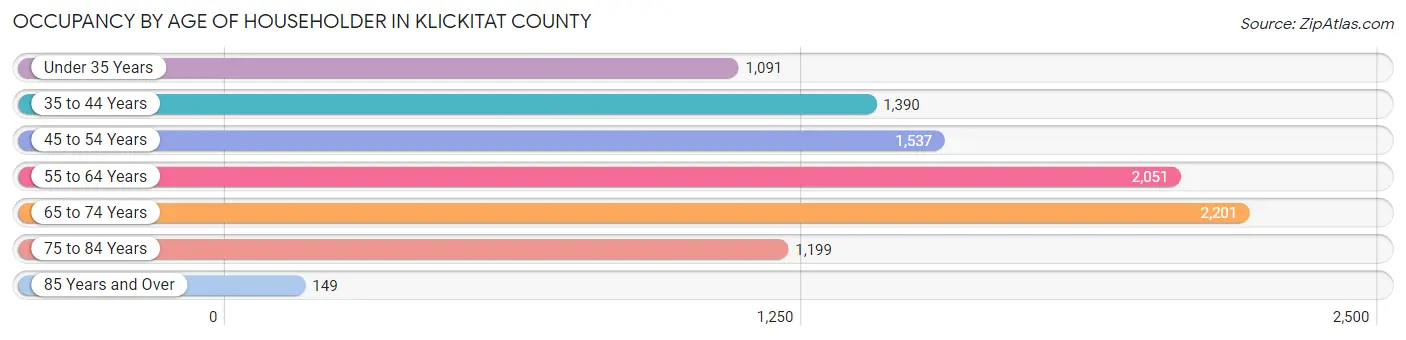
| Age Bracket | # Households | % Households |
| Under 35 Years | 1,091 | 11.3% |
| 35 to 44 Years | 1,390 | 14.4% |
| 45 to 54 Years | 1,537 | 16.0% |
| 55 to 64 Years | 2,051 | 21.3% |
| 65 to 74 Years | 2,201 | 22.9% |
| 75 to 84 Years | 1,199 | 12.5% |
| 85 Years and Over | 149 | 1.5% |
| Total | 9,618 | 100.0% |
Housing Finances in Klickitat County
Median Income by Occupancy in Klickitat County
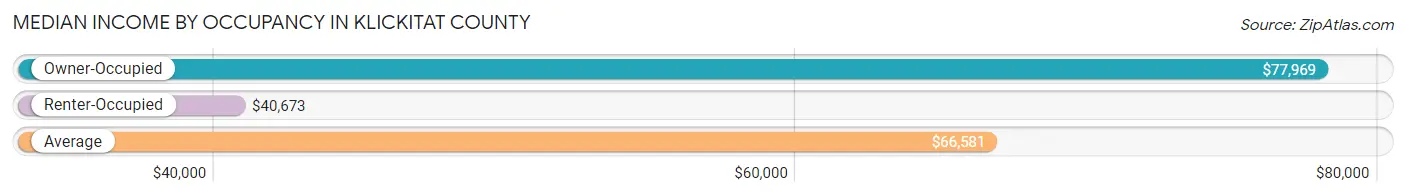
| Occupancy Type | # Households | Median Income |
| Owner-Occupied | 7,213 (75.0%) | $77,969 |
| Renter-Occupied | 2,405 (25.0%) | $40,673 |
| Average | 9,618 (100.0%) | $66,581 |
Occupancy by Householder Income Bracket in Klickitat County
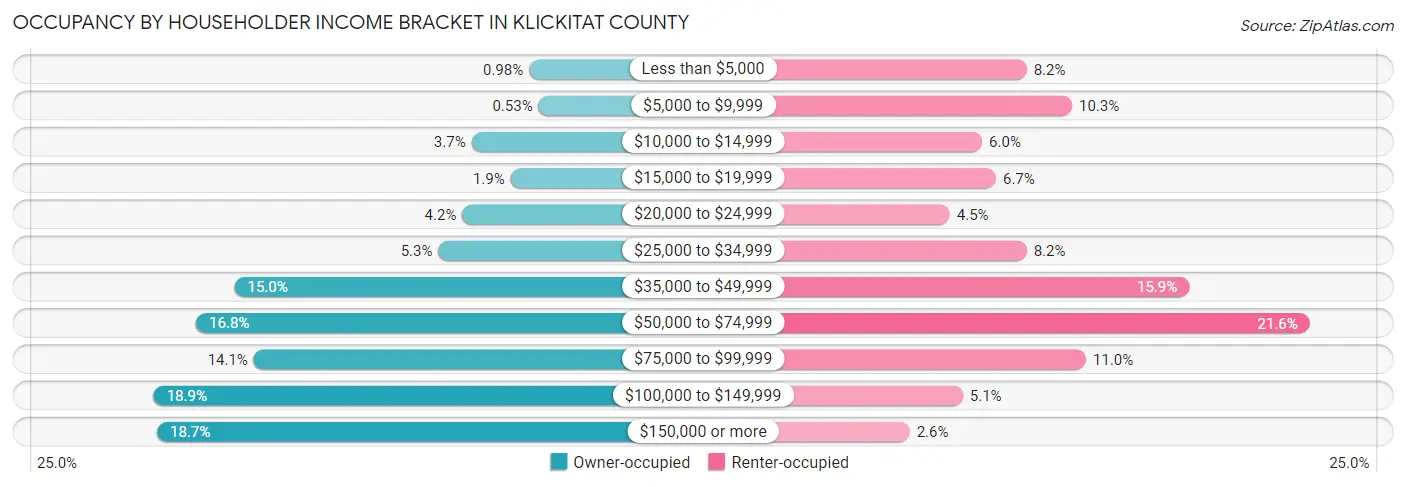
| Income Bracket | Owner-occupied | Renter-occupied |
| Less than $5,000 | 71 (1.0%) | 196 (8.2%) |
| $5,000 to $9,999 | 38 (0.5%) | 248 (10.3%) |
| $10,000 to $14,999 | 268 (3.7%) | 145 (6.0%) |
| $15,000 to $19,999 | 134 (1.9%) | 161 (6.7%) |
| $20,000 to $24,999 | 300 (4.2%) | 108 (4.5%) |
| $25,000 to $34,999 | 382 (5.3%) | 196 (8.2%) |
| $35,000 to $49,999 | 1,082 (15.0%) | 382 (15.9%) |
| $50,000 to $74,999 | 1,214 (16.8%) | 520 (21.6%) |
| $75,000 to $99,999 | 1,016 (14.1%) | 264 (11.0%) |
| $100,000 to $149,999 | 1,360 (18.9%) | 123 (5.1%) |
| $150,000 or more | 1,348 (18.7%) | 62 (2.6%) |
| Total | 7,213 (100.0%) | 2,405 (100.0%) |
Monthly Housing Cost Tiers in Klickitat County
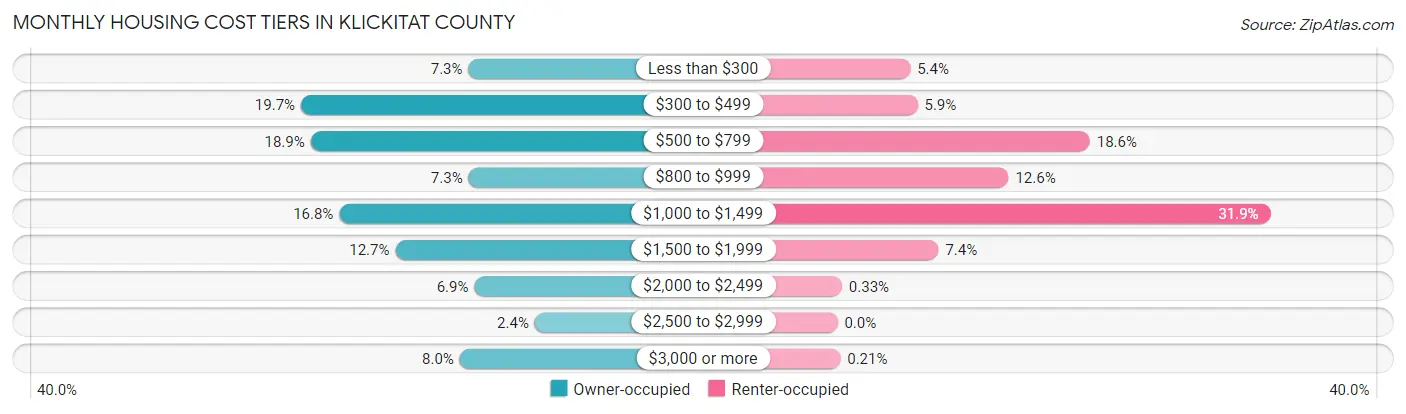
| Monthly Cost | Owner-occupied | Renter-occupied |
| Less than $300 | 528 (7.3%) | 129 (5.4%) |
| $300 to $499 | 1,417 (19.7%) | 142 (5.9%) |
| $500 to $799 | 1,366 (18.9%) | 447 (18.6%) |
| $800 to $999 | 527 (7.3%) | 303 (12.6%) |
| $1,000 to $1,499 | 1,214 (16.8%) | 767 (31.9%) |
| $1,500 to $1,999 | 916 (12.7%) | 179 (7.4%) |
| $2,000 to $2,499 | 496 (6.9%) | 8 (0.3%) |
| $2,500 to $2,999 | 175 (2.4%) | 0 (0.0%) |
| $3,000 or more | 574 (8.0%) | 5 (0.2%) |
| Total | 7,213 (100.0%) | 2,405 (100.0%) |
Physical Housing Characteristics in Klickitat County
Housing Structures in Klickitat County
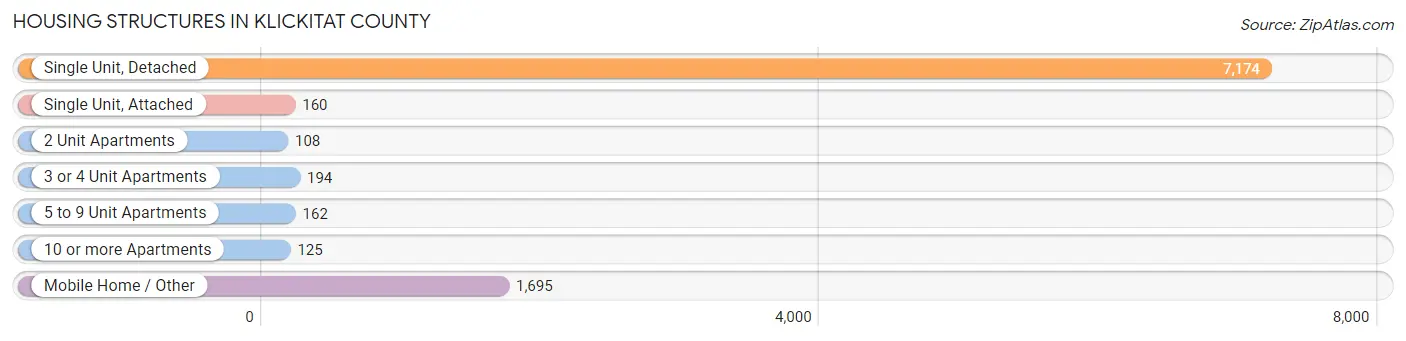
| Structure Type | # Housing Units | % Housing Units |
| Single Unit, Detached | 7,174 | 74.6% |
| Single Unit, Attached | 160 | 1.7% |
| 2 Unit Apartments | 108 | 1.1% |
| 3 or 4 Unit Apartments | 194 | 2.0% |
| 5 to 9 Unit Apartments | 162 | 1.7% |
| 10 or more Apartments | 125 | 1.3% |
| Mobile Home / Other | 1,695 | 17.6% |
| Total | 9,618 | 100.0% |
Housing Structures by Occupancy in Klickitat County
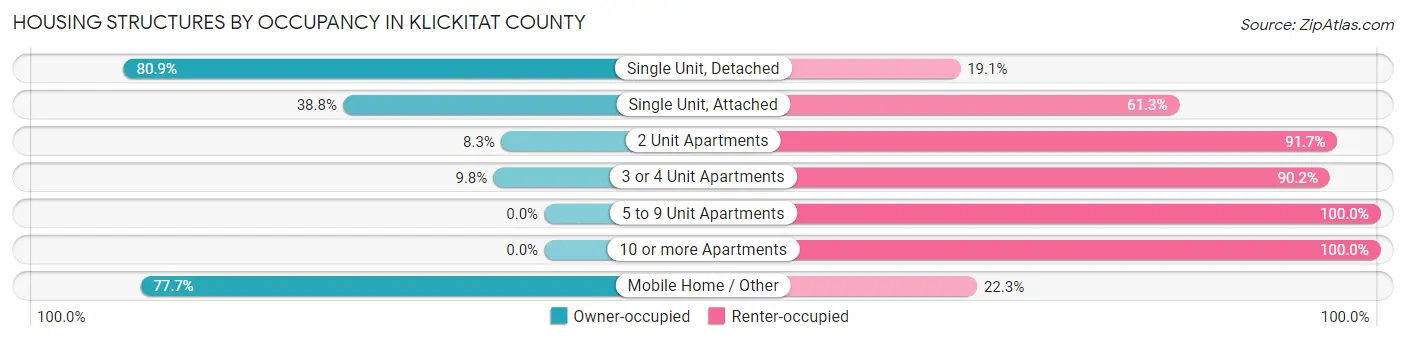
| Structure Type | Owner-occupied | Renter-occupied |
| Single Unit, Detached | 5,806 (80.9%) | 1,368 (19.1%) |
| Single Unit, Attached | 62 (38.8%) | 98 (61.3%) |
| 2 Unit Apartments | 9 (8.3%) | 99 (91.7%) |
| 3 or 4 Unit Apartments | 19 (9.8%) | 175 (90.2%) |
| 5 to 9 Unit Apartments | 0 (0.0%) | 162 (100.0%) |
| 10 or more Apartments | 0 (0.0%) | 125 (100.0%) |
| Mobile Home / Other | 1,317 (77.7%) | 378 (22.3%) |
| Total | 7,213 (75.0%) | 2,405 (25.0%) |
Housing Structures by Number of Rooms in Klickitat County
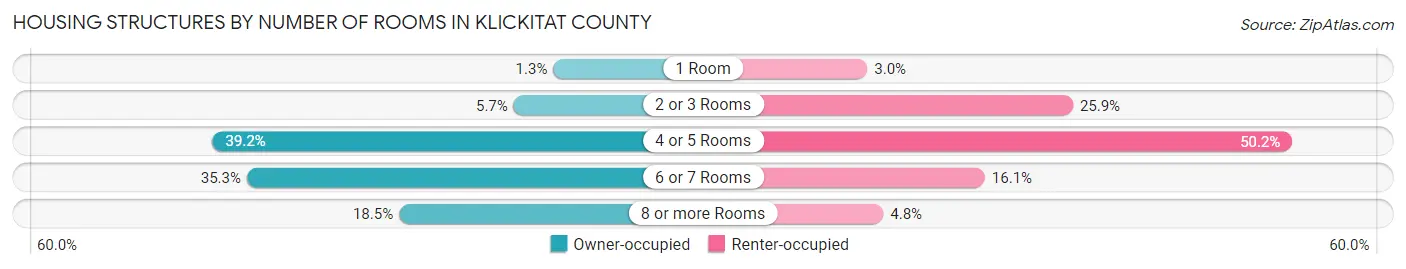
| Number of Rooms | Owner-occupied | Renter-occupied |
| 1 Room | 96 (1.3%) | 73 (3.0%) |
| 2 or 3 Rooms | 413 (5.7%) | 622 (25.9%) |
| 4 or 5 Rooms | 2,824 (39.2%) | 1,207 (50.2%) |
| 6 or 7 Rooms | 2,549 (35.3%) | 387 (16.1%) |
| 8 or more Rooms | 1,331 (18.4%) | 116 (4.8%) |
| Total | 7,213 (100.0%) | 2,405 (100.0%) |
Housing Structure by Heating Type in Klickitat County
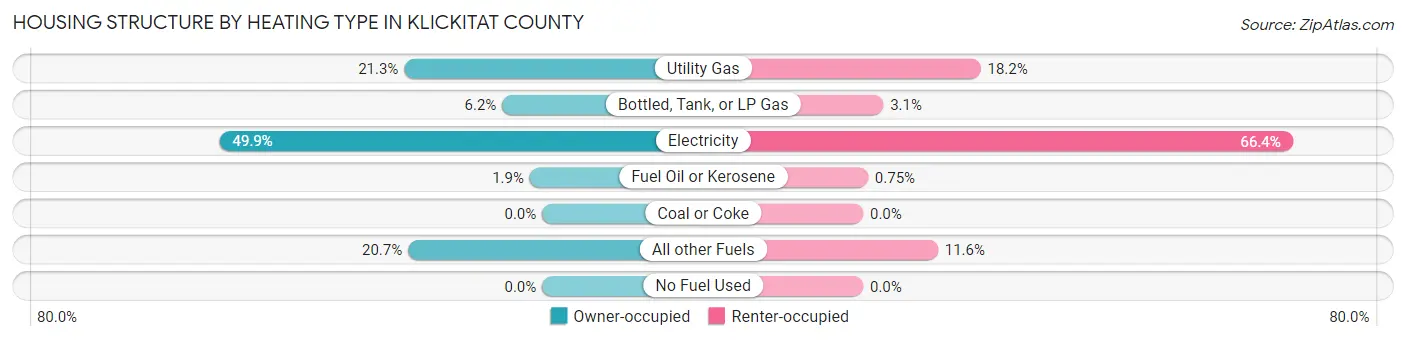
| Heating Type | Owner-occupied | Renter-occupied |
| Utility Gas | 1,538 (21.3%) | 437 (18.2%) |
| Bottled, Tank, or LP Gas | 445 (6.2%) | 75 (3.1%) |
| Electricity | 3,598 (49.9%) | 1,597 (66.4%) |
| Fuel Oil or Kerosene | 137 (1.9%) | 18 (0.7%) |
| Coal or Coke | 0 (0.0%) | 0 (0.0%) |
| All other Fuels | 1,495 (20.7%) | 278 (11.6%) |
| No Fuel Used | 0 (0.0%) | 0 (0.0%) |
| Total | 7,213 (100.0%) | 2,405 (100.0%) |
Household Vehicle Usage in Klickitat County
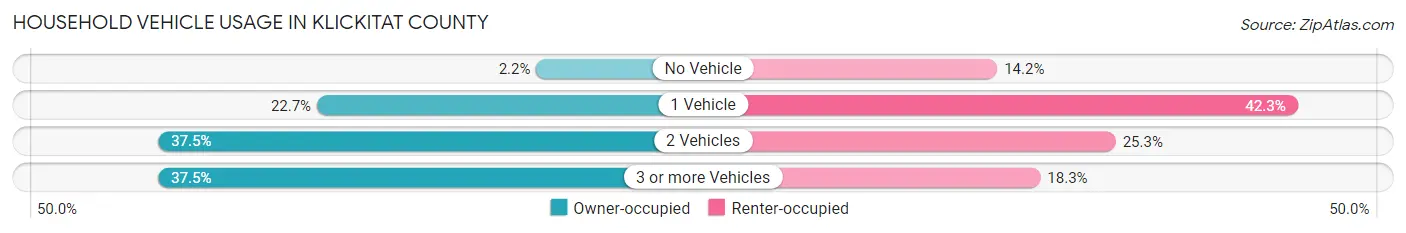
| Vehicles per Household | Owner-occupied | Renter-occupied |
| No Vehicle | 161 (2.2%) | 342 (14.2%) |
| 1 Vehicle | 1,638 (22.7%) | 1,016 (42.2%) |
| 2 Vehicles | 2,707 (37.5%) | 608 (25.3%) |
| 3 or more Vehicles | 2,707 (37.5%) | 439 (18.2%) |
| Total | 7,213 (100.0%) | 2,405 (100.0%) |
Real Estate & Mortgages in Klickitat County
Real Estate and Mortgage Overview in Klickitat County
| Characteristic | Without Mortgage | With Mortgage |
| Housing Units | 3,690 | 3,523 |
| Median Property Value | $336,900 | $369,800 |
| Median Household Income | $61,717 | $914 |
| Monthly Housing Costs | $491 | $574 |
| Real Estate Taxes | $2,179 | $52 |
Property Value by Mortgage Status in Klickitat County
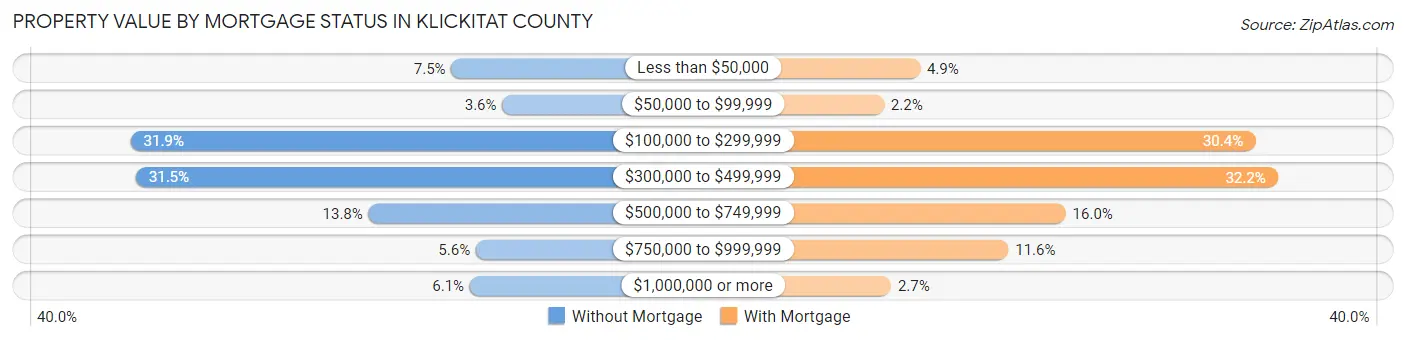
| Property Value | Without Mortgage | With Mortgage |
| Less than $50,000 | 276 (7.5%) | 173 (4.9%) |
| $50,000 to $99,999 | 133 (3.6%) | 76 (2.2%) |
| $100,000 to $299,999 | 1,178 (31.9%) | 1,072 (30.4%) |
| $300,000 to $499,999 | 1,163 (31.5%) | 1,133 (32.2%) |
| $500,000 to $749,999 | 509 (13.8%) | 564 (16.0%) |
| $750,000 to $999,999 | 207 (5.6%) | 410 (11.6%) |
| $1,000,000 or more | 224 (6.1%) | 95 (2.7%) |
| Total | 3,690 (100.0%) | 3,523 (100.0%) |
Household Income by Mortgage Status in Klickitat County
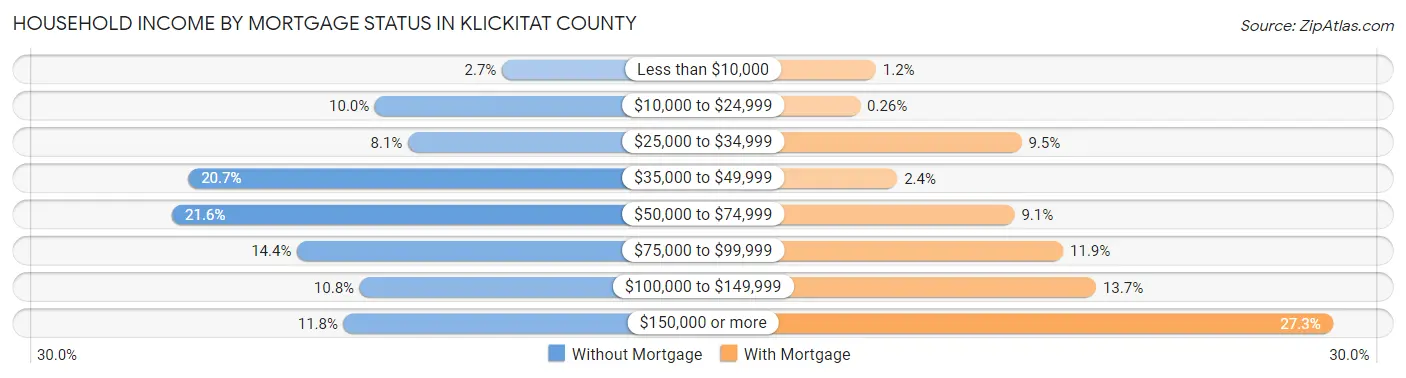
| Household Income | Without Mortgage | With Mortgage |
| Less than $10,000 | 100 (2.7%) | 41 (1.2%) |
| $10,000 to $24,999 | 368 (10.0%) | 9 (0.3%) |
| $25,000 to $34,999 | 298 (8.1%) | 334 (9.5%) |
| $35,000 to $49,999 | 762 (20.6%) | 84 (2.4%) |
| $50,000 to $74,999 | 796 (21.6%) | 320 (9.1%) |
| $75,000 to $99,999 | 532 (14.4%) | 418 (11.9%) |
| $100,000 to $149,999 | 400 (10.8%) | 484 (13.7%) |
| $150,000 or more | 434 (11.8%) | 960 (27.3%) |
| Total | 3,690 (100.0%) | 3,523 (100.0%) |
Property Value to Household Income Ratio in Klickitat County
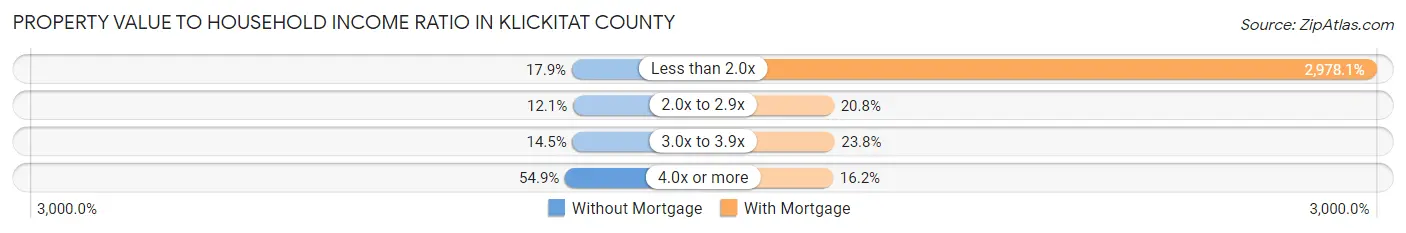
| Value-to-Income Ratio | Without Mortgage | With Mortgage |
| Less than 2.0x | 659 (17.9%) | 104,918 (2,978.1%) |
| 2.0x to 2.9x | 445 (12.1%) | 733 (20.8%) |
| 3.0x to 3.9x | 535 (14.5%) | 837 (23.8%) |
| 4.0x or more | 2,024 (54.8%) | 572 (16.2%) |
| Total | 3,690 (100.0%) | 3,523 (100.0%) |
Real Estate Taxes by Mortgage Status in Klickitat County
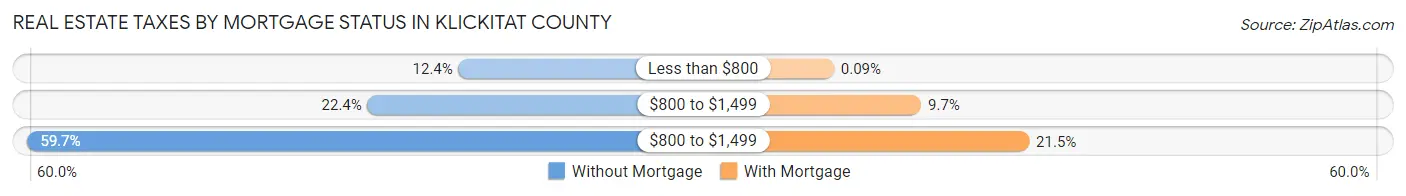
| Property Taxes | Without Mortgage | With Mortgage |
| Less than $800 | 459 (12.4%) | 3 (0.1%) |
| $800 to $1,499 | 827 (22.4%) | 340 (9.7%) |
| $800 to $1,499 | 2,203 (59.7%) | 757 (21.5%) |
| Total | 3,690 (100.0%) | 3,523 (100.0%) |
Health & Disability in Klickitat County
Health Insurance Coverage by Age in Klickitat County
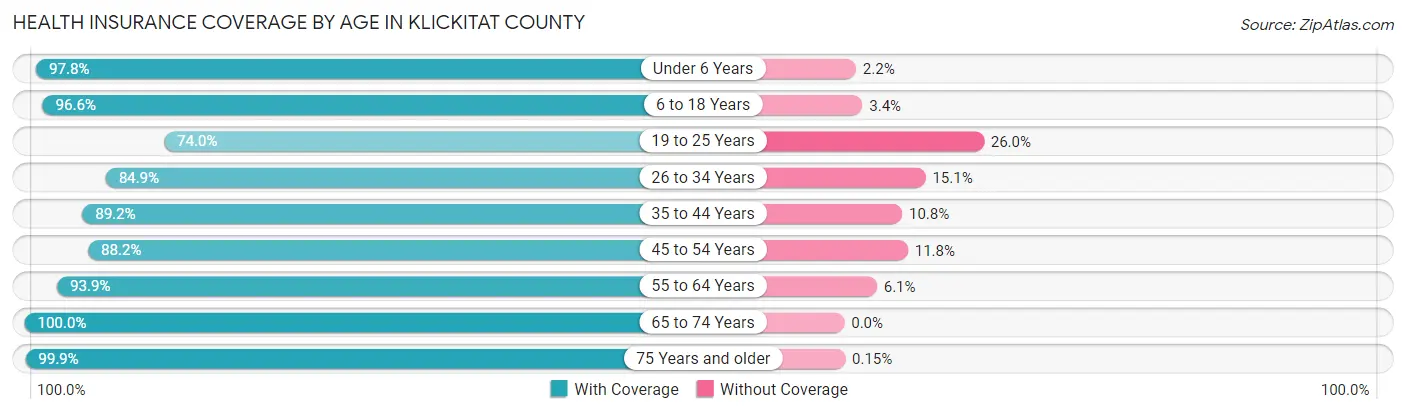
| Age Bracket | With Coverage | Without Coverage |
| Under 6 Years | 1,225 (97.8%) | 27 (2.2%) |
| 6 to 18 Years | 3,124 (96.6%) | 109 (3.4%) |
| 19 to 25 Years | 1,084 (74.0%) | 381 (26.0%) |
| 26 to 34 Years | 1,811 (84.9%) | 323 (15.1%) |
| 35 to 44 Years | 2,544 (89.2%) | 307 (10.8%) |
| 45 to 54 Years | 2,434 (88.2%) | 327 (11.8%) |
| 55 to 64 Years | 3,304 (93.9%) | 213 (6.1%) |
| 65 to 74 Years | 3,510 (100.0%) | 0 (0.0%) |
| 75 Years and older | 2,038 (99.9%) | 3 (0.2%) |
| Total | 21,074 (92.6%) | 1,690 (7.4%) |
Health Insurance Coverage by Citizenship Status in Klickitat County
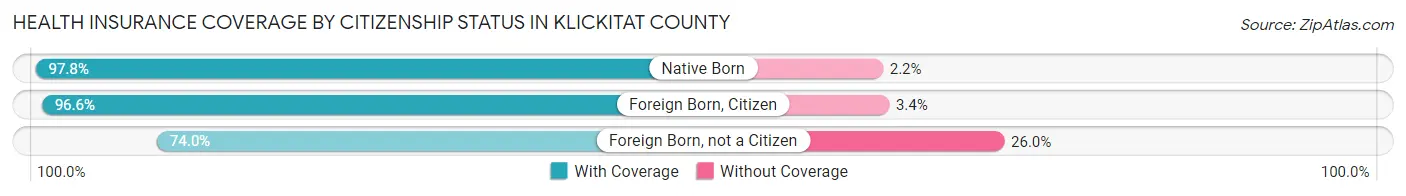
| Citizenship Status | With Coverage | Without Coverage |
| Native Born | 1,225 (97.8%) | 27 (2.2%) |
| Foreign Born, Citizen | 3,124 (96.6%) | 109 (3.4%) |
| Foreign Born, not a Citizen | 1,084 (74.0%) | 381 (26.0%) |
Health Insurance Coverage by Household Income in Klickitat County
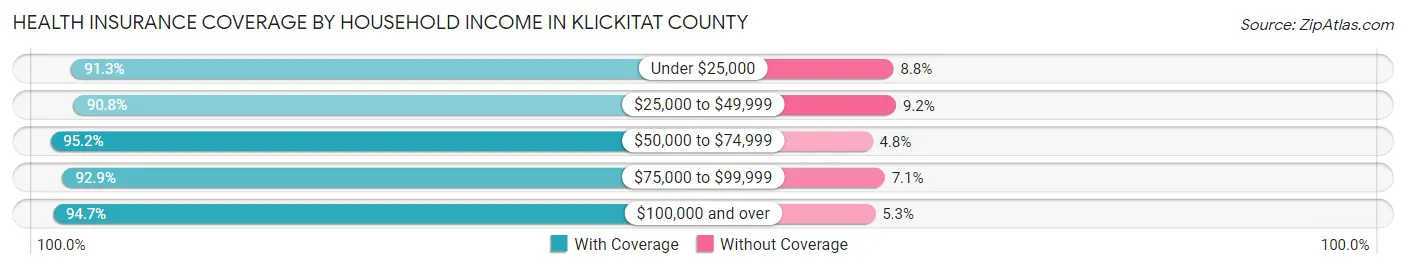
| Household Income | With Coverage | Without Coverage |
| Under $25,000 | 2,514 (91.2%) | 241 (8.7%) |
| $25,000 to $49,999 | 3,959 (90.8%) | 402 (9.2%) |
| $50,000 to $74,999 | 3,583 (95.2%) | 181 (4.8%) |
| $75,000 to $99,999 | 3,062 (92.9%) | 234 (7.1%) |
| $100,000 and over | 7,744 (94.7%) | 435 (5.3%) |
Public vs Private Health Insurance Coverage by Age in Klickitat County
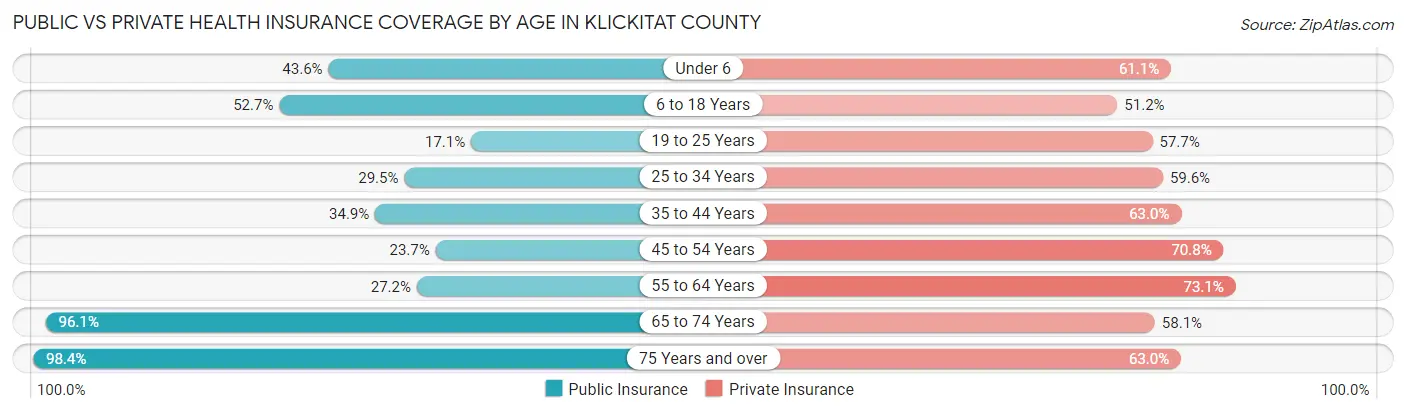
| Age Bracket | Public Insurance | Private Insurance |
| Under 6 | 546 (43.6%) | 765 (61.1%) |
| 6 to 18 Years | 1,705 (52.7%) | 1,654 (51.2%) |
| 19 to 25 Years | 251 (17.1%) | 845 (57.7%) |
| 25 to 34 Years | 630 (29.5%) | 1,272 (59.6%) |
| 35 to 44 Years | 996 (34.9%) | 1,796 (63.0%) |
| 45 to 54 Years | 655 (23.7%) | 1,956 (70.8%) |
| 55 to 64 Years | 957 (27.2%) | 2,571 (73.1%) |
| 65 to 74 Years | 3,373 (96.1%) | 2,040 (58.1%) |
| 75 Years and over | 2,009 (98.4%) | 1,285 (63.0%) |
| Total | 11,122 (48.9%) | 14,184 (62.3%) |
Disability Status by Sex by Age in Klickitat County
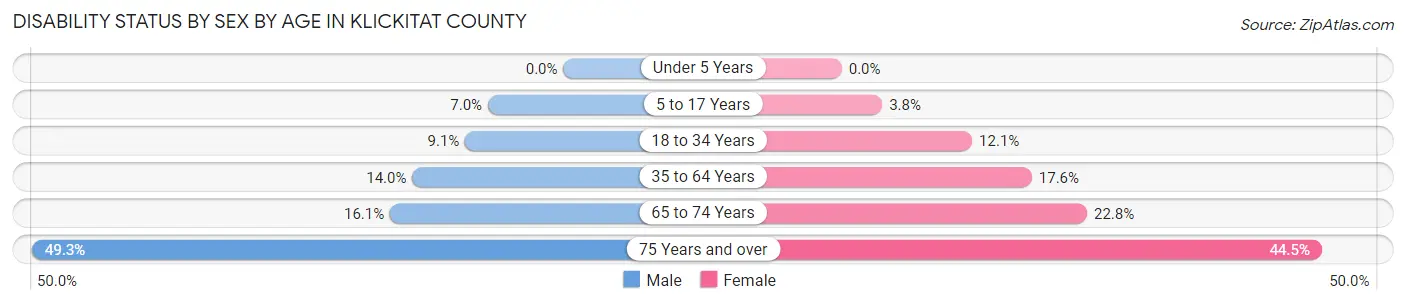
| Age Bracket | Male | Female |
| Under 5 Years | 0 (0.0%) | 0 (0.0%) |
| 5 to 17 Years | 123 (7.0%) | 56 (3.7%) |
| 18 to 34 Years | 176 (9.1%) | 224 (12.1%) |
| 35 to 64 Years | 656 (14.0%) | 785 (17.6%) |
| 65 to 74 Years | 286 (16.1%) | 394 (22.8%) |
| 75 Years and over | 474 (49.3%) | 481 (44.5%) |
Disability Class by Sex by Age in Klickitat County
Disability Class: Hearing Difficulty
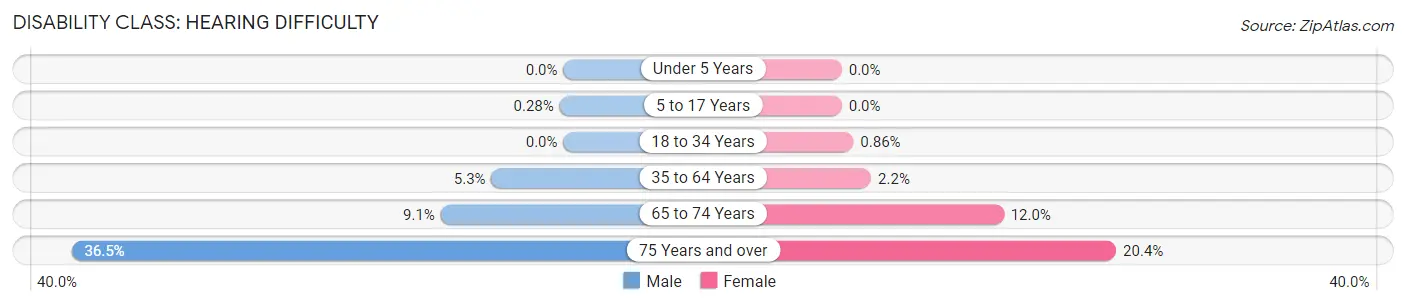
| Age Bracket | Male | Female |
| Under 5 Years | 0 (0.0%) | 0 (0.0%) |
| 5 to 17 Years | 5 (0.3%) | 0 (0.0%) |
| 18 to 34 Years | 0 (0.0%) | 16 (0.9%) |
| 35 to 64 Years | 250 (5.3%) | 97 (2.2%) |
| 65 to 74 Years | 162 (9.1%) | 208 (12.0%) |
| 75 Years and over | 351 (36.5%) | 220 (20.4%) |
Disability Class: Vision Difficulty
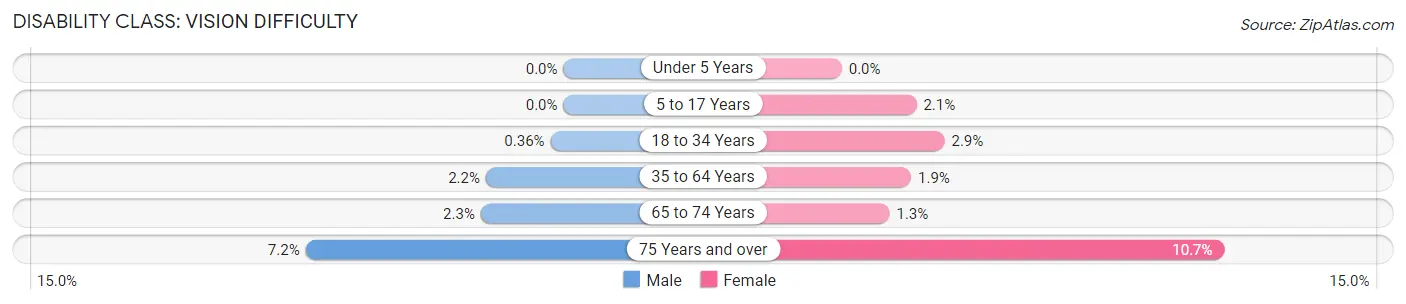
| Age Bracket | Male | Female |
| Under 5 Years | 0 (0.0%) | 0 (0.0%) |
| 5 to 17 Years | 0 (0.0%) | 31 (2.1%) |
| 18 to 34 Years | 7 (0.4%) | 53 (2.9%) |
| 35 to 64 Years | 101 (2.2%) | 86 (1.9%) |
| 65 to 74 Years | 41 (2.3%) | 23 (1.3%) |
| 75 Years and over | 69 (7.2%) | 115 (10.6%) |
Disability Class: Cognitive Difficulty
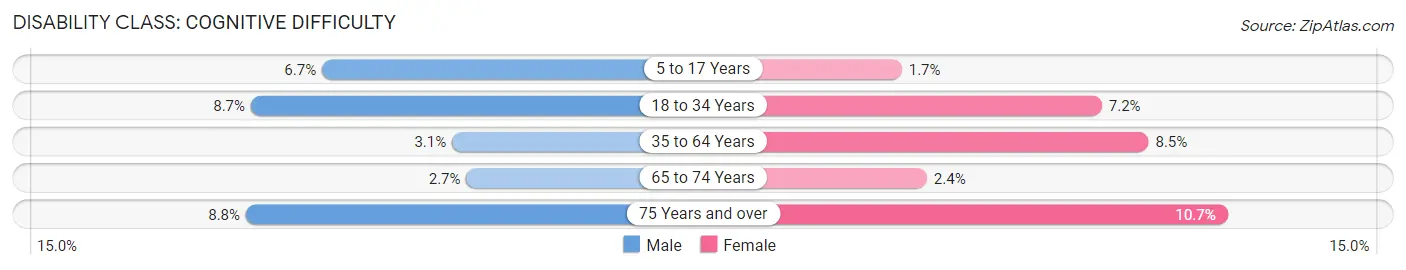
| Age Bracket | Male | Female |
| 5 to 17 Years | 118 (6.7%) | 25 (1.7%) |
| 18 to 34 Years | 168 (8.7%) | 134 (7.2%) |
| 35 to 64 Years | 145 (3.1%) | 380 (8.5%) |
| 65 to 74 Years | 48 (2.7%) | 41 (2.4%) |
| 75 Years and over | 85 (8.8%) | 116 (10.7%) |
Disability Class: Ambulatory Difficulty
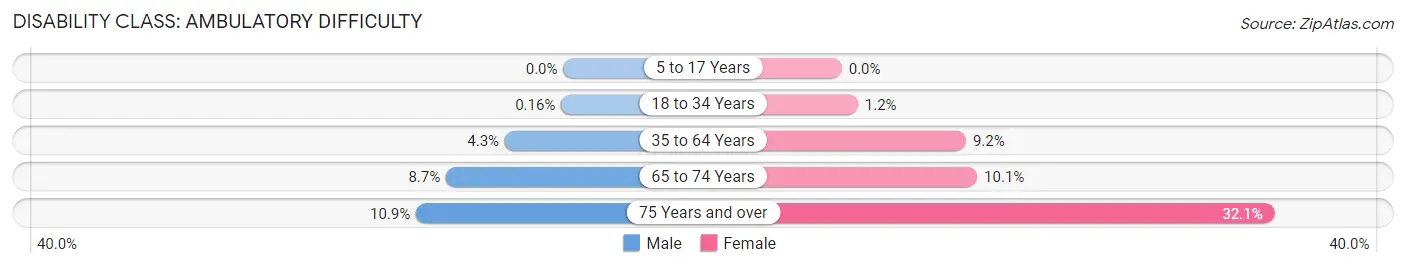
| Age Bracket | Male | Female |
| 5 to 17 Years | 0 (0.0%) | 0 (0.0%) |
| 18 to 34 Years | 3 (0.2%) | 22 (1.2%) |
| 35 to 64 Years | 203 (4.3%) | 410 (9.2%) |
| 65 to 74 Years | 155 (8.7%) | 174 (10.1%) |
| 75 Years and over | 105 (10.9%) | 347 (32.1%) |
Disability Class: Self-Care Difficulty
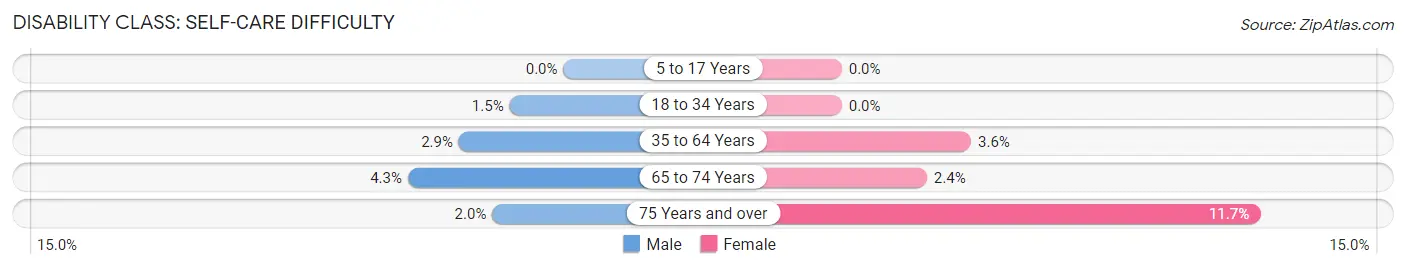
| Age Bracket | Male | Female |
| 5 to 17 Years | 0 (0.0%) | 0 (0.0%) |
| 18 to 34 Years | 29 (1.5%) | 0 (0.0%) |
| 35 to 64 Years | 136 (2.9%) | 160 (3.6%) |
| 65 to 74 Years | 77 (4.3%) | 41 (2.4%) |
| 75 Years and over | 19 (2.0%) | 126 (11.7%) |
Technology Access in Klickitat County
Computing Device Access in Klickitat County
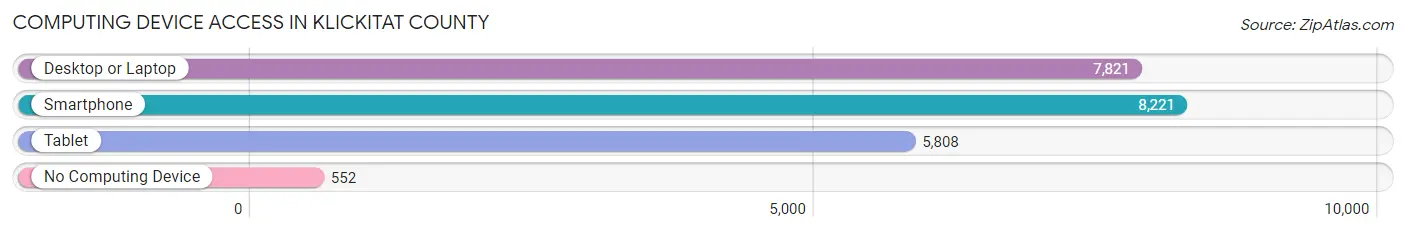
| Device Type | # Households | % Households |
| Desktop or Laptop | 7,821 | 81.3% |
| Smartphone | 8,221 | 85.5% |
| Tablet | 5,808 | 60.4% |
| No Computing Device | 552 | 5.7% |
| Total | 9,618 | 100.0% |
Internet Access in Klickitat County
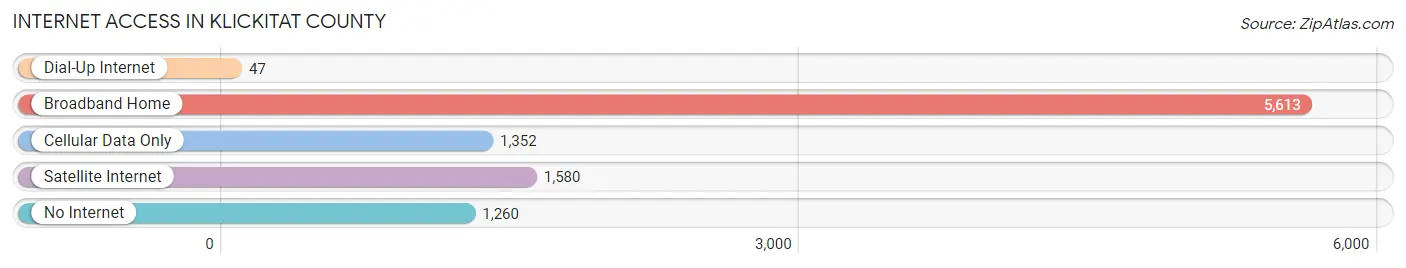
| Internet Type | # Households | % Households |
| Dial-Up Internet | 47 | 0.5% |
| Broadband Home | 5,613 | 58.4% |
| Cellular Data Only | 1,352 | 14.1% |
| Satellite Internet | 1,580 | 16.4% |
| No Internet | 1,260 | 13.1% |
| Total | 9,618 | 100.0% |
Klickitat County Summary
Klickitat County is located in the south-central region of Washington State, and is bordered by the Columbia River to the north, the Yakima River to the east, and the Cascade Mountains to the west. The county is home to a population of approximately 20,000 people, and is the second least populous county in the state. The county seat is Goldendale, and the largest city is White Salmon.
History
Klickitat County was first inhabited by Native American tribes, including the Yakama, Klickitat, and Wasco-Wishram. The area was first explored by Europeans in the late 1700s, and was part of the Oregon Territory until 1853, when it became part of Washington Territory. The county was officially established in 1859, and was named after the Klickitat tribe.
The county was largely rural until the early 1900s, when the construction of the Columbia River Highway and the Great Northern Railway brought increased development and population growth. The county was also home to several gold mines, which attracted prospectors and miners from all over the country.
Geography
Klickitat County is located in the south-central region of Washington State, and is bordered by the Columbia River to the north, the Yakima River to the east, and the Cascade Mountains to the west. The county covers an area of 1,902 square miles, and is home to a variety of landscapes, including rolling hills, grasslands, and forests. The highest point in the county is Mount Adams, which stands at 12,276 feet.
The county is home to several rivers and streams, including the Klickitat River, the White Salmon River, and the Little White Salmon River. The county is also home to several lakes, including Lake Cle Elum, Lake Chelan, and Lake Wenatchee.
Economy
Klickitat County’s economy is largely based on agriculture, forestry, and tourism. The county is home to several wineries, and is also a popular destination for outdoor recreation, such as fishing, hunting, and camping.
The county is also home to several manufacturing companies, including a paper mill in White Salmon and a lumber mill in Goldendale. The county is also home to several hydroelectric dams, which provide electricity to the region.
Demographics
As of the 2010 census, Klickitat County had a population of 20,318 people. The racial makeup of the county was 90.3% White, 0.7% African American, 1.2% Native American, 0.7% Asian, 0.1% Pacific Islander, 4.2% from other races, and 2.9% from two or more races. Hispanic or Latino of any race were 8.2% of the population.
The median household income in the county was $41,945, and the median family income was $48,945. The per capita income was $20,945. About 14.2% of the population was below the poverty line.
Klickitat County is home to several small towns and communities, including Goldendale, White Salmon, and Bickleton. The county is also home to several Native American reservations, including the Yakama Nation and the Confederated Tribes of the Umatilla Indian Reservation.
Common Questions
What is the Total Population of Klickitat County?
Total Population of Klickitat County is 22,798.
What is the Total Male Population of Klickitat County?
Total Male Population of Klickitat County is 11,635.
What is the Total Female Population of Klickitat County?
Total Female Population of Klickitat County is 11,163.
What is the Ratio of Males per 100 Females in Klickitat County?
There are 104.23 Males per 100 Females in Klickitat County.
What is the Ratio of Females per 100 Males in Klickitat County?
There are 95.94 Females per 100 Males in Klickitat County.
What is the Median Population Age in Klickitat County?
Median Population Age in Klickitat County is 47.0 Years.
What is the Average Family Size in Klickitat County
Average Family Size in Klickitat County is 2.9 People.
What is the Average Household Size in Klickitat County
Average Household Size in Klickitat County is 2.3 People.
What is Per Capita Income in Klickitat County?
Per Capita income in Klickitat County is $38,760.
What is the Median Family Income in Klickitat County?
Median Family Income in Klickitat County is $80,000.
What is the Median Household income in Klickitat County?
Median Household Income in Klickitat County is $66,581.
What is Income or Wage Gap in Klickitat County?
Income or Wage Gap in Klickitat County is 39.2%.
Women in Klickitat County earn 60.8 cents for every dollar earned by a man.
What is Family Income Deficit in Klickitat County?
Family Income Deficit in Klickitat County is $9,945.
Families that are below poverty line in Klickitat County earn $9,945 less on average than the poverty threshold level.
What is Inequality or Gini Index in Klickitat County?
Inequality or Gini Index in Klickitat County is 0.46.
How Large is the Labor Force in Klickitat County?
There are 10,258 People in the Labor Forcein in Klickitat County.
What is the Percentage of People in the Labor Force in Klickitat County?
53.8% of People are in the Labor Force in Klickitat County.
What is the Unemployment Rate in Klickitat County?
Unemployment Rate in Klickitat County is 6.9%.