Kittitas County, WA
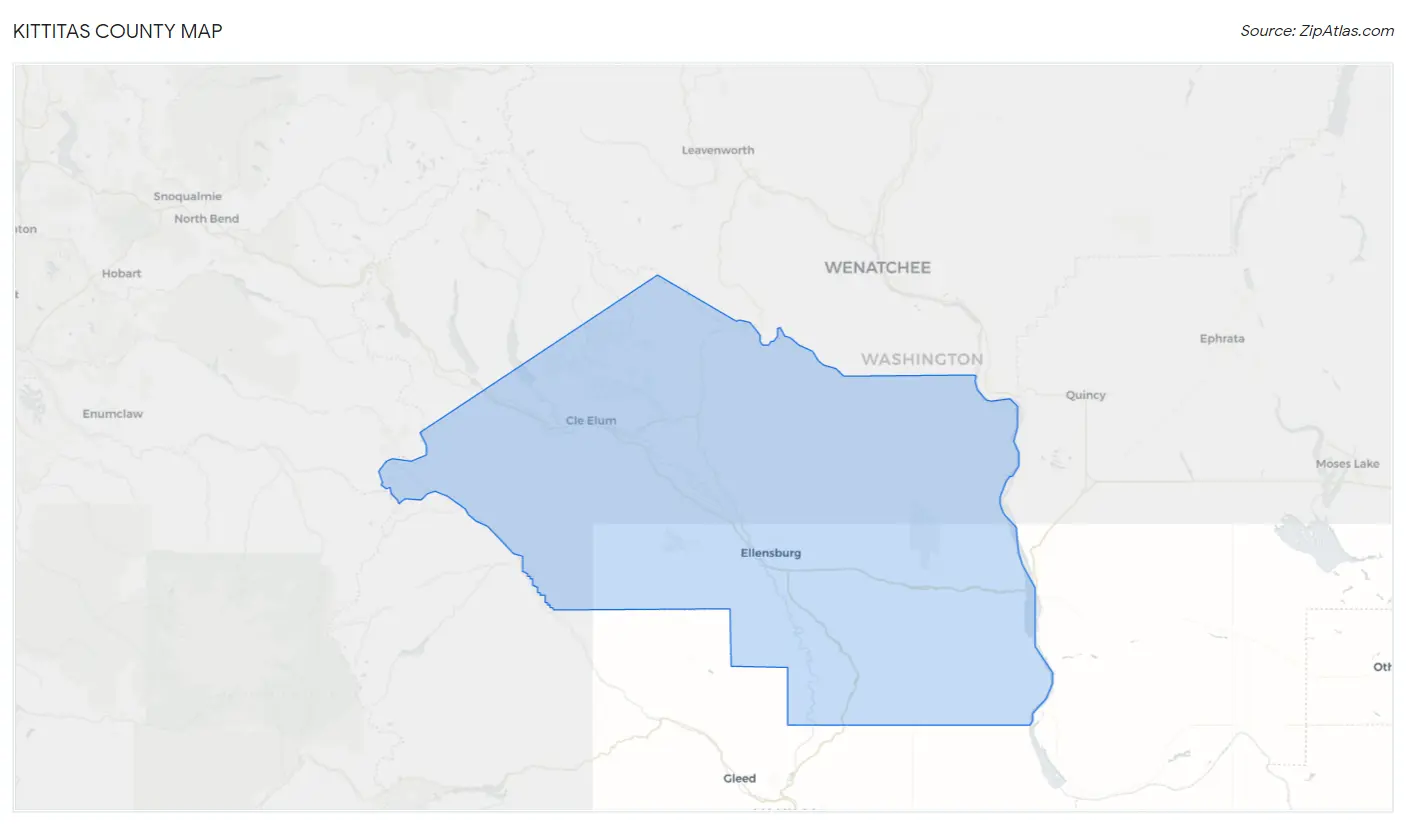
Kittitas County Map
Kittitas County Overview
44,424
TOTAL POPULATION
22,385
MALE POPULATION
22,039
FEMALE POPULATION
101.57
MALES / 100 FEMALES
98.45
FEMALES / 100 MALES
36.4
MEDIAN AGE
2.7
AVG FAMILY SIZE
2.2
AVG HOUSEHOLD SIZE
$39,399
PER CAPITA INCOME
$94,018
AVG FAMILY INCOME
$66,800
AVG HOUSEHOLD INCOME
30.7%
WAGE / INCOME GAP [ % ]
69.3¢/ $1
WAGE / INCOME GAP [ $ ]
$11,663
FAMILY INCOME DEFICIT
0.46
INEQUALITY / GINI INDEX
23,521
LABOR FORCE [ PEOPLE ]
62.5%
PERCENT IN LABOR FORCE
5.9%
UNEMPLOYMENT RATE
Kittitas County Area Codes
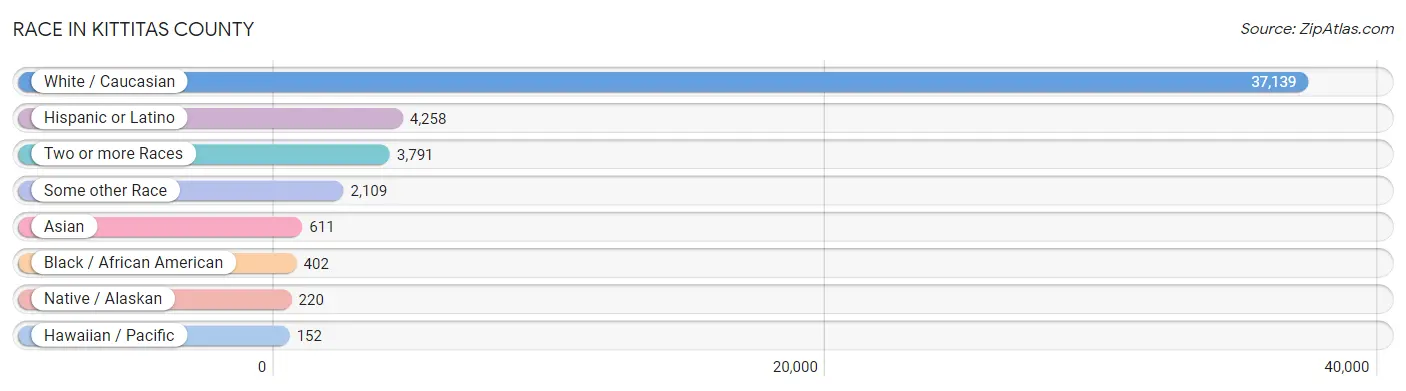
Race in Kittitas County
The most populous races in Kittitas County are White / Caucasian (37,139 | 83.6%), Hispanic or Latino (4,258 | 9.6%), and Two or more Races (3,791 | 8.5%).
| Race | # Population | % Population |
| Asian | 611 | 1.4% |
| Black / African American | 402 | 0.9% |
| Hawaiian / Pacific | 152 | 0.3% |
| Hispanic or Latino | 4,258 | 9.6% |
| Native / Alaskan | 220 | 0.5% |
| White / Caucasian | 37,139 | 83.6% |
| Two or more Races | 3,791 | 8.5% |
| Some other Race | 2,109 | 4.8% |
| Total | 44,424 | 100.0% |
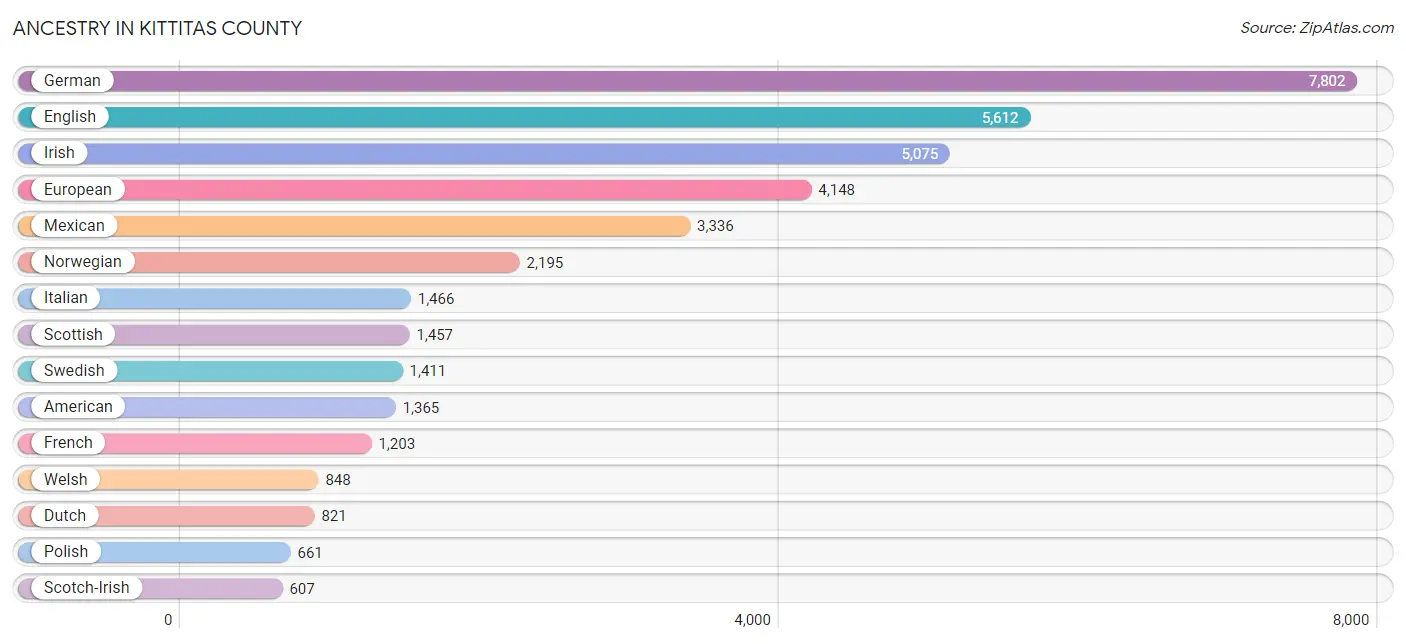
Ancestry in Kittitas County
The most populous ancestries reported in Kittitas County are German (7,802 | 17.6%), English (5,612 | 12.6%), Irish (5,075 | 11.4%), European (4,148 | 9.3%), and Mexican (3,336 | 7.5%), together accounting for 58.5% of all Kittitas County residents.
| Ancestry | # Population | % Population |
| African | 214 | 0.5% |
| American | 1,365 | 3.1% |
| Apache | 10 | 0.0% |
| Arab | 78 | 0.2% |
| Australian | 60 | 0.1% |
| Austrian | 81 | 0.2% |
| Basque | 41 | 0.1% |
| Bhutanese | 419 | 0.9% |
| Blackfeet | 103 | 0.2% |
| Brazilian | 21 | 0.1% |
| British | 490 | 1.1% |
| Bulgarian | 2 | 0.0% |
| Burmese | 91 | 0.2% |
| Cambodian | 10 | 0.0% |
| Canadian | 169 | 0.4% |
| Celtic | 8 | 0.0% |
| Central American | 34 | 0.1% |
| Cherokee | 160 | 0.4% |
| Chickasaw | 8 | 0.0% |
| Chinese | 7 | 0.0% |
| Chippewa | 22 | 0.1% |
| Choctaw | 5 | 0.0% |
| Colombian | 140 | 0.3% |
| Colville | 24 | 0.1% |
| Costa Rican | 10 | 0.0% |
| Cree | 8 | 0.0% |
| Croatian | 104 | 0.2% |
| Cuban | 44 | 0.1% |
| Czech | 251 | 0.6% |
| Czechoslovakian | 9 | 0.0% |
| Danish | 511 | 1.1% |
| Delaware | 1 | 0.0% |
| Dutch | 821 | 1.8% |
| Eastern European | 30 | 0.1% |
| English | 5,612 | 12.6% |
| Ethiopian | 54 | 0.1% |
| European | 4,148 | 9.3% |
| Fijian | 49 | 0.1% |
| Filipino | 29 | 0.1% |
| Finnish | 209 | 0.5% |
| French | 1,203 | 2.7% |
| French Canadian | 357 | 0.8% |
| German | 7,802 | 17.6% |
| German Russian | 14 | 0.0% |
| Greek | 50 | 0.1% |
| Guamanian / Chamorro | 53 | 0.1% |
| Haitian | 10 | 0.0% |
| Hopi | 32 | 0.1% |
| Hungarian | 52 | 0.1% |
| Icelander | 30 | 0.1% |
| Indian (Asian) | 300 | 0.7% |
| Inupiat | 14 | 0.0% |
| Iranian | 95 | 0.2% |
| Irish | 5,075 | 11.4% |
| Italian | 1,466 | 3.3% |
| Jamaican | 23 | 0.1% |
| Japanese | 38 | 0.1% |
| Korean | 303 | 0.7% |
| Laotian | 20 | 0.1% |
| Latvian | 31 | 0.1% |
| Lebanese | 51 | 0.1% |
| Lithuanian | 19 | 0.0% |
| Malaysian | 42 | 0.1% |
| Mexican | 3,336 | 7.5% |
| Mexican American Indian | 6 | 0.0% |
| Native Hawaiian | 58 | 0.1% |
| New Zealander | 15 | 0.0% |
| Nigerian | 7 | 0.0% |
| Northern European | 132 | 0.3% |
| Norwegian | 2,195 | 4.9% |
| Osage | 6 | 0.0% |
| Ottawa | 12 | 0.0% |
| Panamanian | 16 | 0.0% |
| Pennsylvania German | 87 | 0.2% |
| Peruvian | 2 | 0.0% |
| Polish | 661 | 1.5% |
| Portuguese | 113 | 0.3% |
| Potawatomi | 26 | 0.1% |
| Pueblo | 21 | 0.1% |
| Puerto Rican | 113 | 0.3% |
| Puget Sound Salish | 29 | 0.1% |
| Romanian | 106 | 0.2% |
| Russian | 135 | 0.3% |
| Salvadoran | 8 | 0.0% |
| Samoan | 54 | 0.1% |
| Scandinavian | 284 | 0.6% |
| Scotch-Irish | 607 | 1.4% |
| Scottish | 1,457 | 3.3% |
| Serbian | 11 | 0.0% |
| Sioux | 57 | 0.1% |
| Slavic | 23 | 0.1% |
| Slovak | 10 | 0.0% |
| Slovene | 61 | 0.1% |
| Somali | 3 | 0.0% |
| South African | 15 | 0.0% |
| South American | 142 | 0.3% |
| Spaniard | 406 | 0.9% |
| Spanish | 86 | 0.2% |
| Sri Lankan | 124 | 0.3% |
| Subsaharan African | 353 | 0.8% |
| Sudanese | 3 | 0.0% |
| Swedish | 1,411 | 3.2% |
| Swiss | 232 | 0.5% |
| Thai | 10 | 0.0% |
| Tlingit-Haida | 3 | 0.0% |
| Trinidadian and Tobagonian | 18 | 0.0% |
| Ukrainian | 97 | 0.2% |
| Welsh | 848 | 1.9% |
| Yakama | 87 | 0.2% |
| Yugoslavian | 86 | 0.2% |
| Yup'ik | 28 | 0.1% |
| Zimbabwean | 41 | 0.1% | View All 112 Rows |
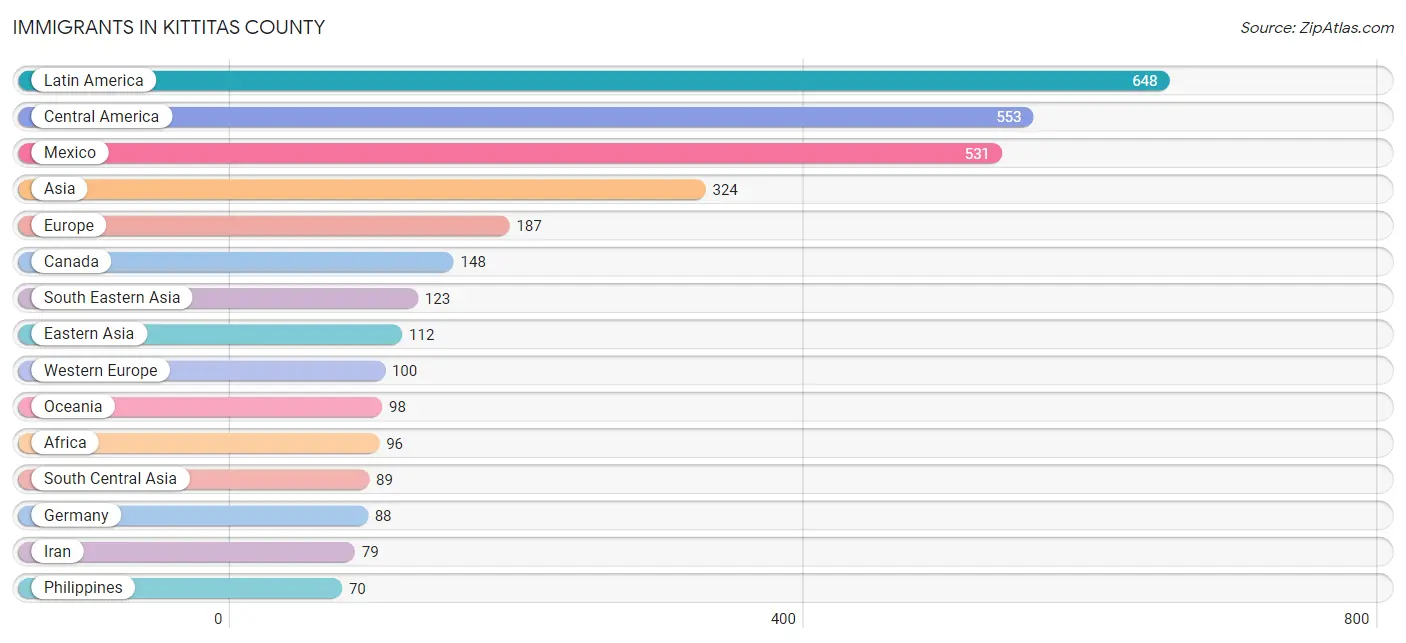
Immigrants in Kittitas County
The most numerous immigrant groups reported in Kittitas County came from Latin America (648 | 1.5%), Central America (553 | 1.2%), Mexico (531 | 1.2%), Asia (324 | 0.7%), and Europe (187 | 0.4%), together accounting for 5.1% of all Kittitas County residents.
| Immigration Origin | # Population | % Population |
| Africa | 96 | 0.2% |
| Asia | 324 | 0.7% |
| Australia | 56 | 0.1% |
| Brazil | 10 | 0.0% |
| Canada | 148 | 0.3% |
| Caribbean | 33 | 0.1% |
| Central America | 553 | 1.2% |
| China | 57 | 0.1% |
| Colombia | 44 | 0.1% |
| Denmark | 17 | 0.0% |
| Eastern Africa | 41 | 0.1% |
| Eastern Asia | 112 | 0.3% |
| Eastern Europe | 21 | 0.1% |
| El Salvador | 18 | 0.0% |
| England | 35 | 0.1% |
| Europe | 187 | 0.4% |
| France | 2 | 0.0% |
| Germany | 88 | 0.2% |
| Ghana | 31 | 0.1% |
| Haiti | 10 | 0.0% |
| Hong Kong | 12 | 0.0% |
| India | 10 | 0.0% |
| Indonesia | 4 | 0.0% |
| Iran | 79 | 0.2% |
| Jamaica | 23 | 0.1% |
| Japan | 44 | 0.1% |
| Korea | 11 | 0.0% |
| Latin America | 648 | 1.5% |
| Latvia | 18 | 0.0% |
| Mexico | 531 | 1.2% |
| Micronesia | 13 | 0.0% |
| Morocco | 7 | 0.0% |
| Netherlands | 10 | 0.0% |
| Northern Africa | 7 | 0.0% |
| Northern Europe | 66 | 0.2% |
| Oceania | 98 | 0.2% |
| Panama | 4 | 0.0% |
| Peru | 2 | 0.0% |
| Philippines | 70 | 0.2% |
| Scotland | 6 | 0.0% |
| Somalia | 3 | 0.0% |
| South America | 62 | 0.1% |
| South Central Asia | 89 | 0.2% |
| South Eastern Asia | 123 | 0.3% |
| Taiwan | 9 | 0.0% |
| Ukraine | 3 | 0.0% |
| Venezuela | 6 | 0.0% |
| Vietnam | 49 | 0.1% |
| Western Africa | 31 | 0.1% |
| Western Europe | 100 | 0.2% | View All 50 Rows |
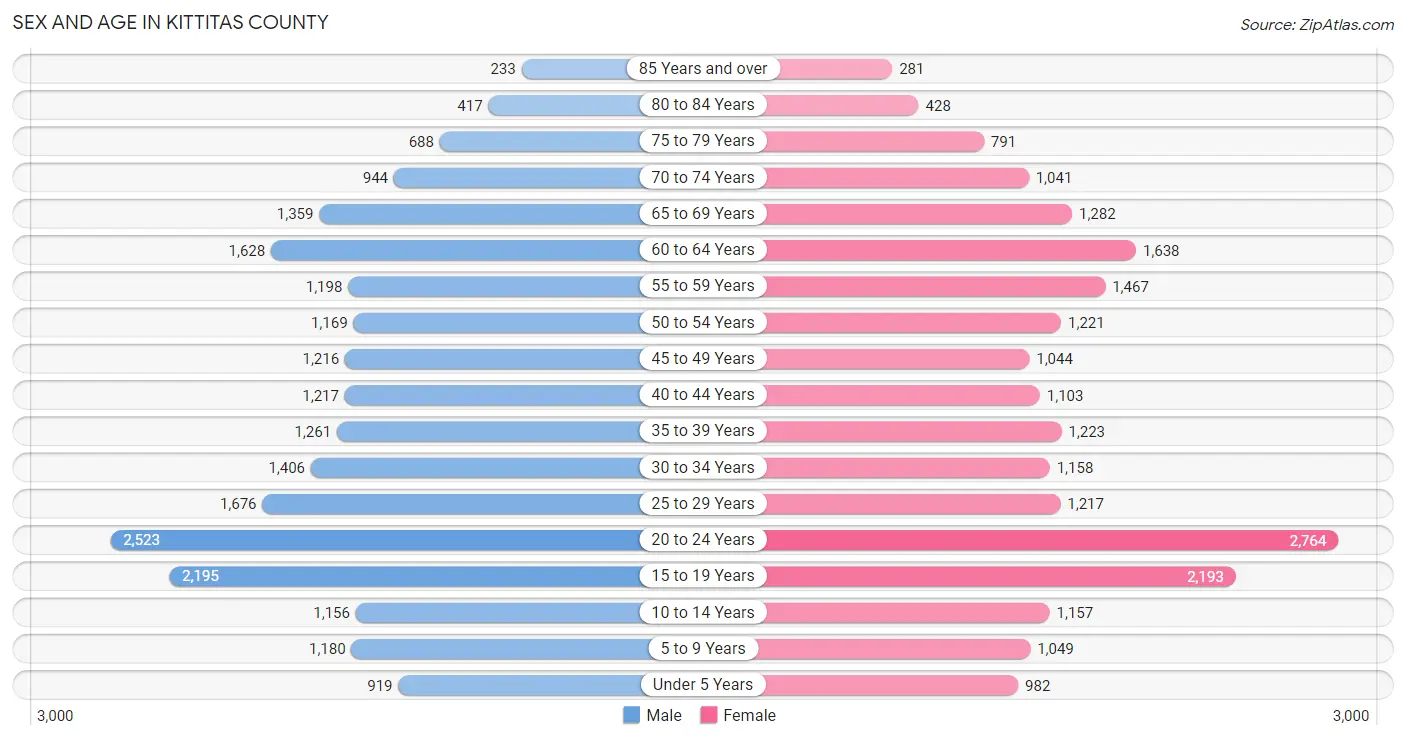
Sex and Age in Kittitas County
Sex and Age in Kittitas County
The most populous age groups in Kittitas County are 20 to 24 Years (2,523 | 11.3%) for men and 20 to 24 Years (2,764 | 12.5%) for women.
| Age Bracket | Male | Female |
| Under 5 Years | 919 (4.1%) | 982 (4.5%) |
| 5 to 9 Years | 1,180 (5.3%) | 1,049 (4.8%) |
| 10 to 14 Years | 1,156 (5.2%) | 1,157 (5.2%) |
| 15 to 19 Years | 2,195 (9.8%) | 2,193 (10.0%) |
| 20 to 24 Years | 2,523 (11.3%) | 2,764 (12.5%) |
| 25 to 29 Years | 1,676 (7.5%) | 1,217 (5.5%) |
| 30 to 34 Years | 1,406 (6.3%) | 1,158 (5.2%) |
| 35 to 39 Years | 1,261 (5.6%) | 1,223 (5.6%) |
| 40 to 44 Years | 1,217 (5.4%) | 1,103 (5.0%) |
| 45 to 49 Years | 1,216 (5.4%) | 1,044 (4.7%) |
| 50 to 54 Years | 1,169 (5.2%) | 1,221 (5.5%) |
| 55 to 59 Years | 1,198 (5.3%) | 1,467 (6.7%) |
| 60 to 64 Years | 1,628 (7.3%) | 1,638 (7.4%) |
| 65 to 69 Years | 1,359 (6.1%) | 1,282 (5.8%) |
| 70 to 74 Years | 944 (4.2%) | 1,041 (4.7%) |
| 75 to 79 Years | 688 (3.1%) | 791 (3.6%) |
| 80 to 84 Years | 417 (1.9%) | 428 (1.9%) |
| 85 Years and over | 233 (1.0%) | 281 (1.3%) |
| Total | 22,385 (100.0%) | 22,039 (100.0%) |
Families and Households in Kittitas County
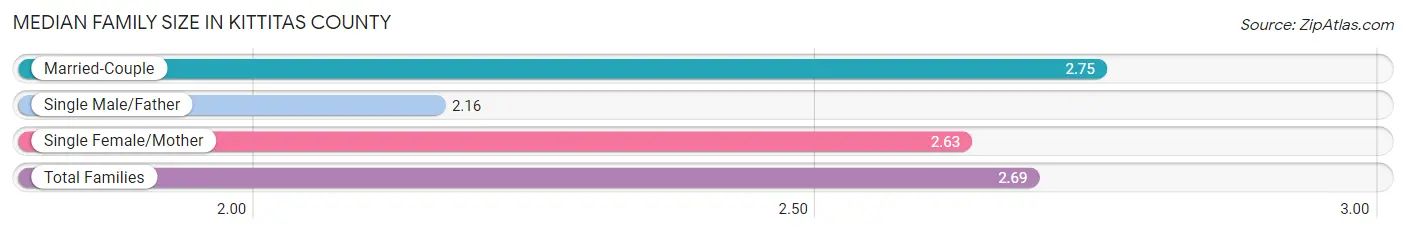
Median Family Size in Kittitas County
The median family size in Kittitas County is 2.69 persons per family, with married-couple families (9,020 | 79.6%) accounting for the largest median family size of 2.75 persons per family. On the other hand, single male/father families (809 | 7.1%) represent the smallest median family size with 2.16 persons per family.
| Family Type | # Families | Family Size |
| Married-Couple | 9,020 (79.6%) | 2.75 |
| Single Male/Father | 809 (7.1%) | 2.16 |
| Single Female/Mother | 1,504 (13.3%) | 2.63 |
| Total Families | 11,333 (100.0%) | 2.69 |
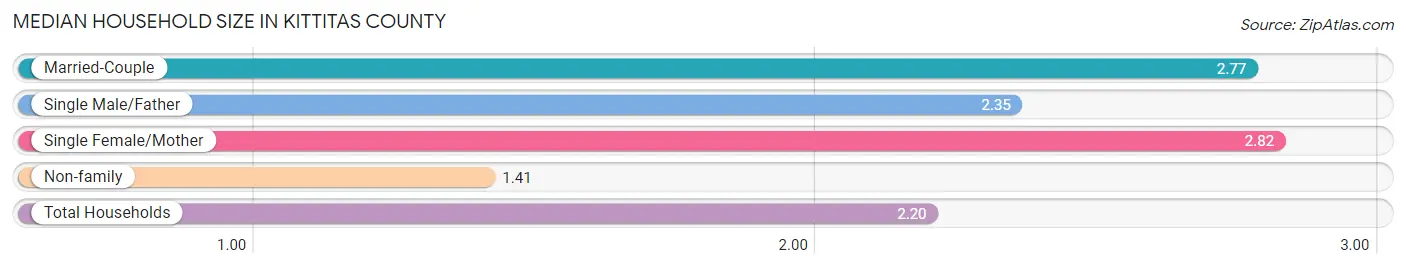
Median Household Size in Kittitas County
The median household size in Kittitas County is 2.20 persons per household, with single female/mother households (1,504 | 7.8%) accounting for the largest median household size of 2.82 persons per household. non-family households (7,917 | 41.1%) represent the smallest median household size with 1.41 persons per household.
| Household Type | # Households | Household Size |
| Married-Couple | 9,020 (46.9%) | 2.77 |
| Single Male/Father | 809 (4.2%) | 2.35 |
| Single Female/Mother | 1,504 (7.8%) | 2.82 |
| Non-family | 7,917 (41.1%) | 1.41 |
| Total Households | 19,250 (100.0%) | 2.20 |
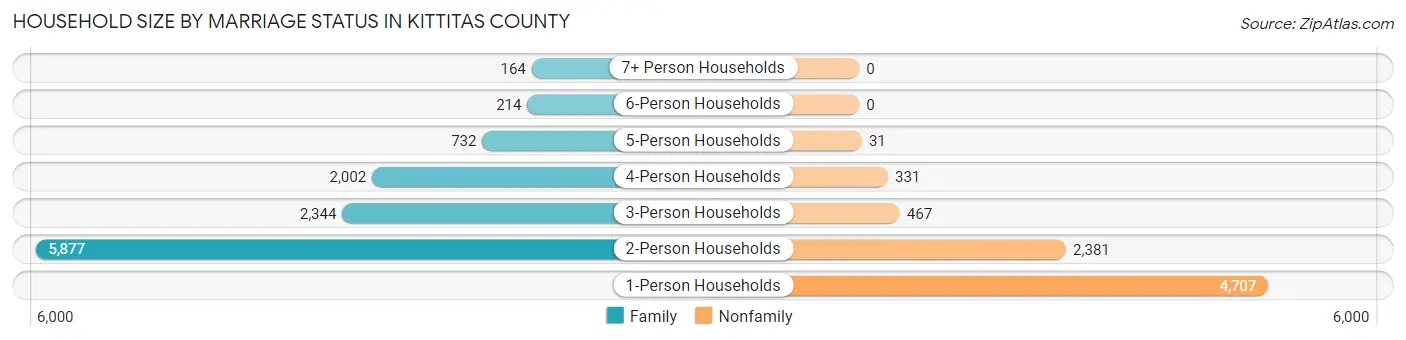
Household Size by Marriage Status in Kittitas County
Out of a total of 19,250 households in Kittitas County, 11,333 (58.9%) are family households, while 7,917 (41.1%) are nonfamily households. The most numerous type of family households are 2-person households, comprising 5,877, and the most common type of nonfamily households are 1-person households, comprising 4,707.
| Household Size | Family Households | Nonfamily Households |
| 1-Person Households | - | 4,707 (24.4%) |
| 2-Person Households | 5,877 (30.5%) | 2,381 (12.4%) |
| 3-Person Households | 2,344 (12.2%) | 467 (2.4%) |
| 4-Person Households | 2,002 (10.4%) | 331 (1.7%) |
| 5-Person Households | 732 (3.8%) | 31 (0.2%) |
| 6-Person Households | 214 (1.1%) | 0 (0.0%) |
| 7+ Person Households | 164 (0.9%) | 0 (0.0%) |
| Total | 11,333 (58.9%) | 7,917 (41.1%) |
Female Fertility in Kittitas County
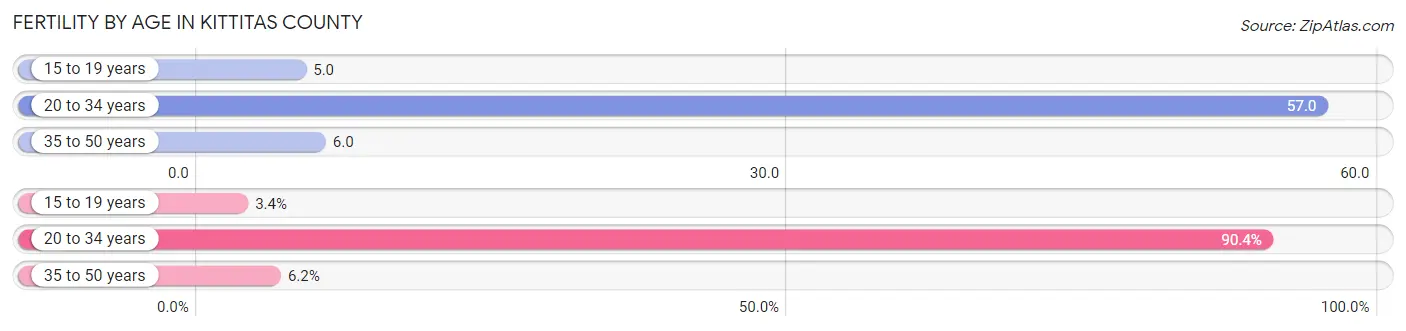
Fertility by Age in Kittitas County
Average fertility rate in Kittitas County is 29.0 births per 1,000 women. Women in the age bracket of 20 to 34 years have the highest fertility rate with 57.0 births per 1,000 women. Women in the age bracket of 20 to 34 years acount for 90.4% of all women with births.
| Age Bracket | Women with Births | Births / 1,000 Women |
| 15 to 19 years | 11 (3.4%) | 5.0 |
| 20 to 34 years | 292 (90.4%) | 57.0 |
| 35 to 50 years | 20 (6.2%) | 6.0 |
| Total | 323 (100.0%) | 29.0 |
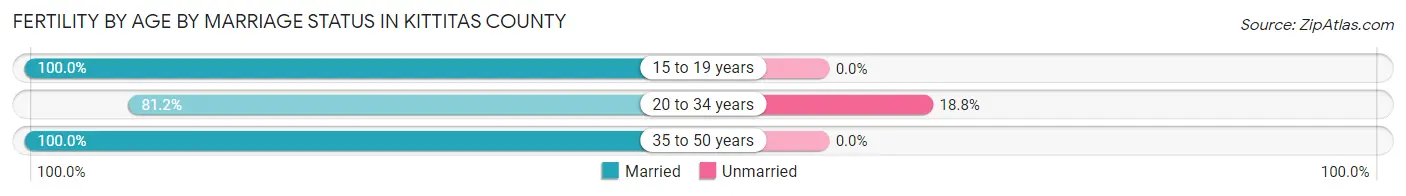
Fertility by Age by Marriage Status in Kittitas County
83.0% of women with births (323) in Kittitas County are married. The highest percentage of unmarried women with births falls into 20 to 34 years age bracket with 18.8% of them unmarried at the time of birth, while the lowest percentage of unmarried women with births belong to 15 to 19 years age bracket with 0.0% of them unmarried.
| Age Bracket | Married | Unmarried |
| 15 to 19 years | 11 (100.0%) | 0 (0.0%) |
| 20 to 34 years | 237 (81.2%) | 55 (18.8%) |
| 35 to 50 years | 20 (100.0%) | 0 (0.0%) |
| Total | 268 (83.0%) | 55 (17.0%) |
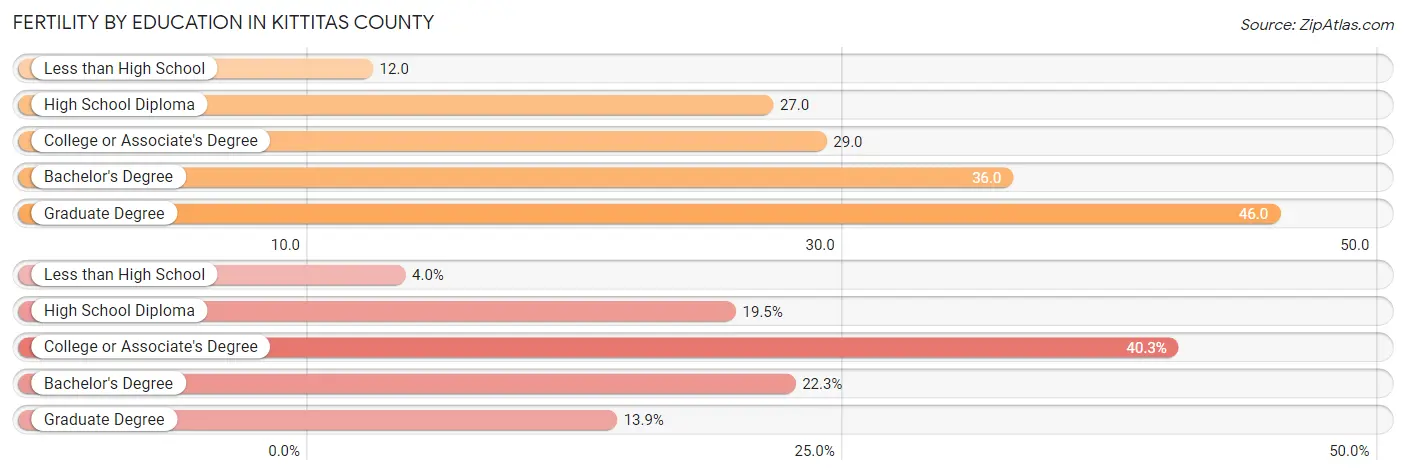
Fertility by Education in Kittitas County
Average fertility rate in Kittitas County is 29.0 births per 1,000 women. Women with the education attainment of graduate degree have the highest fertility rate of 46.0 births per 1,000 women, while women with the education attainment of less than high school have the lowest fertility at 12.0 births per 1,000 women. Women with the education attainment of college or associate's degree represent 40.3% of all women with births.
| Educational Attainment | Women with Births | Births / 1,000 Women |
| Less than High School | 13 (4.0%) | 12.0 |
| High School Diploma | 63 (19.5%) | 27.0 |
| College or Associate's Degree | 130 (40.3%) | 29.0 |
| Bachelor's Degree | 72 (22.3%) | 36.0 |
| Graduate Degree | 45 (13.9%) | 46.0 |
| Total | 323 (100.0%) | 29.0 |
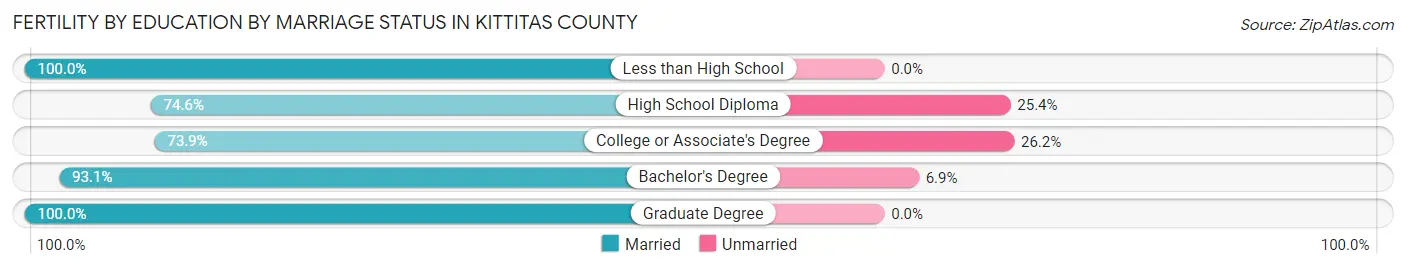
Fertility by Education by Marriage Status in Kittitas County
17.0% of women with births in Kittitas County are unmarried. Women with the educational attainment of less than high school are most likely to be married with 100.0% of them married at childbirth, while women with the educational attainment of college or associate's degree are least likely to be married with 26.2% of them unmarried at childbirth.
| Educational Attainment | Married | Unmarried |
| Less than High School | 13 (100.0%) | 0 (0.0%) |
| High School Diploma | 47 (74.6%) | 16 (25.4%) |
| College or Associate's Degree | 96 (73.9%) | 34 (26.2%) |
| Bachelor's Degree | 67 (93.1%) | 5 (6.9%) |
| Graduate Degree | 45 (100.0%) | 0 (0.0%) |
| Total | 268 (83.0%) | 55 (17.0%) |
Income in Kittitas County
Income Overview in Kittitas County
Per Capita Income in Kittitas County is $39,399, while median incomes of families and households are $94,018 and $66,800 respectively.
| Characteristic | Number | Measure |
| Per Capita Income | 44,424 | $39,399 |
| Median Family Income | 11,333 | $94,018 |
| Mean Family Income | 11,333 | $114,807 |
| Median Household Income | 19,250 | $66,800 |
| Mean Household Income | 19,250 | $91,848 |
| Income Deficit | 11,333 | $11,663 |
| Wage / Income Gap (%) | 44,424 | 30.74% |
| Wage / Income Gap ($) | 44,424 | 69.26¢ per $1 |
| Gini / Inequality Index | 44,424 | 0.46 |
Earnings by Sex in Kittitas County
Average Earnings in Kittitas County are $37,556, $43,127 for men and $29,868 for women, a difference of 30.7%.
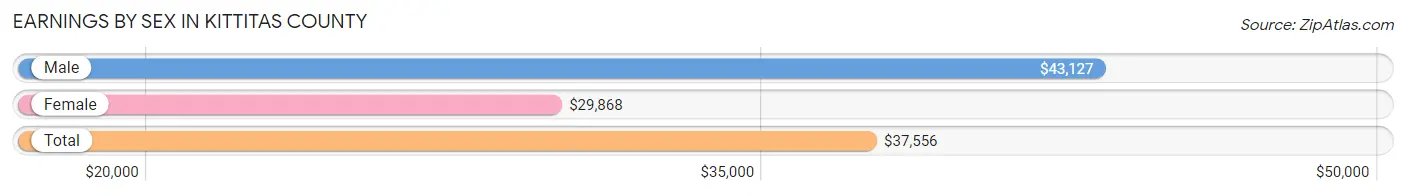
| Sex | Number | Average Earnings |
| Male | 13,909 (53.7%) | $43,127 |
| Female | 11,993 (46.3%) | $29,868 |
| Total | 25,902 (100.0%) | $37,556 |
Earnings by Sex by Income Bracket in Kittitas County
The most common earnings brackets in Kittitas County are $100,000+ for men (2,366 | 17.0%) and $100,000+ for women (936 | 7.8%).
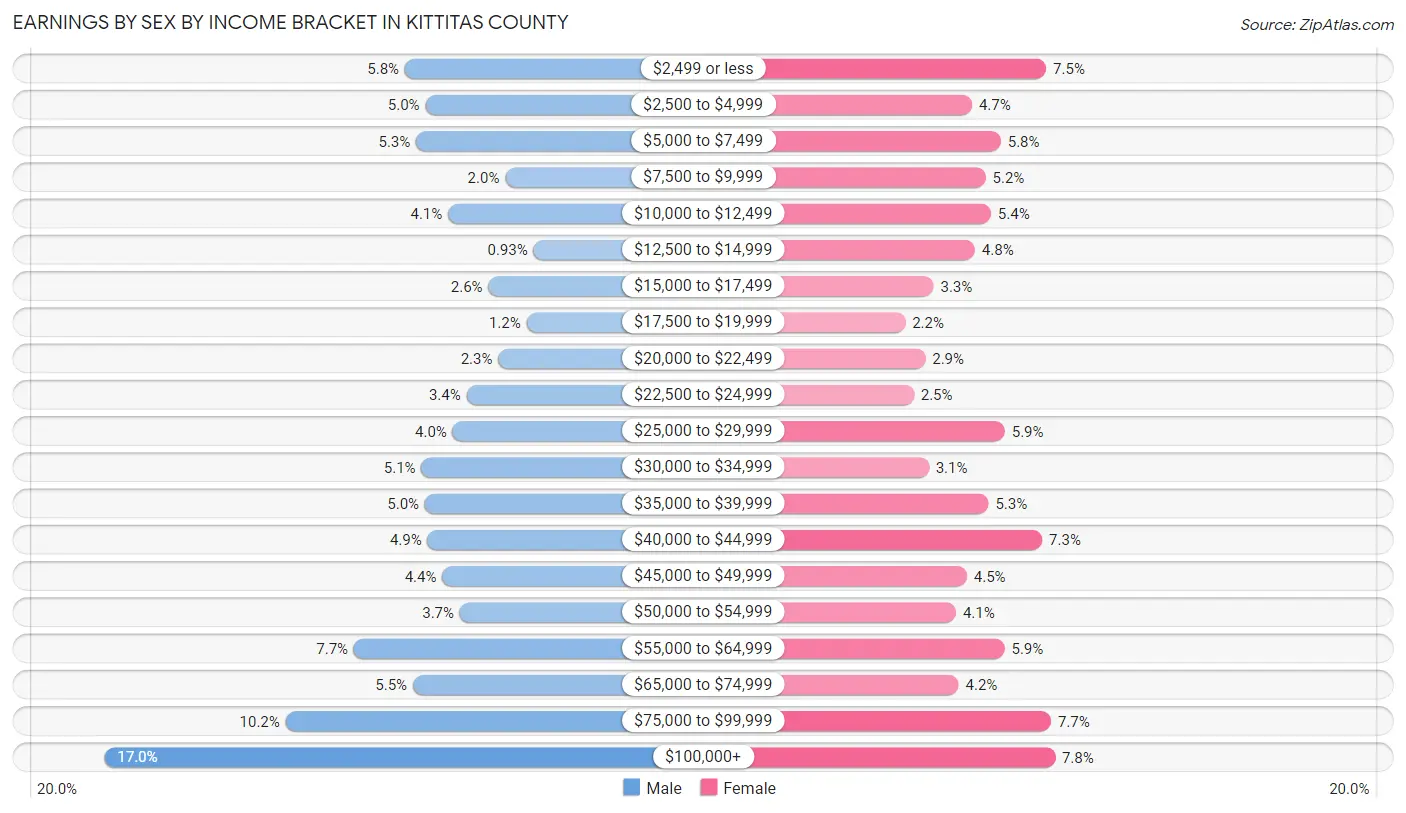
| Income | Male | Female |
| $2,499 or less | 800 (5.8%) | 896 (7.5%) |
| $2,500 to $4,999 | 692 (5.0%) | 563 (4.7%) |
| $5,000 to $7,499 | 741 (5.3%) | 692 (5.8%) |
| $7,500 to $9,999 | 277 (2.0%) | 624 (5.2%) |
| $10,000 to $12,499 | 575 (4.1%) | 648 (5.4%) |
| $12,500 to $14,999 | 130 (0.9%) | 576 (4.8%) |
| $15,000 to $17,499 | 365 (2.6%) | 390 (3.3%) |
| $17,500 to $19,999 | 166 (1.2%) | 263 (2.2%) |
| $20,000 to $22,499 | 313 (2.2%) | 352 (2.9%) |
| $22,500 to $24,999 | 479 (3.4%) | 301 (2.5%) |
| $25,000 to $29,999 | 551 (4.0%) | 710 (5.9%) |
| $30,000 to $34,999 | 714 (5.1%) | 368 (3.1%) |
| $35,000 to $39,999 | 696 (5.0%) | 637 (5.3%) |
| $40,000 to $44,999 | 681 (4.9%) | 878 (7.3%) |
| $45,000 to $49,999 | 605 (4.3%) | 540 (4.5%) |
| $50,000 to $54,999 | 513 (3.7%) | 490 (4.1%) |
| $55,000 to $64,999 | 1,066 (7.7%) | 709 (5.9%) |
| $65,000 to $74,999 | 758 (5.4%) | 502 (4.2%) |
| $75,000 to $99,999 | 1,421 (10.2%) | 918 (7.6%) |
| $100,000+ | 2,366 (17.0%) | 936 (7.8%) |
| Total | 13,909 (100.0%) | 11,993 (100.0%) |
Earnings by Sex by Educational Attainment in Kittitas County
Average earnings in Kittitas County are $58,546 for men and $43,221 for women, a difference of 26.2%. Men with an educational attainment of graduate degree enjoy the highest average annual earnings of $83,667, while those with college or associate's degree education earn the least with $53,135. Women with an educational attainment of graduate degree earn the most with the average annual earnings of $66,797, while those with less than high school education have the smallest earnings of $27,986.
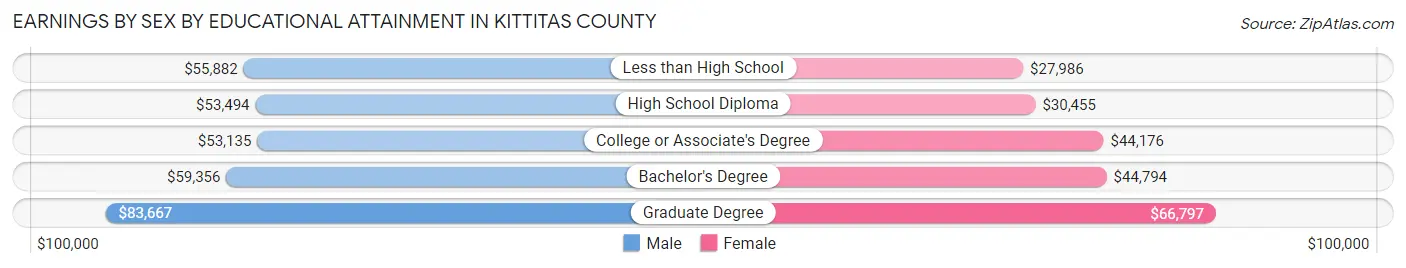
| Educational Attainment | Male Income | Female Income |
| Less than High School | $55,882 | $27,986 |
| High School Diploma | $53,494 | $30,455 |
| College or Associate's Degree | $53,135 | $44,176 |
| Bachelor's Degree | $59,356 | $44,794 |
| Graduate Degree | $83,667 | $66,797 |
| Total | $58,546 | $43,221 |
Family Income in Kittitas County
Family Income Brackets in Kittitas County
According to the Kittitas County family income data, there are 2,675 families falling into the $100,000 to $149,999 income range, which is the most common income bracket and makes up 23.6% of all families. Conversely, the $10,000 to $14,999 income bracket is the least frequent group with only 261 families (2.3%) belonging to this category.
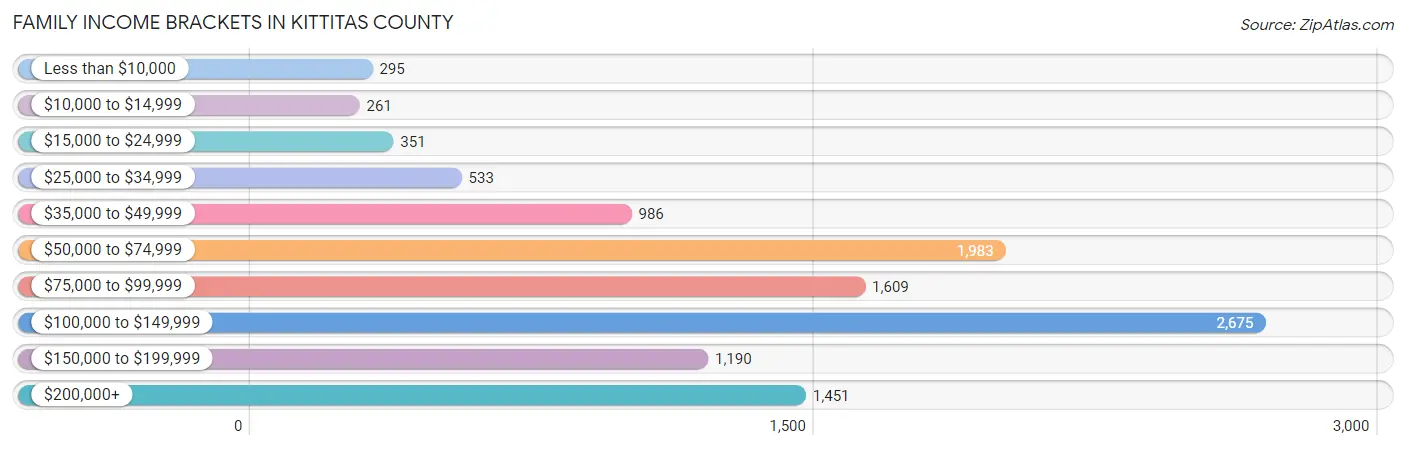
| Income Bracket | # Families | % Families |
| Less than $10,000 | 295 | 2.6% |
| $10,000 to $14,999 | 261 | 2.3% |
| $15,000 to $24,999 | 351 | 3.1% |
| $25,000 to $34,999 | 533 | 4.7% |
| $35,000 to $49,999 | 986 | 8.7% |
| $50,000 to $74,999 | 1,983 | 17.5% |
| $75,000 to $99,999 | 1,609 | 14.2% |
| $100,000 to $149,999 | 2,675 | 23.6% |
| $150,000 to $199,999 | 1,190 | 10.5% |
| $200,000+ | 1,451 | 12.8% |
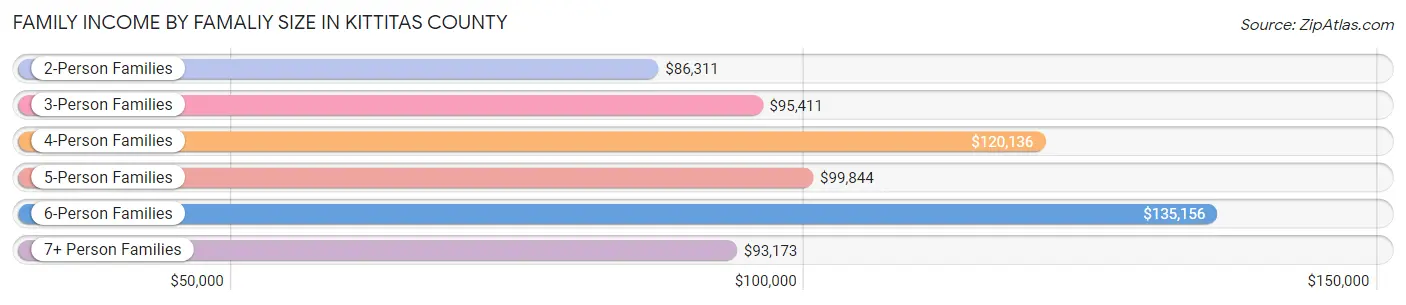
Family Income by Famaliy Size in Kittitas County
6-person families (179 | 1.6%) account for the highest median family income in Kittitas County with $135,156 per family, while 2-person families (6,149 | 54.3%) have the highest median income of $43,156 per family member.
| Income Bracket | # Families | Median Income |
| 2-Person Families | 6,149 (54.3%) | $86,311 |
| 3-Person Families | 2,408 (21.2%) | $95,411 |
| 4-Person Families | 1,772 (15.6%) | $120,136 |
| 5-Person Families | 683 (6.0%) | $99,844 |
| 6-Person Families | 179 (1.6%) | $135,156 |
| 7+ Person Families | 142 (1.3%) | $93,173 |
| Total | 11,333 (100.0%) | $94,018 |
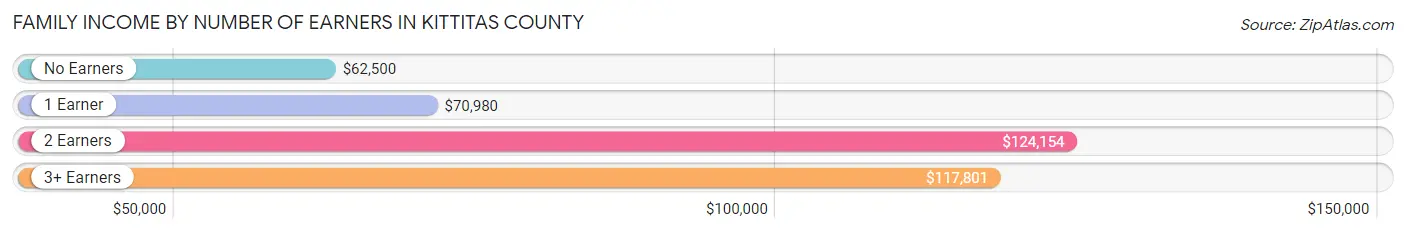
Family Income by Number of Earners in Kittitas County
The median family income in Kittitas County is $94,018, with families comprising 2 earners (4,813) having the highest median family income of $124,154, while families with no earners (1,844) have the lowest median family income of $62,500, accounting for 42.5% and 16.3% of families, respectively.
| Number of Earners | # Families | Median Income |
| No Earners | 1,844 (16.3%) | $62,500 |
| 1 Earner | 3,577 (31.6%) | $70,980 |
| 2 Earners | 4,813 (42.5%) | $124,154 |
| 3+ Earners | 1,099 (9.7%) | $117,801 |
| Total | 11,333 (100.0%) | $94,018 |
Household Income in Kittitas County
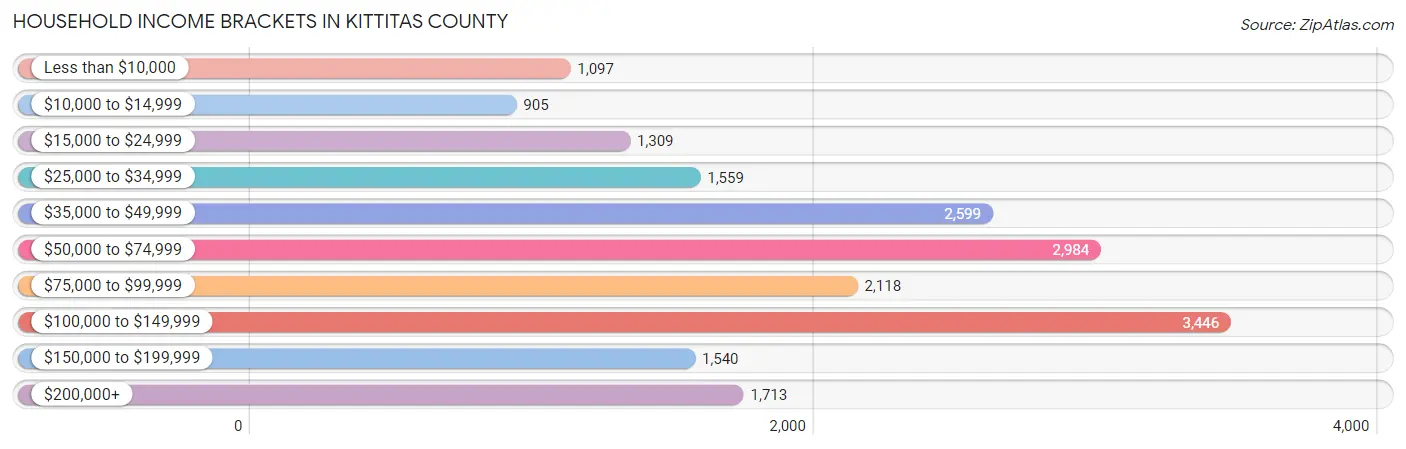
Household Income Brackets in Kittitas County
With 3,446 households falling in the category, the $100,000 to $149,999 income range is the most frequent in Kittitas County, accounting for 17.9% of all households. In contrast, only 905 households (4.7%) fall into the $10,000 to $14,999 income bracket, making it the least populous group.
| Income Bracket | # Households | % Households |
| Less than $10,000 | 1,097 | 5.7% |
| $10,000 to $14,999 | 905 | 4.7% |
| $15,000 to $24,999 | 1,309 | 6.8% |
| $25,000 to $34,999 | 1,559 | 8.1% |
| $35,000 to $49,999 | 2,599 | 13.5% |
| $50,000 to $74,999 | 2,984 | 15.5% |
| $75,000 to $99,999 | 2,118 | 11.0% |
| $100,000 to $149,999 | 3,446 | 17.9% |
| $150,000 to $199,999 | 1,540 | 8.0% |
| $200,000+ | 1,713 | 8.9% |
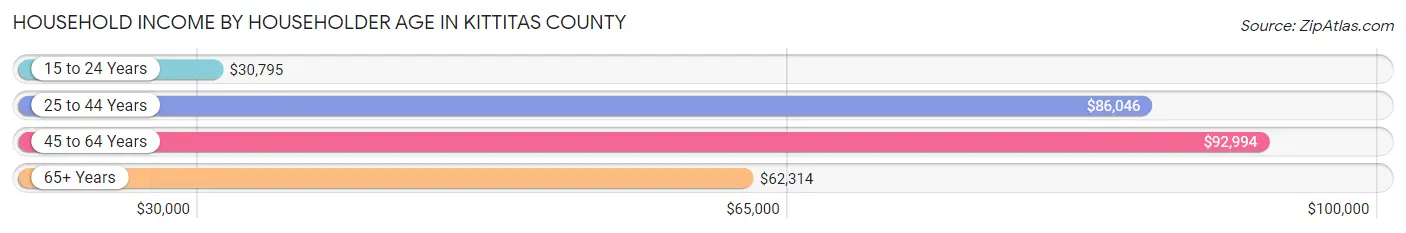
Household Income by Householder Age in Kittitas County
The median household income in Kittitas County is $66,800, with the highest median household income of $92,994 found in the 45 to 64 years age bracket for the primary householder. A total of 6,326 households (32.9%) fall into this category. Meanwhile, the 15 to 24 years age bracket for the primary householder has the lowest median household income of $30,795, with 2,796 households (14.5%) in this group.
| Income Bracket | # Households | Median Income |
| 15 to 24 Years | 2,796 (14.5%) | $30,795 |
| 25 to 44 Years | 5,333 (27.7%) | $86,046 |
| 45 to 64 Years | 6,326 (32.9%) | $92,994 |
| 65+ Years | 4,795 (24.9%) | $62,314 |
| Total | 19,250 (100.0%) | $66,800 |
Poverty in Kittitas County
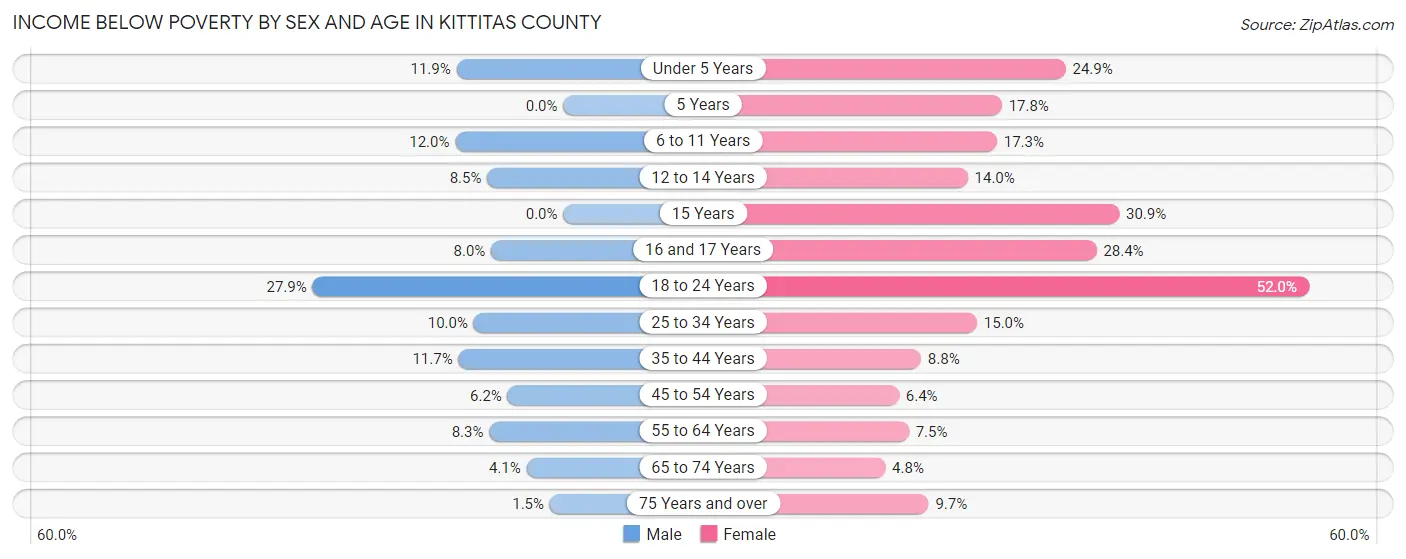
Income Below Poverty by Sex and Age in Kittitas County
With 11.0% poverty level for males and 18.0% for females among the residents of Kittitas County, 18 to 24 year old males and 18 to 24 year old females are the most vulnerable to poverty, with 885 males (27.9%) and 1,825 females (52.0%) in their respective age groups living below the poverty level.
| Age Bracket | Male | Female |
| Under 5 Years | 107 (11.9%) | 238 (24.9%) |
| 5 Years | 0 (0.0%) | 13 (17.8%) |
| 6 to 11 Years | 175 (12.0%) | 243 (17.3%) |
| 12 to 14 Years | 55 (8.5%) | 96 (14.0%) |
| 15 Years | 0 (0.0%) | 67 (30.9%) |
| 16 and 17 Years | 41 (8.0%) | 116 (28.4%) |
| 18 to 24 Years | 885 (27.9%) | 1,825 (52.0%) |
| 25 to 34 Years | 294 (10.0%) | 354 (15.0%) |
| 35 to 44 Years | 289 (11.7%) | 205 (8.8%) |
| 45 to 54 Years | 147 (6.2%) | 142 (6.4%) |
| 55 to 64 Years | 233 (8.3%) | 228 (7.4%) |
| 65 to 74 Years | 94 (4.1%) | 112 (4.8%) |
| 75 Years and over | 20 (1.5%) | 142 (9.7%) |
| Total | 2,340 (11.0%) | 3,781 (18.0%) |
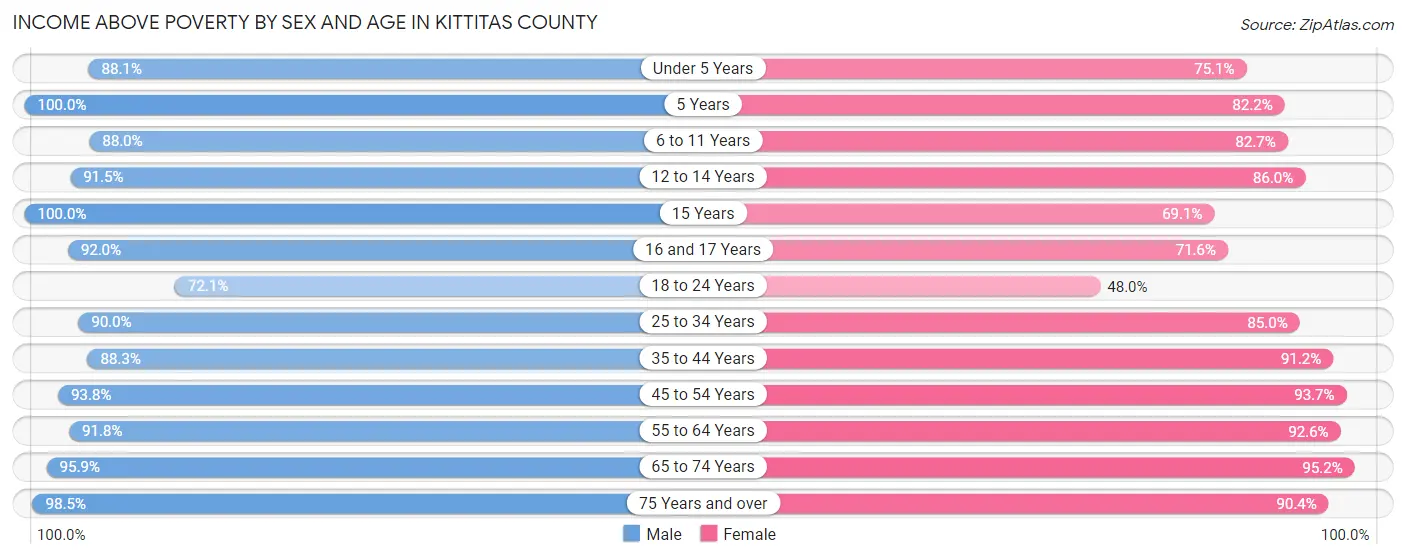
Income Above Poverty by Sex and Age in Kittitas County
According to the poverty statistics in Kittitas County, males aged 5 years and females aged 65 to 74 years are the age groups that are most secure financially, with 100.0% of males and 95.2% of females in these age groups living above the poverty line.
| Age Bracket | Male | Female |
| Under 5 Years | 793 (88.1%) | 717 (75.1%) |
| 5 Years | 160 (100.0%) | 60 (82.2%) |
| 6 to 11 Years | 1,280 (88.0%) | 1,165 (82.7%) |
| 12 to 14 Years | 594 (91.5%) | 589 (86.0%) |
| 15 Years | 130 (100.0%) | 150 (69.1%) |
| 16 and 17 Years | 469 (92.0%) | 293 (71.6%) |
| 18 to 24 Years | 2,284 (72.1%) | 1,684 (48.0%) |
| 25 to 34 Years | 2,656 (90.0%) | 2,000 (85.0%) |
| 35 to 44 Years | 2,185 (88.3%) | 2,121 (91.2%) |
| 45 to 54 Years | 2,223 (93.8%) | 2,094 (93.6%) |
| 55 to 64 Years | 2,592 (91.7%) | 2,834 (92.5%) |
| 65 to 74 Years | 2,205 (95.9%) | 2,208 (95.2%) |
| 75 Years and over | 1,310 (98.5%) | 1,330 (90.3%) |
| Total | 18,881 (89.0%) | 17,245 (82.0%) |
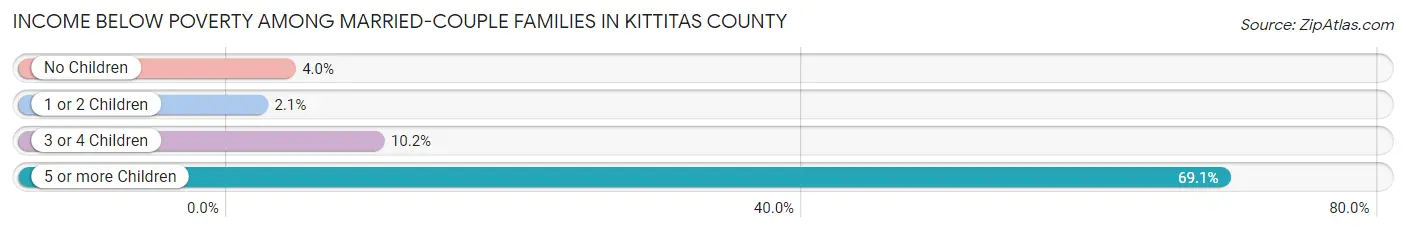
Income Below Poverty Among Married-Couple Families in Kittitas County
The poverty statistics for married-couple families in Kittitas County show that 4.2% or 376 of the total 9,020 families live below the poverty line. Families with 5 or more children have the highest poverty rate of 69.1%, comprising of 38 families. On the other hand, families with 1 or 2 children have the lowest poverty rate of 2.1%, which includes 56 families.
| Children | Above Poverty | Below Poverty |
| No Children | 5,456 (96.0%) | 226 (4.0%) |
| 1 or 2 Children | 2,676 (98.0%) | 56 (2.1%) |
| 3 or 4 Children | 495 (89.8%) | 56 (10.2%) |
| 5 or more Children | 17 (30.9%) | 38 (69.1%) |
| Total | 8,644 (95.8%) | 376 (4.2%) |
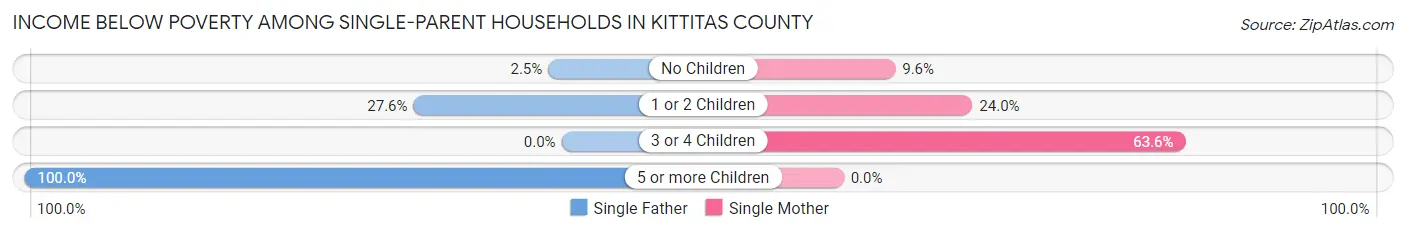
Income Below Poverty Among Single-Parent Households in Kittitas County
According to the poverty data in Kittitas County, 15.6% or 126 single-father households and 20.2% or 303 single-mother households are living below the poverty line. Among single-father households, those with 5 or more children have the highest poverty rate, with 27 households (100.0%) experiencing poverty. Likewise, among single-mother households, those with 3 or 4 children have the highest poverty rate, with 42 households (63.6%) falling below the poverty line.
| Children | Single Father | Single Mother |
| No Children | 11 (2.5%) | 56 (9.6%) |
| 1 or 2 Children | 88 (27.6%) | 205 (24.0%) |
| 3 or 4 Children | 0 (0.0%) | 42 (63.6%) |
| 5 or more Children | 27 (100.0%) | 0 (0.0%) |
| Total | 126 (15.6%) | 303 (20.2%) |
Income Below Poverty Among Married-Couple vs Single-Parent Households in Kittitas County
The poverty data for Kittitas County shows that 376 of the married-couple family households (4.2%) and 429 of the single-parent households (18.5%) are living below the poverty level. Within the married-couple family households, those with 5 or more children have the highest poverty rate, with 38 households (69.1%) falling below the poverty line. Among the single-parent households, those with 5 or more children have the highest poverty rate, with 27 household (100.0%) living below poverty.
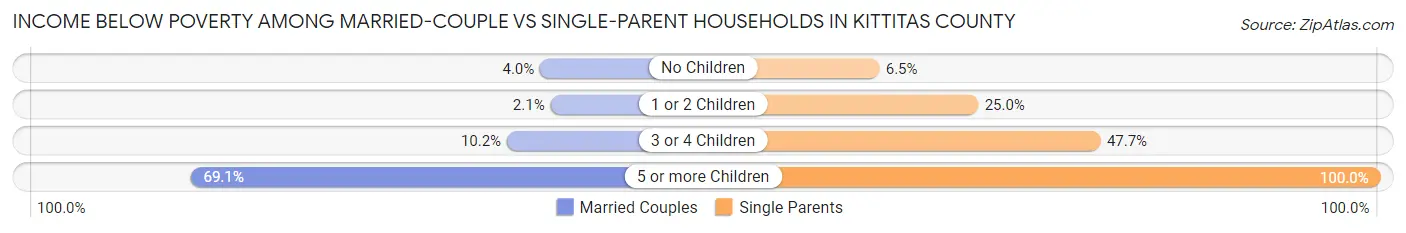
| Children | Married-Couple Families | Single-Parent Households |
| No Children | 226 (4.0%) | 67 (6.5%) |
| 1 or 2 Children | 56 (2.1%) | 293 (25.0%) |
| 3 or 4 Children | 56 (10.2%) | 42 (47.7%) |
| 5 or more Children | 38 (69.1%) | 27 (100.0%) |
| Total | 376 (4.2%) | 429 (18.5%) |
Employment Characteristics in Kittitas County
Employment by Class of Employer in Kittitas County
Among the 21,580 employed individuals in Kittitas County, private company employees (12,146 | 56.3%), state government employees (2,688 | 12.5%), and local government employees (2,022 | 9.4%) make up the most common classes of employment.
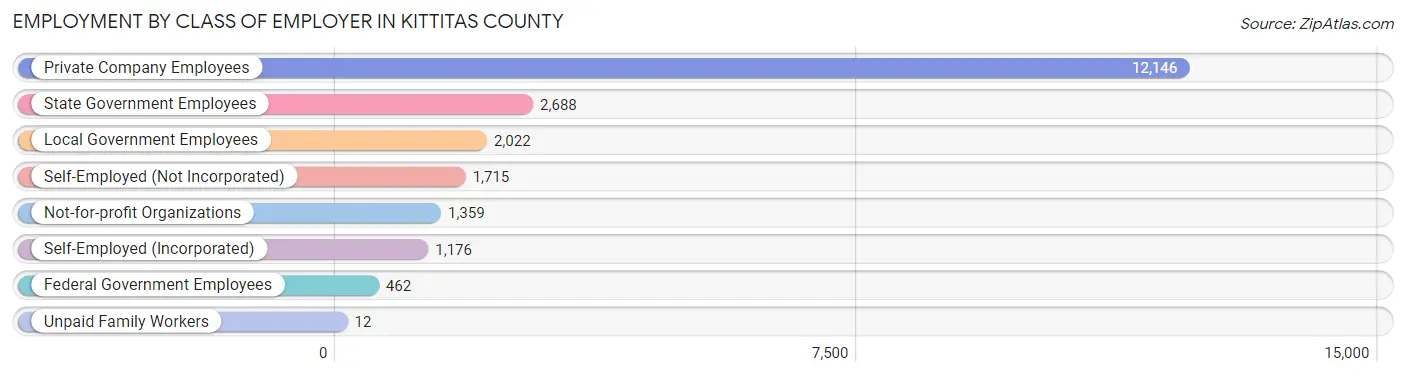
| Employer Class | # Employees | % Employees |
| Private Company Employees | 12,146 | 56.3% |
| Self-Employed (Incorporated) | 1,176 | 5.4% |
| Self-Employed (Not Incorporated) | 1,715 | 8.0% |
| Not-for-profit Organizations | 1,359 | 6.3% |
| Local Government Employees | 2,022 | 9.4% |
| State Government Employees | 2,688 | 12.5% |
| Federal Government Employees | 462 | 2.1% |
| Unpaid Family Workers | 12 | 0.1% |
| Total | 21,580 | 100.0% |
Employment Status by Age in Kittitas County
According to the labor force statistics for Kittitas County, out of the total population over 16 years of age (37,634), 62.5% or 23,521 individuals are in the labor force, with 5.9% or 1,388 of them unemployed. The age group with the highest labor force participation rate is 25 to 29 years, with 87.8% or 2,540 individuals in the labor force. Within the labor force, the 16 to 19 years age range has the highest percentage of unemployed individuals, with 25.1% or 492 of them being unemployed.
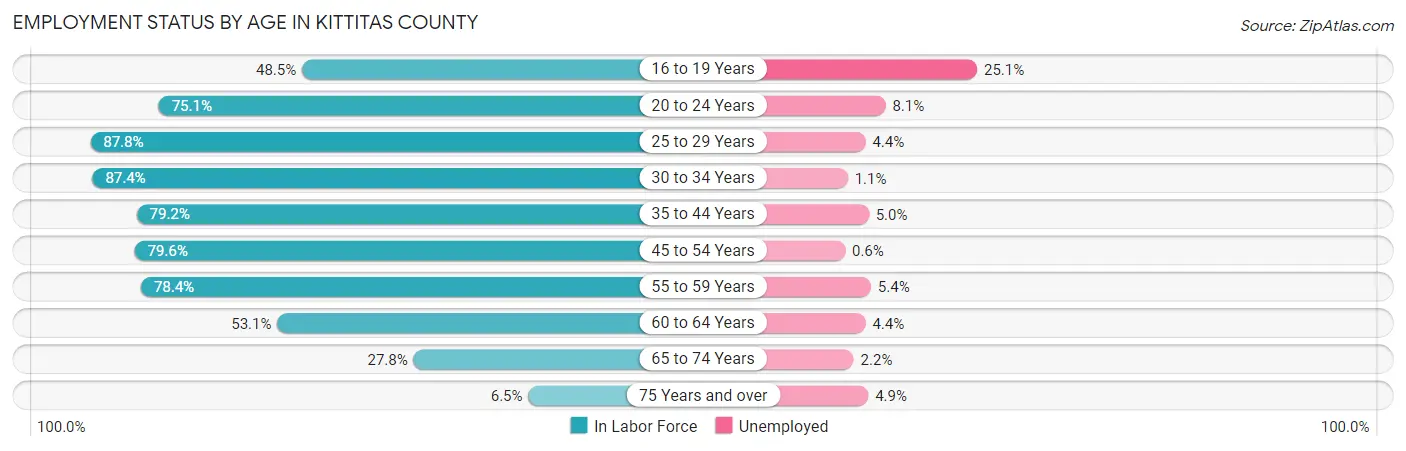
| Age Bracket | In Labor Force | Unemployed |
| 16 to 19 Years | 1,960 (48.5%) | 492 (25.1%) |
| 20 to 24 Years | 3,971 (75.1%) | 322 (8.1%) |
| 25 to 29 Years | 2,540 (87.8%) | 112 (4.4%) |
| 30 to 34 Years | 2,241 (87.4%) | 25 (1.1%) |
| 35 to 44 Years | 3,805 (79.2%) | 190 (5.0%) |
| 45 to 54 Years | 3,701 (79.6%) | 22 (0.6%) |
| 55 to 59 Years | 2,089 (78.4%) | 113 (5.4%) |
| 60 to 64 Years | 1,734 (53.1%) | 76 (4.4%) |
| 65 to 74 Years | 1,286 (27.8%) | 28 (2.2%) |
| 75 Years and over | 184 (6.5%) | 9 (4.9%) |
| Total | 23,521 (62.5%) | 1,388 (5.9%) |
Employment Status by Educational Attainment in Kittitas County
According to labor force statistics for Kittitas County, 77.3% of individuals (16,111) out of the total population between 25 and 64 years of age (20,842) are in the labor force, with 3.4% or 548 of them being unemployed. The group with the highest labor force participation rate are those with the educational attainment of bachelor's degree or higher, with 86.9% or 6,916 individuals in the labor force. Within the labor force, individuals with less than high school education have the highest percentage of unemployment, with 5.7% or 52 of them being unemployed.
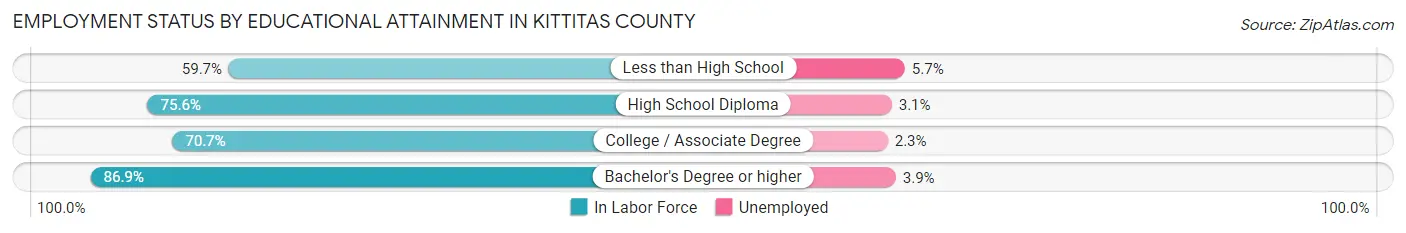
| Educational Attainment | In Labor Force | Unemployed |
| Less than High School | 918 (59.7%) | 88 (5.7%) |
| High School Diploma | 4,002 (75.6%) | 164 (3.1%) |
| College / Associate Degree | 4,279 (70.7%) | 139 (2.3%) |
| Bachelor's Degree or higher | 6,916 (86.9%) | 310 (3.9%) |
| Total | 16,111 (77.3%) | 709 (3.4%) |
Employment Occupations by Sex in Kittitas County
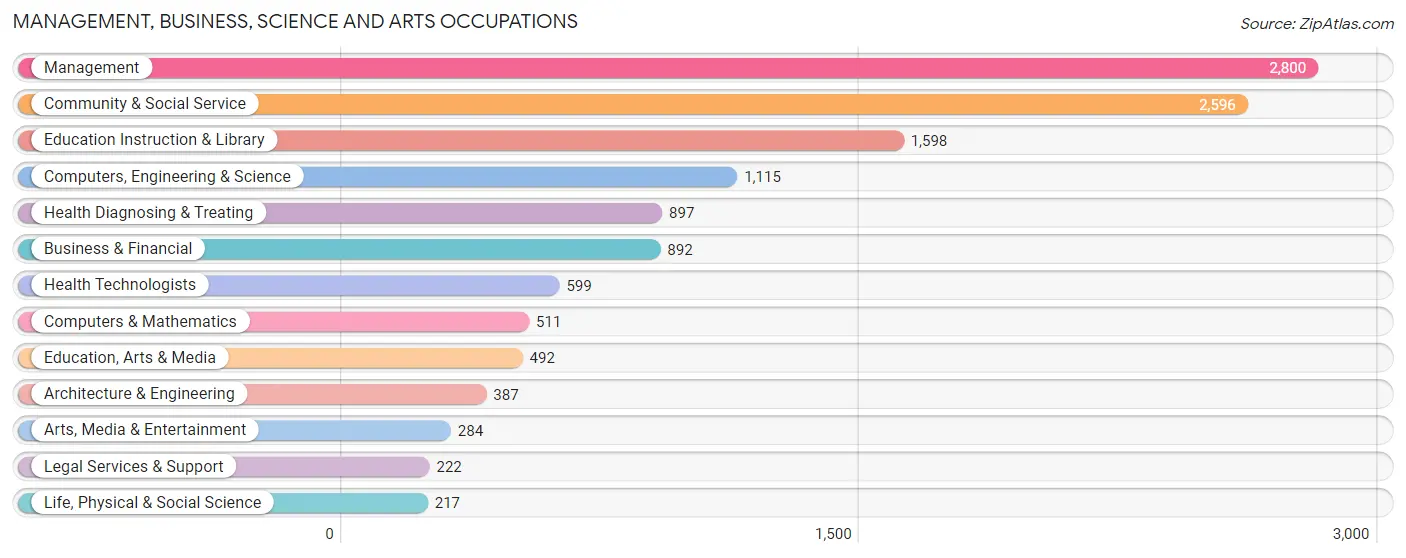
Management, Business, Science and Arts Occupations
The most common Management, Business, Science and Arts occupations in Kittitas County are Management (2,800 | 12.7%), Community & Social Service (2,596 | 11.7%), Education Instruction & Library (1,598 | 7.2%), Computers, Engineering & Science (1,115 | 5.1%), and Health Diagnosing & Treating (897 | 4.1%).
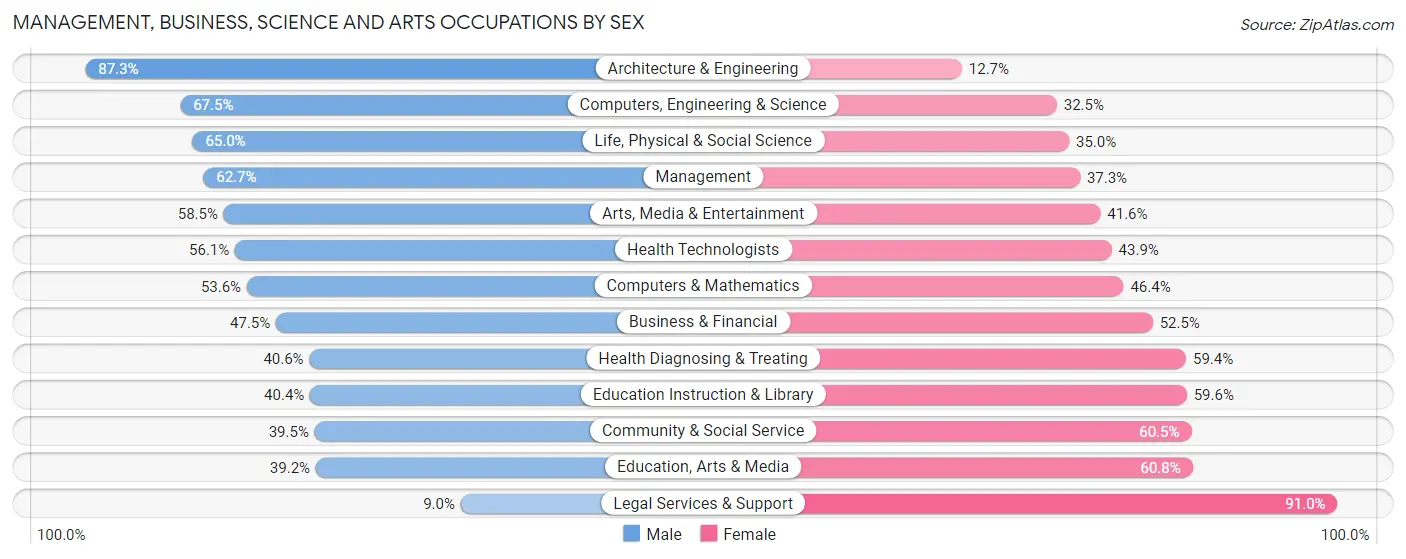
Management, Business, Science and Arts Occupations by Sex
Within the Management, Business, Science and Arts occupations in Kittitas County, the most male-oriented occupations are Architecture & Engineering (87.3%), Computers, Engineering & Science (67.5%), and Life, Physical & Social Science (65.0%), while the most female-oriented occupations are Legal Services & Support (91.0%), Education, Arts & Media (60.8%), and Community & Social Service (60.5%).
| Occupation | Male | Female |
| Management | 1,756 (62.7%) | 1,044 (37.3%) |
| Business & Financial | 424 (47.5%) | 468 (52.5%) |
| Computers, Engineering & Science | 753 (67.5%) | 362 (32.5%) |
| Computers & Mathematics | 274 (53.6%) | 237 (46.4%) |
| Architecture & Engineering | 338 (87.3%) | 49 (12.7%) |
| Life, Physical & Social Science | 141 (65.0%) | 76 (35.0%) |
| Community & Social Service | 1,025 (39.5%) | 1,571 (60.5%) |
| Education, Arts & Media | 193 (39.2%) | 299 (60.8%) |
| Legal Services & Support | 20 (9.0%) | 202 (91.0%) |
| Education Instruction & Library | 646 (40.4%) | 952 (59.6%) |
| Arts, Media & Entertainment | 166 (58.5%) | 118 (41.5%) |
| Health Diagnosing & Treating | 364 (40.6%) | 533 (59.4%) |
| Health Technologists | 336 (56.1%) | 263 (43.9%) |
| Total (Category) | 4,322 (52.1%) | 3,978 (47.9%) |
| Total (Overall) | 11,800 (53.4%) | 10,289 (46.6%) |
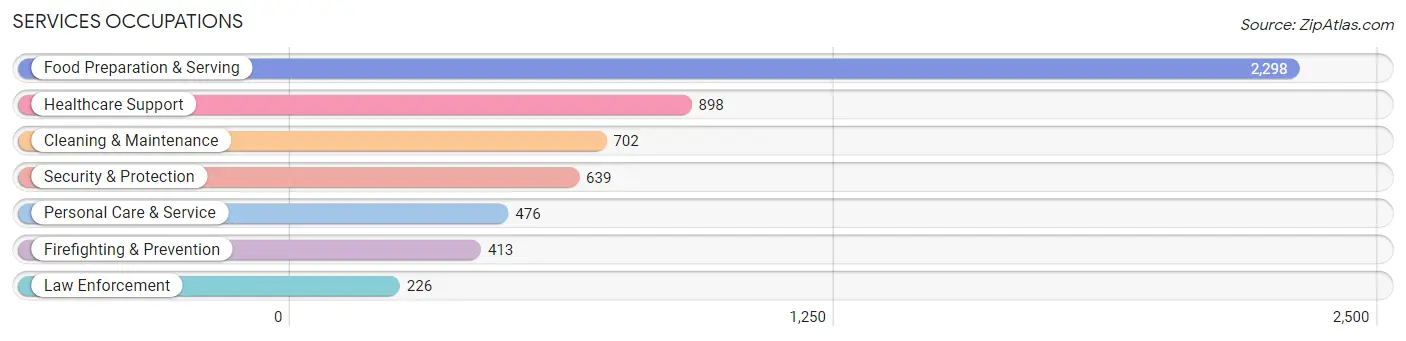
Services Occupations
The most common Services occupations in Kittitas County are Food Preparation & Serving (2,298 | 10.4%), Healthcare Support (898 | 4.1%), Cleaning & Maintenance (702 | 3.2%), Security & Protection (639 | 2.9%), and Personal Care & Service (476 | 2.1%).
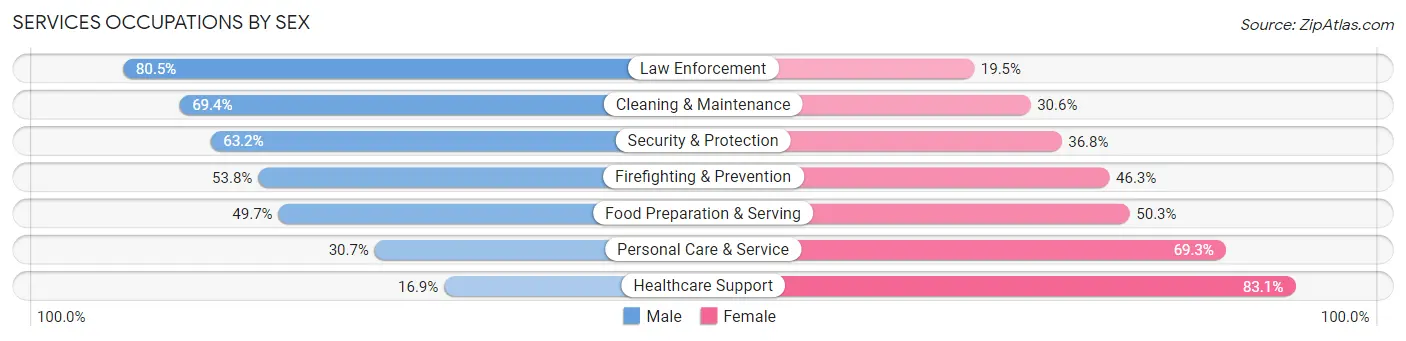
Services Occupations by Sex
Within the Services occupations in Kittitas County, the most male-oriented occupations are Law Enforcement (80.5%), Cleaning & Maintenance (69.4%), and Security & Protection (63.2%), while the most female-oriented occupations are Healthcare Support (83.1%), Personal Care & Service (69.3%), and Food Preparation & Serving (50.3%).
| Occupation | Male | Female |
| Healthcare Support | 152 (16.9%) | 746 (83.1%) |
| Security & Protection | 404 (63.2%) | 235 (36.8%) |
| Firefighting & Prevention | 222 (53.7%) | 191 (46.3%) |
| Law Enforcement | 182 (80.5%) | 44 (19.5%) |
| Food Preparation & Serving | 1,143 (49.7%) | 1,155 (50.3%) |
| Cleaning & Maintenance | 487 (69.4%) | 215 (30.6%) |
| Personal Care & Service | 146 (30.7%) | 330 (69.3%) |
| Total (Category) | 2,332 (46.5%) | 2,681 (53.5%) |
| Total (Overall) | 11,800 (53.4%) | 10,289 (46.6%) |
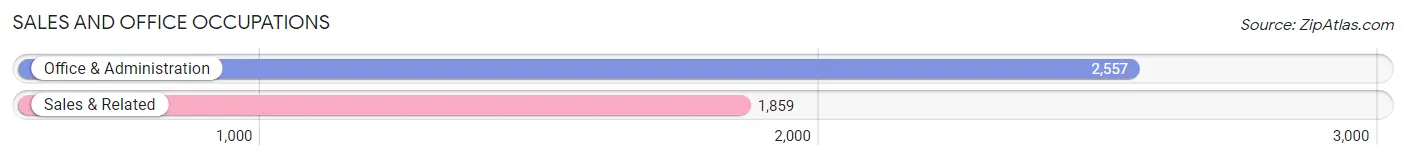
Sales and Office Occupations
The most common Sales and Office occupations in Kittitas County are Office & Administration (2,557 | 11.6%), and Sales & Related (1,859 | 8.4%).
Sales and Office Occupations by Sex
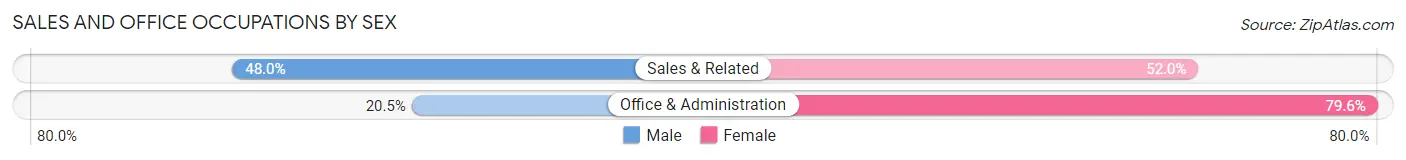
| Occupation | Male | Female |
| Sales & Related | 893 (48.0%) | 966 (52.0%) |
| Office & Administration | 523 (20.4%) | 2,034 (79.5%) |
| Total (Category) | 1,416 (32.1%) | 3,000 (67.9%) |
| Total (Overall) | 11,800 (53.4%) | 10,289 (46.6%) |
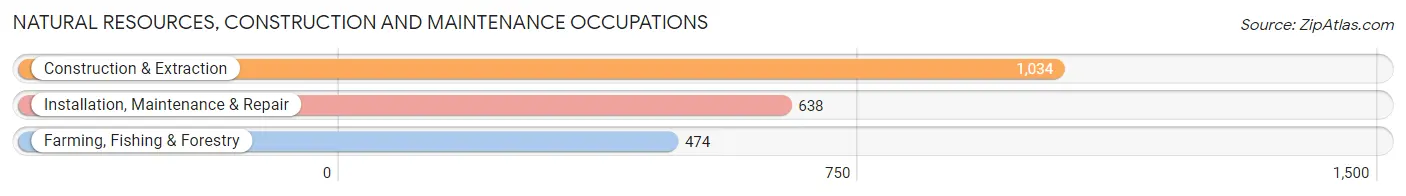
Natural Resources, Construction and Maintenance Occupations
The most common Natural Resources, Construction and Maintenance occupations in Kittitas County are Construction & Extraction (1,034 | 4.7%), Installation, Maintenance & Repair (638 | 2.9%), and Farming, Fishing & Forestry (474 | 2.1%).
Natural Resources, Construction and Maintenance Occupations by Sex
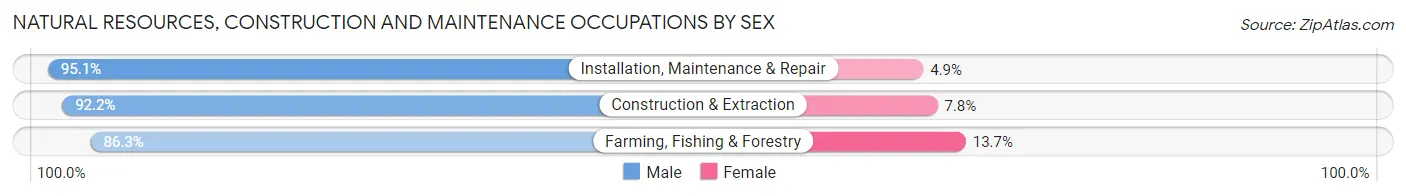
| Occupation | Male | Female |
| Farming, Fishing & Forestry | 409 (86.3%) | 65 (13.7%) |
| Construction & Extraction | 953 (92.2%) | 81 (7.8%) |
| Installation, Maintenance & Repair | 607 (95.1%) | 31 (4.9%) |
| Total (Category) | 1,969 (91.7%) | 177 (8.3%) |
| Total (Overall) | 11,800 (53.4%) | 10,289 (46.6%) |
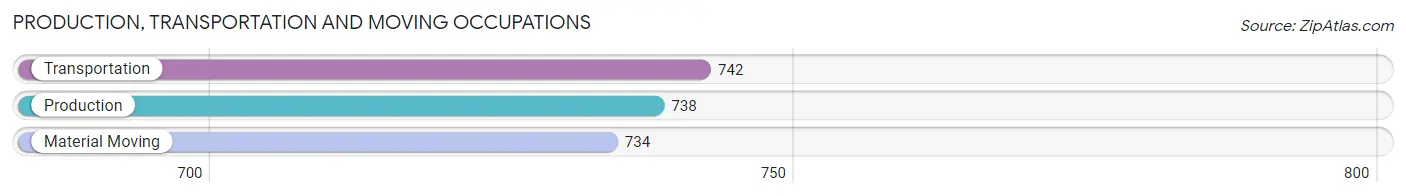
Production, Transportation and Moving Occupations
The most common Production, Transportation and Moving occupations in Kittitas County are Transportation (742 | 3.4%), Production (738 | 3.3%), and Material Moving (734 | 3.3%).
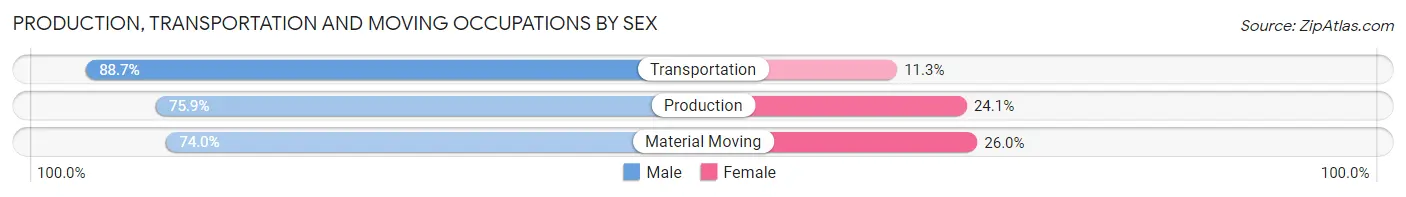
Production, Transportation and Moving Occupations by Sex
| Occupation | Male | Female |
| Production | 560 (75.9%) | 178 (24.1%) |
| Transportation | 658 (88.7%) | 84 (11.3%) |
| Material Moving | 543 (74.0%) | 191 (26.0%) |
| Total (Category) | 1,761 (79.5%) | 453 (20.5%) |
| Total (Overall) | 11,800 (53.4%) | 10,289 (46.6%) |
Employment Industries by Sex in Kittitas County
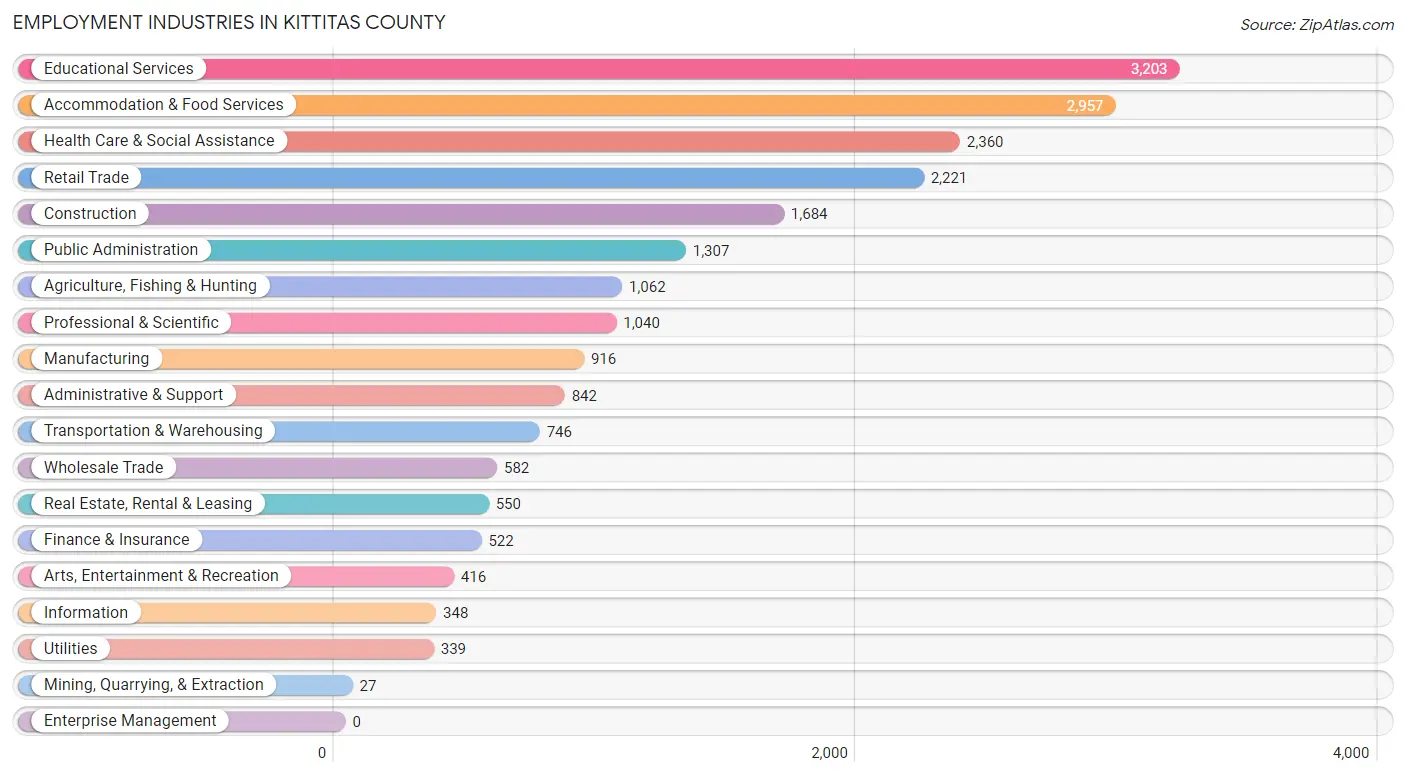
Employment Industries in Kittitas County
The major employment industries in Kittitas County include Educational Services (3,203 | 14.5%), Accommodation & Food Services (2,957 | 13.4%), Health Care & Social Assistance (2,360 | 10.7%), Retail Trade (2,221 | 10.1%), and Construction (1,684 | 7.6%).
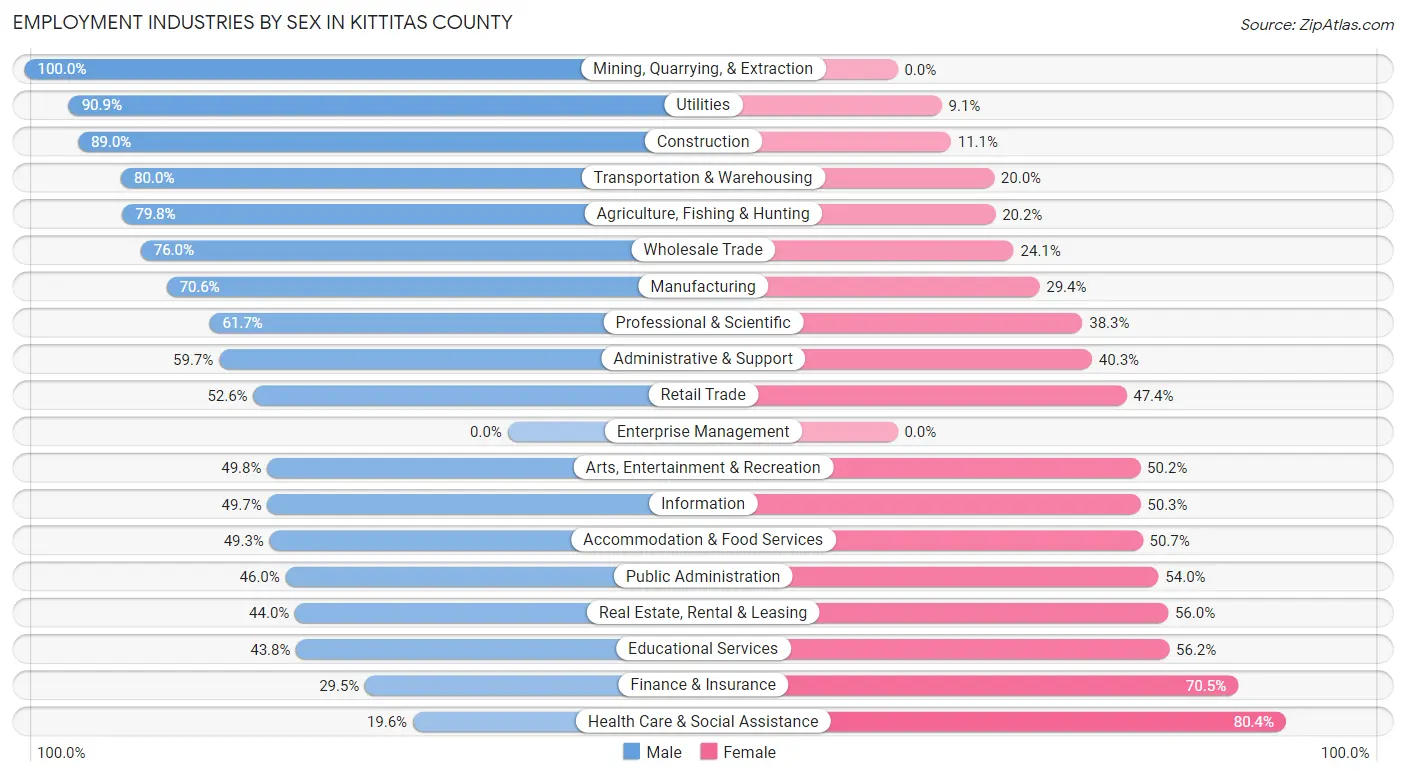
Employment Industries by Sex in Kittitas County
The Kittitas County industries that see more men than women are Mining, Quarrying, & Extraction (100.0%), Utilities (90.9%), and Construction (88.9%), whereas the industries that tend to have a higher number of women are Health Care & Social Assistance (80.4%), Finance & Insurance (70.5%), and Educational Services (56.2%).
| Industry | Male | Female |
| Agriculture, Fishing & Hunting | 847 (79.8%) | 215 (20.2%) |
| Mining, Quarrying, & Extraction | 27 (100.0%) | 0 (0.0%) |
| Construction | 1,498 (88.9%) | 186 (11.1%) |
| Manufacturing | 647 (70.6%) | 269 (29.4%) |
| Wholesale Trade | 442 (75.9%) | 140 (24.0%) |
| Retail Trade | 1,169 (52.6%) | 1,052 (47.4%) |
| Transportation & Warehousing | 597 (80.0%) | 149 (20.0%) |
| Utilities | 308 (90.9%) | 31 (9.1%) |
| Information | 173 (49.7%) | 175 (50.3%) |
| Finance & Insurance | 154 (29.5%) | 368 (70.5%) |
| Real Estate, Rental & Leasing | 242 (44.0%) | 308 (56.0%) |
| Professional & Scientific | 642 (61.7%) | 398 (38.3%) |
| Enterprise Management | 0 (0.0%) | 0 (0.0%) |
| Administrative & Support | 503 (59.7%) | 339 (40.3%) |
| Educational Services | 1,402 (43.8%) | 1,801 (56.2%) |
| Health Care & Social Assistance | 463 (19.6%) | 1,897 (80.4%) |
| Arts, Entertainment & Recreation | 207 (49.8%) | 209 (50.2%) |
| Accommodation & Food Services | 1,457 (49.3%) | 1,500 (50.7%) |
| Public Administration | 601 (46.0%) | 706 (54.0%) |
| Total | 11,800 (53.4%) | 10,289 (46.6%) |
Education in Kittitas County
School Enrollment in Kittitas County
The most common levels of schooling among the 13,375 students in Kittitas County are college / undergraduate (6,412 | 47.9%), elementary school (1,824 | 13.6%), and middle school (1,785 | 13.4%).
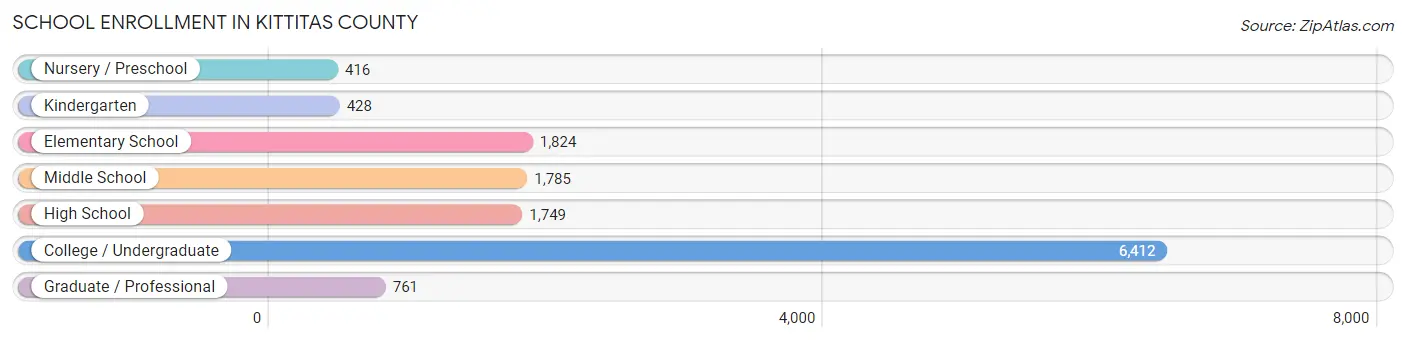
| School Level | # Students | % Students |
| Nursery / Preschool | 416 | 3.1% |
| Kindergarten | 428 | 3.2% |
| Elementary School | 1,824 | 13.6% |
| Middle School | 1,785 | 13.4% |
| High School | 1,749 | 13.1% |
| College / Undergraduate | 6,412 | 47.9% |
| Graduate / Professional | 761 | 5.7% |
| Total | 13,375 | 100.0% |
School Enrollment by Age by Funding Source in Kittitas County
Out of a total of 13,375 students who are enrolled in schools in Kittitas County, 1,016 (7.6%) attend a private institution, while the remaining 12,358 (92.4%) are enrolled in public schools. The age group of 3 to 4 year olds has the highest likelihood of being enrolled in private schools, with 173 (58.1% in the age bracket) enrolled. Conversely, the age group of 18 to 19 year olds has the lowest likelihood of being enrolled in a private school, with 2,597 (99.4% in the age bracket) attending a public institution.
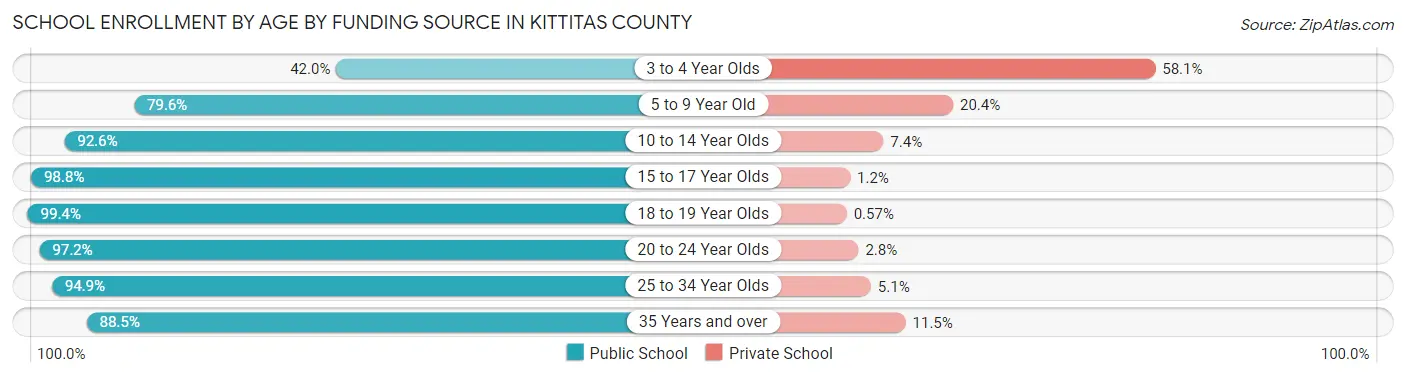
| Age Bracket | Public School | Private School |
| 3 to 4 Year Olds | 125 (41.9%) | 173 (58.1%) |
| 5 to 9 Year Old | 1,689 (79.6%) | 432 (20.4%) |
| 10 to 14 Year Olds | 2,015 (92.6%) | 161 (7.4%) |
| 15 to 17 Year Olds | 1,237 (98.8%) | 15 (1.2%) |
| 18 to 19 Year Olds | 2,597 (99.4%) | 15 (0.6%) |
| 20 to 24 Year Olds | 3,275 (97.2%) | 93 (2.8%) |
| 25 to 34 Year Olds | 787 (94.9%) | 42 (5.1%) |
| 35 Years and over | 636 (88.5%) | 83 (11.5%) |
| Total | 12,358 (92.4%) | 1,016 (7.6%) |
Educational Attainment by Field of Study in Kittitas County
Education (1,570 | 13.7%), business (1,405 | 12.2%), bio, nature & agricultural (1,358 | 11.8%), social sciences (1,092 | 9.5%), and science & technology (868 | 7.6%) are the most common fields of study among 11,480 individuals in Kittitas County who have obtained a bachelor's degree or higher.
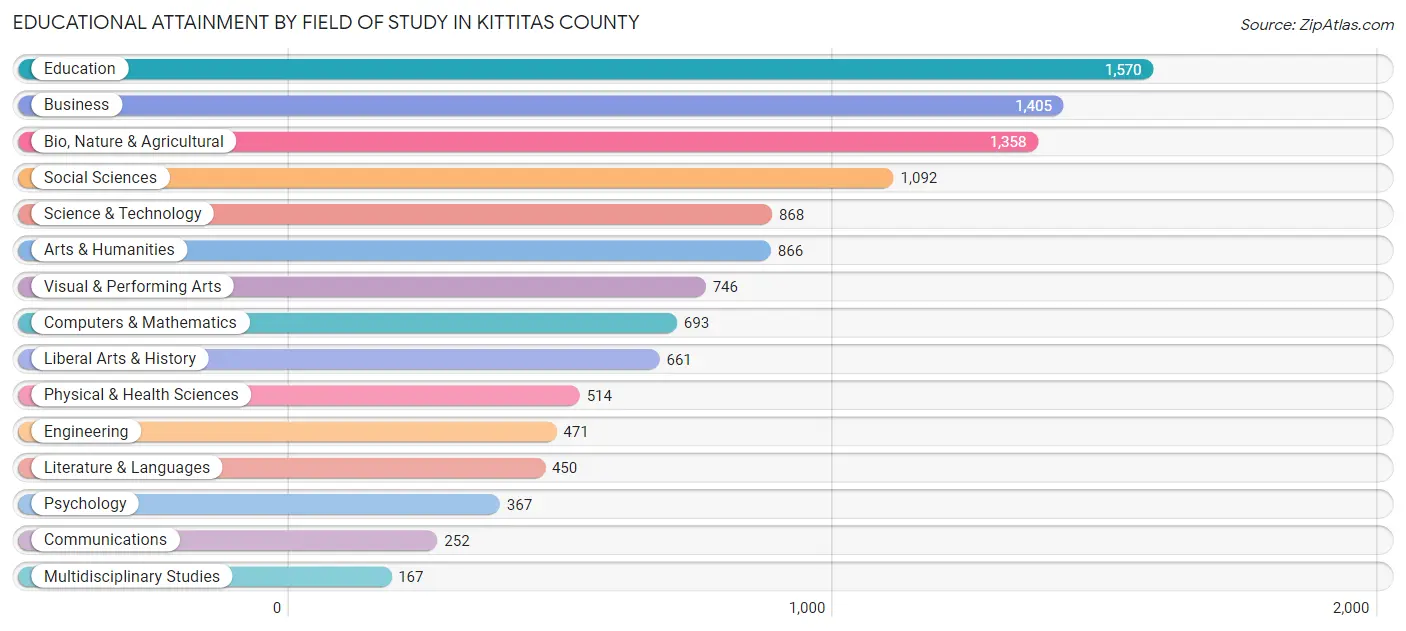
| Field of Study | # Graduates | % Graduates |
| Computers & Mathematics | 693 | 6.0% |
| Bio, Nature & Agricultural | 1,358 | 11.8% |
| Physical & Health Sciences | 514 | 4.5% |
| Psychology | 367 | 3.2% |
| Social Sciences | 1,092 | 9.5% |
| Engineering | 471 | 4.1% |
| Multidisciplinary Studies | 167 | 1.5% |
| Science & Technology | 868 | 7.6% |
| Business | 1,405 | 12.2% |
| Education | 1,570 | 13.7% |
| Literature & Languages | 450 | 3.9% |
| Liberal Arts & History | 661 | 5.8% |
| Visual & Performing Arts | 746 | 6.5% |
| Communications | 252 | 2.2% |
| Arts & Humanities | 866 | 7.5% |
| Total | 11,480 | 100.0% |
Transportation & Commute in Kittitas County
Vehicle Availability by Sex in Kittitas County
The most prevalent vehicle ownership categories in Kittitas County are males with 2 vehicles (4,115, accounting for 36.2%) and females with 2 vehicles (3,568, making up 42.7%).
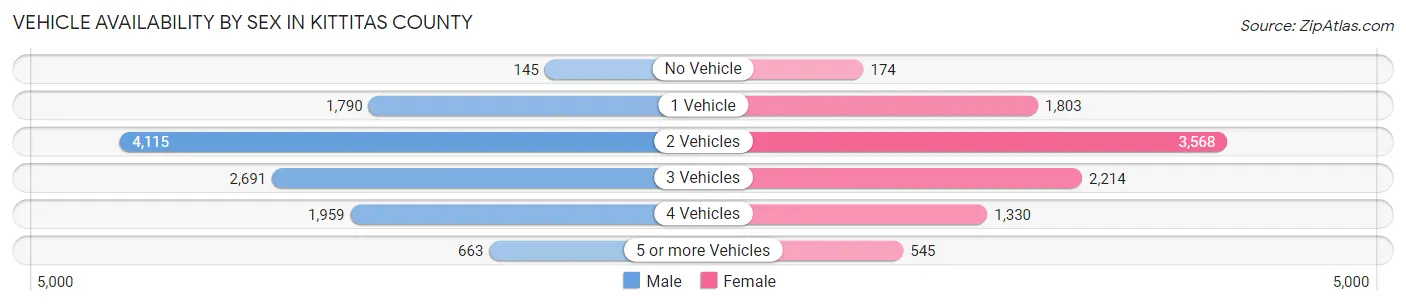
| Vehicles Available | Male | Female |
| No Vehicle | 145 (1.3%) | 174 (1.8%) |
| 1 Vehicle | 1,790 (15.8%) | 1,803 (18.7%) |
| 2 Vehicles | 4,115 (36.2%) | 3,568 (37.0%) |
| 3 Vehicles | 2,691 (23.7%) | 2,214 (23.0%) |
| 4 Vehicles | 1,959 (17.2%) | 1,330 (13.8%) |
| 5 or more Vehicles | 663 (5.8%) | 545 (5.7%) |
| Total | 11,363 (100.0%) | 9,634 (100.0%) |
Commute Time in Kittitas County
The most frequently occuring commute durations in Kittitas County are 5 to 9 minutes (4,906 commuters, 25.7%), 10 to 14 minutes (3,715 commuters, 19.5%), and 15 to 19 minutes (2,183 commuters, 11.4%).
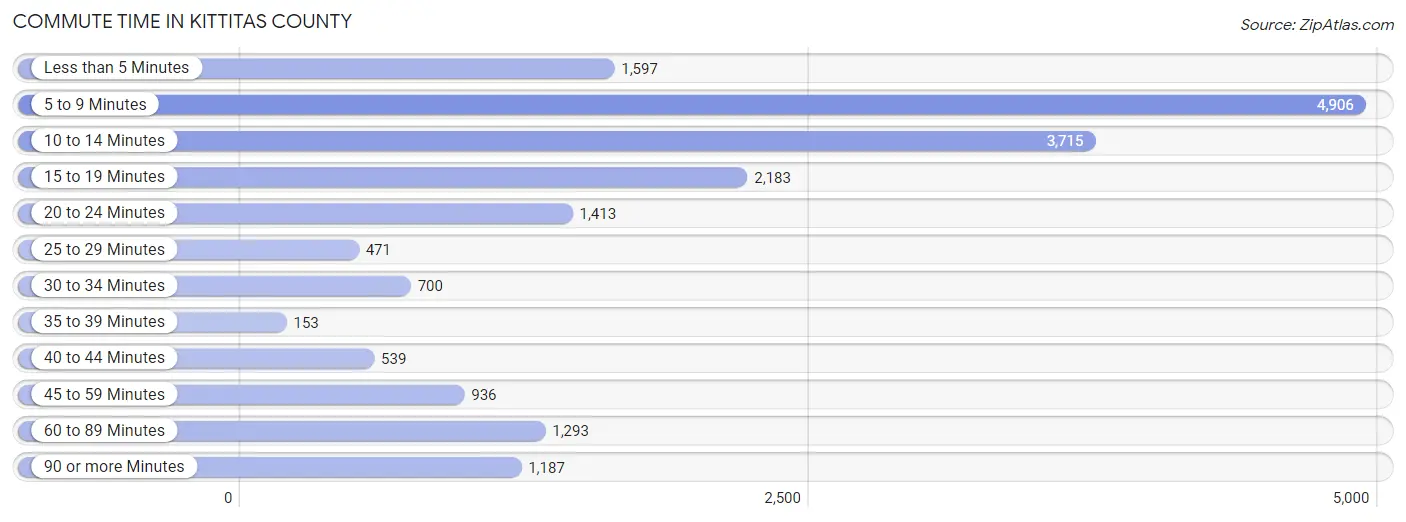
| Commute Time | # Commuters | % Commuters |
| Less than 5 Minutes | 1,597 | 8.4% |
| 5 to 9 Minutes | 4,906 | 25.7% |
| 10 to 14 Minutes | 3,715 | 19.5% |
| 15 to 19 Minutes | 2,183 | 11.4% |
| 20 to 24 Minutes | 1,413 | 7.4% |
| 25 to 29 Minutes | 471 | 2.5% |
| 30 to 34 Minutes | 700 | 3.7% |
| 35 to 39 Minutes | 153 | 0.8% |
| 40 to 44 Minutes | 539 | 2.8% |
| 45 to 59 Minutes | 936 | 4.9% |
| 60 to 89 Minutes | 1,293 | 6.8% |
| 90 or more Minutes | 1,187 | 6.2% |
Commute Time by Sex in Kittitas County
The most common commute times in Kittitas County are 5 to 9 minutes (2,447 commuters, 23.0%) for males and 5 to 9 minutes (2,459 commuters, 29.1%) for females.
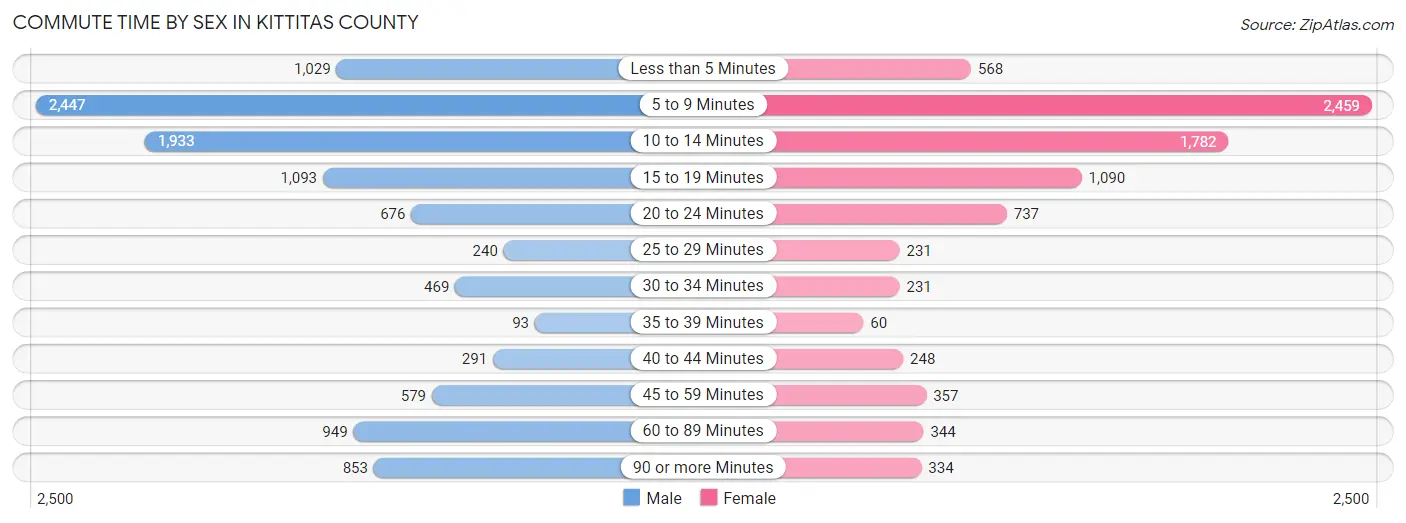
| Commute Time | Male | Female |
| Less than 5 Minutes | 1,029 (9.7%) | 568 (6.7%) |
| 5 to 9 Minutes | 2,447 (23.0%) | 2,459 (29.1%) |
| 10 to 14 Minutes | 1,933 (18.1%) | 1,782 (21.1%) |
| 15 to 19 Minutes | 1,093 (10.3%) | 1,090 (12.9%) |
| 20 to 24 Minutes | 676 (6.4%) | 737 (8.7%) |
| 25 to 29 Minutes | 240 (2.2%) | 231 (2.7%) |
| 30 to 34 Minutes | 469 (4.4%) | 231 (2.7%) |
| 35 to 39 Minutes | 93 (0.9%) | 60 (0.7%) |
| 40 to 44 Minutes | 291 (2.7%) | 248 (2.9%) |
| 45 to 59 Minutes | 579 (5.4%) | 357 (4.2%) |
| 60 to 89 Minutes | 949 (8.9%) | 344 (4.1%) |
| 90 or more Minutes | 853 (8.0%) | 334 (4.0%) |
Time of Departure to Work by Sex in Kittitas County
The most frequent times of departure to work in Kittitas County are 7:30 AM to 7:59 AM (1,784, 16.8%) for males and 7:30 AM to 7:59 AM (1,438, 17.0%) for females.
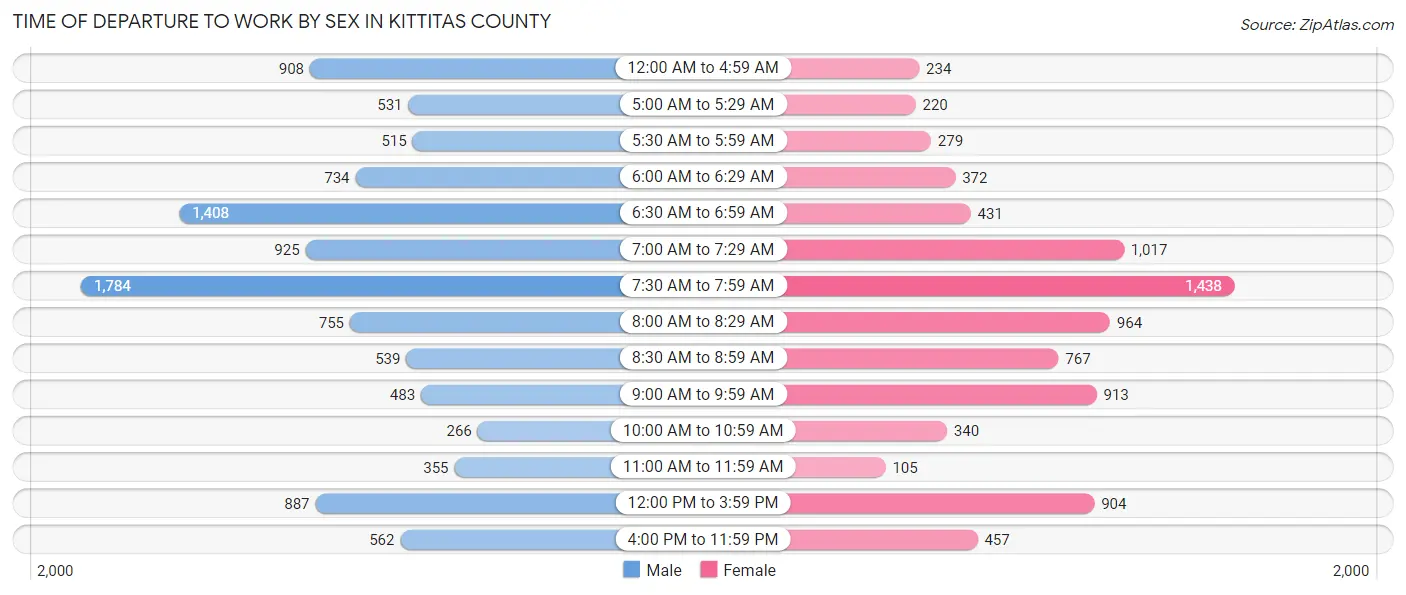
| Time of Departure | Male | Female |
| 12:00 AM to 4:59 AM | 908 (8.5%) | 234 (2.8%) |
| 5:00 AM to 5:29 AM | 531 (5.0%) | 220 (2.6%) |
| 5:30 AM to 5:59 AM | 515 (4.8%) | 279 (3.3%) |
| 6:00 AM to 6:29 AM | 734 (6.9%) | 372 (4.4%) |
| 6:30 AM to 6:59 AM | 1,408 (13.2%) | 431 (5.1%) |
| 7:00 AM to 7:29 AM | 925 (8.7%) | 1,017 (12.0%) |
| 7:30 AM to 7:59 AM | 1,784 (16.8%) | 1,438 (17.0%) |
| 8:00 AM to 8:29 AM | 755 (7.1%) | 964 (11.4%) |
| 8:30 AM to 8:59 AM | 539 (5.1%) | 767 (9.1%) |
| 9:00 AM to 9:59 AM | 483 (4.5%) | 913 (10.8%) |
| 10:00 AM to 10:59 AM | 266 (2.5%) | 340 (4.0%) |
| 11:00 AM to 11:59 AM | 355 (3.3%) | 105 (1.2%) |
| 12:00 PM to 3:59 PM | 887 (8.3%) | 904 (10.7%) |
| 4:00 PM to 11:59 PM | 562 (5.3%) | 457 (5.4%) |
| Total | 10,652 (100.0%) | 8,441 (100.0%) |
Housing Occupancy in Kittitas County
Occupancy by Ownership in Kittitas County
Of the total 19,250 dwellings in Kittitas County, owner-occupied units account for 11,848 (61.6%), while renter-occupied units make up 7,402 (38.5%).
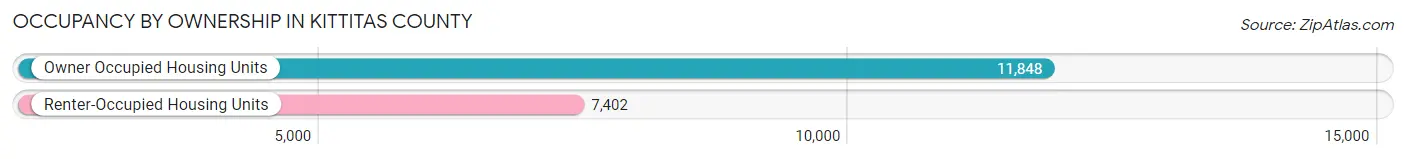
| Occupancy | # Housing Units | % Housing Units |
| Owner Occupied Housing Units | 11,848 | 61.6% |
| Renter-Occupied Housing Units | 7,402 | 38.5% |
| Total Occupied Housing Units | 19,250 | 100.0% |
Occupancy by Household Size in Kittitas County
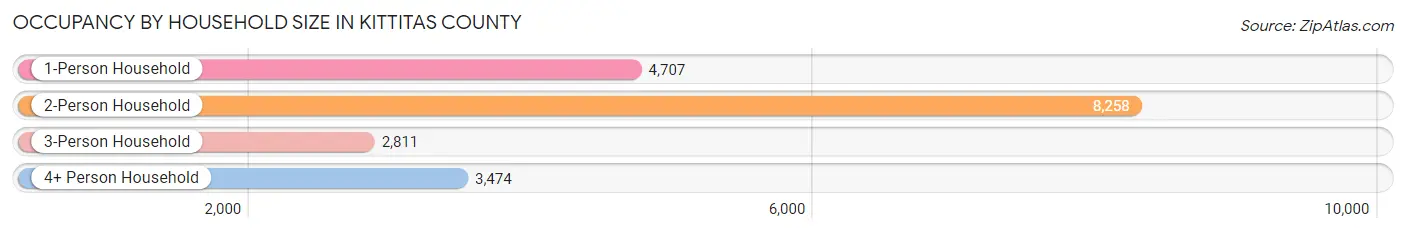
| Household Size | # Housing Units | % Housing Units |
| 1-Person Household | 4,707 | 24.4% |
| 2-Person Household | 8,258 | 42.9% |
| 3-Person Household | 2,811 | 14.6% |
| 4+ Person Household | 3,474 | 18.0% |
| Total Housing Units | 19,250 | 100.0% |
Occupancy by Ownership by Household Size in Kittitas County
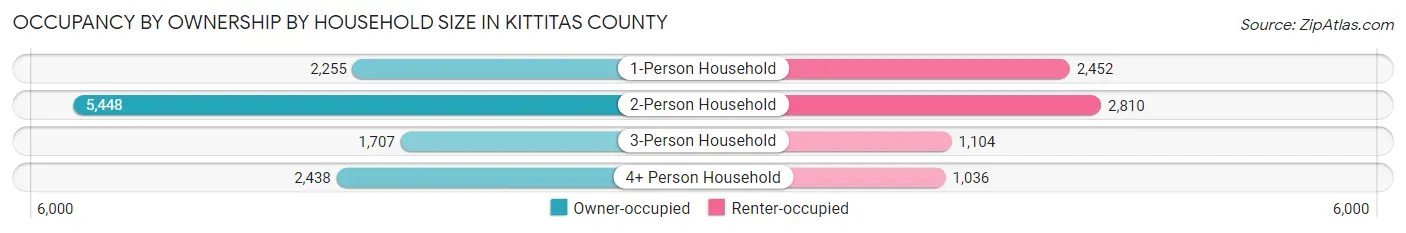
| Household Size | Owner-occupied | Renter-occupied |
| 1-Person Household | 2,255 (47.9%) | 2,452 (52.1%) |
| 2-Person Household | 5,448 (66.0%) | 2,810 (34.0%) |
| 3-Person Household | 1,707 (60.7%) | 1,104 (39.3%) |
| 4+ Person Household | 2,438 (70.2%) | 1,036 (29.8%) |
| Total Housing Units | 11,848 (61.6%) | 7,402 (38.5%) |
Occupancy by Educational Attainment in Kittitas County
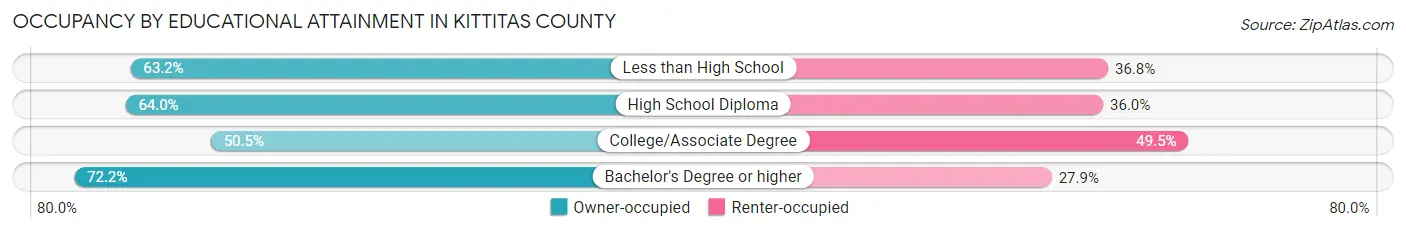
| Household Size | Owner-occupied | Renter-occupied |
| Less than High School | 612 (63.2%) | 356 (36.8%) |
| High School Diploma | 2,836 (64.0%) | 1,595 (36.0%) |
| College/Associate Degree | 3,713 (50.5%) | 3,642 (49.5%) |
| Bachelor's Degree or higher | 4,687 (72.2%) | 1,809 (27.9%) |
Occupancy by Age of Householder in Kittitas County
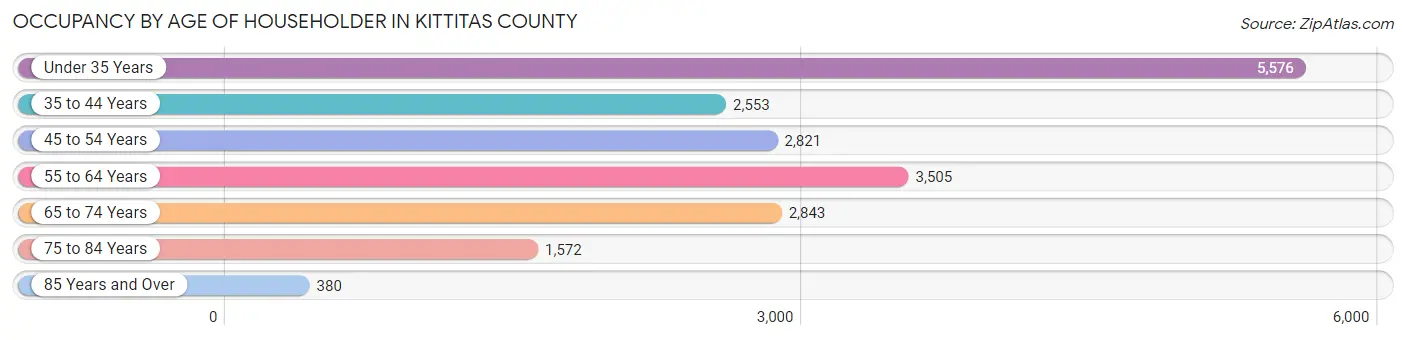
| Age Bracket | # Households | % Households |
| Under 35 Years | 5,576 | 29.0% |
| 35 to 44 Years | 2,553 | 13.3% |
| 45 to 54 Years | 2,821 | 14.6% |
| 55 to 64 Years | 3,505 | 18.2% |
| 65 to 74 Years | 2,843 | 14.8% |
| 75 to 84 Years | 1,572 | 8.2% |
| 85 Years and Over | 380 | 2.0% |
| Total | 19,250 | 100.0% |
Housing Finances in Kittitas County
Median Income by Occupancy in Kittitas County
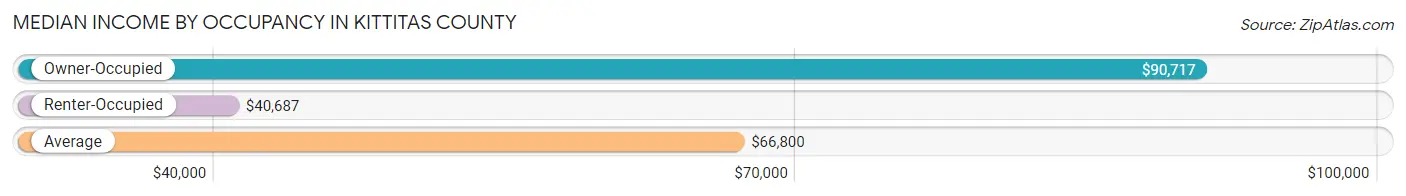
| Occupancy Type | # Households | Median Income |
| Owner-Occupied | 11,848 (61.6%) | $90,717 |
| Renter-Occupied | 7,402 (38.5%) | $40,687 |
| Average | 19,250 (100.0%) | $66,800 |
Occupancy by Householder Income Bracket in Kittitas County
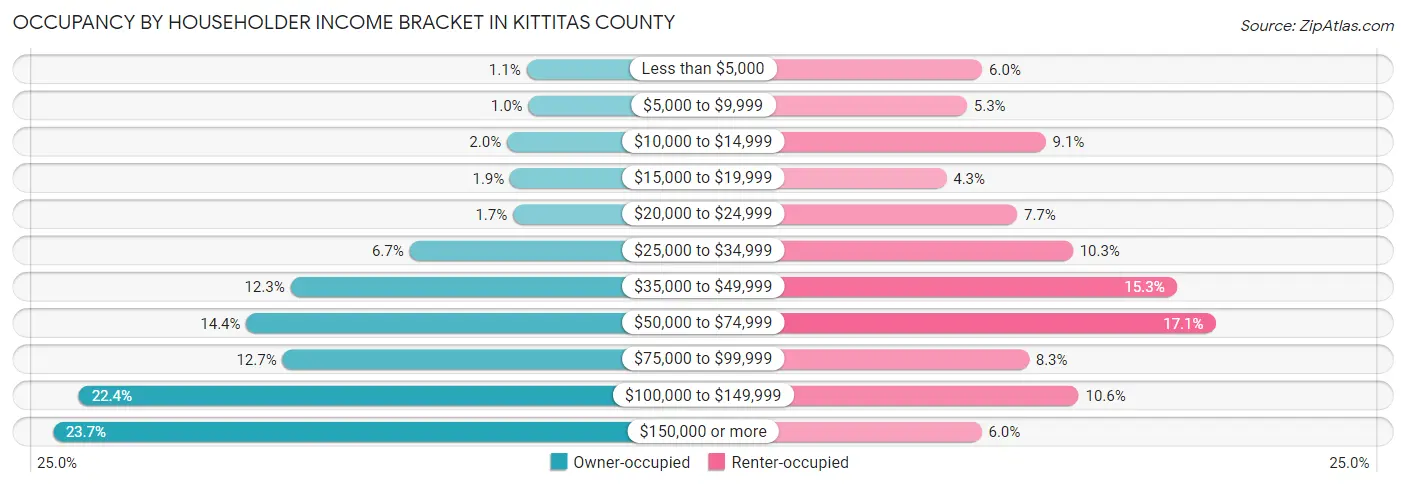
| Income Bracket | Owner-occupied | Renter-occupied |
| Less than $5,000 | 130 (1.1%) | 446 (6.0%) |
| $5,000 to $9,999 | 120 (1.0%) | 392 (5.3%) |
| $10,000 to $14,999 | 240 (2.0%) | 670 (9.0%) |
| $15,000 to $19,999 | 223 (1.9%) | 320 (4.3%) |
| $20,000 to $24,999 | 206 (1.7%) | 569 (7.7%) |
| $25,000 to $34,999 | 790 (6.7%) | 765 (10.3%) |
| $35,000 to $49,999 | 1,462 (12.3%) | 1,131 (15.3%) |
| $50,000 to $74,999 | 1,711 (14.4%) | 1,268 (17.1%) |
| $75,000 to $99,999 | 1,507 (12.7%) | 611 (8.3%) |
| $100,000 to $149,999 | 2,656 (22.4%) | 786 (10.6%) |
| $150,000 or more | 2,803 (23.7%) | 444 (6.0%) |
| Total | 11,848 (100.0%) | 7,402 (100.0%) |
Monthly Housing Cost Tiers in Kittitas County
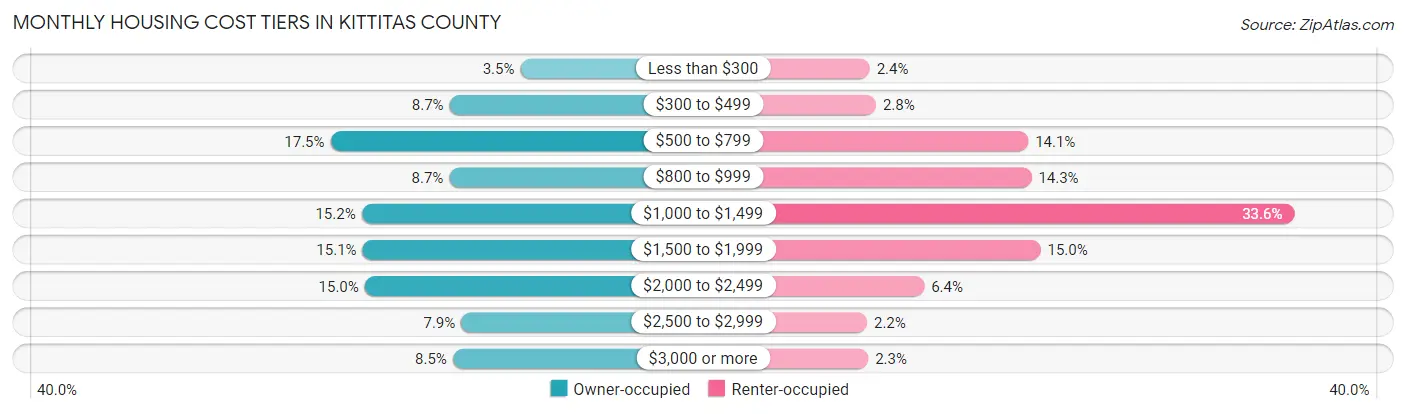
| Monthly Cost | Owner-occupied | Renter-occupied |
| Less than $300 | 414 (3.5%) | 176 (2.4%) |
| $300 to $499 | 1,032 (8.7%) | 210 (2.8%) |
| $500 to $799 | 2,071 (17.5%) | 1,040 (14.1%) |
| $800 to $999 | 1,034 (8.7%) | 1,058 (14.3%) |
| $1,000 to $1,499 | 1,800 (15.2%) | 2,490 (33.6%) |
| $1,500 to $1,999 | 1,792 (15.1%) | 1,107 (15.0%) |
| $2,000 to $2,499 | 1,772 (15.0%) | 473 (6.4%) |
| $2,500 to $2,999 | 930 (7.9%) | 161 (2.2%) |
| $3,000 or more | 1,003 (8.5%) | 168 (2.3%) |
| Total | 11,848 (100.0%) | 7,402 (100.0%) |
Physical Housing Characteristics in Kittitas County
Housing Structures in Kittitas County
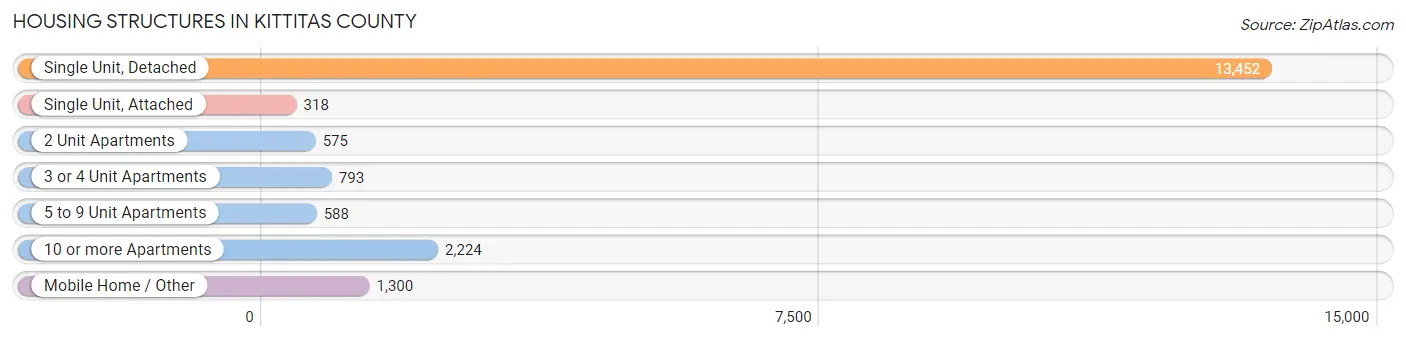
| Structure Type | # Housing Units | % Housing Units |
| Single Unit, Detached | 13,452 | 69.9% |
| Single Unit, Attached | 318 | 1.7% |
| 2 Unit Apartments | 575 | 3.0% |
| 3 or 4 Unit Apartments | 793 | 4.1% |
| 5 to 9 Unit Apartments | 588 | 3.0% |
| 10 or more Apartments | 2,224 | 11.6% |
| Mobile Home / Other | 1,300 | 6.8% |
| Total | 19,250 | 100.0% |
Housing Structures by Occupancy in Kittitas County
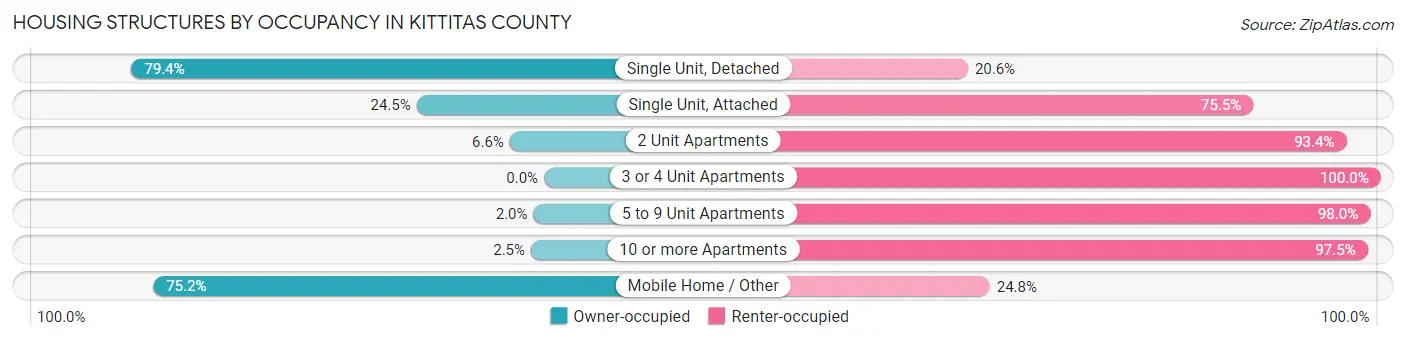
| Structure Type | Owner-occupied | Renter-occupied |
| Single Unit, Detached | 10,686 (79.4%) | 2,766 (20.6%) |
| Single Unit, Attached | 78 (24.5%) | 240 (75.5%) |
| 2 Unit Apartments | 38 (6.6%) | 537 (93.4%) |
| 3 or 4 Unit Apartments | 0 (0.0%) | 793 (100.0%) |
| 5 to 9 Unit Apartments | 12 (2.0%) | 576 (98.0%) |
| 10 or more Apartments | 56 (2.5%) | 2,168 (97.5%) |
| Mobile Home / Other | 978 (75.2%) | 322 (24.8%) |
| Total | 11,848 (61.6%) | 7,402 (38.5%) |
Housing Structures by Number of Rooms in Kittitas County
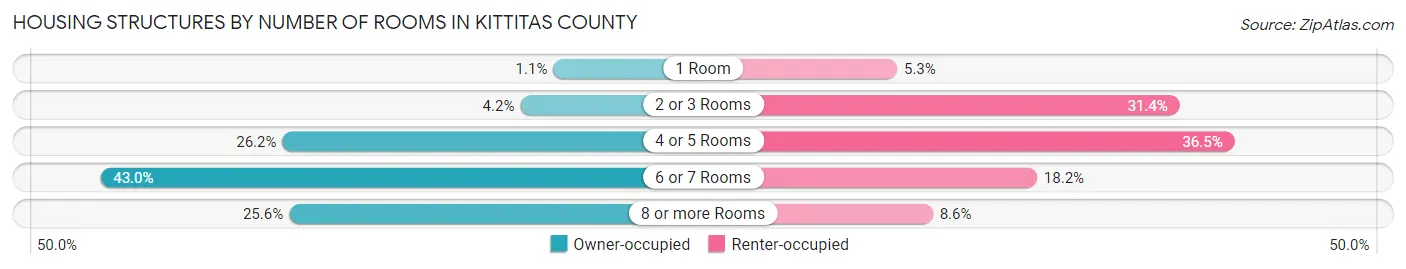
| Number of Rooms | Owner-occupied | Renter-occupied |
| 1 Room | 132 (1.1%) | 391 (5.3%) |
| 2 or 3 Rooms | 493 (4.2%) | 2,326 (31.4%) |
| 4 or 5 Rooms | 3,101 (26.2%) | 2,701 (36.5%) |
| 6 or 7 Rooms | 5,095 (43.0%) | 1,349 (18.2%) |
| 8 or more Rooms | 3,027 (25.6%) | 635 (8.6%) |
| Total | 11,848 (100.0%) | 7,402 (100.0%) |
Housing Structure by Heating Type in Kittitas County
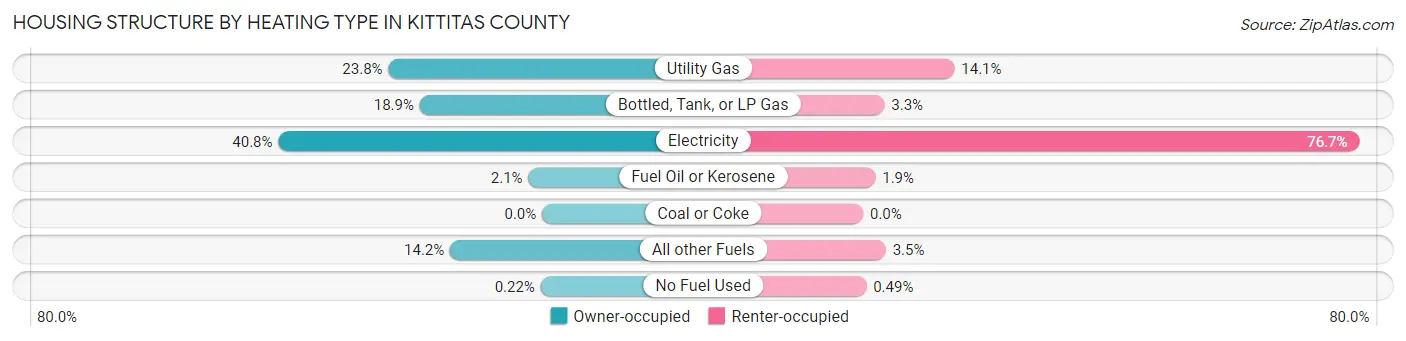
| Heating Type | Owner-occupied | Renter-occupied |
| Utility Gas | 2,815 (23.8%) | 1,045 (14.1%) |
| Bottled, Tank, or LP Gas | 2,241 (18.9%) | 244 (3.3%) |
| Electricity | 4,831 (40.8%) | 5,678 (76.7%) |
| Fuel Oil or Kerosene | 250 (2.1%) | 140 (1.9%) |
| Coal or Coke | 0 (0.0%) | 0 (0.0%) |
| All other Fuels | 1,685 (14.2%) | 259 (3.5%) |
| No Fuel Used | 26 (0.2%) | 36 (0.5%) |
| Total | 11,848 (100.0%) | 7,402 (100.0%) |
Household Vehicle Usage in Kittitas County
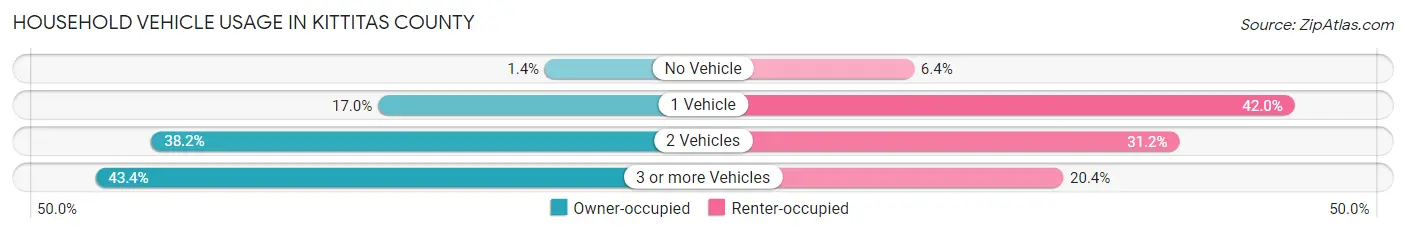
| Vehicles per Household | Owner-occupied | Renter-occupied |
| No Vehicle | 170 (1.4%) | 477 (6.4%) |
| 1 Vehicle | 2,015 (17.0%) | 3,107 (42.0%) |
| 2 Vehicles | 4,522 (38.2%) | 2,310 (31.2%) |
| 3 or more Vehicles | 5,141 (43.4%) | 1,508 (20.4%) |
| Total | 11,848 (100.0%) | 7,402 (100.0%) |
Real Estate & Mortgages in Kittitas County
Real Estate and Mortgage Overview in Kittitas County
| Characteristic | Without Mortgage | With Mortgage |
| Housing Units | 4,803 | 7,045 |
| Median Property Value | $407,700 | $422,400 |
| Median Household Income | $63,733 | $2,016 |
| Monthly Housing Costs | $609 | $972 |
| Real Estate Taxes | $2,889 | $121 |
Property Value by Mortgage Status in Kittitas County
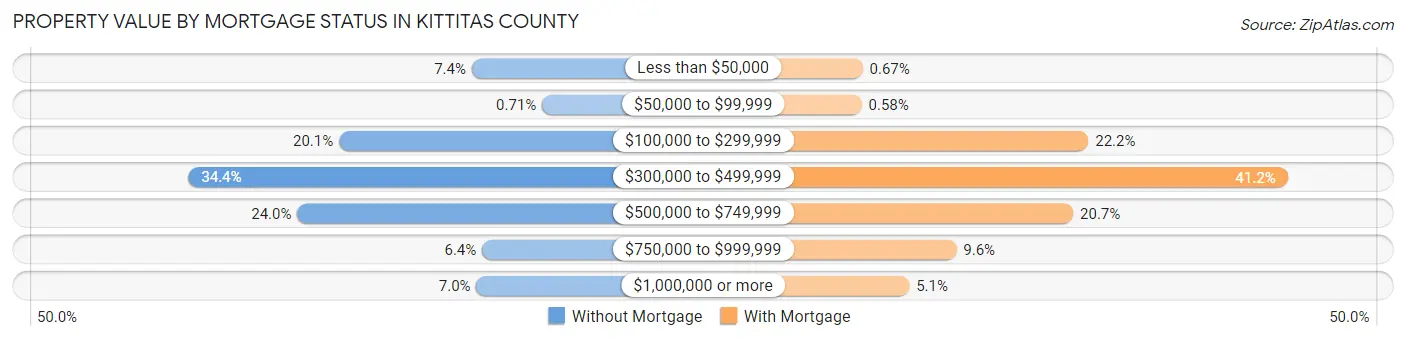
| Property Value | Without Mortgage | With Mortgage |
| Less than $50,000 | 356 (7.4%) | 47 (0.7%) |
| $50,000 to $99,999 | 34 (0.7%) | 41 (0.6%) |
| $100,000 to $299,999 | 963 (20.1%) | 1,562 (22.2%) |
| $300,000 to $499,999 | 1,652 (34.4%) | 2,899 (41.1%) |
| $500,000 to $749,999 | 1,154 (24.0%) | 1,460 (20.7%) |
| $750,000 to $999,999 | 309 (6.4%) | 676 (9.6%) |
| $1,000,000 or more | 335 (7.0%) | 360 (5.1%) |
| Total | 4,803 (100.0%) | 7,045 (100.0%) |
Household Income by Mortgage Status in Kittitas County
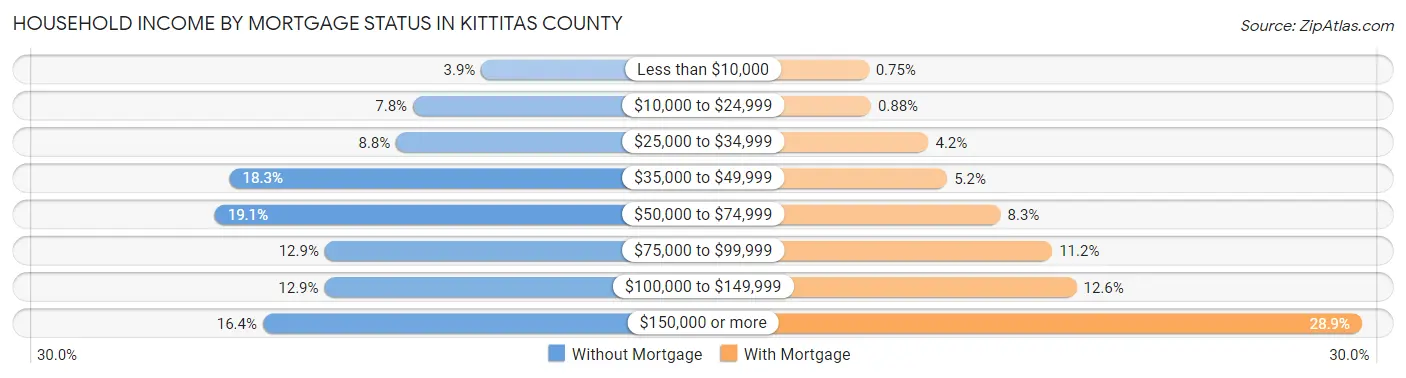
| Household Income | Without Mortgage | With Mortgage |
| Less than $10,000 | 188 (3.9%) | 53 (0.7%) |
| $10,000 to $24,999 | 375 (7.8%) | 62 (0.9%) |
| $25,000 to $34,999 | 421 (8.8%) | 294 (4.2%) |
| $35,000 to $49,999 | 878 (18.3%) | 369 (5.2%) |
| $50,000 to $74,999 | 919 (19.1%) | 584 (8.3%) |
| $75,000 to $99,999 | 617 (12.9%) | 792 (11.2%) |
| $100,000 to $149,999 | 618 (12.9%) | 890 (12.6%) |
| $150,000 or more | 787 (16.4%) | 2,038 (28.9%) |
| Total | 4,803 (100.0%) | 7,045 (100.0%) |
Property Value to Household Income Ratio in Kittitas County
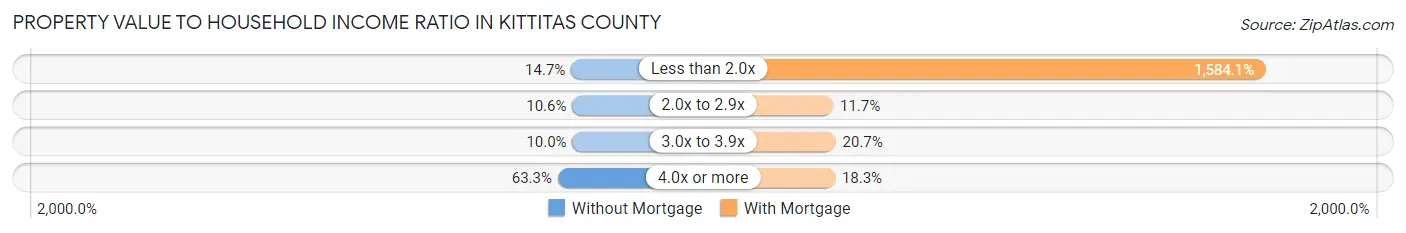
| Value-to-Income Ratio | Without Mortgage | With Mortgage |
| Less than 2.0x | 708 (14.7%) | 111,596 (1,584.1%) |
| 2.0x to 2.9x | 507 (10.6%) | 821 (11.7%) |
| 3.0x to 3.9x | 481 (10.0%) | 1,461 (20.7%) |
| 4.0x or more | 3,039 (63.3%) | 1,286 (18.2%) |
| Total | 4,803 (100.0%) | 7,045 (100.0%) |
Real Estate Taxes by Mortgage Status in Kittitas County
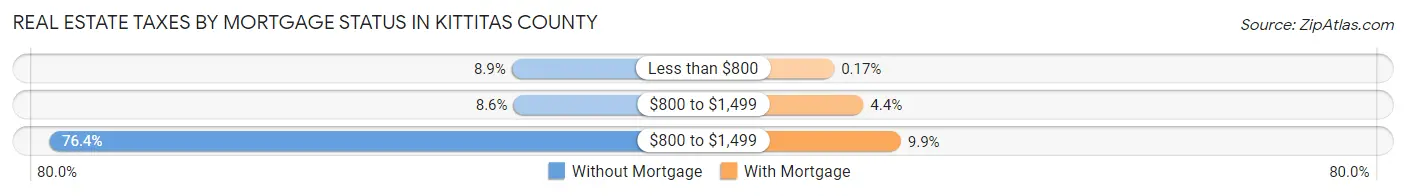
| Property Taxes | Without Mortgage | With Mortgage |
| Less than $800 | 425 (8.8%) | 12 (0.2%) |
| $800 to $1,499 | 412 (8.6%) | 313 (4.4%) |
| $800 to $1,499 | 3,670 (76.4%) | 698 (9.9%) |
| Total | 4,803 (100.0%) | 7,045 (100.0%) |
Health & Disability in Kittitas County
Health Insurance Coverage by Age in Kittitas County
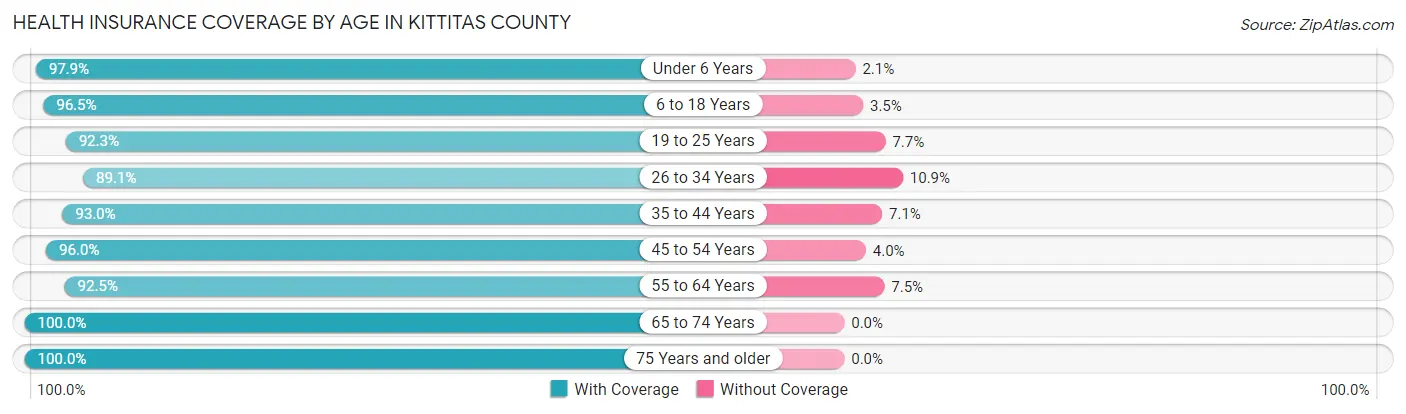
| Age Bracket | With Coverage | Without Coverage |
| Under 6 Years | 2,109 (97.9%) | 45 (2.1%) |
| 6 to 18 Years | 6,472 (96.5%) | 234 (3.5%) |
| 19 to 25 Years | 7,370 (92.3%) | 613 (7.7%) |
| 26 to 34 Years | 4,136 (89.1%) | 507 (10.9%) |
| 35 to 44 Years | 4,443 (92.9%) | 337 (7.0%) |
| 45 to 54 Years | 4,421 (96.0%) | 185 (4.0%) |
| 55 to 64 Years | 5,462 (92.5%) | 441 (7.5%) |
| 65 to 74 Years | 4,619 (100.0%) | 0 (0.0%) |
| 75 Years and older | 2,802 (100.0%) | 0 (0.0%) |
| Total | 41,834 (94.7%) | 2,362 (5.3%) |
Health Insurance Coverage by Citizenship Status in Kittitas County
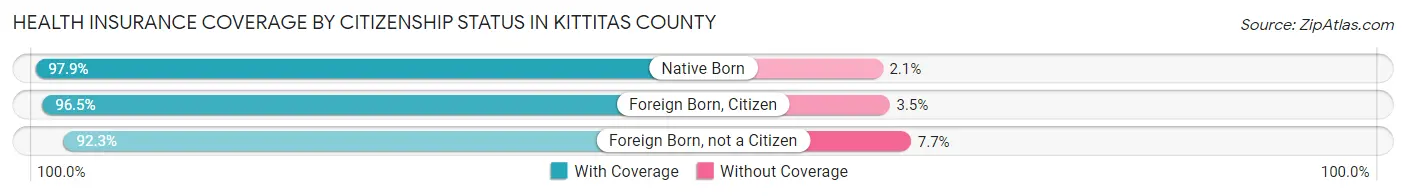
| Citizenship Status | With Coverage | Without Coverage |
| Native Born | 2,109 (97.9%) | 45 (2.1%) |
| Foreign Born, Citizen | 6,472 (96.5%) | 234 (3.5%) |
| Foreign Born, not a Citizen | 7,370 (92.3%) | 613 (7.7%) |
Health Insurance Coverage by Household Income in Kittitas County
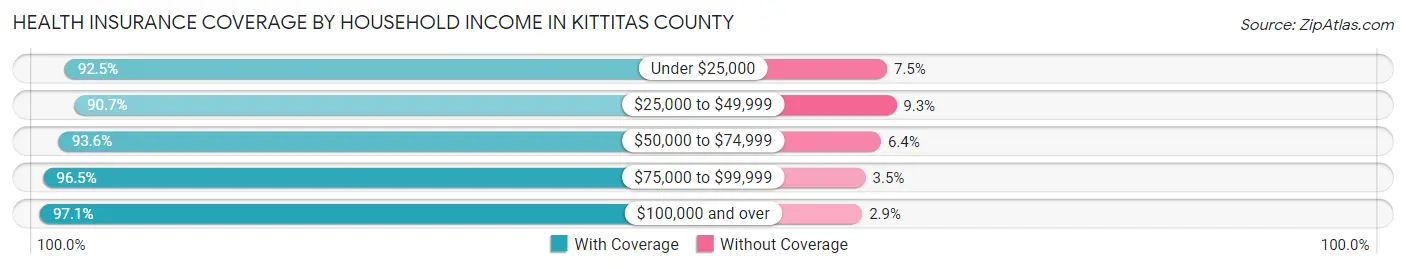
| Household Income | With Coverage | Without Coverage |
| Under $25,000 | 4,920 (92.5%) | 401 (7.5%) |
| $25,000 to $49,999 | 6,581 (90.7%) | 674 (9.3%) |
| $50,000 to $74,999 | 6,398 (93.6%) | 438 (6.4%) |
| $75,000 to $99,999 | 4,963 (96.5%) | 181 (3.5%) |
| $100,000 and over | 17,205 (97.1%) | 512 (2.9%) |
Public vs Private Health Insurance Coverage by Age in Kittitas County
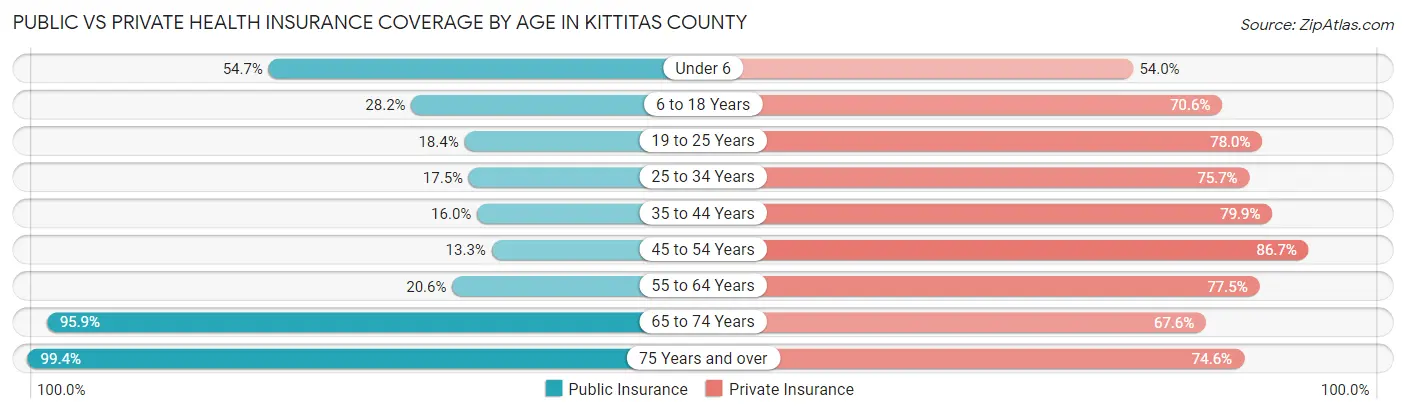
| Age Bracket | Public Insurance | Private Insurance |
| Under 6 | 1,178 (54.7%) | 1,162 (53.9%) |
| 6 to 18 Years | 1,891 (28.2%) | 4,735 (70.6%) |
| 19 to 25 Years | 1,465 (18.3%) | 6,230 (78.0%) |
| 25 to 34 Years | 814 (17.5%) | 3,513 (75.7%) |
| 35 to 44 Years | 765 (16.0%) | 3,819 (79.9%) |
| 45 to 54 Years | 613 (13.3%) | 3,991 (86.7%) |
| 55 to 64 Years | 1,217 (20.6%) | 4,576 (77.5%) |
| 65 to 74 Years | 4,429 (95.9%) | 3,123 (67.6%) |
| 75 Years and over | 2,786 (99.4%) | 2,091 (74.6%) |
| Total | 15,158 (34.3%) | 33,240 (75.2%) |
Disability Status by Sex by Age in Kittitas County
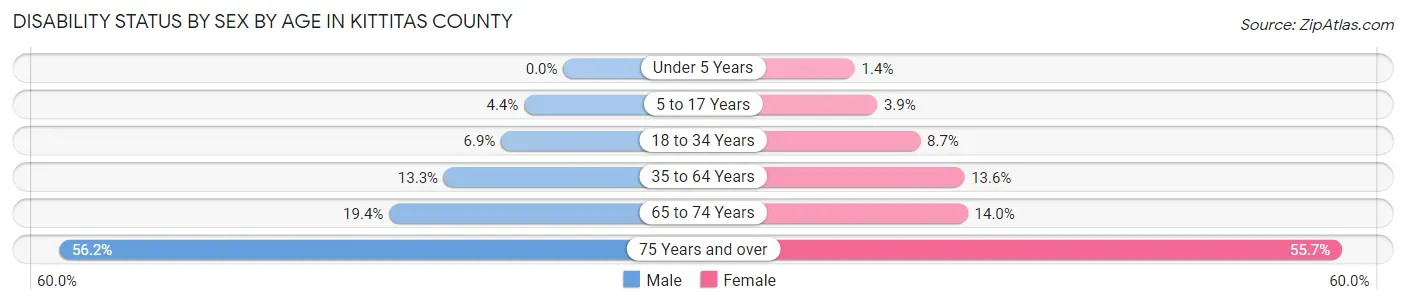
| Age Bracket | Male | Female |
| Under 5 Years | 0 (0.0%) | 14 (1.4%) |
| 5 to 17 Years | 130 (4.4%) | 111 (3.9%) |
| 18 to 34 Years | 490 (6.9%) | 584 (8.7%) |
| 35 to 64 Years | 1,017 (13.3%) | 1,041 (13.6%) |
| 65 to 74 Years | 446 (19.4%) | 325 (14.0%) |
| 75 Years and over | 747 (56.2%) | 820 (55.7%) |
Disability Class by Sex by Age in Kittitas County
Disability Class: Hearing Difficulty
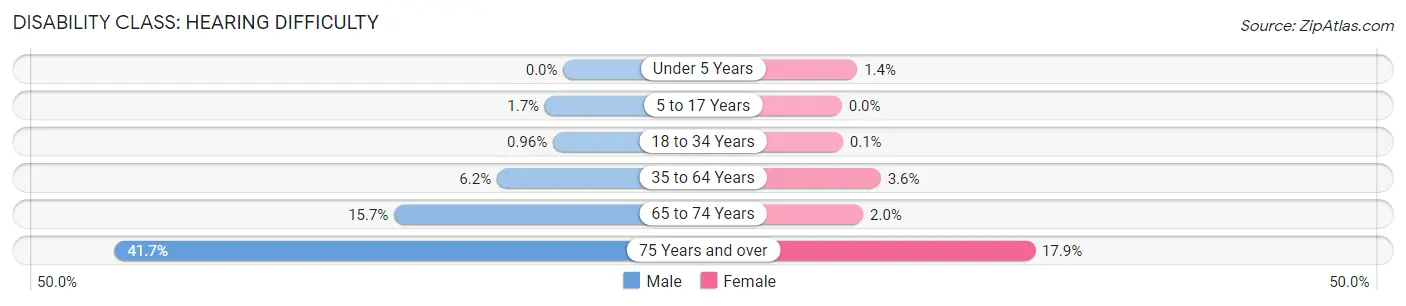
| Age Bracket | Male | Female |
| Under 5 Years | 0 (0.0%) | 14 (1.4%) |
| 5 to 17 Years | 51 (1.7%) | 0 (0.0%) |
| 18 to 34 Years | 68 (1.0%) | 7 (0.1%) |
| 35 to 64 Years | 471 (6.2%) | 276 (3.6%) |
| 65 to 74 Years | 361 (15.7%) | 46 (2.0%) |
| 75 Years and over | 554 (41.6%) | 264 (17.9%) |
Disability Class: Vision Difficulty
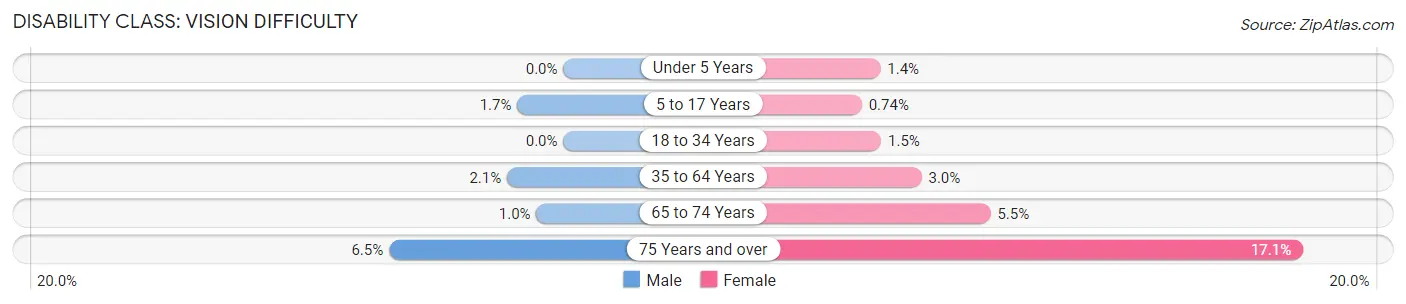
| Age Bracket | Male | Female |
| Under 5 Years | 0 (0.0%) | 14 (1.4%) |
| 5 to 17 Years | 51 (1.7%) | 21 (0.7%) |
| 18 to 34 Years | 0 (0.0%) | 98 (1.5%) |
| 35 to 64 Years | 160 (2.1%) | 226 (3.0%) |
| 65 to 74 Years | 23 (1.0%) | 128 (5.5%) |
| 75 Years and over | 86 (6.5%) | 252 (17.1%) |
Disability Class: Cognitive Difficulty
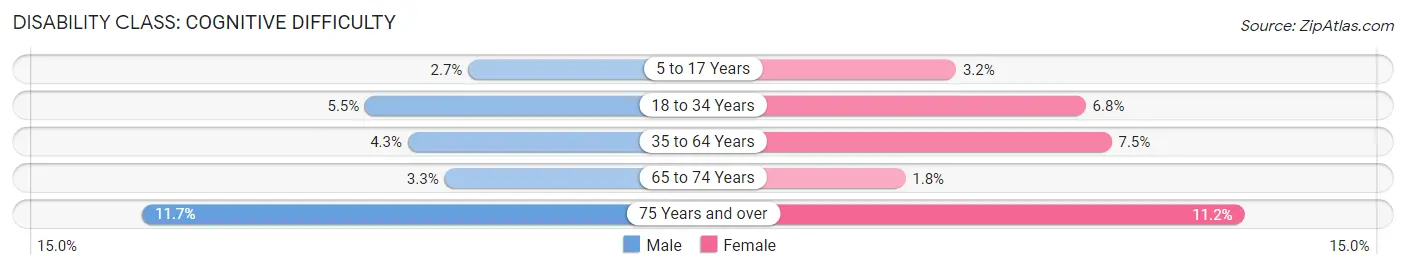
| Age Bracket | Male | Female |
| 5 to 17 Years | 79 (2.6%) | 90 (3.2%) |
| 18 to 34 Years | 391 (5.5%) | 455 (6.8%) |
| 35 to 64 Years | 331 (4.3%) | 574 (7.5%) |
| 65 to 74 Years | 76 (3.3%) | 41 (1.8%) |
| 75 Years and over | 156 (11.7%) | 165 (11.2%) |
Disability Class: Ambulatory Difficulty
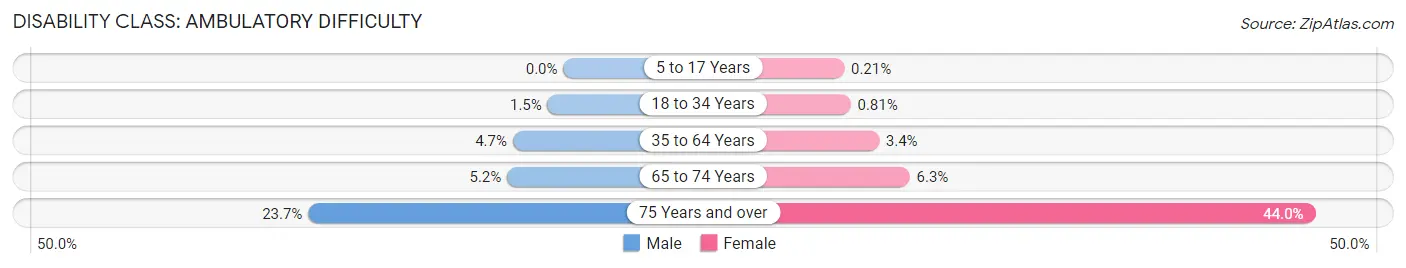
| Age Bracket | Male | Female |
| 5 to 17 Years | 0 (0.0%) | 6 (0.2%) |
| 18 to 34 Years | 103 (1.5%) | 54 (0.8%) |
| 35 to 64 Years | 359 (4.7%) | 263 (3.4%) |
| 65 to 74 Years | 120 (5.2%) | 146 (6.3%) |
| 75 Years and over | 315 (23.7%) | 647 (44.0%) |
Disability Class: Self-Care Difficulty
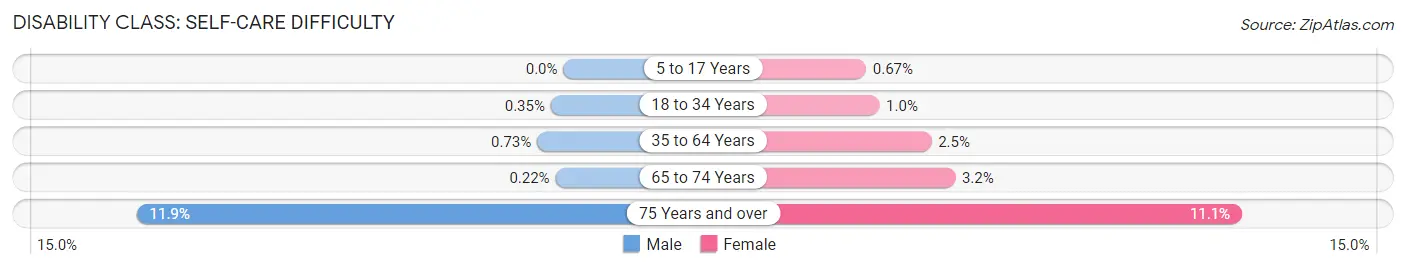
| Age Bracket | Male | Female |
| 5 to 17 Years | 0 (0.0%) | 19 (0.7%) |
| 18 to 34 Years | 25 (0.4%) | 70 (1.0%) |
| 35 to 64 Years | 56 (0.7%) | 190 (2.5%) |
| 65 to 74 Years | 5 (0.2%) | 73 (3.2%) |
| 75 Years and over | 158 (11.9%) | 164 (11.1%) |
Technology Access in Kittitas County
Computing Device Access in Kittitas County
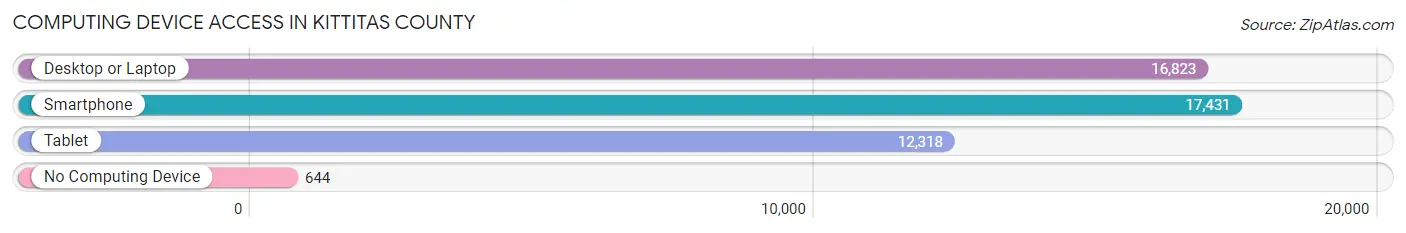
| Device Type | # Households | % Households |
| Desktop or Laptop | 16,823 | 87.4% |
| Smartphone | 17,431 | 90.5% |
| Tablet | 12,318 | 64.0% |
| No Computing Device | 644 | 3.4% |
| Total | 19,250 | 100.0% |
Internet Access in Kittitas County
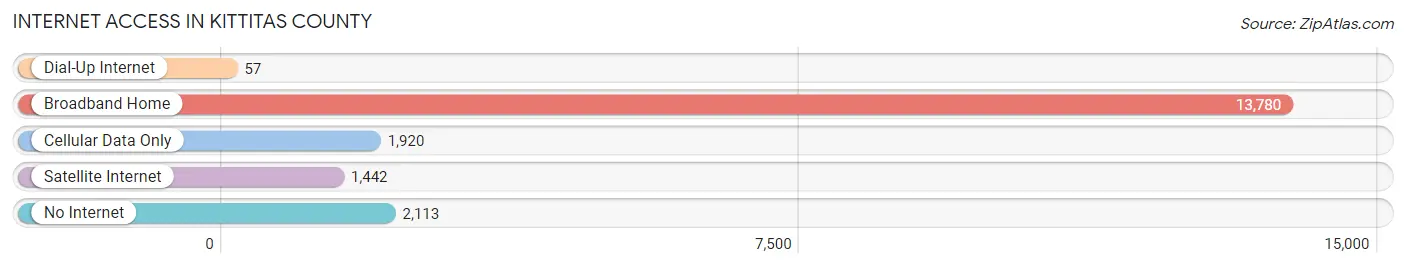
| Internet Type | # Households | % Households |
| Dial-Up Internet | 57 | 0.3% |
| Broadband Home | 13,780 | 71.6% |
| Cellular Data Only | 1,920 | 10.0% |
| Satellite Internet | 1,442 | 7.5% |
| No Internet | 2,113 | 11.0% |
| Total | 19,250 | 100.0% |
Kittitas County Summary
Kittitas County is located in the central part of Washington State, in the Cascade Mountains. It is bordered by Chelan County to the north, Yakima County to the south, and King County to the west. The county seat is Ellensburg, and the county is named after the Kittitas people, a Native American tribe that lived in the area.
History
Kittitas County was first inhabited by Native American tribes, including the Kittitas, Yakama, and Palouse. The first European settlers arrived in the area in the mid-1800s, and the county was officially established in 1883. The county was originally part of Yakima County, but was split off in 1883.
The county was largely agricultural in the early years, with wheat, apples, and hops being the main crops. The county also had a thriving timber industry, and the first sawmill was built in 1884. The county was also home to several coal mines, which provided jobs for many of the residents.
In the early 1900s, the county began to develop more industry, including a woolen mill, a flour mill, and a cannery. The county also had a thriving tourism industry, with many people coming to the area to enjoy the scenery and outdoor activities.
Geography
Kittitas County is located in the Cascade Mountains of Washington State. The county is bordered by Chelan County to the north, Yakima County to the south, and King County to the west. The county is home to several mountain ranges, including the Cascade Range, the Wenatchee Mountains, and the Okanogan Range. The county is also home to several rivers, including the Yakima River, the Naches River, and the Cle Elum River.
The county has a total area of 2,333 square miles, of which 2,323 square miles is land and 10 square miles is water. The county has a variety of terrain, ranging from rolling hills to steep mountains. The highest point in the county is Mount Daniel, which has an elevation of 9,087 feet.
Economy
Kittitas County has a diverse economy, with a variety of industries providing jobs for its residents. The county is home to several large employers, including the University of Washington, Central Washington University, and the Kittitas Valley Healthcare Center. The county also has a thriving agricultural industry, with wheat, apples, hops, and other crops being grown in the area.
The county also has a thriving tourism industry, with many people coming to the area to enjoy the scenery and outdoor activities. The county is home to several ski resorts, including Snoqualmie Pass and Mission Ridge. The county also has several wineries, and is home to the annual Ellensburg Rodeo.
Demographics
As of the 2010 census, Kittitas County had a population of 40,915. The population was spread out, with 24.3% under the age of 18, 10.2% from 18 to 24, 28.2% from 25 to 44, 24.2% from 45 to 64, and 13.1% who were 65 years of age or older. The median age was 36.7 years.
The median income for a household in the county was $50,837, and the median income for a family was $62,917. The per capita income for the county was $25,945. About 11.2% of the population was below the poverty line.
Kittitas County is a diverse and vibrant county, with a variety of industries providing jobs for its residents. The county has a thriving agricultural industry, and is home to several ski resorts and wineries. The county also has a thriving tourism industry, with many people coming to the area to enjoy the scenery and outdoor activities.
Common Questions
What is the Total Population of Kittitas County?
Total Population of Kittitas County is 44,424.
What is the Total Male Population of Kittitas County?
Total Male Population of Kittitas County is 22,385.
What is the Total Female Population of Kittitas County?
Total Female Population of Kittitas County is 22,039.
What is the Ratio of Males per 100 Females in Kittitas County?
There are 101.57 Males per 100 Females in Kittitas County.
What is the Ratio of Females per 100 Males in Kittitas County?
There are 98.45 Females per 100 Males in Kittitas County.
What is the Median Population Age in Kittitas County?
Median Population Age in Kittitas County is 36.4 Years.
What is the Average Family Size in Kittitas County
Average Family Size in Kittitas County is 2.7 People.
What is the Average Household Size in Kittitas County
Average Household Size in Kittitas County is 2.2 People.
What is Per Capita Income in Kittitas County?
Per Capita income in Kittitas County is $39,399.
What is the Median Family Income in Kittitas County?
Median Family Income in Kittitas County is $94,018.
What is the Median Household income in Kittitas County?
Median Household Income in Kittitas County is $66,800.
What is Income or Wage Gap in Kittitas County?
Income or Wage Gap in Kittitas County is 30.7%.
Women in Kittitas County earn 69.3 cents for every dollar earned by a man.
What is Family Income Deficit in Kittitas County?
Family Income Deficit in Kittitas County is $11,663.
Families that are below poverty line in Kittitas County earn $11,663 less on average than the poverty threshold level.
What is Inequality or Gini Index in Kittitas County?
Inequality or Gini Index in Kittitas County is 0.46.
How Large is the Labor Force in Kittitas County?
There are 23,521 People in the Labor Forcein in Kittitas County.
What is the Percentage of People in the Labor Force in Kittitas County?
62.5% of People are in the Labor Force in Kittitas County.
What is the Unemployment Rate in Kittitas County?
Unemployment Rate in Kittitas County is 5.9%.