Grant County, WA
Grant County Map
Grant County Overview
99,145
TOTAL POPULATION
50,580
MALE POPULATION
48,565
FEMALE POPULATION
104.15
MALES / 100 FEMALES
96.02
FEMALES / 100 MALES
33.2
MEDIAN AGE
3.5
AVG FAMILY SIZE
2.9
AVG HOUSEHOLD SIZE
$29,655
PER CAPITA INCOME
$75,647
AVG FAMILY INCOME
$66,387
AVG HOUSEHOLD INCOME
33.3%
WAGE / INCOME GAP [ % ]
66.7¢/ $1
WAGE / INCOME GAP [ $ ]
$11,232
FAMILY INCOME DEFICIT
0.43
INEQUALITY / GINI INDEX
45,960
LABOR FORCE [ PEOPLE ]
62.3%
PERCENT IN LABOR FORCE
5.4%
UNEMPLOYMENT RATE
Grant County Area Codes
Race in Grant County
The most populous races in Grant County are White / Caucasian (61,533 | 62.1%), Hispanic or Latino (42,453 | 42.8%), and Some other Race (23,197 | 23.4%).
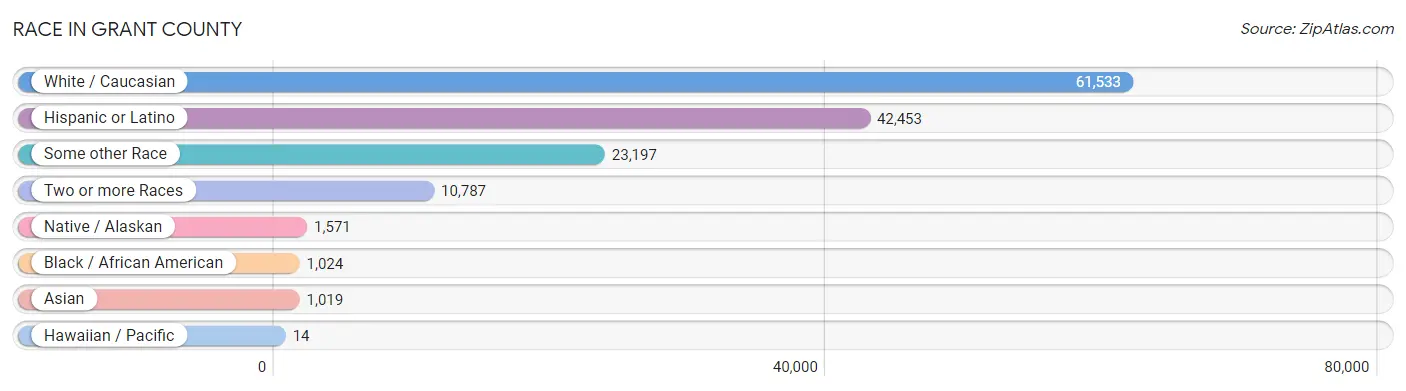
| Race | # Population | % Population |
| Asian | 1,019 | 1.0% |
| Black / African American | 1,024 | 1.0% |
| Hawaiian / Pacific | 14 | 0.0% |
| Hispanic or Latino | 42,453 | 42.8% |
| Native / Alaskan | 1,571 | 1.6% |
| White / Caucasian | 61,533 | 62.1% |
| Two or more Races | 10,787 | 10.9% |
| Some other Race | 23,197 | 23.4% |
| Total | 99,145 | 100.0% |
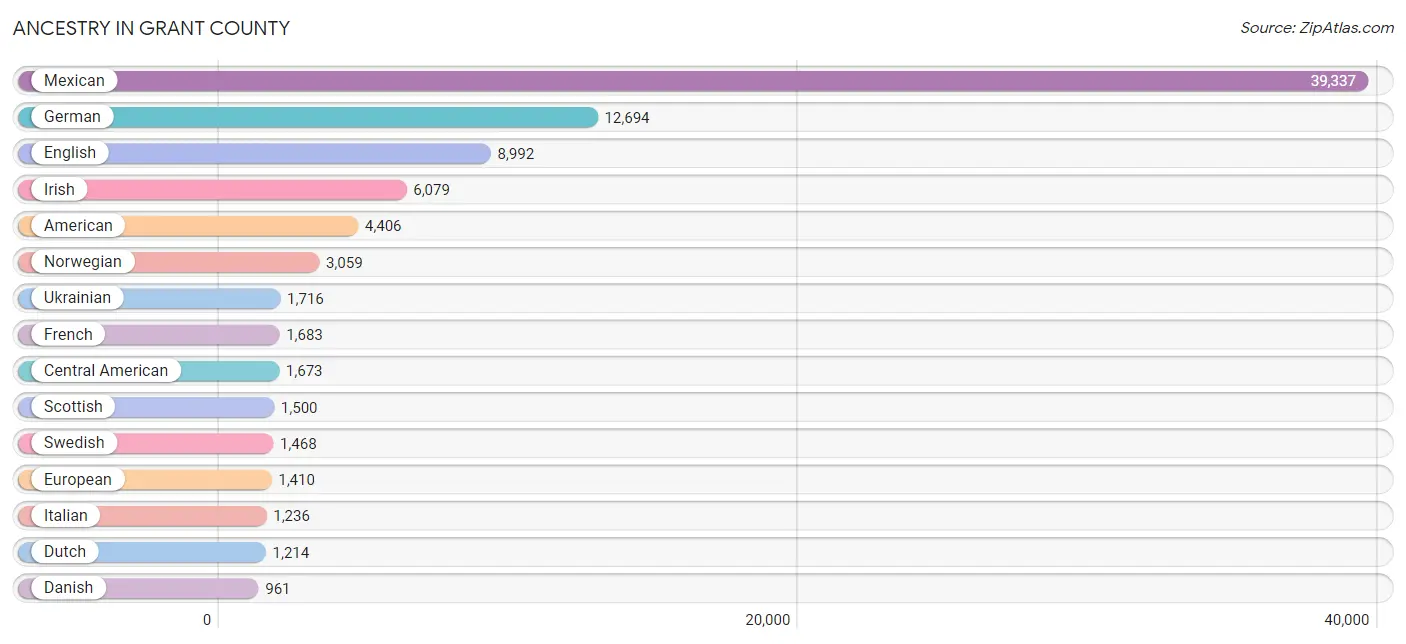
Ancestry in Grant County
The most populous ancestries reported in Grant County are Mexican (39,337 | 39.7%), German (12,694 | 12.8%), English (8,992 | 9.1%), Irish (6,079 | 6.1%), and American (4,406 | 4.4%), together accounting for 72.1% of all Grant County residents.
| Ancestry | # Population | % Population |
| African | 1 | 0.0% |
| Alaska Native | 12 | 0.0% |
| Albanian | 22 | 0.0% |
| Aleut | 43 | 0.0% |
| American | 4,406 | 4.4% |
| Apache | 2 | 0.0% |
| Arab | 30 | 0.0% |
| Australian | 86 | 0.1% |
| Austrian | 176 | 0.2% |
| Basque | 88 | 0.1% |
| Belgian | 65 | 0.1% |
| Bhutanese | 448 | 0.4% |
| Blackfeet | 166 | 0.2% |
| Bolivian | 14 | 0.0% |
| British | 433 | 0.4% |
| Burmese | 104 | 0.1% |
| Cajun | 6 | 0.0% |
| Canadian | 97 | 0.1% |
| Central American | 1,673 | 1.7% |
| Central American Indian | 43 | 0.0% |
| Cherokee | 188 | 0.2% |
| Chickasaw | 41 | 0.0% |
| Chilean | 21 | 0.0% |
| Chippewa | 30 | 0.0% |
| Choctaw | 16 | 0.0% |
| Colombian | 17 | 0.0% |
| Colville | 513 | 0.5% |
| Comanche | 5 | 0.0% |
| Cree | 11 | 0.0% |
| Creek | 13 | 0.0% |
| Croatian | 67 | 0.1% |
| Crow | 5 | 0.0% |
| Cuban | 8 | 0.0% |
| Czech | 178 | 0.2% |
| Czechoslovakian | 9 | 0.0% |
| Danish | 961 | 1.0% |
| Dominican | 51 | 0.1% |
| Dutch | 1,214 | 1.2% |
| Eastern European | 98 | 0.1% |
| English | 8,992 | 9.1% |
| European | 1,410 | 1.4% |
| Finnish | 160 | 0.2% |
| French | 1,683 | 1.7% |
| French American Indian | 77 | 0.1% |
| French Canadian | 377 | 0.4% |
| German | 12,694 | 12.8% |
| Greek | 193 | 0.2% |
| Guamanian / Chamorro | 5 | 0.0% |
| Guatemalan | 292 | 0.3% |
| Haitian | 43 | 0.0% |
| Honduran | 721 | 0.7% |
| Hungarian | 93 | 0.1% |
| Indian (Asian) | 117 | 0.1% |
| Indonesian | 114 | 0.1% |
| Inupiat | 53 | 0.1% |
| Irish | 6,079 | 6.1% |
| Iroquois | 12 | 0.0% |
| Italian | 1,236 | 1.3% |
| Jamaican | 212 | 0.2% |
| Japanese | 53 | 0.1% |
| Korean | 579 | 0.6% |
| Latvian | 13 | 0.0% |
| Lebanese | 6 | 0.0% |
| Liberian | 21 | 0.0% |
| Lithuanian | 3 | 0.0% |
| Malaysian | 8 | 0.0% |
| Mexican | 39,337 | 39.7% |
| Mexican American Indian | 873 | 0.9% |
| Native Hawaiian | 57 | 0.1% |
| Navajo | 132 | 0.1% |
| Northern European | 232 | 0.2% |
| Norwegian | 3,059 | 3.1% |
| Pakistani | 70 | 0.1% |
| Palestinian | 24 | 0.0% |
| Pennsylvania German | 68 | 0.1% |
| Peruvian | 34 | 0.0% |
| Polish | 468 | 0.5% |
| Portuguese | 64 | 0.1% |
| Puerto Rican | 118 | 0.1% |
| Puget Sound Salish | 58 | 0.1% |
| Romanian | 105 | 0.1% |
| Russian | 513 | 0.5% |
| Salvadoran | 660 | 0.7% |
| Scandinavian | 654 | 0.7% |
| Scotch-Irish | 620 | 0.6% |
| Scottish | 1,500 | 1.5% |
| Seminole | 4 | 0.0% |
| Senegalese | 8 | 0.0% |
| Serbian | 9 | 0.0% |
| Shoshone | 41 | 0.0% |
| Sioux | 108 | 0.1% |
| Slavic | 51 | 0.1% |
| Slovak | 10 | 0.0% |
| Slovene | 28 | 0.0% |
| South American | 116 | 0.1% |
| South American Indian | 66 | 0.1% |
| Spaniard | 116 | 0.1% |
| Spanish | 218 | 0.2% |
| Sri Lankan | 90 | 0.1% |
| Subsaharan African | 38 | 0.0% |
| Swedish | 1,468 | 1.5% |
| Swiss | 480 | 0.5% |
| Thai | 240 | 0.2% |
| Tlingit-Haida | 3 | 0.0% |
| Ukrainian | 1,716 | 1.7% |
| Venezuelan | 30 | 0.0% |
| Welsh | 505 | 0.5% |
| Yakama | 16 | 0.0% |
| Yaqui | 2 | 0.0% |
| Yugoslavian | 12 | 0.0% |
| Yup'ik | 1 | 0.0% | View All 111 Rows |
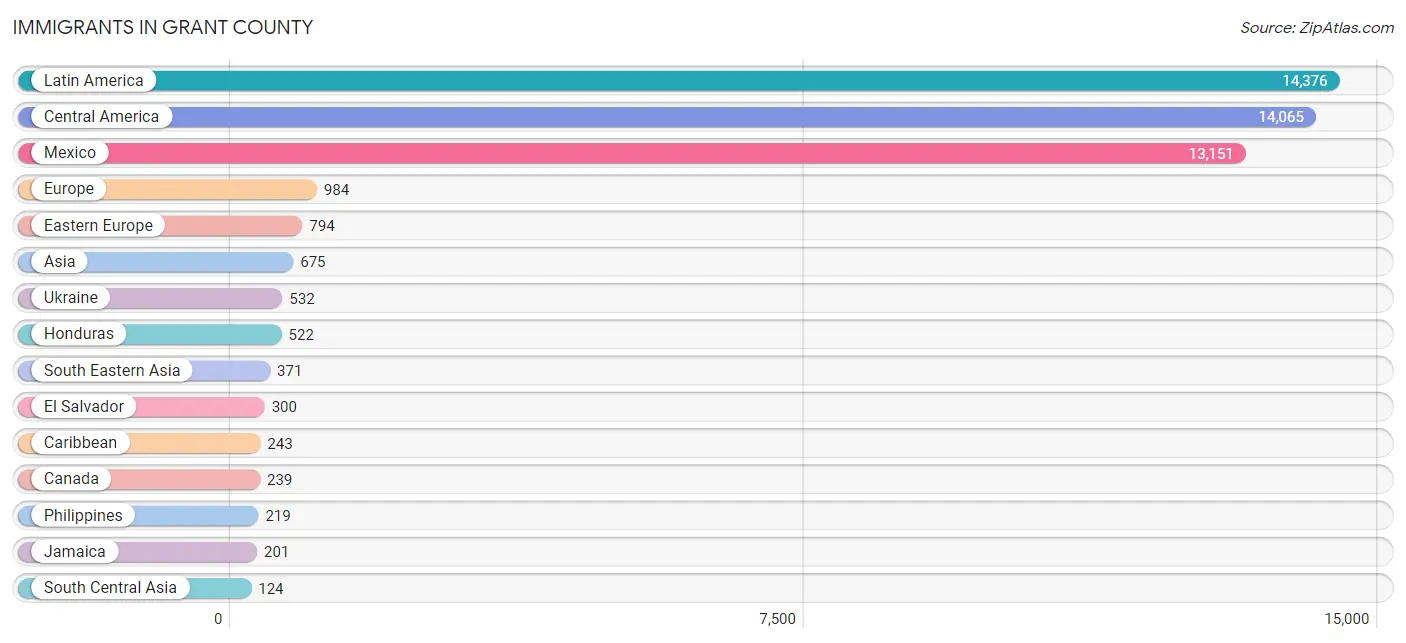
Immigrants in Grant County
The most numerous immigrant groups reported in Grant County came from Latin America (14,376 | 14.5%), Central America (14,065 | 14.2%), Mexico (13,151 | 13.3%), Europe (984 | 1.0%), and Eastern Europe (794 | 0.8%), together accounting for 43.7% of all Grant County residents.
| Immigration Origin | # Population | % Population |
| Africa | 49 | 0.1% |
| Asia | 675 | 0.7% |
| Belarus | 54 | 0.1% |
| Belgium | 10 | 0.0% |
| Canada | 239 | 0.2% |
| Caribbean | 243 | 0.3% |
| Central America | 14,065 | 14.2% |
| Chile | 21 | 0.0% |
| China | 37 | 0.0% |
| Colombia | 17 | 0.0% |
| Czechoslovakia | 21 | 0.0% |
| Dominican Republic | 26 | 0.0% |
| Eastern Asia | 107 | 0.1% |
| Eastern Europe | 794 | 0.8% |
| El Salvador | 300 | 0.3% |
| England | 21 | 0.0% |
| Europe | 984 | 1.0% |
| France | 3 | 0.0% |
| Germany | 95 | 0.1% |
| Guatemala | 92 | 0.1% |
| Haiti | 16 | 0.0% |
| Honduras | 522 | 0.5% |
| Hong Kong | 1 | 0.0% |
| India | 114 | 0.1% |
| Jamaica | 201 | 0.2% |
| Japan | 42 | 0.0% |
| Kazakhstan | 10 | 0.0% |
| Korea | 28 | 0.0% |
| Kuwait | 73 | 0.1% |
| Laos | 25 | 0.0% |
| Latin America | 14,376 | 14.5% |
| Latvia | 13 | 0.0% |
| Mexico | 13,151 | 13.3% |
| Moldova | 74 | 0.1% |
| Netherlands | 13 | 0.0% |
| Northern Europe | 69 | 0.1% |
| Philippines | 219 | 0.2% |
| Poland | 15 | 0.0% |
| Romania | 13 | 0.0% |
| Russia | 48 | 0.1% |
| Senegal | 8 | 0.0% |
| South Africa | 41 | 0.0% |
| South America | 68 | 0.1% |
| South Central Asia | 124 | 0.1% |
| South Eastern Asia | 371 | 0.4% |
| Sweden | 34 | 0.0% |
| Thailand | 29 | 0.0% |
| Ukraine | 532 | 0.5% |
| Venezuela | 30 | 0.0% |
| Vietnam | 42 | 0.0% |
| Western Africa | 8 | 0.0% |
| Western Asia | 73 | 0.1% |
| Western Europe | 121 | 0.1% | View All 53 Rows |
Sex and Age in Grant County
Sex and Age in Grant County
The most populous age groups in Grant County are 10 to 14 Years (4,255 | 8.4%) for men and 5 to 9 Years (4,057 | 8.4%) for women.
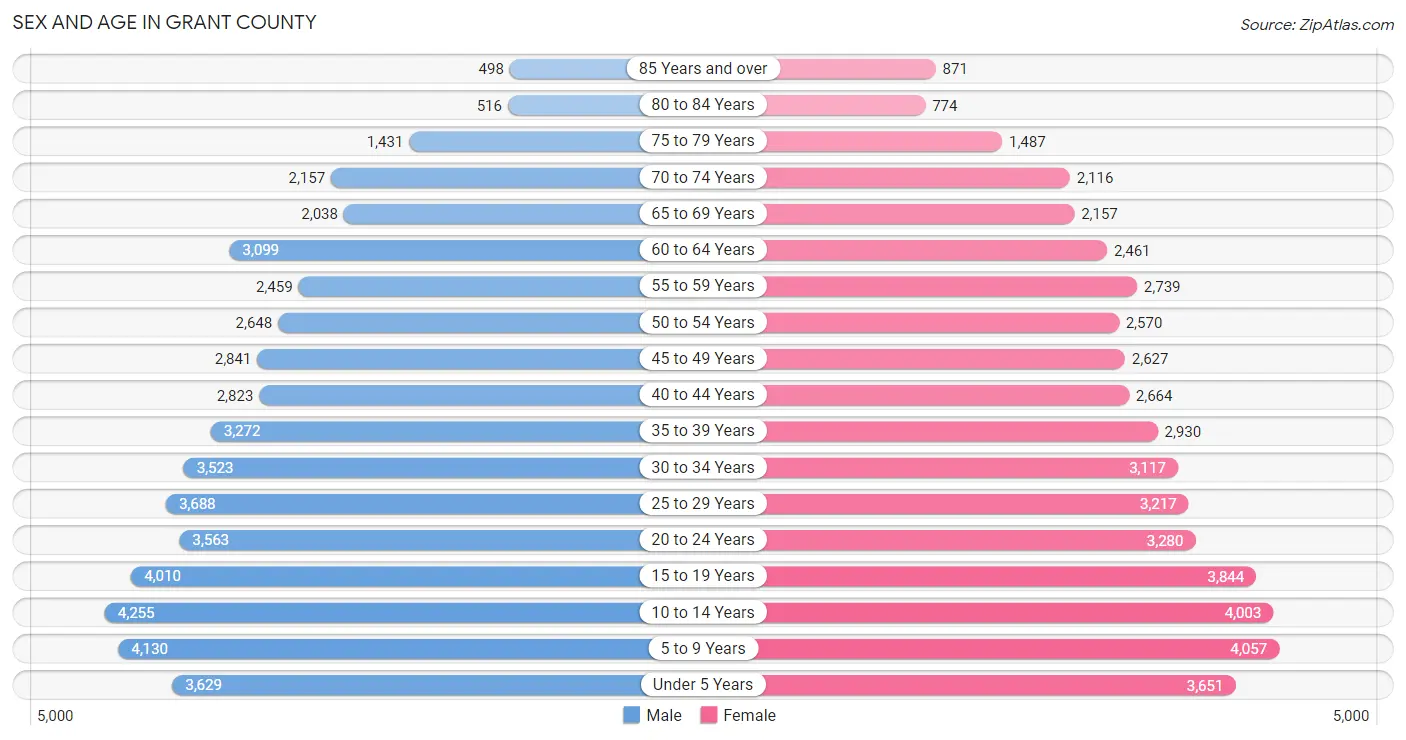
| Age Bracket | Male | Female |
| Under 5 Years | 3,629 (7.2%) | 3,651 (7.5%) |
| 5 to 9 Years | 4,130 (8.2%) | 4,057 (8.4%) |
| 10 to 14 Years | 4,255 (8.4%) | 4,003 (8.2%) |
| 15 to 19 Years | 4,010 (7.9%) | 3,844 (7.9%) |
| 20 to 24 Years | 3,563 (7.0%) | 3,280 (6.8%) |
| 25 to 29 Years | 3,688 (7.3%) | 3,217 (6.6%) |
| 30 to 34 Years | 3,523 (7.0%) | 3,117 (6.4%) |
| 35 to 39 Years | 3,272 (6.5%) | 2,930 (6.0%) |
| 40 to 44 Years | 2,823 (5.6%) | 2,664 (5.5%) |
| 45 to 49 Years | 2,841 (5.6%) | 2,627 (5.4%) |
| 50 to 54 Years | 2,648 (5.2%) | 2,570 (5.3%) |
| 55 to 59 Years | 2,459 (4.9%) | 2,739 (5.6%) |
| 60 to 64 Years | 3,099 (6.1%) | 2,461 (5.1%) |
| 65 to 69 Years | 2,038 (4.0%) | 2,157 (4.4%) |
| 70 to 74 Years | 2,157 (4.3%) | 2,116 (4.4%) |
| 75 to 79 Years | 1,431 (2.8%) | 1,487 (3.1%) |
| 80 to 84 Years | 516 (1.0%) | 774 (1.6%) |
| 85 Years and over | 498 (1.0%) | 871 (1.8%) |
| Total | 50,580 (100.0%) | 48,565 (100.0%) |
Families and Households in Grant County
Median Family Size in Grant County
The median family size in Grant County is 3.46 persons per family, with married-couple families (16,572 | 70.5%) accounting for the largest median family size of 3.56 persons per family. On the other hand, single male/father families (2,433 | 10.3%) represent the smallest median family size with 3.16 persons per family.
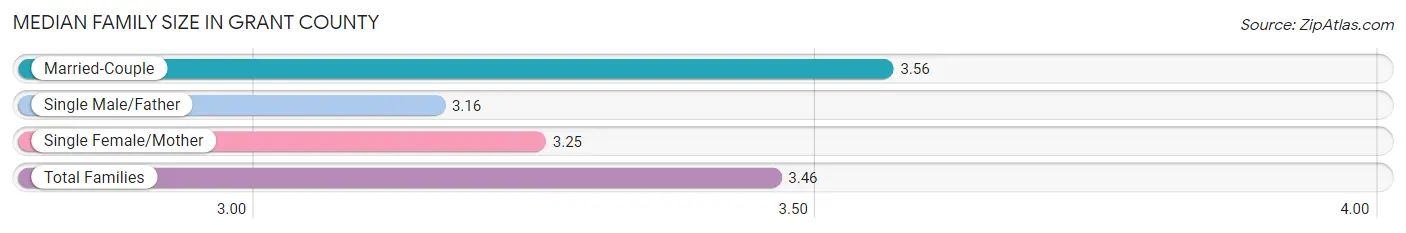
| Family Type | # Families | Family Size |
| Married-Couple | 16,572 (70.5%) | 3.56 |
| Single Male/Father | 2,433 (10.3%) | 3.16 |
| Single Female/Mother | 4,491 (19.1%) | 3.25 |
| Total Families | 23,496 (100.0%) | 3.46 |
Median Household Size in Grant County
The median household size in Grant County is 2.89 persons per household, with single male/father households (2,433 | 7.2%) accounting for the largest median household size of 3.67 persons per household. non-family households (10,170 | 30.2%) represent the smallest median household size with 1.25 persons per household.
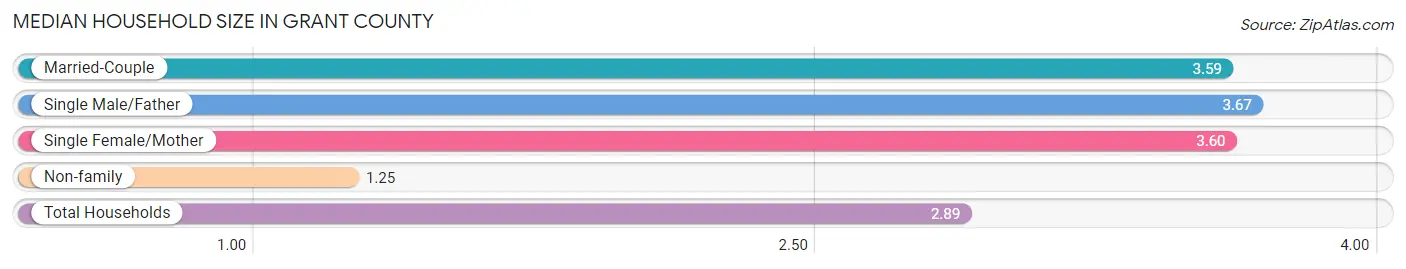
| Household Type | # Households | Household Size |
| Married-Couple | 16,572 (49.2%) | 3.59 |
| Single Male/Father | 2,433 (7.2%) | 3.67 |
| Single Female/Mother | 4,491 (13.3%) | 3.60 |
| Non-family | 10,170 (30.2%) | 1.25 |
| Total Households | 33,666 (100.0%) | 2.89 |
Household Size by Marriage Status in Grant County
Out of a total of 33,666 households in Grant County, 23,496 (69.8%) are family households, while 10,170 (30.2%) are nonfamily households. The most numerous type of family households are 2-person households, comprising 8,723, and the most common type of nonfamily households are 1-person households, comprising 8,025.
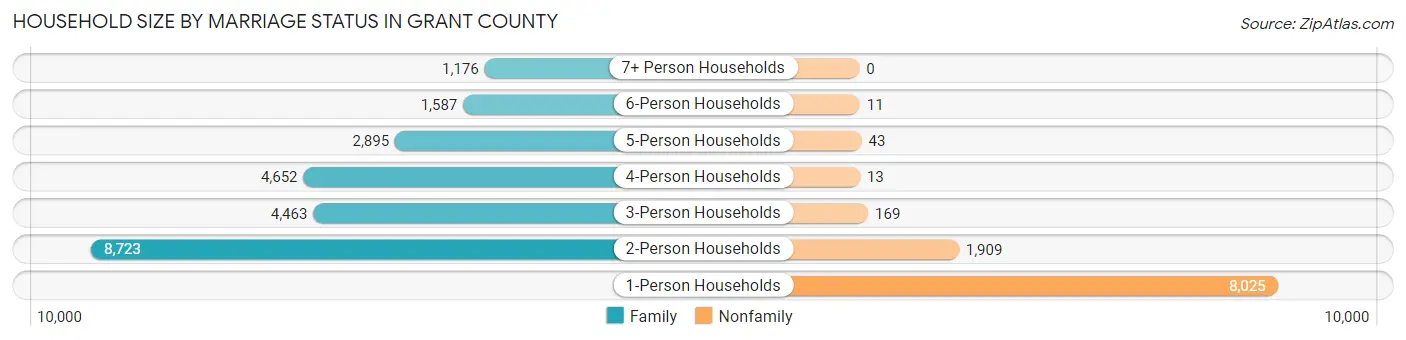
| Household Size | Family Households | Nonfamily Households |
| 1-Person Households | - | 8,025 (23.8%) |
| 2-Person Households | 8,723 (25.9%) | 1,909 (5.7%) |
| 3-Person Households | 4,463 (13.3%) | 169 (0.5%) |
| 4-Person Households | 4,652 (13.8%) | 13 (0.0%) |
| 5-Person Households | 2,895 (8.6%) | 43 (0.1%) |
| 6-Person Households | 1,587 (4.7%) | 11 (0.0%) |
| 7+ Person Households | 1,176 (3.5%) | 0 (0.0%) |
| Total | 23,496 (69.8%) | 10,170 (30.2%) |
Female Fertility in Grant County
Fertility by Age in Grant County
Average fertility rate in Grant County is 68.0 births per 1,000 women. Women in the age bracket of 20 to 34 years have the highest fertility rate with 119.0 births per 1,000 women. Women in the age bracket of 20 to 34 years acount for 75.0% of all women with births.
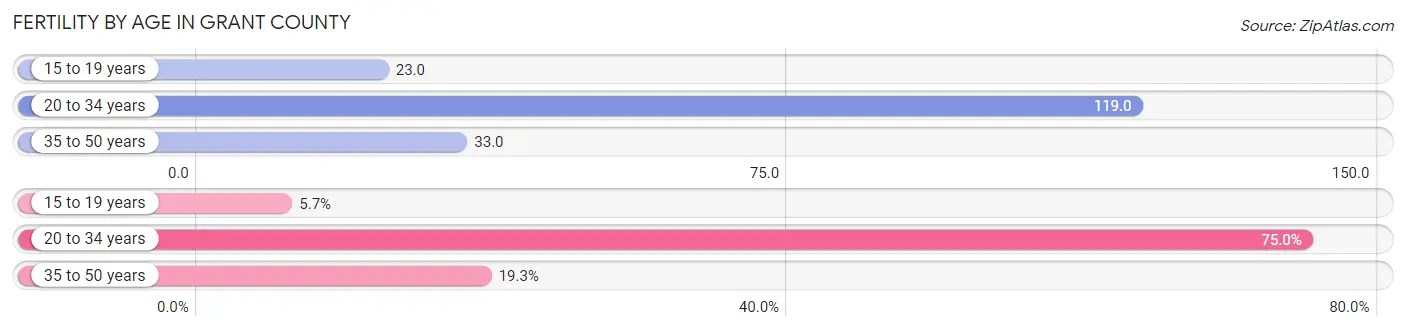
| Age Bracket | Women with Births | Births / 1,000 Women |
| 15 to 19 years | 87 (5.7%) | 23.0 |
| 20 to 34 years | 1,142 (75.0%) | 119.0 |
| 35 to 50 years | 293 (19.3%) | 33.0 |
| Total | 1,522 (100.0%) | 68.0 |
Fertility by Age by Marriage Status in Grant County
69.7% of women with births (1,522) in Grant County are married. The highest percentage of unmarried women with births falls into 15 to 19 years age bracket with 72.4% of them unmarried at the time of birth, while the lowest percentage of unmarried women with births belong to 35 to 50 years age bracket with 3.4% of them unmarried.
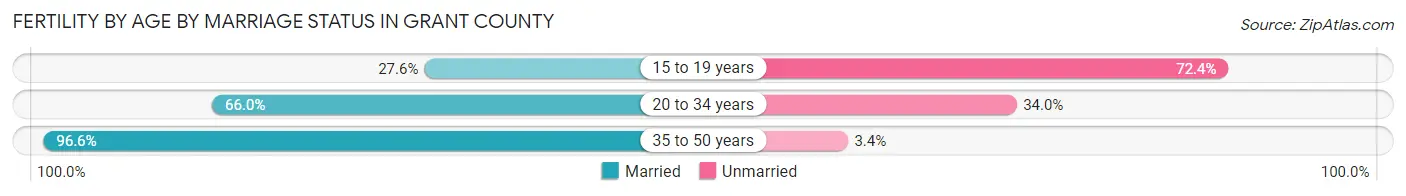
| Age Bracket | Married | Unmarried |
| 15 to 19 years | 24 (27.6%) | 63 (72.4%) |
| 20 to 34 years | 754 (66.0%) | 388 (34.0%) |
| 35 to 50 years | 283 (96.6%) | 10 (3.4%) |
| Total | 1,061 (69.7%) | 461 (30.3%) |
Fertility by Education in Grant County
Average fertility rate in Grant County is 68.0 births per 1,000 women. Women with the education attainment of graduate degree have the highest fertility rate of 124.0 births per 1,000 women, while women with the education attainment of less than high school have the lowest fertility at 55.0 births per 1,000 women. Women with the education attainment of college or associate's degree represent 36.5% of all women with births.
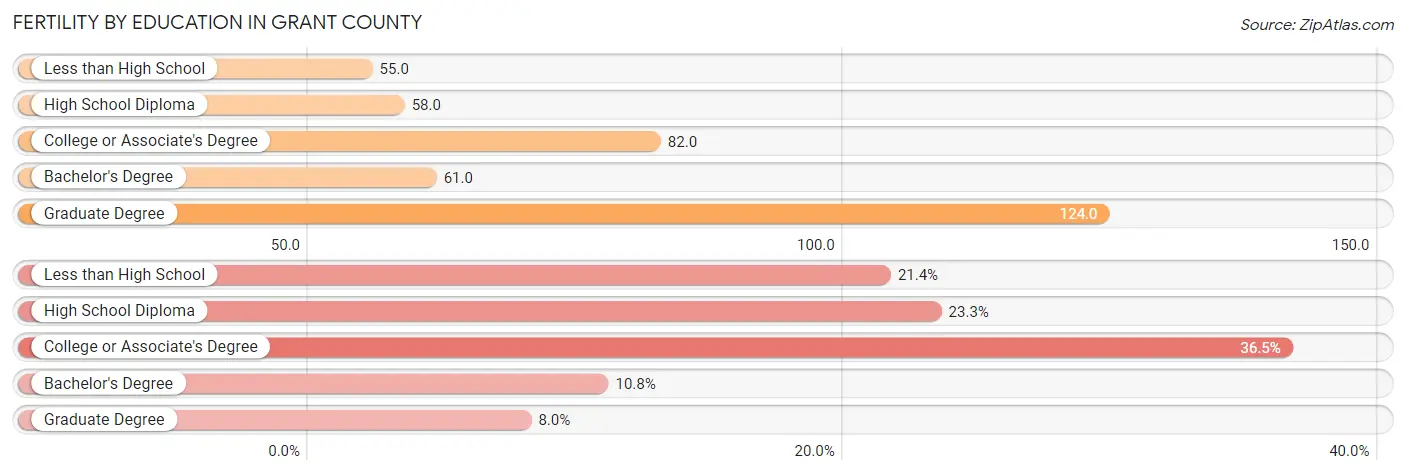
| Educational Attainment | Women with Births | Births / 1,000 Women |
| Less than High School | 326 (21.4%) | 55.0 |
| High School Diploma | 355 (23.3%) | 58.0 |
| College or Associate's Degree | 555 (36.5%) | 82.0 |
| Bachelor's Degree | 165 (10.8%) | 61.0 |
| Graduate Degree | 121 (8.0%) | 124.0 |
| Total | 1,522 (100.0%) | 68.0 |
Fertility by Education by Marriage Status in Grant County
30.3% of women with births in Grant County are unmarried. Women with the educational attainment of graduate degree are most likely to be married with 100.0% of them married at childbirth, while women with the educational attainment of high school diploma are least likely to be married with 56.6% of them unmarried at childbirth.
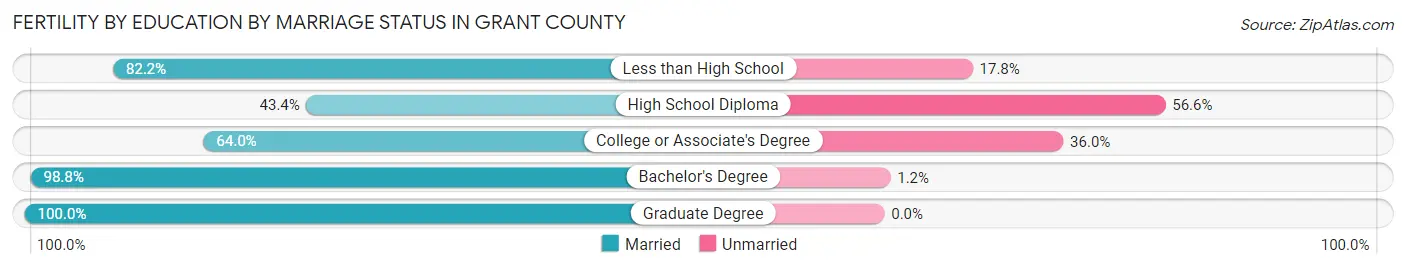
| Educational Attainment | Married | Unmarried |
| Less than High School | 268 (82.2%) | 58 (17.8%) |
| High School Diploma | 154 (43.4%) | 201 (56.6%) |
| College or Associate's Degree | 355 (64.0%) | 200 (36.0%) |
| Bachelor's Degree | 163 (98.8%) | 2 (1.2%) |
| Graduate Degree | 121 (100.0%) | 0 (0.0%) |
| Total | 1,061 (69.7%) | 461 (30.3%) |
Income in Grant County
Income Overview in Grant County
Per Capita Income in Grant County is $29,655, while median incomes of families and households are $75,647 and $66,387 respectively.
| Characteristic | Number | Measure |
| Per Capita Income | 99,145 | $29,655 |
| Median Family Income | 23,496 | $75,647 |
| Mean Family Income | 23,496 | $92,937 |
| Median Household Income | 33,666 | $66,387 |
| Mean Household Income | 33,666 | $83,535 |
| Income Deficit | 23,496 | $11,232 |
| Wage / Income Gap (%) | 99,145 | 33.31% |
| Wage / Income Gap ($) | 99,145 | 66.69¢ per $1 |
| Gini / Inequality Index | 99,145 | 0.43 |
Earnings by Sex in Grant County
Average Earnings in Grant County are $36,616, $43,553 for men and $29,046 for women, a difference of 33.3%.
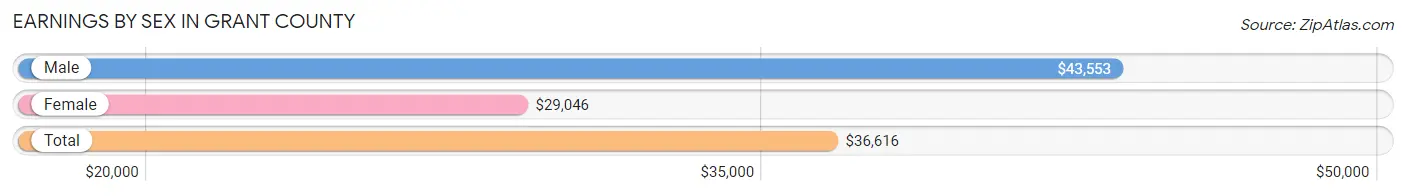
| Sex | Number | Average Earnings |
| Male | 26,745 (55.5%) | $43,553 |
| Female | 21,475 (44.5%) | $29,046 |
| Total | 48,220 (100.0%) | $36,616 |
Earnings by Sex by Income Bracket in Grant County
The most common earnings brackets in Grant County are $55,000 to $64,999 for men (2,822 | 10.5%) and $25,000 to $29,999 for women (2,110 | 9.8%).
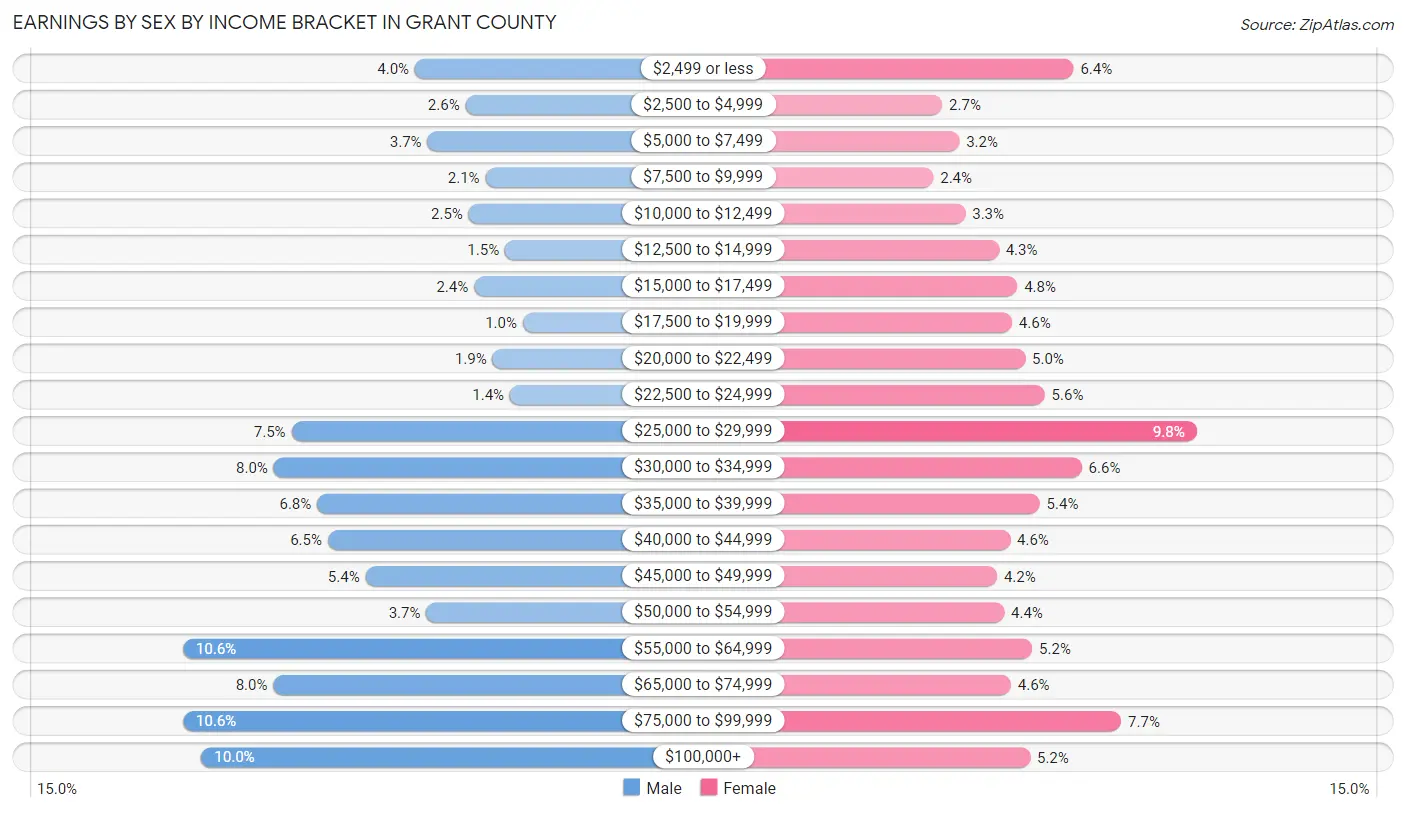
| Income | Male | Female |
| $2,499 or less | 1,077 (4.0%) | 1,369 (6.4%) |
| $2,500 to $4,999 | 697 (2.6%) | 576 (2.7%) |
| $5,000 to $7,499 | 983 (3.7%) | 679 (3.2%) |
| $7,500 to $9,999 | 549 (2.1%) | 522 (2.4%) |
| $10,000 to $12,499 | 675 (2.5%) | 715 (3.3%) |
| $12,500 to $14,999 | 402 (1.5%) | 917 (4.3%) |
| $15,000 to $17,499 | 634 (2.4%) | 1,028 (4.8%) |
| $17,500 to $19,999 | 268 (1.0%) | 997 (4.6%) |
| $20,000 to $22,499 | 494 (1.8%) | 1,076 (5.0%) |
| $22,500 to $24,999 | 365 (1.4%) | 1,194 (5.6%) |
| $25,000 to $29,999 | 2,006 (7.5%) | 2,110 (9.8%) |
| $30,000 to $34,999 | 2,140 (8.0%) | 1,418 (6.6%) |
| $35,000 to $39,999 | 1,814 (6.8%) | 1,165 (5.4%) |
| $40,000 to $44,999 | 1,732 (6.5%) | 985 (4.6%) |
| $45,000 to $49,999 | 1,450 (5.4%) | 906 (4.2%) |
| $50,000 to $54,999 | 991 (3.7%) | 949 (4.4%) |
| $55,000 to $64,999 | 2,822 (10.5%) | 1,118 (5.2%) |
| $65,000 to $74,999 | 2,142 (8.0%) | 989 (4.6%) |
| $75,000 to $99,999 | 2,822 (10.5%) | 1,655 (7.7%) |
| $100,000+ | 2,682 (10.0%) | 1,107 (5.1%) |
| Total | 26,745 (100.0%) | 21,475 (100.0%) |
Earnings by Sex by Educational Attainment in Grant County
Average earnings in Grant County are $49,966 for men and $34,227 for women, a difference of 31.5%. Men with an educational attainment of graduate degree enjoy the highest average annual earnings of $93,625, while those with less than high school education earn the least with $35,597. Women with an educational attainment of graduate degree earn the most with the average annual earnings of $69,167, while those with less than high school education have the smallest earnings of $20,734.
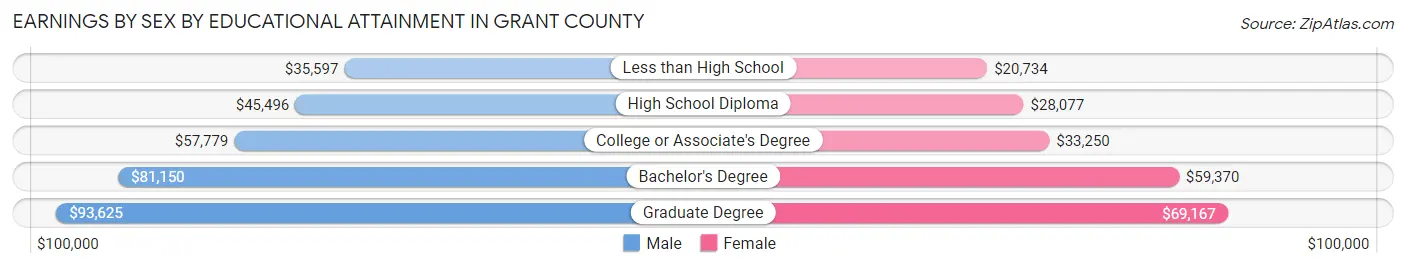
| Educational Attainment | Male Income | Female Income |
| Less than High School | $35,597 | $20,734 |
| High School Diploma | $45,496 | $28,077 |
| College or Associate's Degree | $57,779 | $33,250 |
| Bachelor's Degree | $81,150 | $59,370 |
| Graduate Degree | $93,625 | $69,167 |
| Total | $49,966 | $34,227 |
Family Income in Grant County
Family Income Brackets in Grant County
According to the Grant County family income data, there are 4,746 families falling into the $100,000 to $149,999 income range, which is the most common income bracket and makes up 20.2% of all families. Conversely, the $10,000 to $14,999 income bracket is the least frequent group with only 423 families (1.8%) belonging to this category.
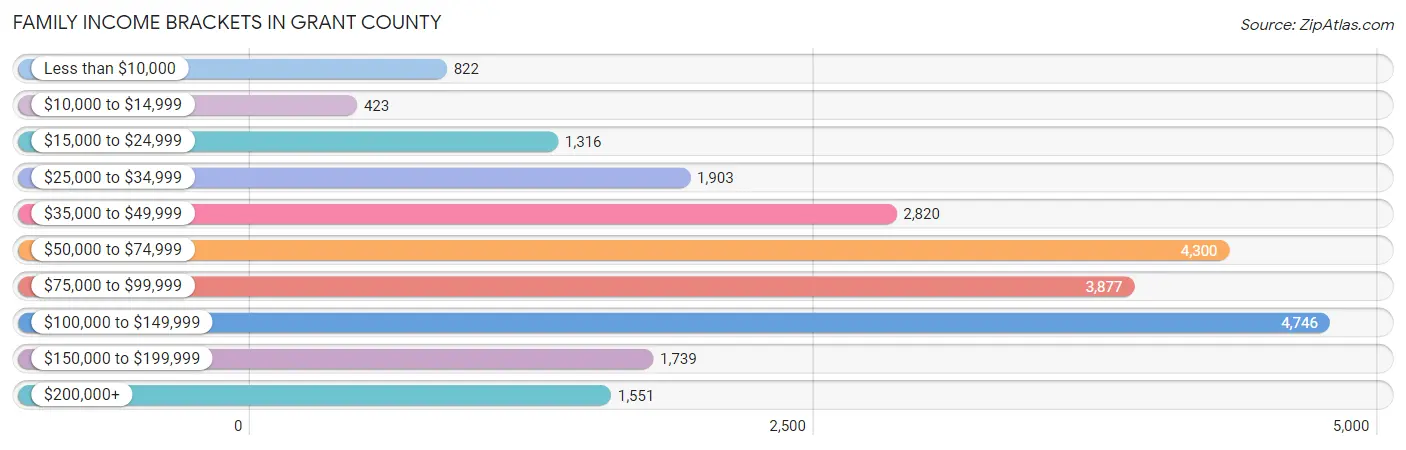
| Income Bracket | # Families | % Families |
| Less than $10,000 | 822 | 3.5% |
| $10,000 to $14,999 | 423 | 1.8% |
| $15,000 to $24,999 | 1,316 | 5.6% |
| $25,000 to $34,999 | 1,903 | 8.1% |
| $35,000 to $49,999 | 2,820 | 12.0% |
| $50,000 to $74,999 | 4,300 | 18.3% |
| $75,000 to $99,999 | 3,877 | 16.5% |
| $100,000 to $149,999 | 4,746 | 20.2% |
| $150,000 to $199,999 | 1,739 | 7.4% |
| $200,000+ | 1,551 | 6.6% |
Family Income by Famaliy Size in Grant County
6-person families (1,214 | 5.2%) account for the highest median family income in Grant County with $107,500 per family, while 2-person families (9,602 | 40.9%) have the highest median income of $34,822 per family member.
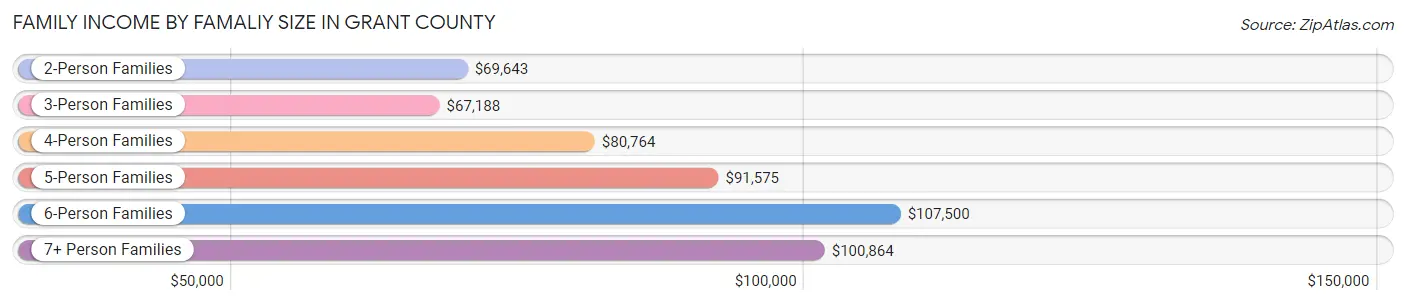
| Income Bracket | # Families | Median Income |
| 2-Person Families | 9,602 (40.9%) | $69,643 |
| 3-Person Families | 4,605 (19.6%) | $67,188 |
| 4-Person Families | 4,207 (17.9%) | $80,764 |
| 5-Person Families | 2,740 (11.7%) | $91,575 |
| 6-Person Families | 1,214 (5.2%) | $107,500 |
| 7+ Person Families | 1,128 (4.8%) | $100,864 |
| Total | 23,496 (100.0%) | $75,647 |
Family Income by Number of Earners in Grant County
The median family income in Grant County is $75,647, with families comprising 3+ earners (3,052) having the highest median family income of $125,188, while families with no earners (3,537) have the lowest median family income of $39,521, accounting for 13.0% and 15.0% of families, respectively.
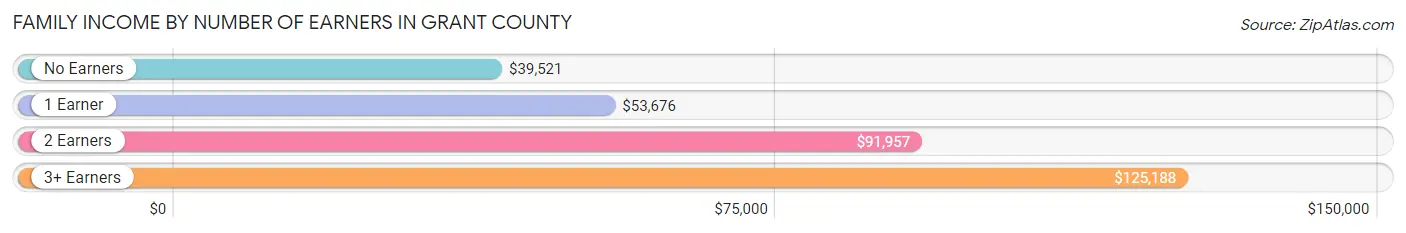
| Number of Earners | # Families | Median Income |
| No Earners | 3,537 (15.0%) | $39,521 |
| 1 Earner | 7,770 (33.1%) | $53,676 |
| 2 Earners | 9,137 (38.9%) | $91,957 |
| 3+ Earners | 3,052 (13.0%) | $125,188 |
| Total | 23,496 (100.0%) | $75,647 |
Household Income in Grant County
Household Income Brackets in Grant County
With 5,656 households falling in the category, the $50,000 to $74,999 income range is the most frequent in Grant County, accounting for 16.8% of all households. In contrast, only 1,178 households (3.5%) fall into the $10,000 to $14,999 income bracket, making it the least populous group.
| Income Bracket | # Households | % Households |
| Less than $10,000 | 1,582 | 4.7% |
| $10,000 to $14,999 | 1,178 | 3.5% |
| $15,000 to $24,999 | 2,626 | 7.8% |
| $25,000 to $34,999 | 3,266 | 9.7% |
| $35,000 to $49,999 | 4,444 | 13.2% |
| $50,000 to $74,999 | 5,656 | 16.8% |
| $75,000 to $99,999 | 5,252 | 15.6% |
| $100,000 to $149,999 | 5,656 | 16.8% |
| $150,000 to $199,999 | 1,953 | 5.8% |
| $200,000+ | 2,087 | 6.2% |
Household Income by Householder Age in Grant County
The median household income in Grant County is $66,387, with the highest median household income of $81,788 found in the 45 to 64 years age bracket for the primary householder. A total of 11,788 households (35.0%) fall into this category. Meanwhile, the 65+ years age bracket for the primary householder has the lowest median household income of $41,786, with 8,832 households (26.2%) in this group.
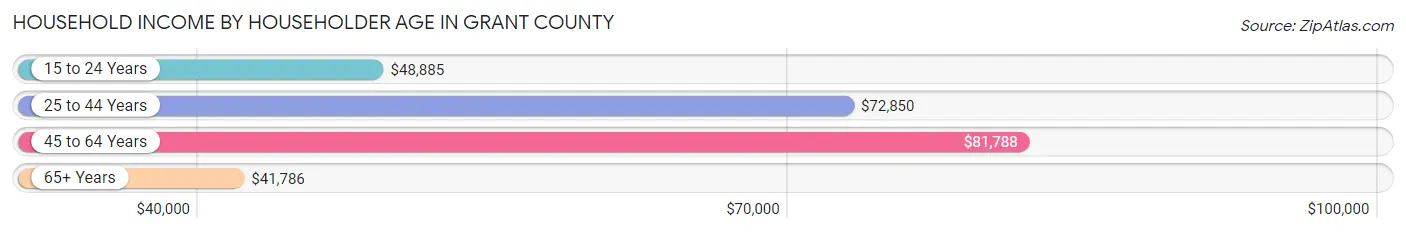
| Income Bracket | # Households | Median Income |
| 15 to 24 Years | 1,765 (5.2%) | $48,885 |
| 25 to 44 Years | 11,281 (33.5%) | $72,850 |
| 45 to 64 Years | 11,788 (35.0%) | $81,788 |
| 65+ Years | 8,832 (26.2%) | $41,786 |
| Total | 33,666 (100.0%) | $66,387 |
Poverty in Grant County
Income Below Poverty by Sex and Age in Grant County
With 13.3% poverty level for males and 15.3% for females among the residents of Grant County, 15 year old males and 15 year old females are the most vulnerable to poverty, with 250 males (23.3%) and 172 females (30.0%) in their respective age groups living below the poverty level.
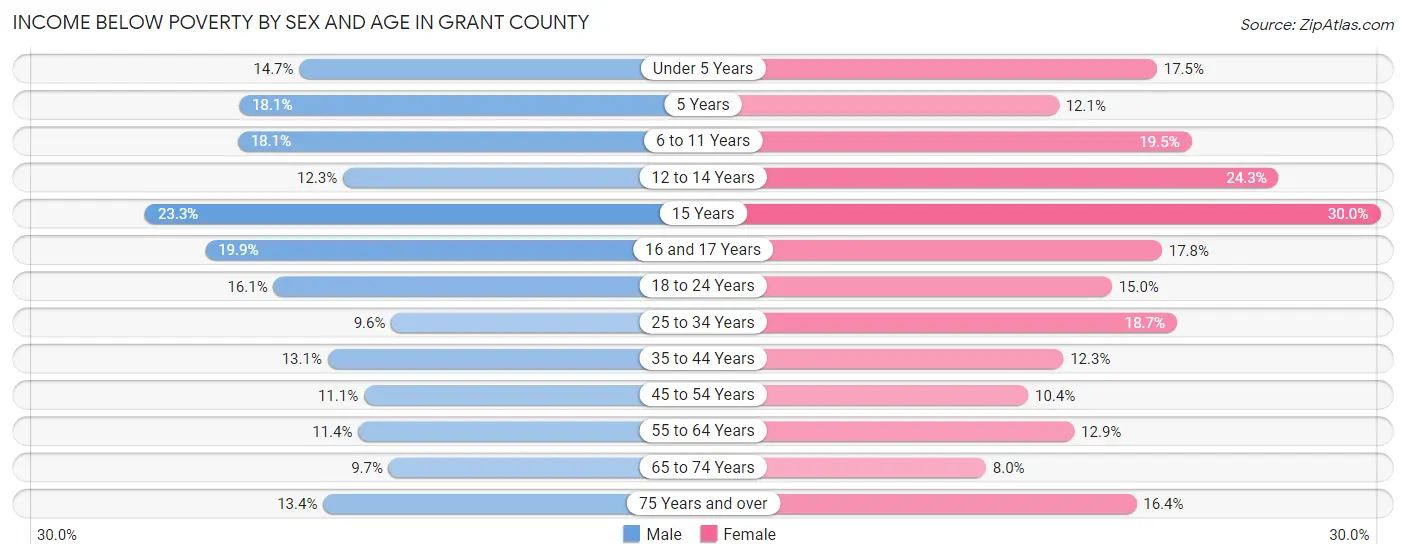
| Age Bracket | Male | Female |
| Under 5 Years | 528 (14.7%) | 632 (17.5%) |
| 5 Years | 153 (18.1%) | 72 (12.1%) |
| 6 to 11 Years | 896 (18.1%) | 987 (19.5%) |
| 12 to 14 Years | 310 (12.3%) | 546 (24.3%) |
| 15 Years | 250 (23.3%) | 172 (30.0%) |
| 16 and 17 Years | 282 (19.9%) | 327 (17.8%) |
| 18 to 24 Years | 803 (16.1%) | 704 (15.0%) |
| 25 to 34 Years | 688 (9.6%) | 1,181 (18.6%) |
| 35 to 44 Years | 796 (13.1%) | 689 (12.3%) |
| 45 to 54 Years | 604 (11.1%) | 538 (10.4%) |
| 55 to 64 Years | 635 (11.4%) | 670 (12.9%) |
| 65 to 74 Years | 403 (9.7%) | 342 (8.0%) |
| 75 Years and over | 317 (13.4%) | 494 (16.4%) |
| Total | 6,665 (13.3%) | 7,354 (15.3%) |
Income Above Poverty by Sex and Age in Grant County
According to the poverty statistics in Grant County, males aged 25 to 34 years and females aged 65 to 74 years are the age groups that are most secure financially, with 90.4% of males and 92.0% of females in these age groups living above the poverty line.
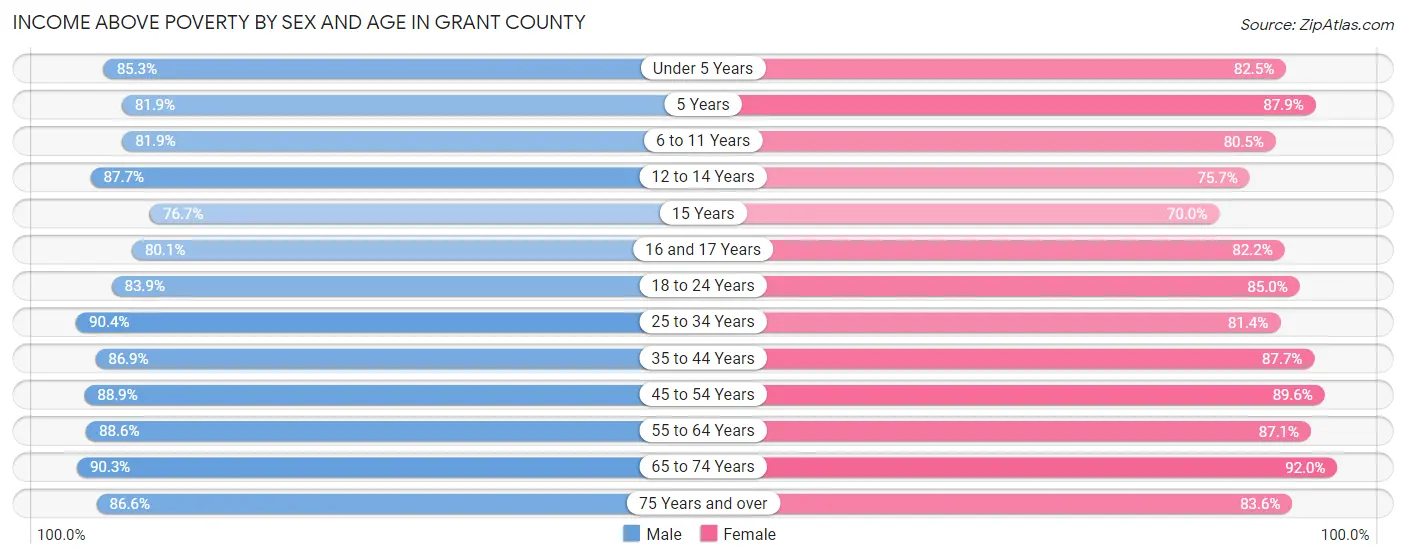
| Age Bracket | Male | Female |
| Under 5 Years | 3,065 (85.3%) | 2,972 (82.5%) |
| 5 Years | 694 (81.9%) | 524 (87.9%) |
| 6 to 11 Years | 4,046 (81.9%) | 4,083 (80.5%) |
| 12 to 14 Years | 2,216 (87.7%) | 1,699 (75.7%) |
| 15 Years | 823 (76.7%) | 402 (70.0%) |
| 16 and 17 Years | 1,132 (80.1%) | 1,508 (82.2%) |
| 18 to 24 Years | 4,172 (83.9%) | 3,981 (85.0%) |
| 25 to 34 Years | 6,493 (90.4%) | 5,153 (81.4%) |
| 35 to 44 Years | 5,270 (86.9%) | 4,897 (87.7%) |
| 45 to 54 Years | 4,838 (88.9%) | 4,652 (89.6%) |
| 55 to 64 Years | 4,923 (88.6%) | 4,506 (87.1%) |
| 65 to 74 Years | 3,743 (90.3%) | 3,920 (92.0%) |
| 75 Years and over | 2,054 (86.6%) | 2,519 (83.6%) |
| Total | 43,469 (86.7%) | 40,816 (84.7%) |
Income Below Poverty Among Married-Couple Families in Grant County
The poverty statistics for married-couple families in Grant County show that 6.4% or 1,068 of the total 16,572 families live below the poverty line. Families with 5 or more children have the highest poverty rate of 18.7%, comprising of 97 families. On the other hand, families with 1 or 2 children have the lowest poverty rate of 1.0%, which includes 47 families.
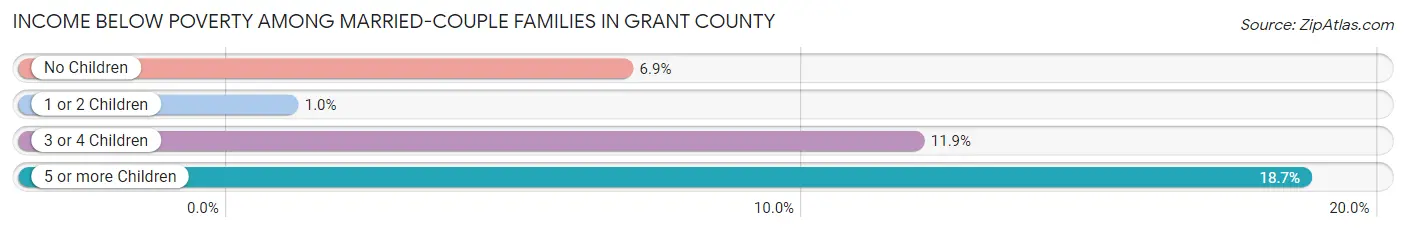
| Children | Above Poverty | Below Poverty |
| No Children | 8,316 (93.1%) | 613 (6.9%) |
| 1 or 2 Children | 4,473 (99.0%) | 47 (1.0%) |
| 3 or 4 Children | 2,293 (88.1%) | 311 (11.9%) |
| 5 or more Children | 422 (81.3%) | 97 (18.7%) |
| Total | 15,504 (93.6%) | 1,068 (6.4%) |
Income Below Poverty Among Single-Parent Households in Grant County
According to the poverty data in Grant County, 10.5% or 255 single-father households and 27.4% or 1,229 single-mother households are living below the poverty line. Among single-father households, those with 5 or more children have the highest poverty rate, with 83 households (100.0%) experiencing poverty. Likewise, among single-mother households, those with 3 or 4 children have the highest poverty rate, with 666 households (64.2%) falling below the poverty line.
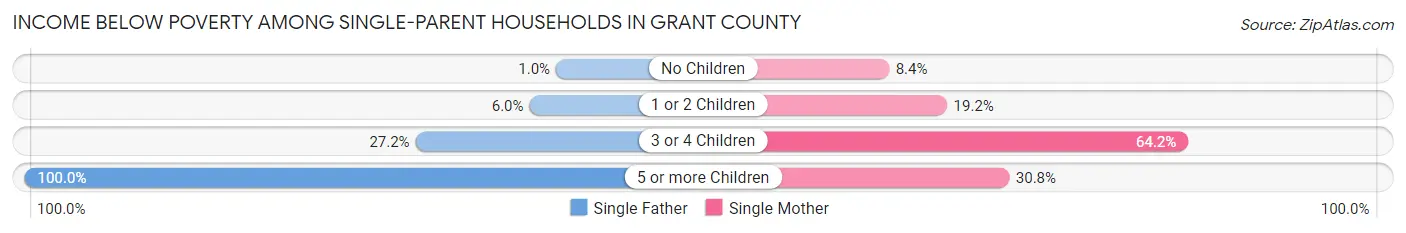
| Children | Single Father | Single Mother |
| No Children | 10 (1.0%) | 82 (8.4%) |
| 1 or 2 Children | 60 (6.0%) | 465 (19.2%) |
| 3 or 4 Children | 102 (27.2%) | 666 (64.2%) |
| 5 or more Children | 83 (100.0%) | 16 (30.8%) |
| Total | 255 (10.5%) | 1,229 (27.4%) |
Income Below Poverty Among Married-Couple vs Single-Parent Households in Grant County
The poverty data for Grant County shows that 1,068 of the married-couple family households (6.4%) and 1,484 of the single-parent households (21.4%) are living below the poverty level. Within the married-couple family households, those with 5 or more children have the highest poverty rate, with 97 households (18.7%) falling below the poverty line. Among the single-parent households, those with 5 or more children have the highest poverty rate, with 99 household (73.3%) living below poverty.
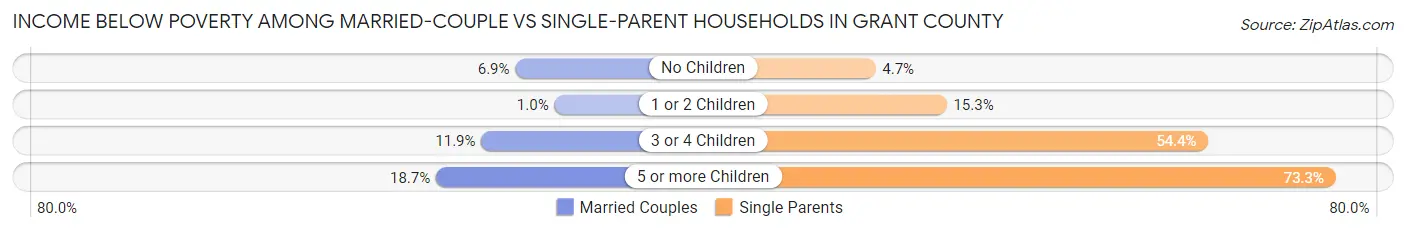
| Children | Married-Couple Families | Single-Parent Households |
| No Children | 613 (6.9%) | 92 (4.7%) |
| 1 or 2 Children | 47 (1.0%) | 525 (15.3%) |
| 3 or 4 Children | 311 (11.9%) | 768 (54.3%) |
| 5 or more Children | 97 (18.7%) | 99 (73.3%) |
| Total | 1,068 (6.4%) | 1,484 (21.4%) |
Employment Characteristics in Grant County
Employment by Class of Employer in Grant County
Among the 42,635 employed individuals in Grant County, private company employees (27,328 | 64.1%), local government employees (5,300 | 12.4%), and self-employed (not incorporated) (2,573 | 6.0%) make up the most common classes of employment.
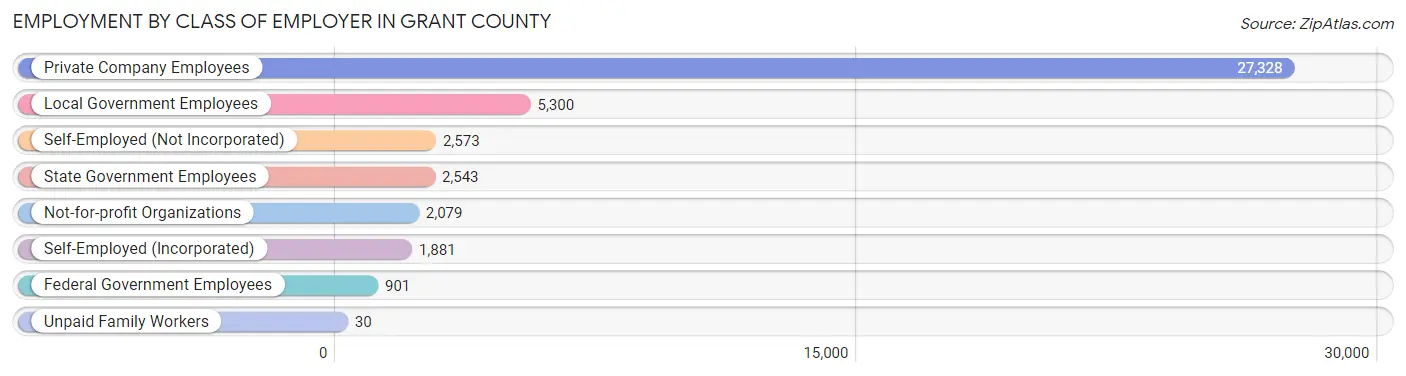
| Employer Class | # Employees | % Employees |
| Private Company Employees | 27,328 | 64.1% |
| Self-Employed (Incorporated) | 1,881 | 4.4% |
| Self-Employed (Not Incorporated) | 2,573 | 6.0% |
| Not-for-profit Organizations | 2,079 | 4.9% |
| Local Government Employees | 5,300 | 12.4% |
| State Government Employees | 2,543 | 6.0% |
| Federal Government Employees | 901 | 2.1% |
| Unpaid Family Workers | 30 | 0.1% |
| Total | 42,635 | 100.0% |
Employment Status by Age in Grant County
According to the labor force statistics for Grant County, out of the total population over 16 years of age (73,772), 62.3% or 45,960 individuals are in the labor force, with 5.4% or 2,482 of them unemployed. The age group with the highest labor force participation rate is 25 to 29 years, with 82.3% or 5,683 individuals in the labor force. Within the labor force, the 16 to 19 years age range has the highest percentage of unemployed individuals, with 12.0% or 320 of them being unemployed.
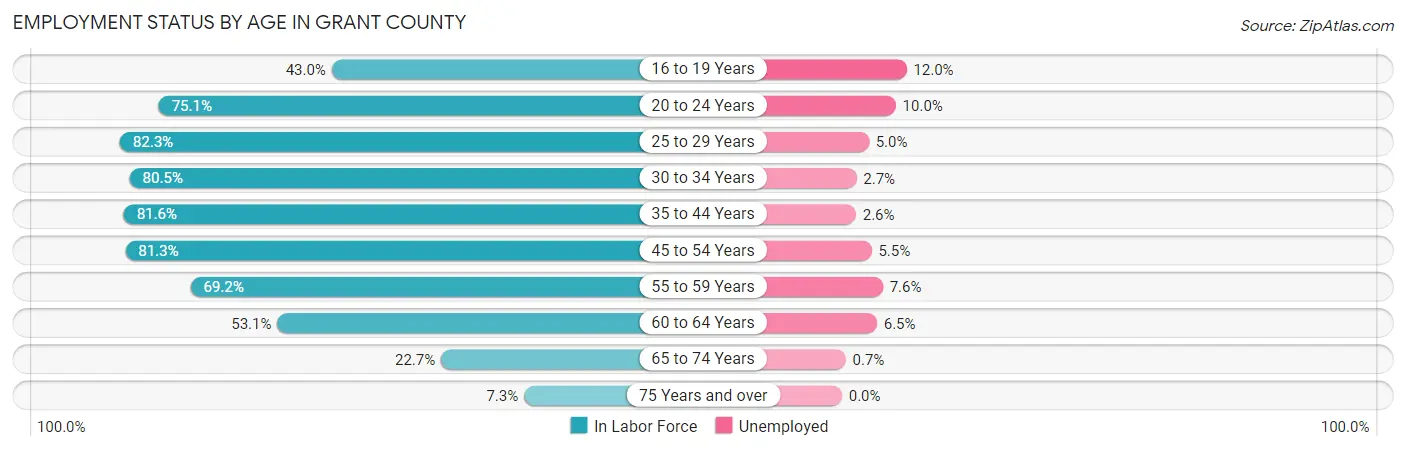
| Age Bracket | In Labor Force | Unemployed |
| 16 to 19 Years | 2,669 (43.0%) | 320 (12.0%) |
| 20 to 24 Years | 5,139 (75.1%) | 514 (10.0%) |
| 25 to 29 Years | 5,683 (82.3%) | 284 (5.0%) |
| 30 to 34 Years | 5,345 (80.5%) | 144 (2.7%) |
| 35 to 44 Years | 9,538 (81.6%) | 248 (2.6%) |
| 45 to 54 Years | 8,688 (81.3%) | 478 (5.5%) |
| 55 to 59 Years | 3,597 (69.2%) | 273 (7.6%) |
| 60 to 64 Years | 2,952 (53.1%) | 192 (6.5%) |
| 65 to 74 Years | 1,922 (22.7%) | 13 (0.7%) |
| 75 Years and over | 407 (7.3%) | 0 (0.0%) |
| Total | 45,960 (62.3%) | 2,482 (5.4%) |
Employment Status by Educational Attainment in Grant County
According to labor force statistics for Grant County, 76.7% of individuals (35,802) out of the total population between 25 and 64 years of age (46,678) are in the labor force, with 4.5% or 1,611 of them being unemployed. The group with the highest labor force participation rate are those with the educational attainment of bachelor's degree or higher, with 85.4% or 7,203 individuals in the labor force. Within the labor force, individuals with bachelor's degree or higher education have the highest percentage of unemployment, with 7.1% or 511 of them being unemployed.
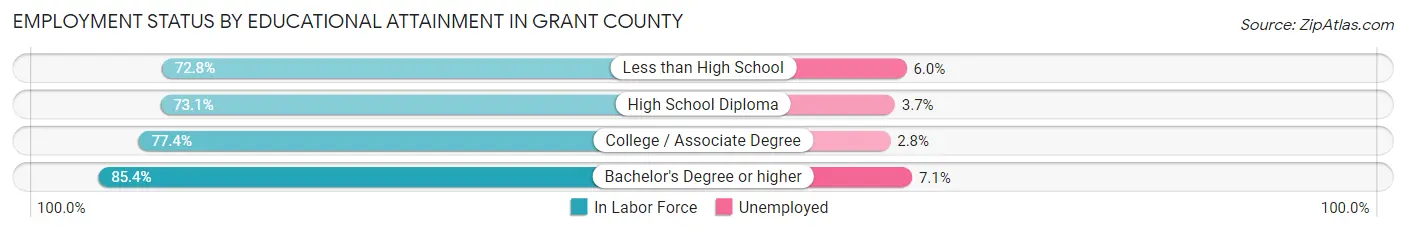
| Educational Attainment | In Labor Force | Unemployed |
| Less than High School | 7,042 (72.8%) | 580 (6.0%) |
| High School Diploma | 9,562 (73.1%) | 484 (3.7%) |
| College / Associate Degree | 11,989 (77.4%) | 434 (2.8%) |
| Bachelor's Degree or higher | 7,203 (85.4%) | 599 (7.1%) |
| Total | 35,802 (76.7%) | 2,101 (4.5%) |
Employment Occupations by Sex in Grant County
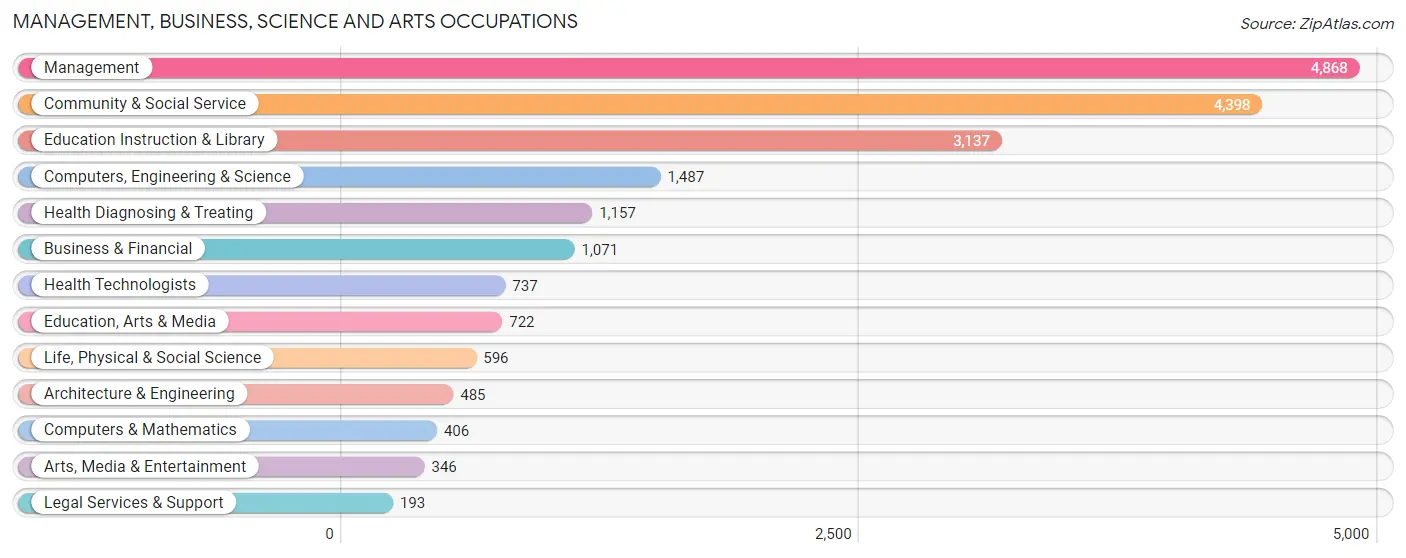
Management, Business, Science and Arts Occupations
The most common Management, Business, Science and Arts occupations in Grant County are Management (4,868 | 11.2%), Community & Social Service (4,398 | 10.1%), Education Instruction & Library (3,137 | 7.2%), Computers, Engineering & Science (1,487 | 3.4%), and Health Diagnosing & Treating (1,157 | 2.7%).
Management, Business, Science and Arts Occupations by Sex
Within the Management, Business, Science and Arts occupations in Grant County, the most male-oriented occupations are Computers & Mathematics (79.8%), Legal Services & Support (72.5%), and Management (67.6%), while the most female-oriented occupations are Arts, Media & Entertainment (93.6%), Health Technologists (79.2%), and Education Instruction & Library (79.0%).
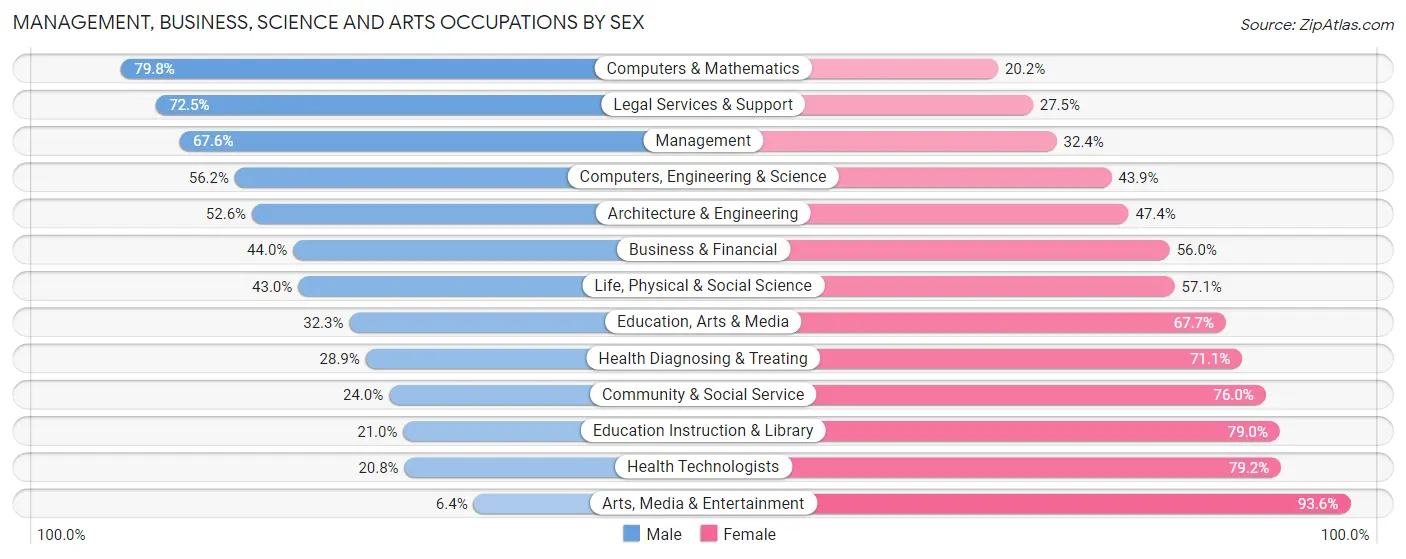
| Occupation | Male | Female |
| Management | 3,290 (67.6%) | 1,578 (32.4%) |
| Business & Financial | 471 (44.0%) | 600 (56.0%) |
| Computers, Engineering & Science | 835 (56.1%) | 652 (43.9%) |
| Computers & Mathematics | 324 (79.8%) | 82 (20.2%) |
| Architecture & Engineering | 255 (52.6%) | 230 (47.4%) |
| Life, Physical & Social Science | 256 (42.9%) | 340 (57.1%) |
| Community & Social Service | 1,054 (24.0%) | 3,344 (76.0%) |
| Education, Arts & Media | 233 (32.3%) | 489 (67.7%) |
| Legal Services & Support | 140 (72.5%) | 53 (27.5%) |
| Education Instruction & Library | 659 (21.0%) | 2,478 (79.0%) |
| Arts, Media & Entertainment | 22 (6.4%) | 324 (93.6%) |
| Health Diagnosing & Treating | 334 (28.9%) | 823 (71.1%) |
| Health Technologists | 153 (20.8%) | 584 (79.2%) |
| Total (Category) | 5,984 (46.1%) | 6,997 (53.9%) |
| Total (Overall) | 24,289 (55.9%) | 19,172 (44.1%) |
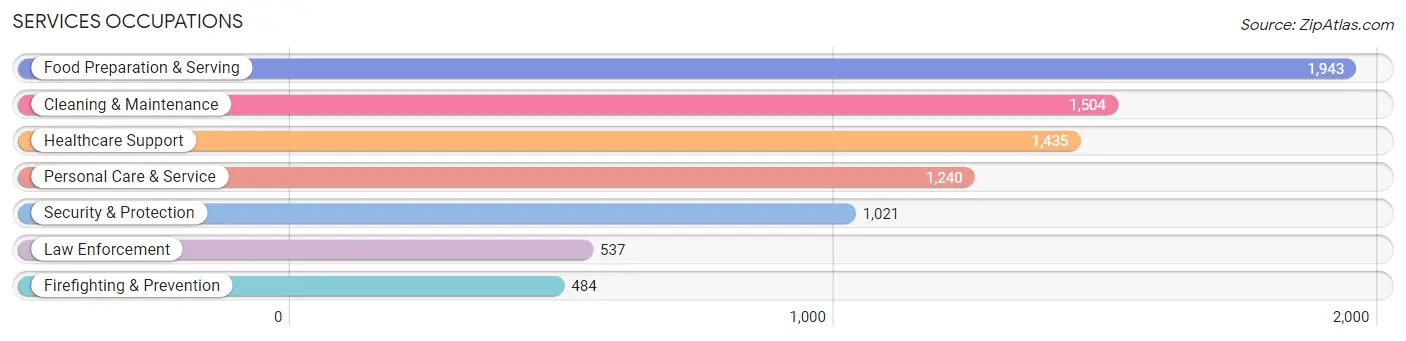
Services Occupations
The most common Services occupations in Grant County are Food Preparation & Serving (1,943 | 4.5%), Cleaning & Maintenance (1,504 | 3.5%), Healthcare Support (1,435 | 3.3%), Personal Care & Service (1,240 | 2.9%), and Security & Protection (1,021 | 2.4%).
Services Occupations by Sex
Within the Services occupations in Grant County, the most male-oriented occupations are Law Enforcement (88.4%), Security & Protection (87.9%), and Firefighting & Prevention (87.4%), while the most female-oriented occupations are Healthcare Support (97.7%), Personal Care & Service (81.5%), and Food Preparation & Serving (69.7%).
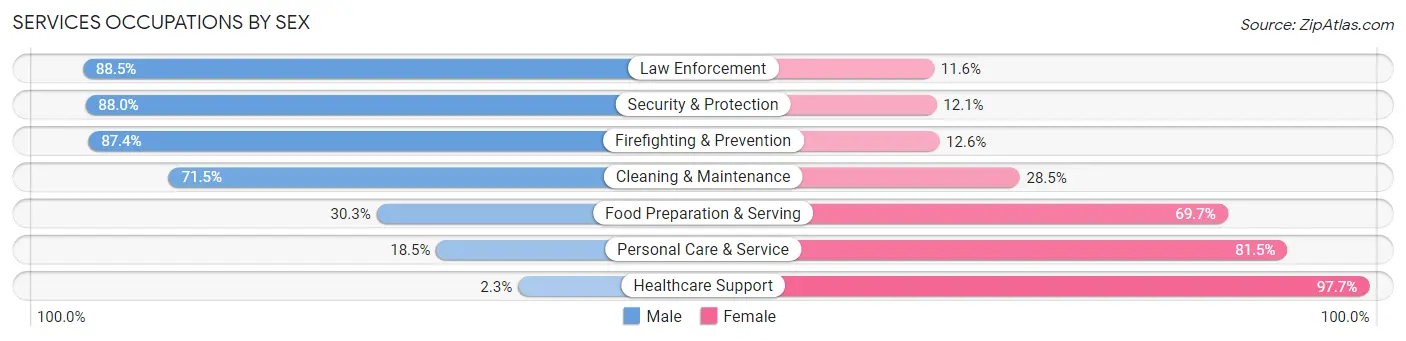
| Occupation | Male | Female |
| Healthcare Support | 33 (2.3%) | 1,402 (97.7%) |
| Security & Protection | 898 (87.9%) | 123 (12.0%) |
| Firefighting & Prevention | 423 (87.4%) | 61 (12.6%) |
| Law Enforcement | 475 (88.4%) | 62 (11.6%) |
| Food Preparation & Serving | 589 (30.3%) | 1,354 (69.7%) |
| Cleaning & Maintenance | 1,075 (71.5%) | 429 (28.5%) |
| Personal Care & Service | 229 (18.5%) | 1,011 (81.5%) |
| Total (Category) | 2,824 (39.5%) | 4,319 (60.5%) |
| Total (Overall) | 24,289 (55.9%) | 19,172 (44.1%) |
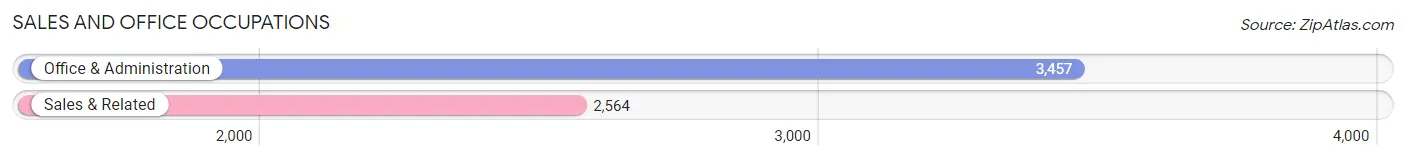
Sales and Office Occupations
The most common Sales and Office occupations in Grant County are Office & Administration (3,457 | 8.0%), and Sales & Related (2,564 | 5.9%).
Sales and Office Occupations by Sex
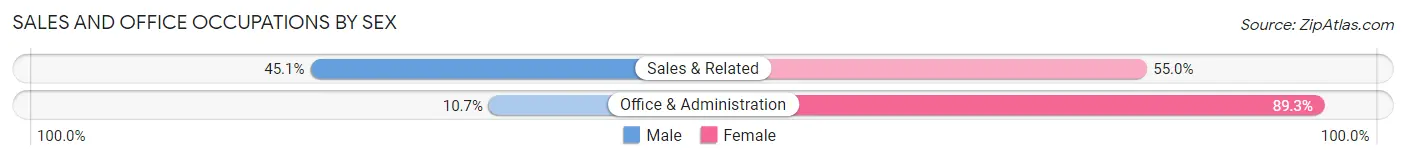
| Occupation | Male | Female |
| Sales & Related | 1,155 (45.1%) | 1,409 (54.9%) |
| Office & Administration | 371 (10.7%) | 3,086 (89.3%) |
| Total (Category) | 1,526 (25.3%) | 4,495 (74.7%) |
| Total (Overall) | 24,289 (55.9%) | 19,172 (44.1%) |
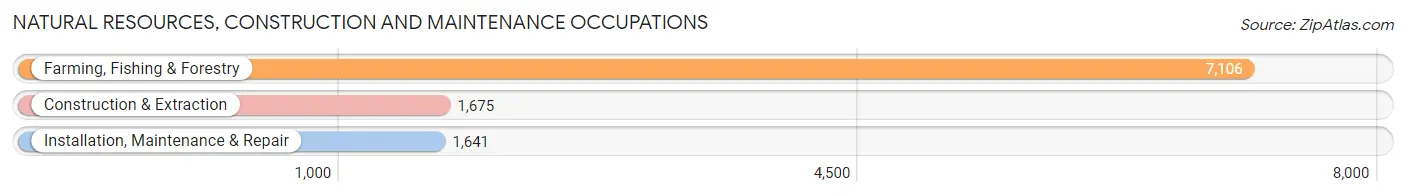
Natural Resources, Construction and Maintenance Occupations
The most common Natural Resources, Construction and Maintenance occupations in Grant County are Farming, Fishing & Forestry (7,106 | 16.4%), Construction & Extraction (1,675 | 3.8%), and Installation, Maintenance & Repair (1,641 | 3.8%).
Natural Resources, Construction and Maintenance Occupations by Sex
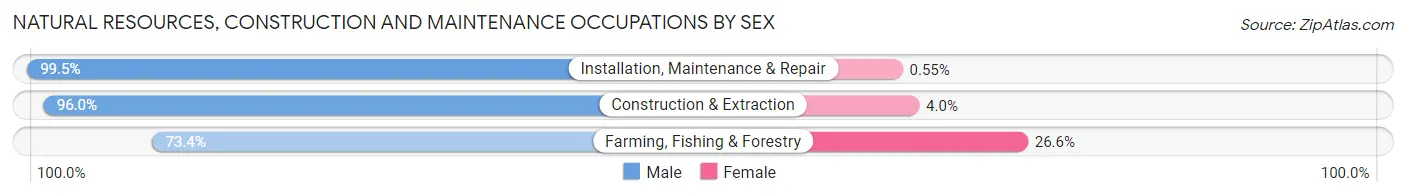
| Occupation | Male | Female |
| Farming, Fishing & Forestry | 5,215 (73.4%) | 1,891 (26.6%) |
| Construction & Extraction | 1,608 (96.0%) | 67 (4.0%) |
| Installation, Maintenance & Repair | 1,632 (99.5%) | 9 (0.5%) |
| Total (Category) | 8,455 (81.1%) | 1,967 (18.9%) |
| Total (Overall) | 24,289 (55.9%) | 19,172 (44.1%) |
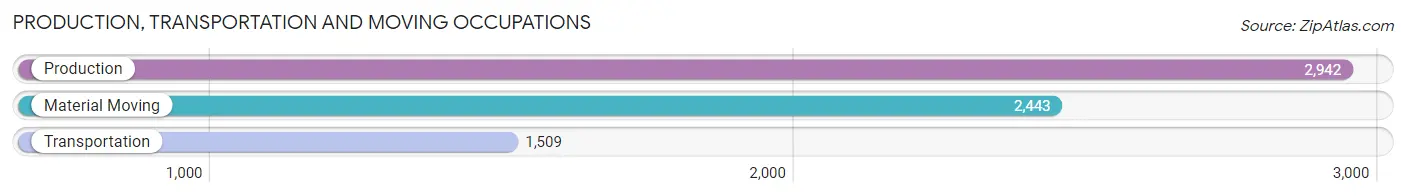
Production, Transportation and Moving Occupations
The most common Production, Transportation and Moving occupations in Grant County are Production (2,942 | 6.8%), Material Moving (2,443 | 5.6%), and Transportation (1,509 | 3.5%).
Production, Transportation and Moving Occupations by Sex
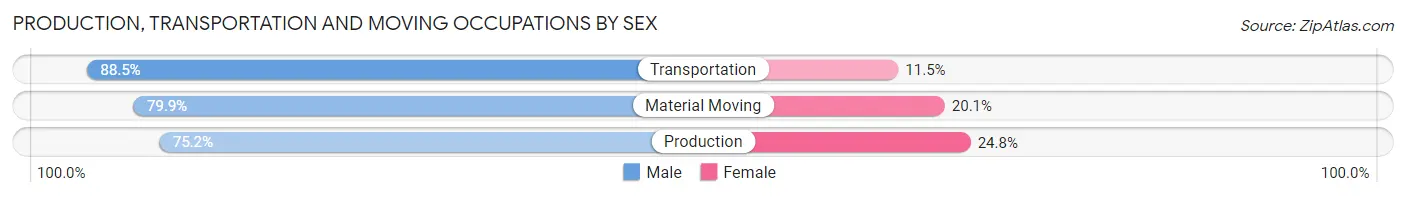
| Occupation | Male | Female |
| Production | 2,212 (75.2%) | 730 (24.8%) |
| Transportation | 1,335 (88.5%) | 174 (11.5%) |
| Material Moving | 1,953 (79.9%) | 490 (20.1%) |
| Total (Category) | 5,500 (79.8%) | 1,394 (20.2%) |
| Total (Overall) | 24,289 (55.9%) | 19,172 (44.1%) |
Employment Industries by Sex in Grant County
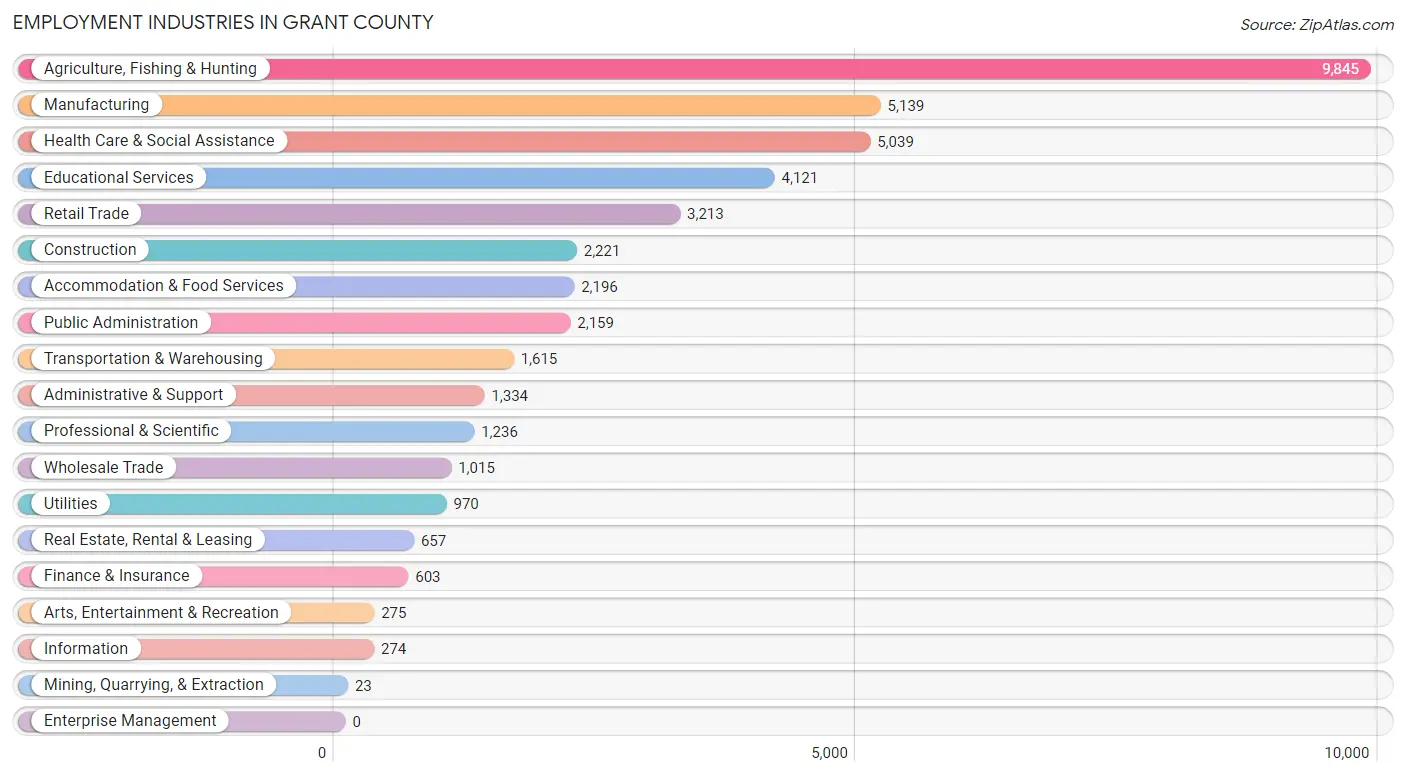
Employment Industries in Grant County
The major employment industries in Grant County include Agriculture, Fishing & Hunting (9,845 | 22.7%), Manufacturing (5,139 | 11.8%), Health Care & Social Assistance (5,039 | 11.6%), Educational Services (4,121 | 9.5%), and Retail Trade (3,213 | 7.4%).
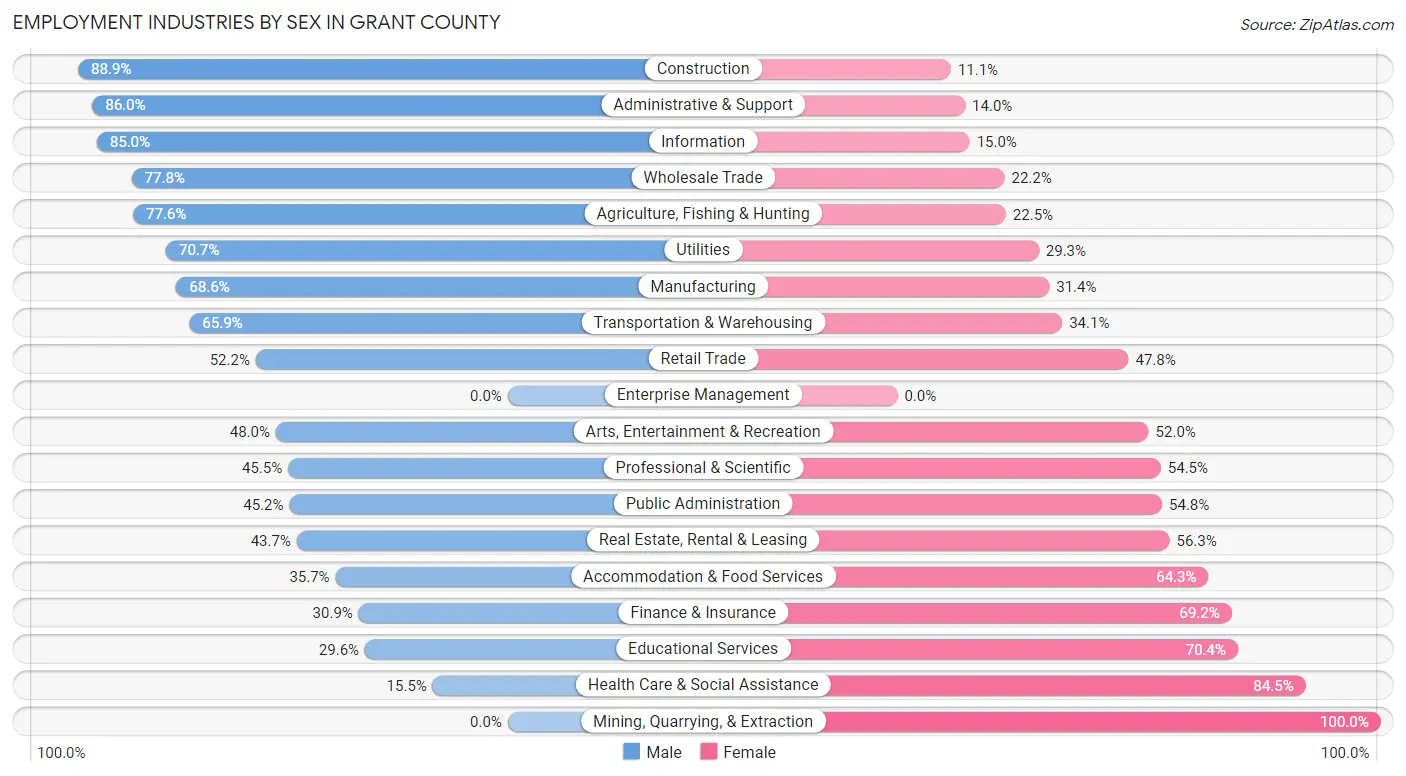
Employment Industries by Sex in Grant County
The Grant County industries that see more men than women are Construction (88.9%), Administrative & Support (86.0%), and Information (85.0%), whereas the industries that tend to have a higher number of women are Mining, Quarrying, & Extraction (100.0%), Health Care & Social Assistance (84.5%), and Educational Services (70.4%).
| Industry | Male | Female |
| Agriculture, Fishing & Hunting | 7,635 (77.5%) | 2,210 (22.5%) |
| Mining, Quarrying, & Extraction | 0 (0.0%) | 23 (100.0%) |
| Construction | 1,975 (88.9%) | 246 (11.1%) |
| Manufacturing | 3,524 (68.6%) | 1,615 (31.4%) |
| Wholesale Trade | 790 (77.8%) | 225 (22.2%) |
| Retail Trade | 1,676 (52.2%) | 1,537 (47.8%) |
| Transportation & Warehousing | 1,064 (65.9%) | 551 (34.1%) |
| Utilities | 686 (70.7%) | 284 (29.3%) |
| Information | 233 (85.0%) | 41 (15.0%) |
| Finance & Insurance | 186 (30.8%) | 417 (69.2%) |
| Real Estate, Rental & Leasing | 287 (43.7%) | 370 (56.3%) |
| Professional & Scientific | 562 (45.5%) | 674 (54.5%) |
| Enterprise Management | 0 (0.0%) | 0 (0.0%) |
| Administrative & Support | 1,147 (86.0%) | 187 (14.0%) |
| Educational Services | 1,218 (29.6%) | 2,903 (70.4%) |
| Health Care & Social Assistance | 783 (15.5%) | 4,256 (84.5%) |
| Arts, Entertainment & Recreation | 132 (48.0%) | 143 (52.0%) |
| Accommodation & Food Services | 783 (35.7%) | 1,413 (64.3%) |
| Public Administration | 976 (45.2%) | 1,183 (54.8%) |
| Total | 24,289 (55.9%) | 19,172 (44.1%) |
Education in Grant County
School Enrollment in Grant County
The most common levels of schooling among the 26,658 students in Grant County are elementary school (6,691 | 25.1%), high school (6,442 | 24.2%), and middle school (6,435 | 24.1%).
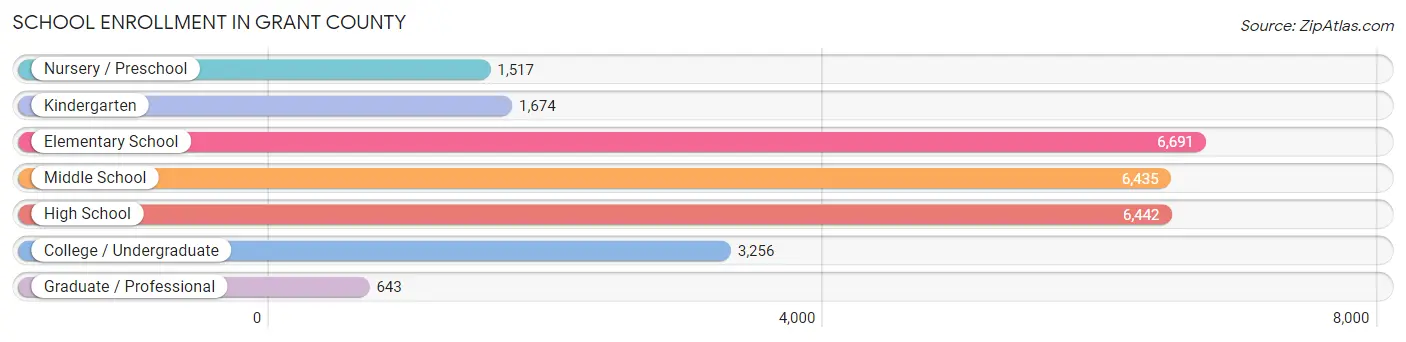
| School Level | # Students | % Students |
| Nursery / Preschool | 1,517 | 5.7% |
| Kindergarten | 1,674 | 6.3% |
| Elementary School | 6,691 | 25.1% |
| Middle School | 6,435 | 24.1% |
| High School | 6,442 | 24.2% |
| College / Undergraduate | 3,256 | 12.2% |
| Graduate / Professional | 643 | 2.4% |
| Total | 26,658 | 100.0% |
School Enrollment by Age by Funding Source in Grant County
Out of a total of 26,658 students who are enrolled in schools in Grant County, 2,133 (8.0%) attend a private institution, while the remaining 24,525 (92.0%) are enrolled in public schools. The age group of 25 to 34 year olds has the highest likelihood of being enrolled in private schools, with 264 (29.7% in the age bracket) enrolled. Conversely, the age group of 18 to 19 year olds has the lowest likelihood of being enrolled in a private school, with 1,602 (96.7% in the age bracket) attending a public institution.
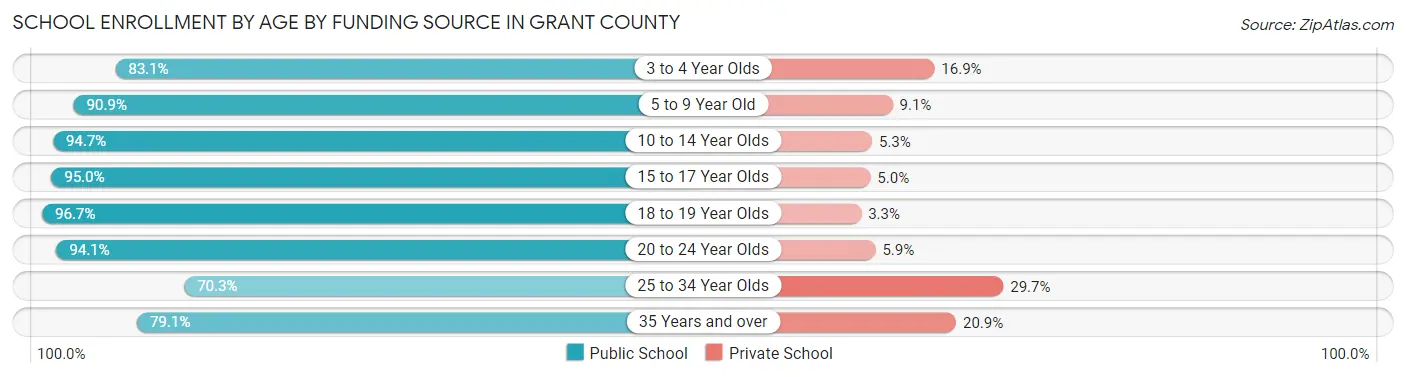
| Age Bracket | Public School | Private School |
| 3 to 4 Year Olds | 1,018 (83.1%) | 207 (16.9%) |
| 5 to 9 Year Old | 7,036 (90.9%) | 705 (9.1%) |
| 10 to 14 Year Olds | 7,667 (94.7%) | 427 (5.3%) |
| 15 to 17 Year Olds | 4,614 (95.0%) | 242 (5.0%) |
| 18 to 19 Year Olds | 1,602 (96.7%) | 54 (3.3%) |
| 20 to 24 Year Olds | 1,430 (94.1%) | 90 (5.9%) |
| 25 to 34 Year Olds | 624 (70.3%) | 264 (29.7%) |
| 35 Years and over | 536 (79.1%) | 142 (20.9%) |
| Total | 24,525 (92.0%) | 2,133 (8.0%) |
Educational Attainment by Field of Study in Grant County
Education (2,569 | 22.1%), business (1,857 | 15.9%), arts & humanities (991 | 8.5%), social sciences (965 | 8.3%), and science & technology (965 | 8.3%) are the most common fields of study among 11,649 individuals in Grant County who have obtained a bachelor's degree or higher.
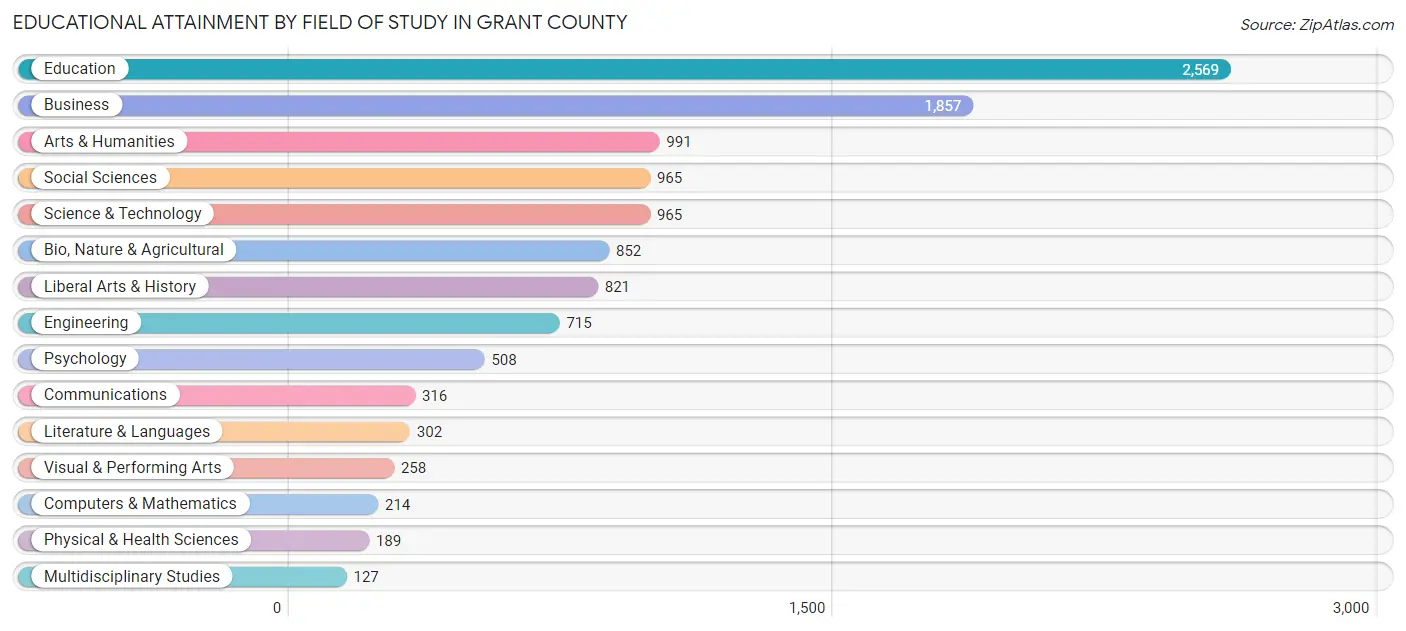
| Field of Study | # Graduates | % Graduates |
| Computers & Mathematics | 214 | 1.8% |
| Bio, Nature & Agricultural | 852 | 7.3% |
| Physical & Health Sciences | 189 | 1.6% |
| Psychology | 508 | 4.4% |
| Social Sciences | 965 | 8.3% |
| Engineering | 715 | 6.1% |
| Multidisciplinary Studies | 127 | 1.1% |
| Science & Technology | 965 | 8.3% |
| Business | 1,857 | 15.9% |
| Education | 2,569 | 22.1% |
| Literature & Languages | 302 | 2.6% |
| Liberal Arts & History | 821 | 7.0% |
| Visual & Performing Arts | 258 | 2.2% |
| Communications | 316 | 2.7% |
| Arts & Humanities | 991 | 8.5% |
| Total | 11,649 | 100.0% |
Transportation & Commute in Grant County
Vehicle Availability by Sex in Grant County
The most prevalent vehicle ownership categories in Grant County are males with 2 vehicles (8,910, accounting for 38.4%) and females with 2 vehicles (6,909, making up 48.0%).
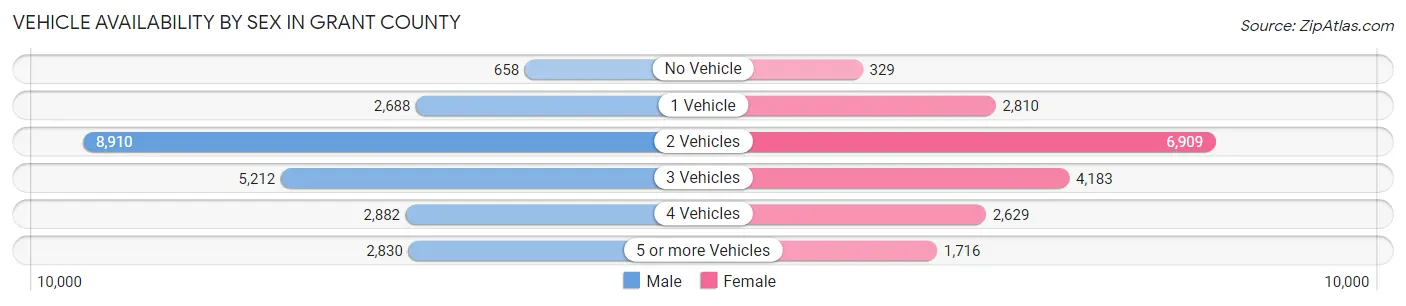
| Vehicles Available | Male | Female |
| No Vehicle | 658 (2.8%) | 329 (1.8%) |
| 1 Vehicle | 2,688 (11.6%) | 2,810 (15.1%) |
| 2 Vehicles | 8,910 (38.4%) | 6,909 (37.2%) |
| 3 Vehicles | 5,212 (22.5%) | 4,183 (22.5%) |
| 4 Vehicles | 2,882 (12.4%) | 2,629 (14.1%) |
| 5 or more Vehicles | 2,830 (12.2%) | 1,716 (9.2%) |
| Total | 23,180 (100.0%) | 18,576 (100.0%) |
Commute Time in Grant County
The most frequently occuring commute durations in Grant County are 5 to 9 minutes (7,177 commuters, 18.3%), 10 to 14 minutes (7,163 commuters, 18.3%), and 15 to 19 minutes (6,602 commuters, 16.9%).
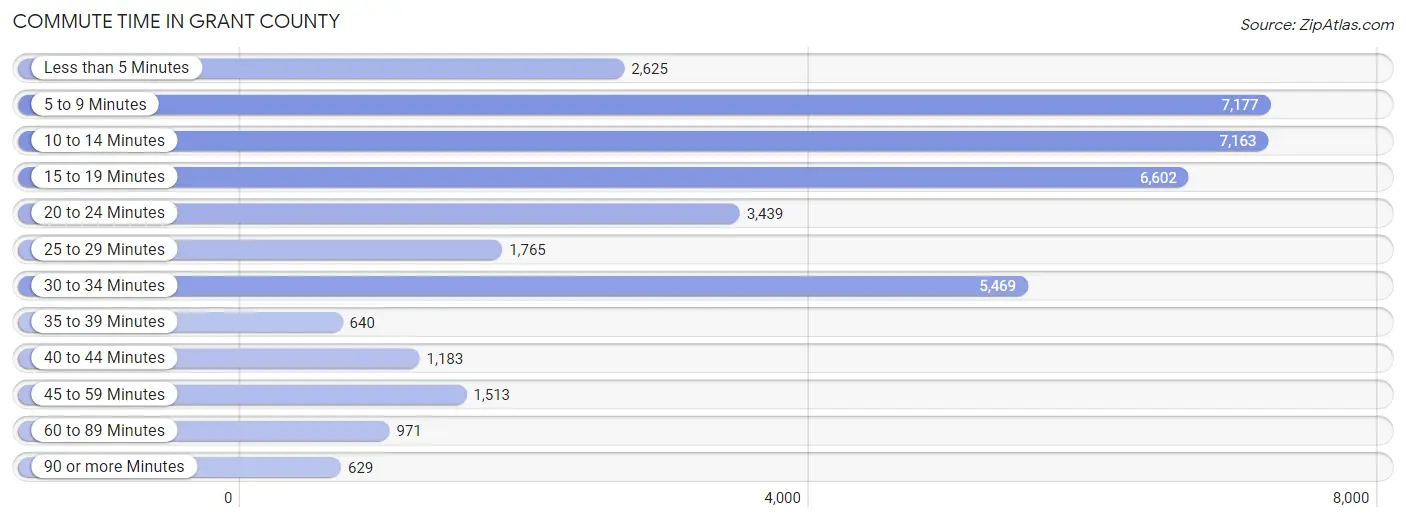
| Commute Time | # Commuters | % Commuters |
| Less than 5 Minutes | 2,625 | 6.7% |
| 5 to 9 Minutes | 7,177 | 18.3% |
| 10 to 14 Minutes | 7,163 | 18.3% |
| 15 to 19 Minutes | 6,602 | 16.9% |
| 20 to 24 Minutes | 3,439 | 8.8% |
| 25 to 29 Minutes | 1,765 | 4.5% |
| 30 to 34 Minutes | 5,469 | 14.0% |
| 35 to 39 Minutes | 640 | 1.6% |
| 40 to 44 Minutes | 1,183 | 3.0% |
| 45 to 59 Minutes | 1,513 | 3.9% |
| 60 to 89 Minutes | 971 | 2.5% |
| 90 or more Minutes | 629 | 1.6% |
Commute Time by Sex in Grant County
The most common commute times in Grant County are 15 to 19 minutes (4,028 commuters, 18.2%) for males and 5 to 9 minutes (3,569 commuters, 20.9%) for females.
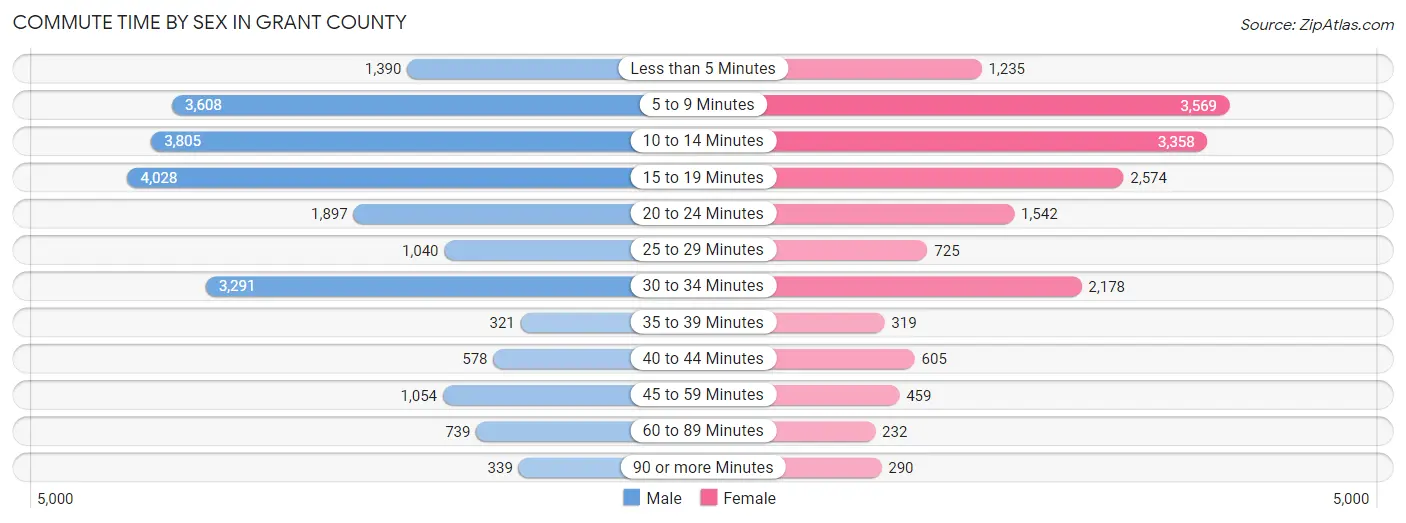
| Commute Time | Male | Female |
| Less than 5 Minutes | 1,390 (6.3%) | 1,235 (7.2%) |
| 5 to 9 Minutes | 3,608 (16.3%) | 3,569 (20.9%) |
| 10 to 14 Minutes | 3,805 (17.2%) | 3,358 (19.7%) |
| 15 to 19 Minutes | 4,028 (18.2%) | 2,574 (15.1%) |
| 20 to 24 Minutes | 1,897 (8.6%) | 1,542 (9.0%) |
| 25 to 29 Minutes | 1,040 (4.7%) | 725 (4.2%) |
| 30 to 34 Minutes | 3,291 (14.9%) | 2,178 (12.8%) |
| 35 to 39 Minutes | 321 (1.5%) | 319 (1.9%) |
| 40 to 44 Minutes | 578 (2.6%) | 605 (3.5%) |
| 45 to 59 Minutes | 1,054 (4.8%) | 459 (2.7%) |
| 60 to 89 Minutes | 739 (3.4%) | 232 (1.4%) |
| 90 or more Minutes | 339 (1.5%) | 290 (1.7%) |
Time of Departure to Work by Sex in Grant County
The most frequent times of departure to work in Grant County are 6:00 AM to 6:29 AM (3,324, 15.0%) for males and 7:30 AM to 7:59 AM (2,715, 15.9%) for females.
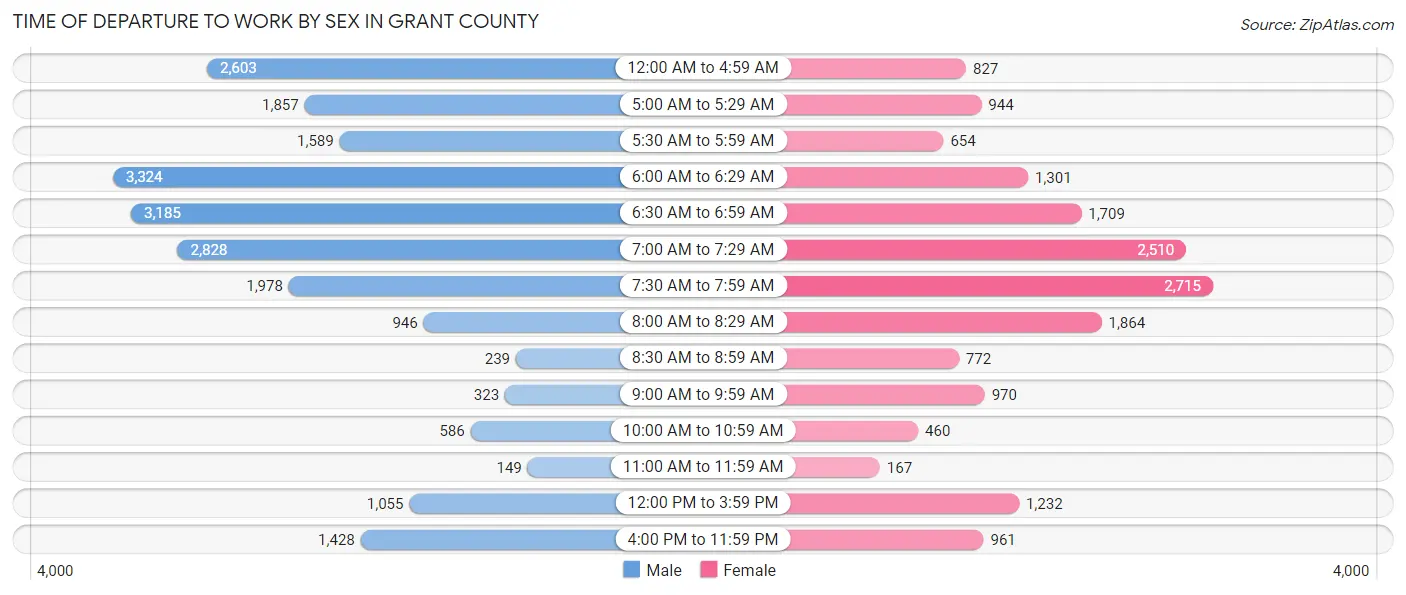
| Time of Departure | Male | Female |
| 12:00 AM to 4:59 AM | 2,603 (11.8%) | 827 (4.8%) |
| 5:00 AM to 5:29 AM | 1,857 (8.4%) | 944 (5.5%) |
| 5:30 AM to 5:59 AM | 1,589 (7.2%) | 654 (3.8%) |
| 6:00 AM to 6:29 AM | 3,324 (15.0%) | 1,301 (7.6%) |
| 6:30 AM to 6:59 AM | 3,185 (14.4%) | 1,709 (10.0%) |
| 7:00 AM to 7:29 AM | 2,828 (12.8%) | 2,510 (14.7%) |
| 7:30 AM to 7:59 AM | 1,978 (8.9%) | 2,715 (15.9%) |
| 8:00 AM to 8:29 AM | 946 (4.3%) | 1,864 (10.9%) |
| 8:30 AM to 8:59 AM | 239 (1.1%) | 772 (4.5%) |
| 9:00 AM to 9:59 AM | 323 (1.5%) | 970 (5.7%) |
| 10:00 AM to 10:59 AM | 586 (2.6%) | 460 (2.7%) |
| 11:00 AM to 11:59 AM | 149 (0.7%) | 167 (1.0%) |
| 12:00 PM to 3:59 PM | 1,055 (4.8%) | 1,232 (7.2%) |
| 4:00 PM to 11:59 PM | 1,428 (6.5%) | 961 (5.6%) |
| Total | 22,090 (100.0%) | 17,086 (100.0%) |
Housing Occupancy in Grant County
Occupancy by Ownership in Grant County
Of the total 33,666 dwellings in Grant County, owner-occupied units account for 21,805 (64.8%), while renter-occupied units make up 11,861 (35.2%).
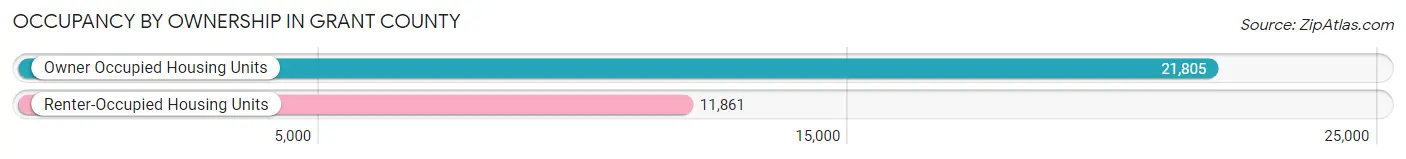
| Occupancy | # Housing Units | % Housing Units |
| Owner Occupied Housing Units | 21,805 | 64.8% |
| Renter-Occupied Housing Units | 11,861 | 35.2% |
| Total Occupied Housing Units | 33,666 | 100.0% |
Occupancy by Household Size in Grant County
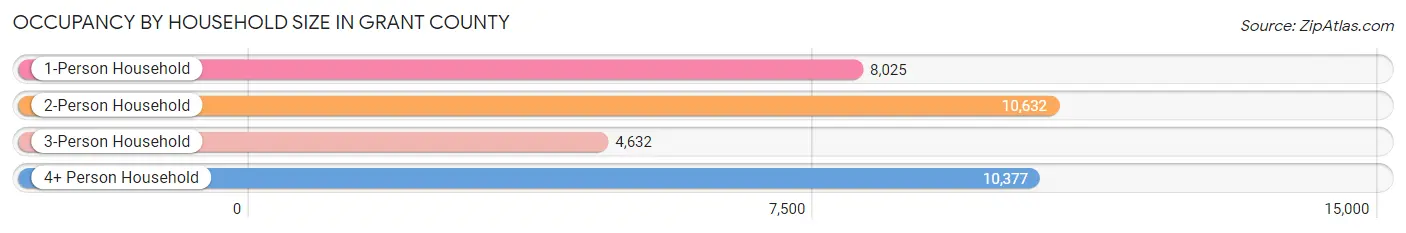
| Household Size | # Housing Units | % Housing Units |
| 1-Person Household | 8,025 | 23.8% |
| 2-Person Household | 10,632 | 31.6% |
| 3-Person Household | 4,632 | 13.8% |
| 4+ Person Household | 10,377 | 30.8% |
| Total Housing Units | 33,666 | 100.0% |
Occupancy by Ownership by Household Size in Grant County
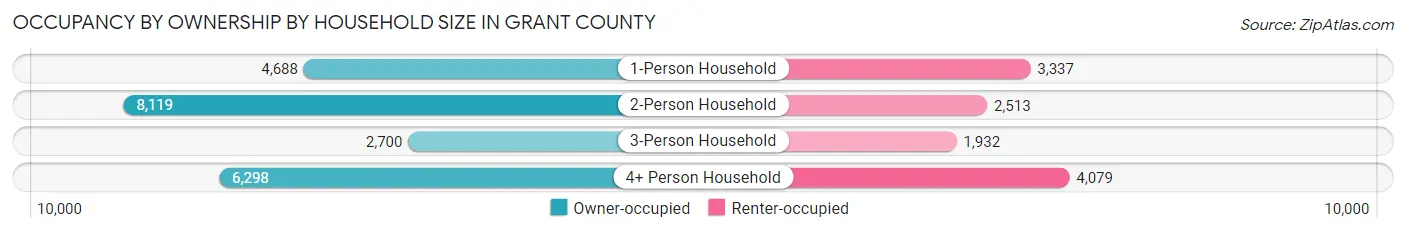
| Household Size | Owner-occupied | Renter-occupied |
| 1-Person Household | 4,688 (58.4%) | 3,337 (41.6%) |
| 2-Person Household | 8,119 (76.4%) | 2,513 (23.6%) |
| 3-Person Household | 2,700 (58.3%) | 1,932 (41.7%) |
| 4+ Person Household | 6,298 (60.7%) | 4,079 (39.3%) |
| Total Housing Units | 21,805 (64.8%) | 11,861 (35.2%) |
Occupancy by Educational Attainment in Grant County
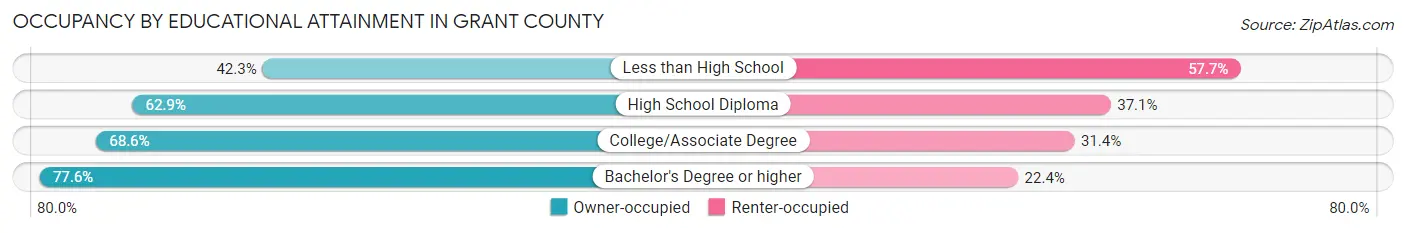
| Household Size | Owner-occupied | Renter-occupied |
| Less than High School | 2,144 (42.3%) | 2,928 (57.7%) |
| High School Diploma | 5,912 (62.9%) | 3,492 (37.1%) |
| College/Associate Degree | 8,699 (68.6%) | 3,980 (31.4%) |
| Bachelor's Degree or higher | 5,050 (77.6%) | 1,461 (22.4%) |
Occupancy by Age of Householder in Grant County
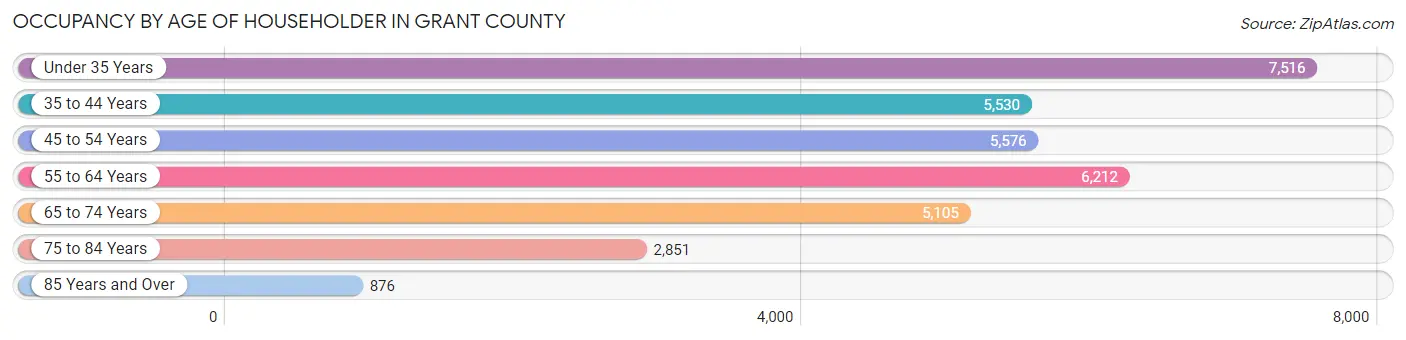
| Age Bracket | # Households | % Households |
| Under 35 Years | 7,516 | 22.3% |
| 35 to 44 Years | 5,530 | 16.4% |
| 45 to 54 Years | 5,576 | 16.6% |
| 55 to 64 Years | 6,212 | 18.4% |
| 65 to 74 Years | 5,105 | 15.2% |
| 75 to 84 Years | 2,851 | 8.5% |
| 85 Years and Over | 876 | 2.6% |
| Total | 33,666 | 100.0% |
Housing Finances in Grant County
Median Income by Occupancy in Grant County
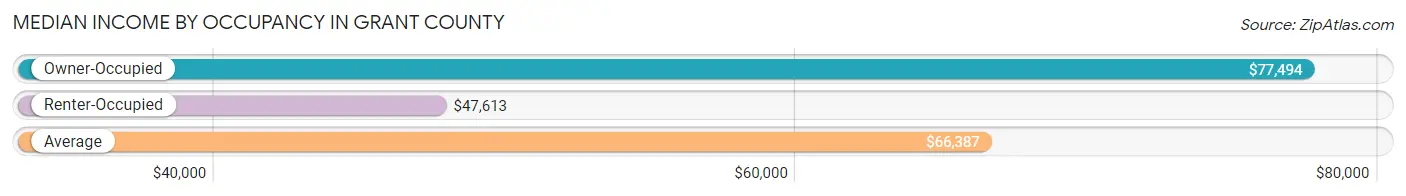
| Occupancy Type | # Households | Median Income |
| Owner-Occupied | 21,805 (64.8%) | $77,494 |
| Renter-Occupied | 11,861 (35.2%) | $47,613 |
| Average | 33,666 (100.0%) | $66,387 |
Occupancy by Householder Income Bracket in Grant County
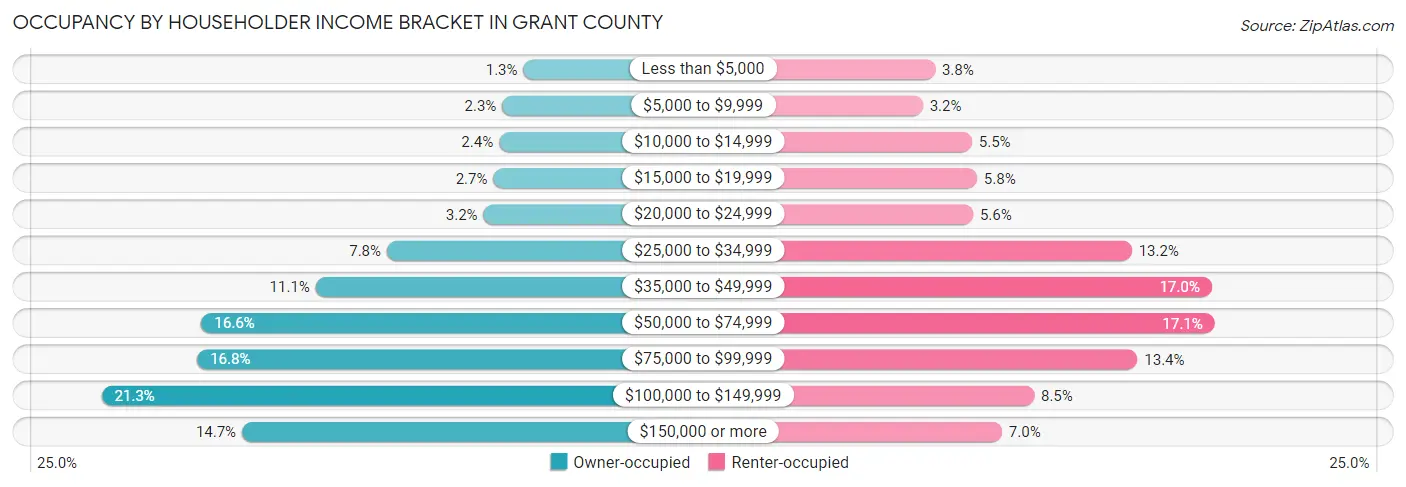
| Income Bracket | Owner-occupied | Renter-occupied |
| Less than $5,000 | 272 (1.3%) | 448 (3.8%) |
| $5,000 to $9,999 | 493 (2.3%) | 380 (3.2%) |
| $10,000 to $14,999 | 525 (2.4%) | 657 (5.5%) |
| $15,000 to $19,999 | 585 (2.7%) | 686 (5.8%) |
| $20,000 to $24,999 | 687 (3.2%) | 663 (5.6%) |
| $25,000 to $34,999 | 1,689 (7.7%) | 1,560 (13.2%) |
| $35,000 to $49,999 | 2,430 (11.1%) | 2,012 (17.0%) |
| $50,000 to $74,999 | 3,616 (16.6%) | 2,028 (17.1%) |
| $75,000 to $99,999 | 3,659 (16.8%) | 1,592 (13.4%) |
| $100,000 to $149,999 | 4,654 (21.3%) | 1,008 (8.5%) |
| $150,000 or more | 3,195 (14.6%) | 827 (7.0%) |
| Total | 21,805 (100.0%) | 11,861 (100.0%) |
Monthly Housing Cost Tiers in Grant County
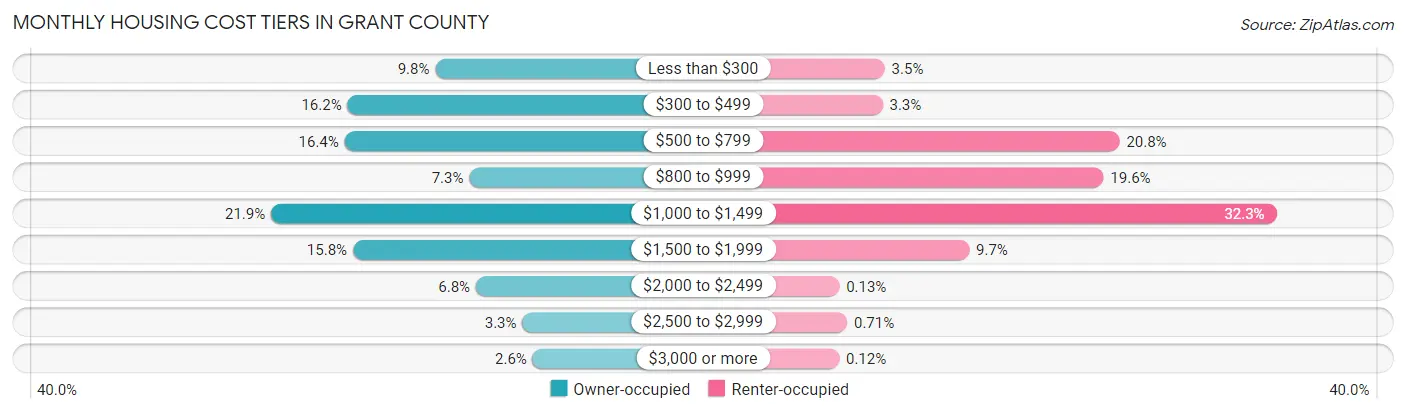
| Monthly Cost | Owner-occupied | Renter-occupied |
| Less than $300 | 2,125 (9.8%) | 413 (3.5%) |
| $300 to $499 | 3,537 (16.2%) | 394 (3.3%) |
| $500 to $799 | 3,582 (16.4%) | 2,463 (20.8%) |
| $800 to $999 | 1,581 (7.2%) | 2,323 (19.6%) |
| $1,000 to $1,499 | 4,764 (21.8%) | 3,835 (32.3%) |
| $1,500 to $1,999 | 3,450 (15.8%) | 1,150 (9.7%) |
| $2,000 to $2,499 | 1,475 (6.8%) | 15 (0.1%) |
| $2,500 to $2,999 | 729 (3.3%) | 84 (0.7%) |
| $3,000 or more | 562 (2.6%) | 14 (0.1%) |
| Total | 21,805 (100.0%) | 11,861 (100.0%) |
Physical Housing Characteristics in Grant County
Housing Structures in Grant County
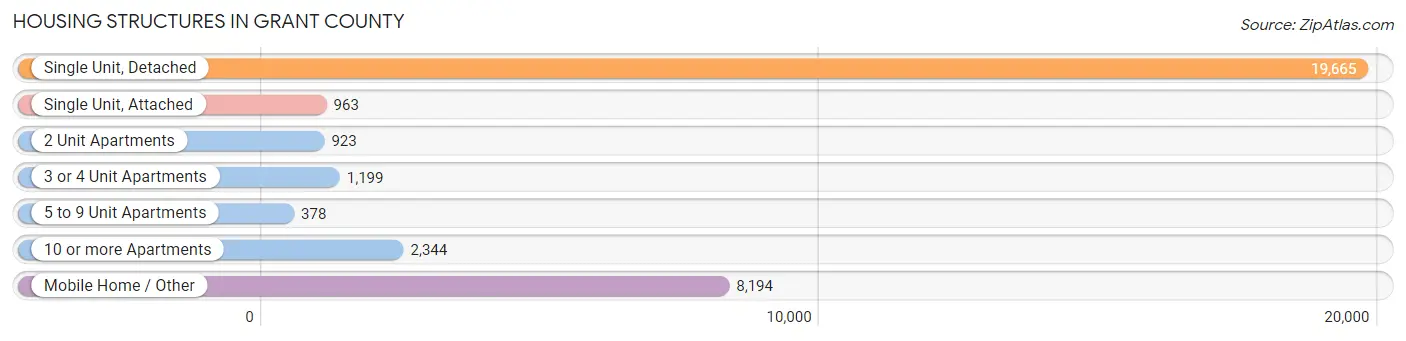
| Structure Type | # Housing Units | % Housing Units |
| Single Unit, Detached | 19,665 | 58.4% |
| Single Unit, Attached | 963 | 2.9% |
| 2 Unit Apartments | 923 | 2.7% |
| 3 or 4 Unit Apartments | 1,199 | 3.6% |
| 5 to 9 Unit Apartments | 378 | 1.1% |
| 10 or more Apartments | 2,344 | 7.0% |
| Mobile Home / Other | 8,194 | 24.3% |
| Total | 33,666 | 100.0% |
Housing Structures by Occupancy in Grant County
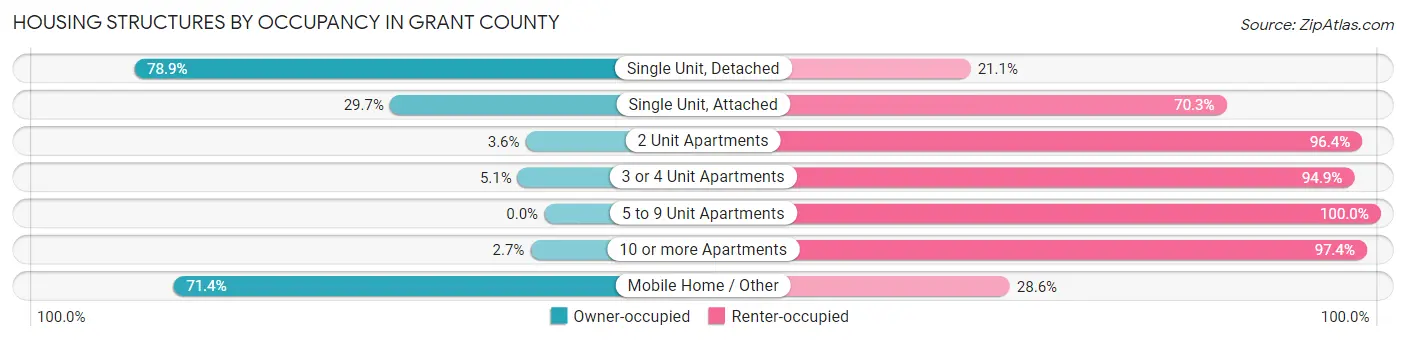
| Structure Type | Owner-occupied | Renter-occupied |
| Single Unit, Detached | 15,516 (78.9%) | 4,149 (21.1%) |
| Single Unit, Attached | 286 (29.7%) | 677 (70.3%) |
| 2 Unit Apartments | 33 (3.6%) | 890 (96.4%) |
| 3 or 4 Unit Apartments | 61 (5.1%) | 1,138 (94.9%) |
| 5 to 9 Unit Apartments | 0 (0.0%) | 378 (100.0%) |
| 10 or more Apartments | 62 (2.6%) | 2,282 (97.4%) |
| Mobile Home / Other | 5,847 (71.4%) | 2,347 (28.6%) |
| Total | 21,805 (64.8%) | 11,861 (35.2%) |
Housing Structures by Number of Rooms in Grant County
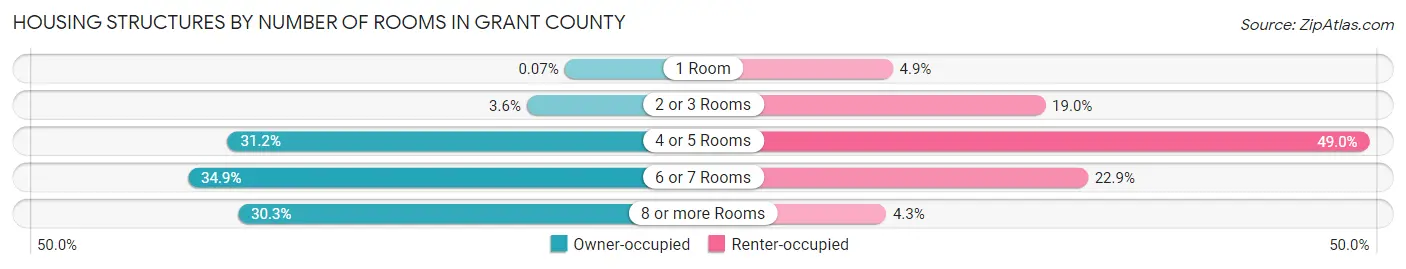
| Number of Rooms | Owner-occupied | Renter-occupied |
| 1 Room | 15 (0.1%) | 578 (4.9%) |
| 2 or 3 Rooms | 777 (3.6%) | 2,251 (19.0%) |
| 4 or 5 Rooms | 6,809 (31.2%) | 5,808 (49.0%) |
| 6 or 7 Rooms | 7,606 (34.9%) | 2,719 (22.9%) |
| 8 or more Rooms | 6,598 (30.3%) | 505 (4.3%) |
| Total | 21,805 (100.0%) | 11,861 (100.0%) |
Housing Structure by Heating Type in Grant County
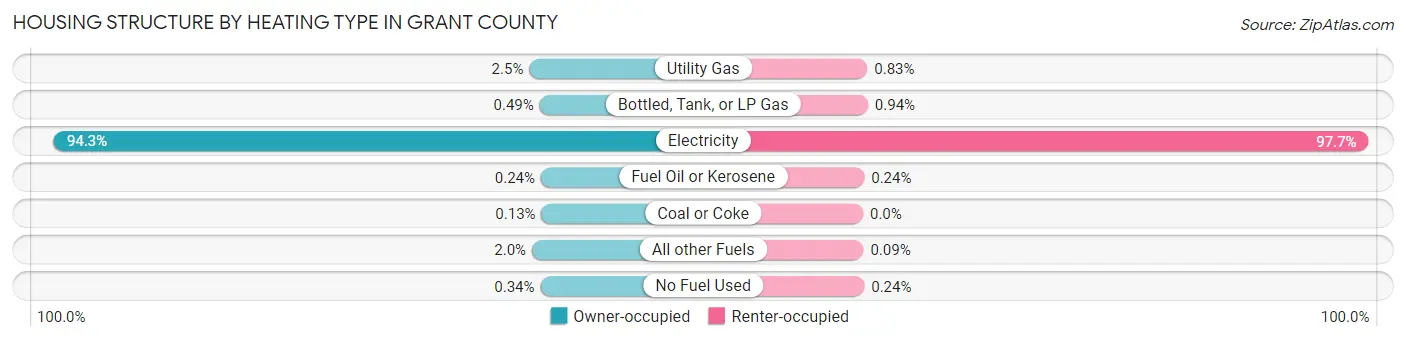
| Heating Type | Owner-occupied | Renter-occupied |
| Utility Gas | 544 (2.5%) | 99 (0.8%) |
| Bottled, Tank, or LP Gas | 107 (0.5%) | 112 (0.9%) |
| Electricity | 20,570 (94.3%) | 11,582 (97.7%) |
| Fuel Oil or Kerosene | 52 (0.2%) | 29 (0.2%) |
| Coal or Coke | 28 (0.1%) | 0 (0.0%) |
| All other Fuels | 429 (2.0%) | 11 (0.1%) |
| No Fuel Used | 75 (0.3%) | 28 (0.2%) |
| Total | 21,805 (100.0%) | 11,861 (100.0%) |
Household Vehicle Usage in Grant County
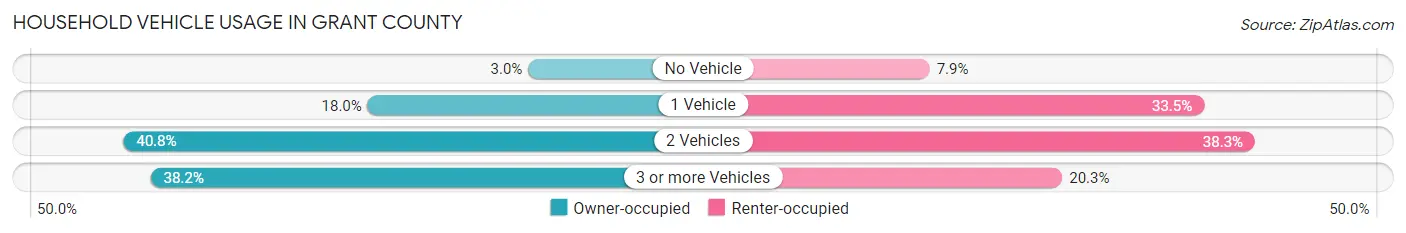
| Vehicles per Household | Owner-occupied | Renter-occupied |
| No Vehicle | 653 (3.0%) | 939 (7.9%) |
| 1 Vehicle | 3,920 (18.0%) | 3,976 (33.5%) |
| 2 Vehicles | 8,893 (40.8%) | 4,539 (38.3%) |
| 3 or more Vehicles | 8,339 (38.2%) | 2,407 (20.3%) |
| Total | 21,805 (100.0%) | 11,861 (100.0%) |
Real Estate & Mortgages in Grant County
Real Estate and Mortgage Overview in Grant County
| Characteristic | Without Mortgage | With Mortgage |
| Housing Units | 9,250 | 12,555 |
| Median Property Value | $196,600 | $268,700 |
| Median Household Income | $57,345 | $2,255 |
| Monthly Housing Costs | $447 | $562 |
| Real Estate Taxes | $1,658 | $849 |
Property Value by Mortgage Status in Grant County
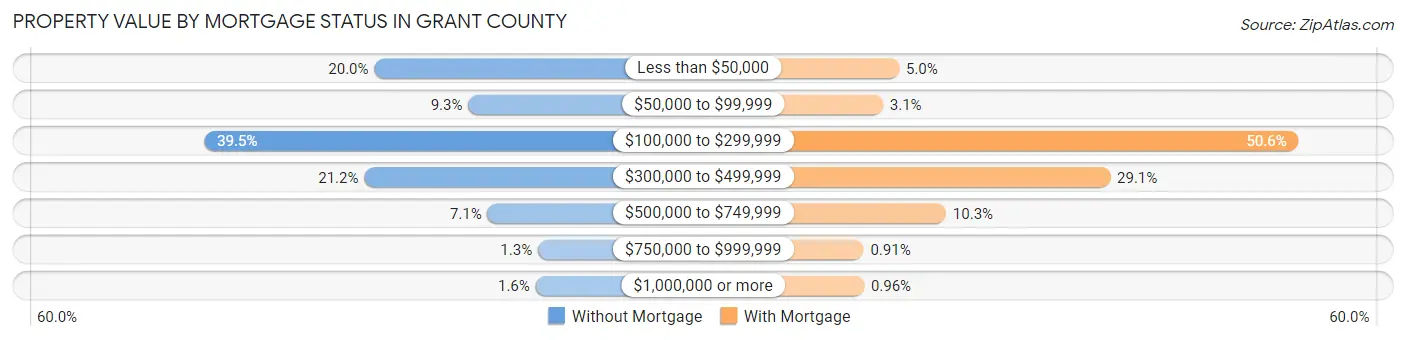
| Property Value | Without Mortgage | With Mortgage |
| Less than $50,000 | 1,853 (20.0%) | 624 (5.0%) |
| $50,000 to $99,999 | 859 (9.3%) | 392 (3.1%) |
| $100,000 to $299,999 | 3,652 (39.5%) | 6,356 (50.6%) |
| $300,000 to $499,999 | 1,959 (21.2%) | 3,652 (29.1%) |
| $500,000 to $749,999 | 656 (7.1%) | 1,297 (10.3%) |
| $750,000 to $999,999 | 123 (1.3%) | 114 (0.9%) |
| $1,000,000 or more | 148 (1.6%) | 120 (1.0%) |
| Total | 9,250 (100.0%) | 12,555 (100.0%) |
Household Income by Mortgage Status in Grant County
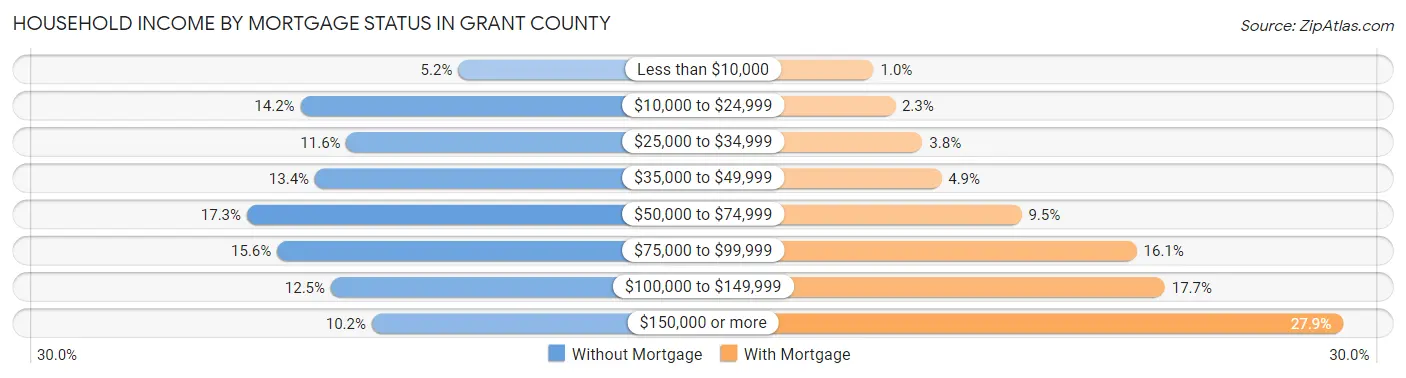
| Household Income | Without Mortgage | With Mortgage |
| Less than $10,000 | 483 (5.2%) | 129 (1.0%) |
| $10,000 to $24,999 | 1,317 (14.2%) | 282 (2.2%) |
| $25,000 to $34,999 | 1,074 (11.6%) | 480 (3.8%) |
| $35,000 to $49,999 | 1,240 (13.4%) | 615 (4.9%) |
| $50,000 to $74,999 | 1,600 (17.3%) | 1,190 (9.5%) |
| $75,000 to $99,999 | 1,440 (15.6%) | 2,016 (16.1%) |
| $100,000 to $149,999 | 1,156 (12.5%) | 2,219 (17.7%) |
| $150,000 or more | 940 (10.2%) | 3,498 (27.9%) |
| Total | 9,250 (100.0%) | 12,555 (100.0%) |
Property Value to Household Income Ratio in Grant County
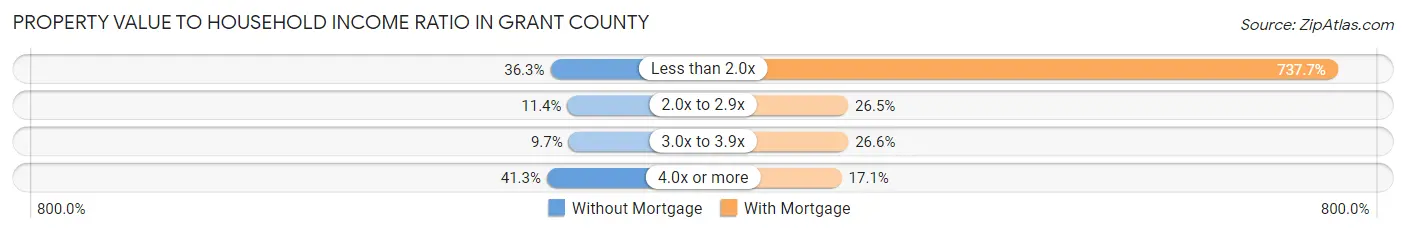
| Value-to-Income Ratio | Without Mortgage | With Mortgage |
| Less than 2.0x | 3,354 (36.3%) | 92,618 (737.7%) |
| 2.0x to 2.9x | 1,053 (11.4%) | 3,324 (26.5%) |
| 3.0x to 3.9x | 893 (9.7%) | 3,345 (26.6%) |
| 4.0x or more | 3,821 (41.3%) | 2,143 (17.1%) |
| Total | 9,250 (100.0%) | 12,555 (100.0%) |
Real Estate Taxes by Mortgage Status in Grant County
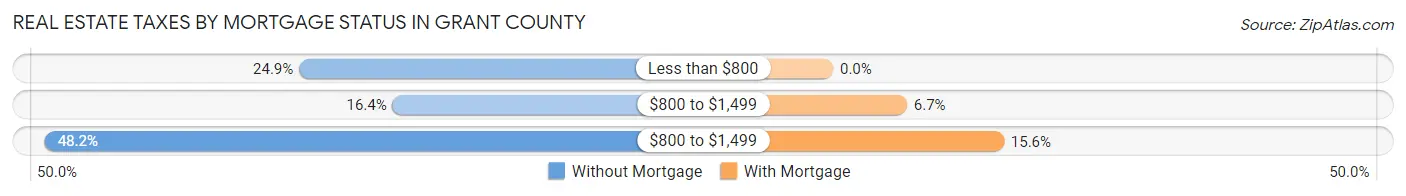
| Property Taxes | Without Mortgage | With Mortgage |
| Less than $800 | 2,306 (24.9%) | 0 (0.0%) |
| $800 to $1,499 | 1,517 (16.4%) | 846 (6.7%) |
| $800 to $1,499 | 4,455 (48.2%) | 1,959 (15.6%) |
| Total | 9,250 (100.0%) | 12,555 (100.0%) |
Health & Disability in Grant County
Health Insurance Coverage by Age in Grant County
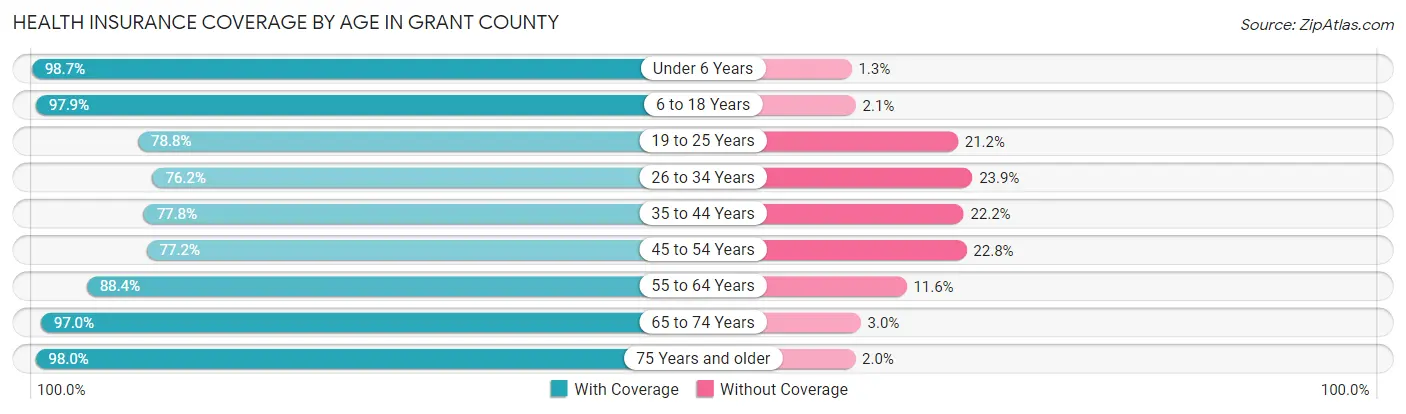
| Age Bracket | With Coverage | Without Coverage |
| Under 6 Years | 8,613 (98.7%) | 117 (1.3%) |
| 6 to 18 Years | 20,636 (97.9%) | 445 (2.1%) |
| 19 to 25 Years | 8,266 (78.8%) | 2,220 (21.2%) |
| 26 to 34 Years | 8,840 (76.1%) | 2,769 (23.8%) |
| 35 to 44 Years | 9,063 (77.8%) | 2,589 (22.2%) |
| 45 to 54 Years | 8,211 (77.2%) | 2,421 (22.8%) |
| 55 to 64 Years | 9,490 (88.4%) | 1,244 (11.6%) |
| 65 to 74 Years | 8,152 (97.0%) | 256 (3.0%) |
| 75 Years and older | 5,275 (98.0%) | 109 (2.0%) |
| Total | 86,546 (87.7%) | 12,170 (12.3%) |
Health Insurance Coverage by Citizenship Status in Grant County
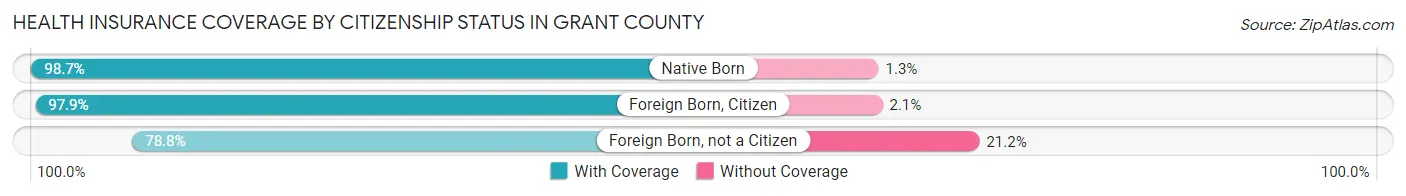
| Citizenship Status | With Coverage | Without Coverage |
| Native Born | 8,613 (98.7%) | 117 (1.3%) |
| Foreign Born, Citizen | 20,636 (97.9%) | 445 (2.1%) |
| Foreign Born, not a Citizen | 8,266 (78.8%) | 2,220 (21.2%) |
Health Insurance Coverage by Household Income in Grant County
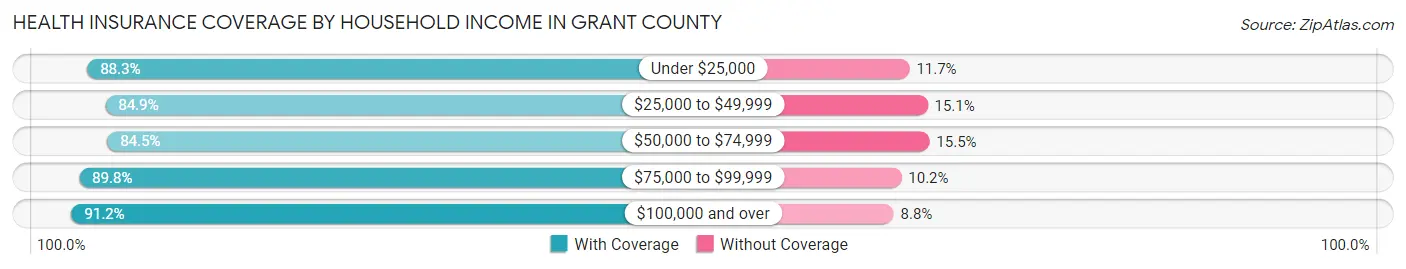
| Household Income | With Coverage | Without Coverage |
| Under $25,000 | 8,608 (88.3%) | 1,145 (11.7%) |
| $25,000 to $49,999 | 16,457 (84.9%) | 2,933 (15.1%) |
| $50,000 to $74,999 | 13,837 (84.5%) | 2,535 (15.5%) |
| $75,000 to $99,999 | 14,529 (89.8%) | 1,653 (10.2%) |
| $100,000 and over | 32,502 (91.2%) | 3,126 (8.8%) |
Public vs Private Health Insurance Coverage by Age in Grant County
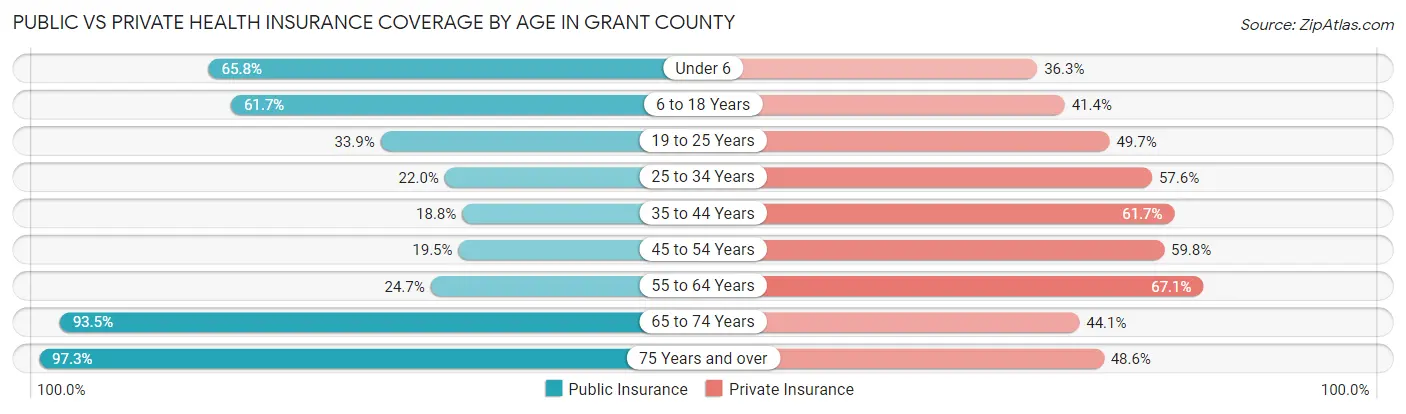
| Age Bracket | Public Insurance | Private Insurance |
| Under 6 | 5,747 (65.8%) | 3,167 (36.3%) |
| 6 to 18 Years | 13,005 (61.7%) | 8,724 (41.4%) |
| 19 to 25 Years | 3,559 (33.9%) | 5,210 (49.7%) |
| 25 to 34 Years | 2,557 (22.0%) | 6,685 (57.6%) |
| 35 to 44 Years | 2,189 (18.8%) | 7,192 (61.7%) |
| 45 to 54 Years | 2,072 (19.5%) | 6,359 (59.8%) |
| 55 to 64 Years | 2,646 (24.6%) | 7,203 (67.1%) |
| 65 to 74 Years | 7,859 (93.5%) | 3,706 (44.1%) |
| 75 Years and over | 5,238 (97.3%) | 2,617 (48.6%) |
| Total | 44,872 (45.5%) | 50,863 (51.5%) |
Disability Status by Sex by Age in Grant County
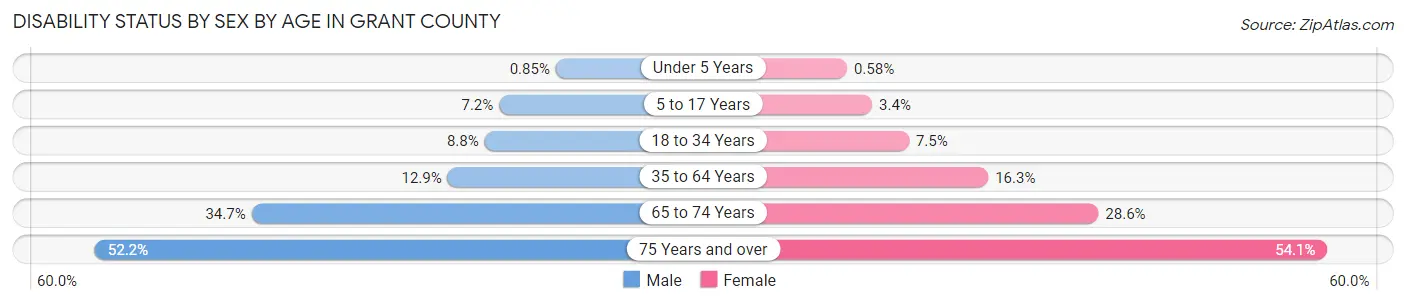
| Age Bracket | Male | Female |
| Under 5 Years | 31 (0.9%) | 21 (0.6%) |
| 5 to 17 Years | 778 (7.1%) | 354 (3.4%) |
| 18 to 34 Years | 1,074 (8.8%) | 826 (7.5%) |
| 35 to 64 Years | 2,201 (12.9%) | 2,601 (16.3%) |
| 65 to 74 Years | 1,440 (34.7%) | 1,218 (28.6%) |
| 75 Years and over | 1,237 (52.2%) | 1,629 (54.1%) |
Disability Class by Sex by Age in Grant County
Disability Class: Hearing Difficulty
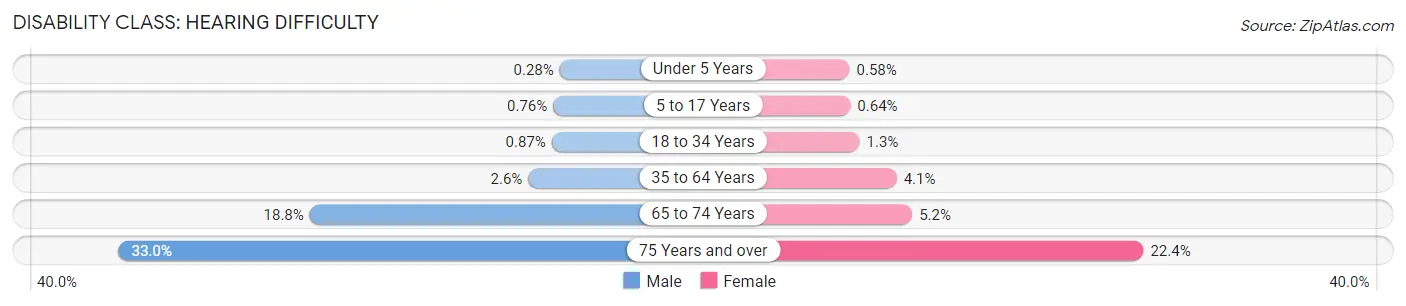
| Age Bracket | Male | Female |
| Under 5 Years | 10 (0.3%) | 21 (0.6%) |
| 5 to 17 Years | 83 (0.8%) | 67 (0.6%) |
| 18 to 34 Years | 106 (0.9%) | 146 (1.3%) |
| 35 to 64 Years | 446 (2.6%) | 651 (4.1%) |
| 65 to 74 Years | 781 (18.8%) | 223 (5.2%) |
| 75 Years and over | 783 (33.0%) | 675 (22.4%) |
Disability Class: Vision Difficulty
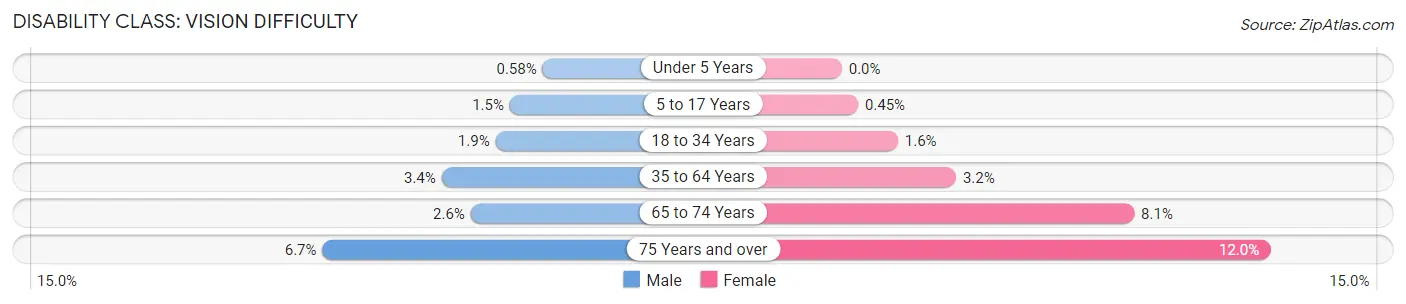
| Age Bracket | Male | Female |
| Under 5 Years | 21 (0.6%) | 0 (0.0%) |
| 5 to 17 Years | 162 (1.5%) | 47 (0.4%) |
| 18 to 34 Years | 231 (1.9%) | 172 (1.6%) |
| 35 to 64 Years | 578 (3.4%) | 507 (3.2%) |
| 65 to 74 Years | 107 (2.6%) | 347 (8.1%) |
| 75 Years and over | 159 (6.7%) | 360 (11.9%) |
Disability Class: Cognitive Difficulty
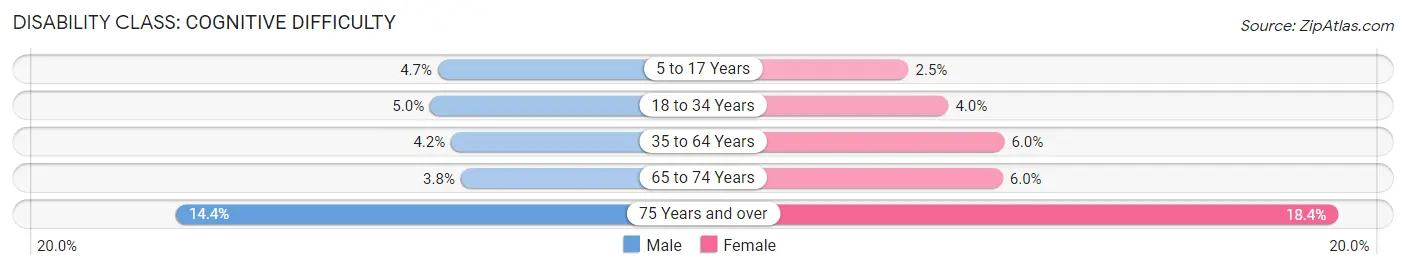
| Age Bracket | Male | Female |
| 5 to 17 Years | 507 (4.7%) | 259 (2.5%) |
| 18 to 34 Years | 606 (5.0%) | 437 (4.0%) |
| 35 to 64 Years | 711 (4.2%) | 964 (6.0%) |
| 65 to 74 Years | 158 (3.8%) | 255 (6.0%) |
| 75 Years and over | 341 (14.4%) | 555 (18.4%) |
Disability Class: Ambulatory Difficulty
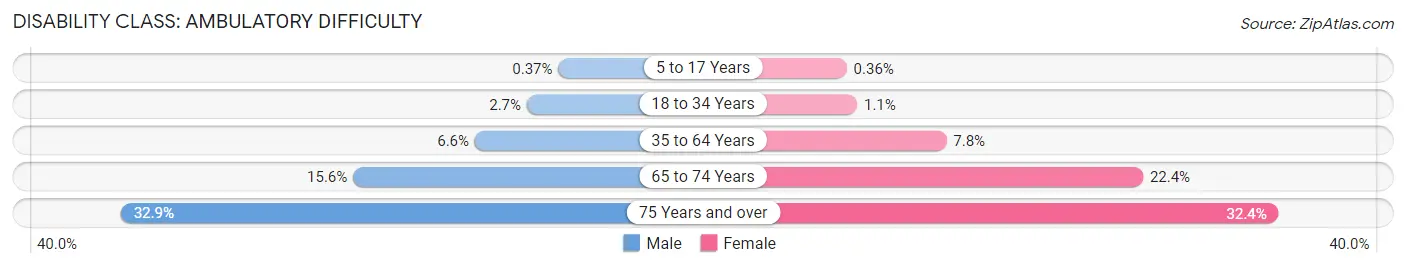
| Age Bracket | Male | Female |
| 5 to 17 Years | 40 (0.4%) | 38 (0.4%) |
| 18 to 34 Years | 332 (2.7%) | 125 (1.1%) |
| 35 to 64 Years | 1,122 (6.6%) | 1,238 (7.8%) |
| 65 to 74 Years | 647 (15.6%) | 953 (22.4%) |
| 75 Years and over | 779 (32.9%) | 977 (32.4%) |
Disability Class: Self-Care Difficulty
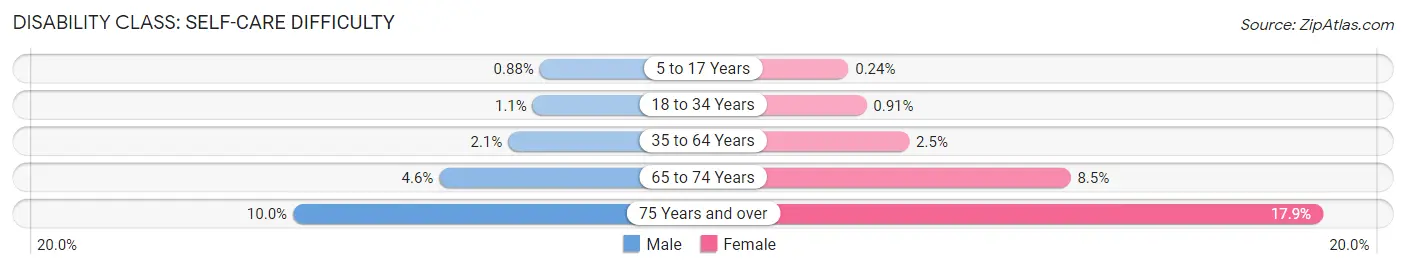
| Age Bracket | Male | Female |
| 5 to 17 Years | 96 (0.9%) | 25 (0.2%) |
| 18 to 34 Years | 140 (1.1%) | 101 (0.9%) |
| 35 to 64 Years | 350 (2.1%) | 399 (2.5%) |
| 65 to 74 Years | 191 (4.6%) | 362 (8.5%) |
| 75 Years and over | 238 (10.0%) | 538 (17.9%) |
Technology Access in Grant County
Computing Device Access in Grant County
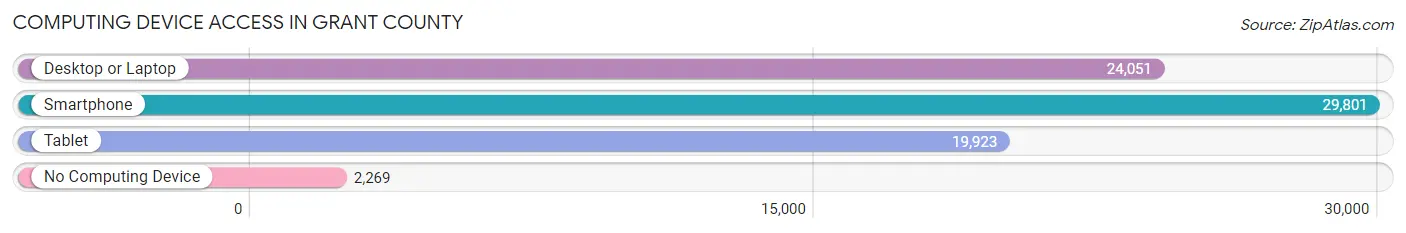
| Device Type | # Households | % Households |
| Desktop or Laptop | 24,051 | 71.4% |
| Smartphone | 29,801 | 88.5% |
| Tablet | 19,923 | 59.2% |
| No Computing Device | 2,269 | 6.7% |
| Total | 33,666 | 100.0% |
Internet Access in Grant County
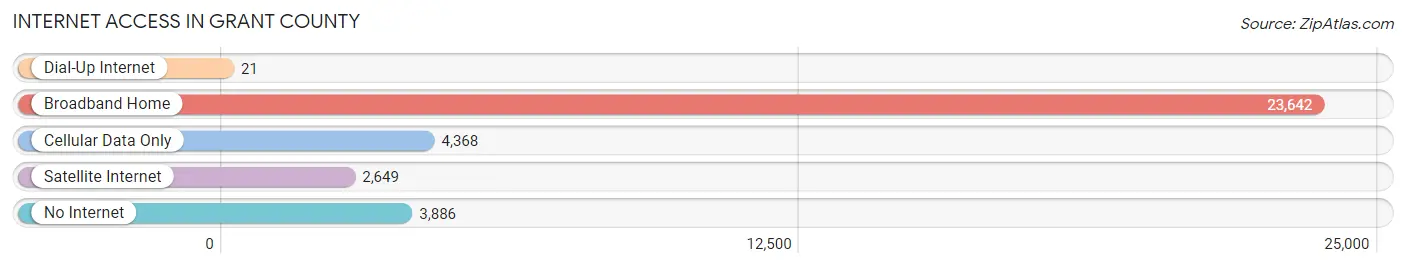
| Internet Type | # Households | % Households |
| Dial-Up Internet | 21 | 0.1% |
| Broadband Home | 23,642 | 70.2% |
| Cellular Data Only | 4,368 | 13.0% |
| Satellite Internet | 2,649 | 7.9% |
| No Internet | 3,886 | 11.5% |
| Total | 33,666 | 100.0% |
Grant County Summary
County History
Grant County is located in the southeastern corner of Washington State, and is bordered by the Columbia River to the north, the Snake River to the east, and the Yakima River to the south. The county was established in 1909 and named after Ulysses S. Grant, the 18th President of the United States.
The area that is now Grant County was originally inhabited by the Wanapum and Yakama Native American tribes. The first non-native settlers arrived in the area in the late 1800s, and the county was officially established in 1909.
The county was initially an agricultural area, with wheat, apples, and hops being the main crops. In the early 1900s, the county began to develop its mining industry, with gold, silver, and copper being the main minerals mined. The county also developed its timber industry, with lumber being shipped to the nearby cities of Spokane and Seattle.
In the 1950s, the county began to develop its tourism industry, with the opening of the Grand Coulee Dam and the Columbia River Gorge. The county also began to develop its recreation industry, with the opening of several ski resorts and the development of several lakes and rivers for fishing and boating.
Today, Grant County is a diverse and vibrant community, with a strong agricultural, mining, timber, tourism, and recreation industry. The county is home to several small towns, including Moses Lake, Ephrata, Quincy, and Royal City.
Geography
Grant County is located in the southeastern corner of Washington State, and is bordered by the Columbia River to the north, the Snake River to the east, and the Yakima River to the south. The county covers an area of 2,717 square miles, and is the second largest county in the state.
The county is mostly made up of rolling hills and valleys, with the Columbia River Gorge running through the northern part of the county. The county is also home to several lakes, including Moses Lake, Banks Lake, and Potholes Reservoir.
The climate in Grant County is semi-arid, with hot summers and cold winters. The average annual precipitation is around 10 inches, with most of the precipitation falling in the winter months.
Economy
Grant County has a diverse and vibrant economy, with a strong agricultural, mining, timber, tourism, and recreation industry.
Agriculture is the main industry in the county, with wheat, apples, hops, and other crops being the main crops. The county is also home to several wineries and breweries, as well as several dairy farms.
Mining is also an important industry in the county, with gold, silver, and copper being the main minerals mined. The county is also home to several coal mines.
The timber industry is also an important part of the county’s economy, with lumber being shipped to the nearby cities of Spokane and Seattle.
Tourism is also an important part of the county’s economy, with the Grand Coulee Dam and the Columbia River Gorge being the main attractions. The county is also home to several ski resorts, as well as several lakes and rivers for fishing and boating.
Demographics
As of the 2010 census, Grant County had a population of 89,120. The population is made up of a diverse mix of ethnicities, with the largest ethnic group being White (77.3%), followed by Hispanic or Latino (10.2%), Native American (4.2%), Asian (2.7%), and African American (2.2%).
The median household income in the county is $48,845, and the median home value is $179,400. The unemployment rate in the county is 6.2%.
The county is served by several school districts, including Moses Lake School District, Quincy School District, and Royal City School District. The county is also home to several colleges and universities, including Big Bend Community College and Central Washington University.
Common Questions
What is the Total Population of Grant County?
Total Population of Grant County is 99,145.
What is the Total Male Population of Grant County?
Total Male Population of Grant County is 50,580.
What is the Total Female Population of Grant County?
Total Female Population of Grant County is 48,565.
What is the Ratio of Males per 100 Females in Grant County?
There are 104.15 Males per 100 Females in Grant County.
What is the Ratio of Females per 100 Males in Grant County?
There are 96.02 Females per 100 Males in Grant County.
What is the Median Population Age in Grant County?
Median Population Age in Grant County is 33.2 Years.
What is the Average Family Size in Grant County
Average Family Size in Grant County is 3.5 People.
What is the Average Household Size in Grant County
Average Household Size in Grant County is 2.9 People.
What is Per Capita Income in Grant County?
Per Capita income in Grant County is $29,655.
What is the Median Family Income in Grant County?
Median Family Income in Grant County is $75,647.
What is the Median Household income in Grant County?
Median Household Income in Grant County is $66,387.
What is Income or Wage Gap in Grant County?
Income or Wage Gap in Grant County is 33.3%.
Women in Grant County earn 66.7 cents for every dollar earned by a man.
What is Family Income Deficit in Grant County?
Family Income Deficit in Grant County is $11,232.
Families that are below poverty line in Grant County earn $11,232 less on average than the poverty threshold level.
What is Inequality or Gini Index in Grant County?
Inequality or Gini Index in Grant County is 0.43.
How Large is the Labor Force in Grant County?
There are 45,960 People in the Labor Forcein in Grant County.
What is the Percentage of People in the Labor Force in Grant County?
62.3% of People are in the Labor Force in Grant County.
What is the Unemployment Rate in Grant County?
Unemployment Rate in Grant County is 5.4%.