Franklin County, WA
Franklin County Overview
96,692
TOTAL POPULATION
49,955
MALE POPULATION
46,737
FEMALE POPULATION
106.89
MALES / 100 FEMALES
93.56
FEMALES / 100 MALES
30.6
MEDIAN AGE
3.7
AVG FAMILY SIZE
3.3
AVG HOUSEHOLD SIZE
$31,346
PER CAPITA INCOME
$83,228
AVG FAMILY INCOME
$77,877
AVG HOUSEHOLD INCOME
27.9%
WAGE / INCOME GAP [ % ]
72.1¢/ $1
WAGE / INCOME GAP [ $ ]
$11,847
FAMILY INCOME DEFICIT
0.42
INEQUALITY / GINI INDEX
46,267
LABOR FORCE [ PEOPLE ]
66.3%
PERCENT IN LABOR FORCE
5.7%
UNEMPLOYMENT RATE
Franklin County Area Codes
Race in Franklin County
The most populous races in Franklin County are White / Caucasian (54,722 | 56.6%), Hispanic or Latino (52,100 | 53.9%), and Some other Race (20,764 | 21.5%).
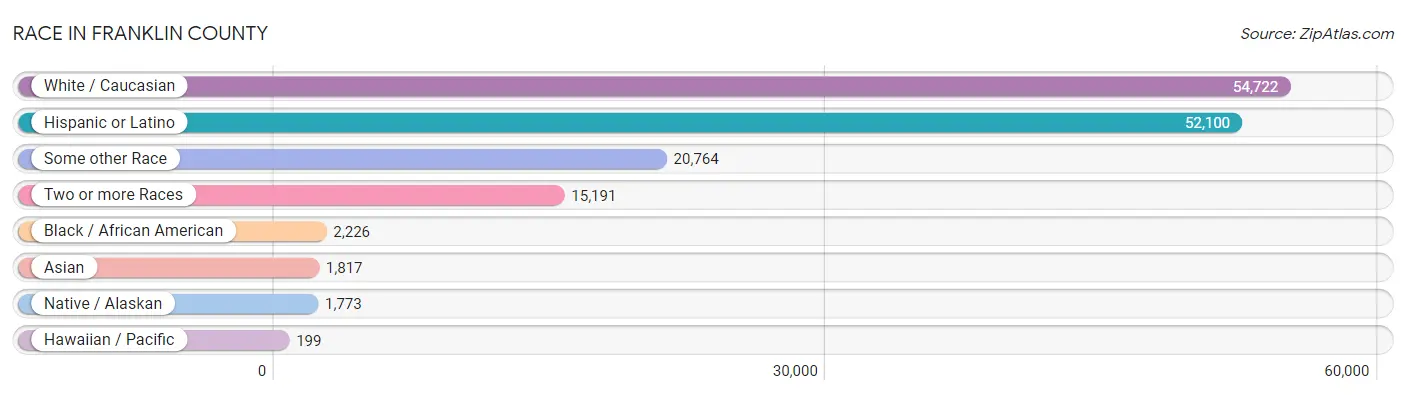
| Race | # Population | % Population |
| Asian | 1,817 | 1.9% |
| Black / African American | 2,226 | 2.3% |
| Hawaiian / Pacific | 199 | 0.2% |
| Hispanic or Latino | 52,100 | 53.9% |
| Native / Alaskan | 1,773 | 1.8% |
| White / Caucasian | 54,722 | 56.6% |
| Two or more Races | 15,191 | 15.7% |
| Some other Race | 20,764 | 21.5% |
| Total | 96,692 | 100.0% |
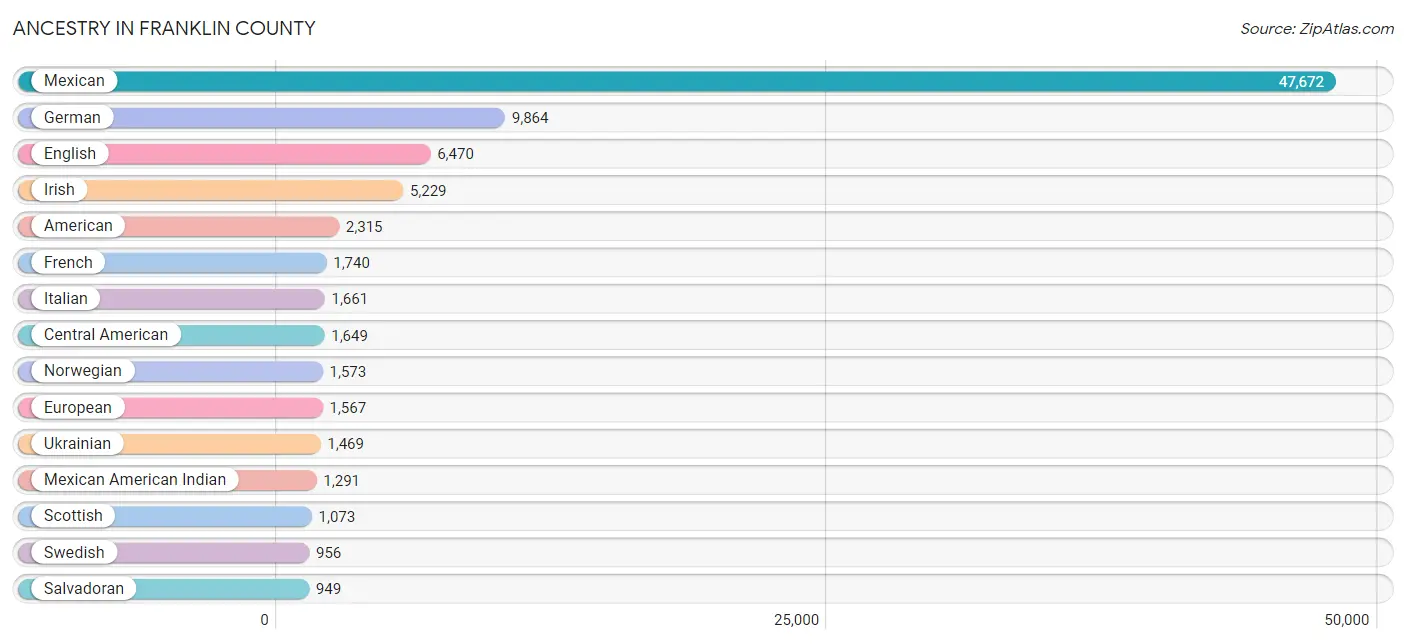
Ancestry in Franklin County
The most populous ancestries reported in Franklin County are Mexican (47,672 | 49.3%), German (9,864 | 10.2%), English (6,470 | 6.7%), Irish (5,229 | 5.4%), and American (2,315 | 2.4%), together accounting for 74.0% of all Franklin County residents.
| Ancestry | # Population | % Population |
| African | 210 | 0.2% |
| Alaska Native | 14 | 0.0% |
| American | 2,315 | 2.4% |
| Apache | 9 | 0.0% |
| Arab | 103 | 0.1% |
| Australian | 48 | 0.1% |
| Austrian | 446 | 0.5% |
| Basque | 25 | 0.0% |
| Belgian | 15 | 0.0% |
| Bhutanese | 264 | 0.3% |
| Blackfeet | 93 | 0.1% |
| Bolivian | 29 | 0.0% |
| Brazilian | 12 | 0.0% |
| British | 396 | 0.4% |
| Burmese | 424 | 0.4% |
| Canadian | 80 | 0.1% |
| Celtic | 38 | 0.0% |
| Central American | 1,649 | 1.7% |
| Central American Indian | 73 | 0.1% |
| Cherokee | 247 | 0.3% |
| Chilean | 147 | 0.2% |
| Chippewa | 23 | 0.0% |
| Choctaw | 9 | 0.0% |
| Colombian | 25 | 0.0% |
| Colville | 11 | 0.0% |
| Creek | 45 | 0.1% |
| Croatian | 14 | 0.0% |
| Cuban | 151 | 0.2% |
| Czech | 240 | 0.3% |
| Czechoslovakian | 57 | 0.1% |
| Danish | 315 | 0.3% |
| Dominican | 5 | 0.0% |
| Dutch | 633 | 0.6% |
| Eastern European | 77 | 0.1% |
| Egyptian | 70 | 0.1% |
| English | 6,470 | 6.7% |
| European | 1,567 | 1.6% |
| Fijian | 24 | 0.0% |
| Finnish | 164 | 0.2% |
| French | 1,740 | 1.8% |
| French Canadian | 628 | 0.6% |
| German | 9,864 | 10.2% |
| Greek | 48 | 0.1% |
| Guamanian / Chamorro | 87 | 0.1% |
| Guatemalan | 599 | 0.6% |
| Honduran | 74 | 0.1% |
| Hungarian | 23 | 0.0% |
| Indian (Asian) | 507 | 0.5% |
| Indonesian | 642 | 0.7% |
| Inupiat | 32 | 0.0% |
| Iraqi | 12 | 0.0% |
| Irish | 5,229 | 5.4% |
| Iroquois | 224 | 0.2% |
| Italian | 1,661 | 1.7% |
| Jamaican | 17 | 0.0% |
| Japanese | 10 | 0.0% |
| Kenyan | 117 | 0.1% |
| Korean | 724 | 0.7% |
| Laotian | 11 | 0.0% |
| Lebanese | 21 | 0.0% |
| Lithuanian | 43 | 0.0% |
| Malaysian | 46 | 0.1% |
| Marshallese | 10 | 0.0% |
| Mexican | 47,672 | 49.3% |
| Mexican American Indian | 1,291 | 1.3% |
| Native Hawaiian | 258 | 0.3% |
| New Zealander | 16 | 0.0% |
| Nicaraguan | 27 | 0.0% |
| Nigerian | 29 | 0.0% |
| Northern European | 61 | 0.1% |
| Norwegian | 1,573 | 1.6% |
| Pakistani | 91 | 0.1% |
| Pennsylvania German | 32 | 0.0% |
| Peruvian | 21 | 0.0% |
| Polish | 391 | 0.4% |
| Portuguese | 166 | 0.2% |
| Potawatomi | 20 | 0.0% |
| Puerto Rican | 181 | 0.2% |
| Puget Sound Salish | 99 | 0.1% |
| Romanian | 86 | 0.1% |
| Russian | 392 | 0.4% |
| Salvadoran | 949 | 1.0% |
| Samoan | 30 | 0.0% |
| Scandinavian | 402 | 0.4% |
| Scotch-Irish | 491 | 0.5% |
| Scottish | 1,073 | 1.1% |
| Sioux | 46 | 0.1% |
| Slavic | 25 | 0.0% |
| Slovak | 45 | 0.1% |
| Slovene | 23 | 0.0% |
| South African | 16 | 0.0% |
| South American | 222 | 0.2% |
| Spaniard | 468 | 0.5% |
| Spanish | 722 | 0.7% |
| Spanish American | 9 | 0.0% |
| Sri Lankan | 505 | 0.5% |
| Subsaharan African | 372 | 0.4% |
| Swedish | 956 | 1.0% |
| Swiss | 194 | 0.2% |
| Thai | 63 | 0.1% |
| Tlingit-Haida | 4 | 0.0% |
| Tsimshian | 9 | 0.0% |
| Turkish | 15 | 0.0% |
| Ukrainian | 1,469 | 1.5% |
| Welsh | 582 | 0.6% |
| Yakama | 3 | 0.0% |
| Yaqui | 1 | 0.0% |
| Yugoslavian | 103 | 0.1% | View All 108 Rows |
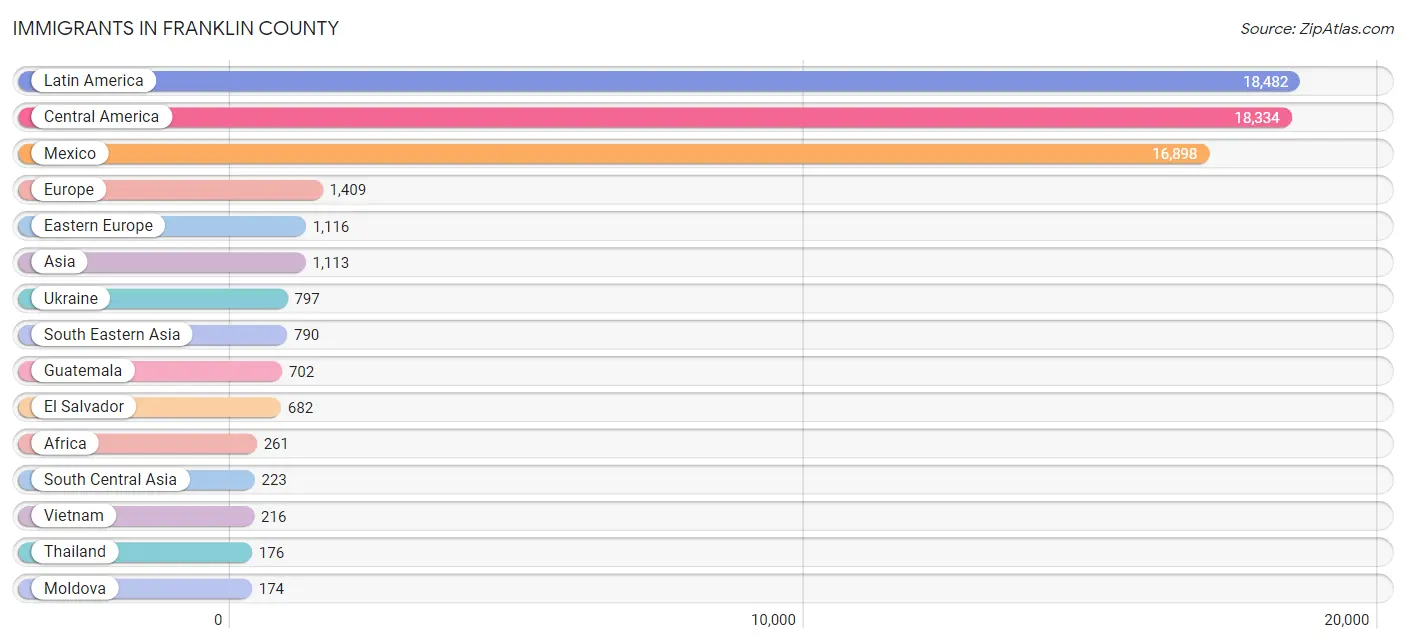
Immigrants in Franklin County
The most numerous immigrant groups reported in Franklin County came from Latin America (18,482 | 19.1%), Central America (18,334 | 19.0%), Mexico (16,898 | 17.5%), Europe (1,409 | 1.5%), and Eastern Europe (1,116 | 1.1%), together accounting for 58.2% of all Franklin County residents.
| Immigration Origin | # Population | % Population |
| Africa | 261 | 0.3% |
| Asia | 1,113 | 1.1% |
| Australia | 9 | 0.0% |
| Austria | 63 | 0.1% |
| Bosnia and Herzegovina | 46 | 0.1% |
| Cambodia | 1 | 0.0% |
| Cameroon | 51 | 0.1% |
| Canada | 153 | 0.2% |
| Caribbean | 102 | 0.1% |
| Central America | 18,334 | 19.0% |
| China | 12 | 0.0% |
| Colombia | 25 | 0.0% |
| Cuba | 67 | 0.1% |
| Dominican Republic | 5 | 0.0% |
| Eastern Africa | 128 | 0.1% |
| Eastern Asia | 79 | 0.1% |
| Eastern Europe | 1,116 | 1.1% |
| Egypt | 23 | 0.0% |
| El Salvador | 682 | 0.7% |
| England | 24 | 0.0% |
| Europe | 1,409 | 1.5% |
| Germany | 100 | 0.1% |
| Guatemala | 702 | 0.7% |
| Honduras | 25 | 0.0% |
| India | 16 | 0.0% |
| Ireland | 30 | 0.0% |
| Jamaica | 17 | 0.0% |
| Kazakhstan | 17 | 0.0% |
| Kenya | 128 | 0.1% |
| Korea | 67 | 0.1% |
| Laos | 49 | 0.1% |
| Latin America | 18,482 | 19.1% |
| Lebanon | 21 | 0.0% |
| Mexico | 16,898 | 17.5% |
| Micronesia | 10 | 0.0% |
| Middle Africa | 51 | 0.1% |
| Moldova | 174 | 0.2% |
| Nicaragua | 27 | 0.0% |
| Nigeria | 43 | 0.0% |
| Northern Africa | 23 | 0.0% |
| Northern Europe | 59 | 0.1% |
| Oceania | 34 | 0.0% |
| Pakistan | 12 | 0.0% |
| Peru | 21 | 0.0% |
| Philippines | 161 | 0.2% |
| Russia | 99 | 0.1% |
| South Africa | 16 | 0.0% |
| South America | 46 | 0.1% |
| South Central Asia | 223 | 0.2% |
| South Eastern Asia | 790 | 0.8% |
| Southern Europe | 71 | 0.1% |
| Spain | 71 | 0.1% |
| Thailand | 176 | 0.2% |
| Ukraine | 797 | 0.8% |
| Uzbekistan | 160 | 0.2% |
| Vietnam | 216 | 0.2% |
| Western Africa | 43 | 0.0% |
| Western Asia | 21 | 0.0% |
| Western Europe | 163 | 0.2% | View All 59 Rows |
Sex and Age in Franklin County
Sex and Age in Franklin County
The most populous age groups in Franklin County are 10 to 14 Years (4,800 | 9.6%) for men and 10 to 14 Years (4,883 | 10.4%) for women.
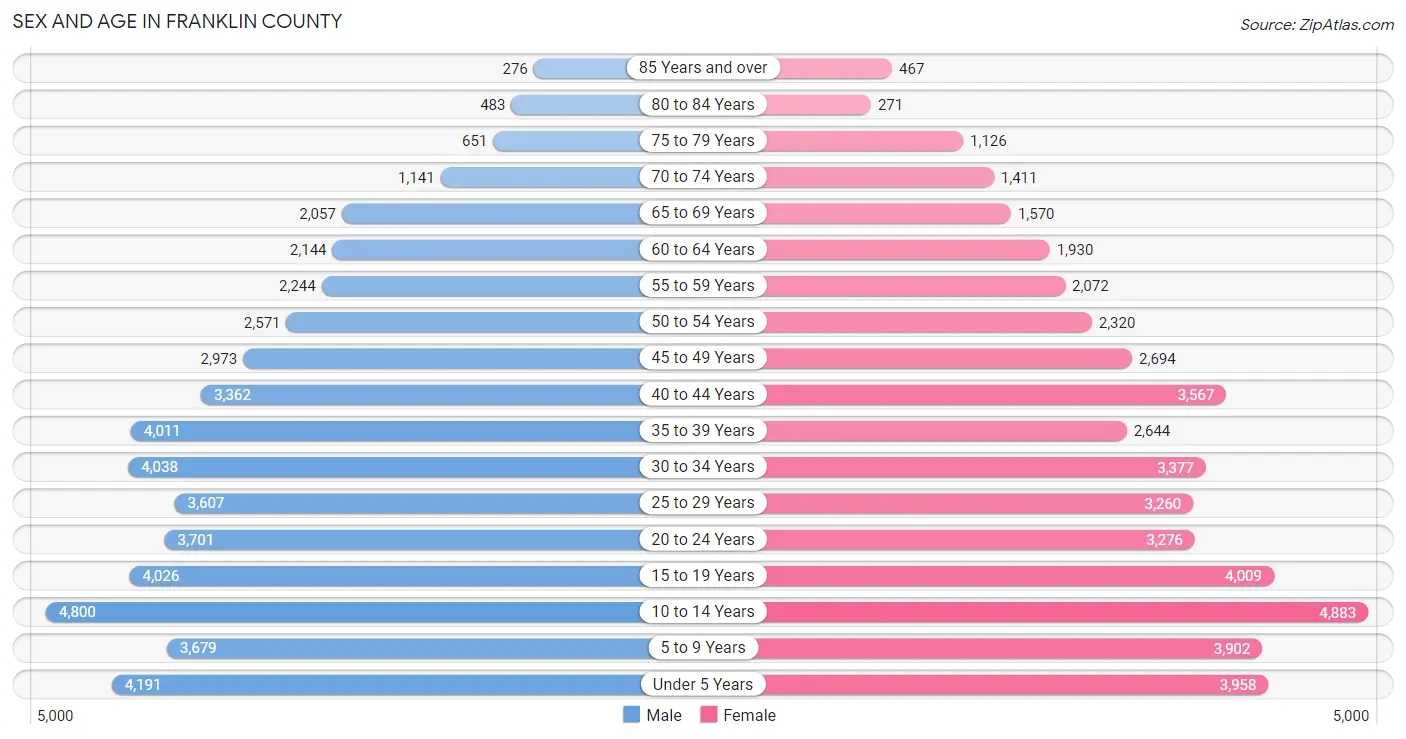
| Age Bracket | Male | Female |
| Under 5 Years | 4,191 (8.4%) | 3,958 (8.5%) |
| 5 to 9 Years | 3,679 (7.4%) | 3,902 (8.4%) |
| 10 to 14 Years | 4,800 (9.6%) | 4,883 (10.4%) |
| 15 to 19 Years | 4,026 (8.1%) | 4,009 (8.6%) |
| 20 to 24 Years | 3,701 (7.4%) | 3,276 (7.0%) |
| 25 to 29 Years | 3,607 (7.2%) | 3,260 (7.0%) |
| 30 to 34 Years | 4,038 (8.1%) | 3,377 (7.2%) |
| 35 to 39 Years | 4,011 (8.0%) | 2,644 (5.7%) |
| 40 to 44 Years | 3,362 (6.7%) | 3,567 (7.6%) |
| 45 to 49 Years | 2,973 (5.9%) | 2,694 (5.8%) |
| 50 to 54 Years | 2,571 (5.1%) | 2,320 (5.0%) |
| 55 to 59 Years | 2,244 (4.5%) | 2,072 (4.4%) |
| 60 to 64 Years | 2,144 (4.3%) | 1,930 (4.1%) |
| 65 to 69 Years | 2,057 (4.1%) | 1,570 (3.4%) |
| 70 to 74 Years | 1,141 (2.3%) | 1,411 (3.0%) |
| 75 to 79 Years | 651 (1.3%) | 1,126 (2.4%) |
| 80 to 84 Years | 483 (1.0%) | 271 (0.6%) |
| 85 Years and over | 276 (0.5%) | 467 (1.0%) |
| Total | 49,955 (100.0%) | 46,737 (100.0%) |
Families and Households in Franklin County
Median Family Size in Franklin County
The median family size in Franklin County is 3.68 persons per family, with single female/mother families (5,071 | 22.5%) accounting for the largest median family size of 3.8 persons per family. On the other hand, single male/father families (2,100 | 9.3%) represent the smallest median family size with 3.46 persons per family.
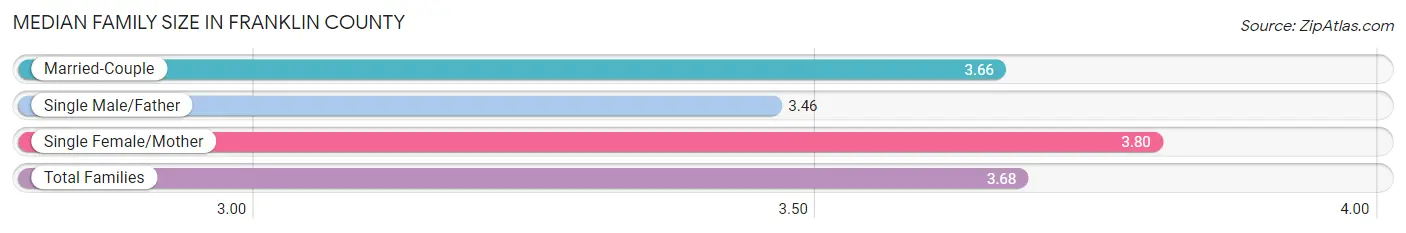
| Family Type | # Families | Family Size |
| Married-Couple | 15,346 (68.1%) | 3.66 |
| Single Male/Father | 2,100 (9.3%) | 3.46 |
| Single Female/Mother | 5,071 (22.5%) | 3.80 |
| Total Families | 22,517 (100.0%) | 3.68 |
Median Household Size in Franklin County
The median household size in Franklin County is 3.32 persons per household, with single female/mother households (5,071 | 17.9%) accounting for the largest median household size of 4.19 persons per household. non-family households (5,833 | 20.6%) represent the smallest median household size with 1.29 persons per household.
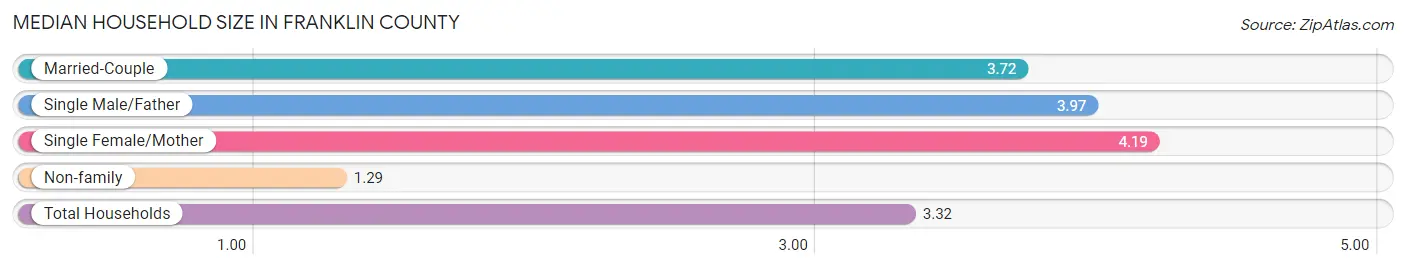
| Household Type | # Households | Household Size |
| Married-Couple | 15,346 (54.1%) | 3.72 |
| Single Male/Father | 2,100 (7.4%) | 3.97 |
| Single Female/Mother | 5,071 (17.9%) | 4.19 |
| Non-family | 5,833 (20.6%) | 1.29 |
| Total Households | 28,350 (100.0%) | 3.32 |
Household Size by Marriage Status in Franklin County
Out of a total of 28,350 households in Franklin County, 22,517 (79.4%) are family households, while 5,833 (20.6%) are nonfamily households. The most numerous type of family households are 2-person households, comprising 7,375, and the most common type of nonfamily households are 1-person households, comprising 4,591.
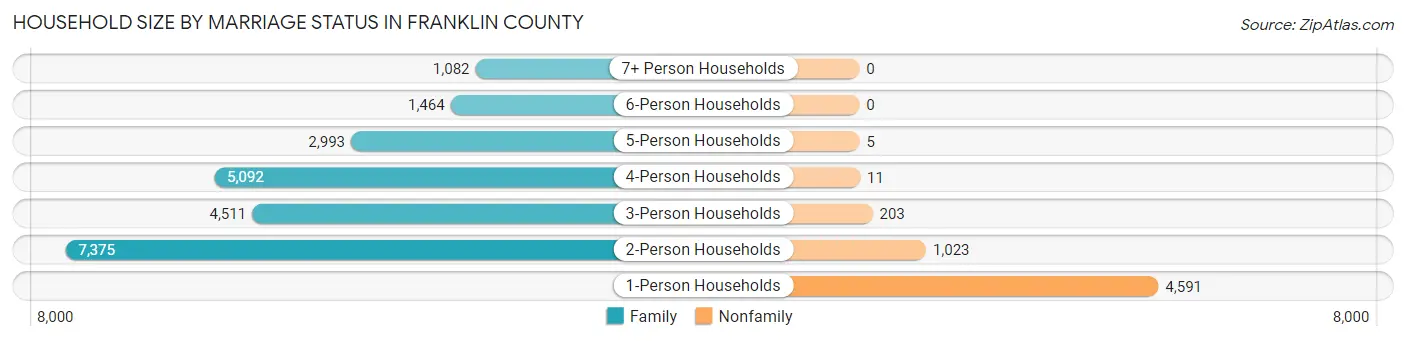
| Household Size | Family Households | Nonfamily Households |
| 1-Person Households | - | 4,591 (16.2%) |
| 2-Person Households | 7,375 (26.0%) | 1,023 (3.6%) |
| 3-Person Households | 4,511 (15.9%) | 203 (0.7%) |
| 4-Person Households | 5,092 (18.0%) | 11 (0.0%) |
| 5-Person Households | 2,993 (10.6%) | 5 (0.0%) |
| 6-Person Households | 1,464 (5.2%) | 0 (0.0%) |
| 7+ Person Households | 1,082 (3.8%) | 0 (0.0%) |
| Total | 22,517 (79.4%) | 5,833 (20.6%) |
Female Fertility in Franklin County
Fertility by Age in Franklin County
Average fertility rate in Franklin County is 82.0 births per 1,000 women. Women in the age bracket of 20 to 34 years have the highest fertility rate with 160.0 births per 1,000 women. Women in the age bracket of 20 to 34 years acount for 84.4% of all women with births.
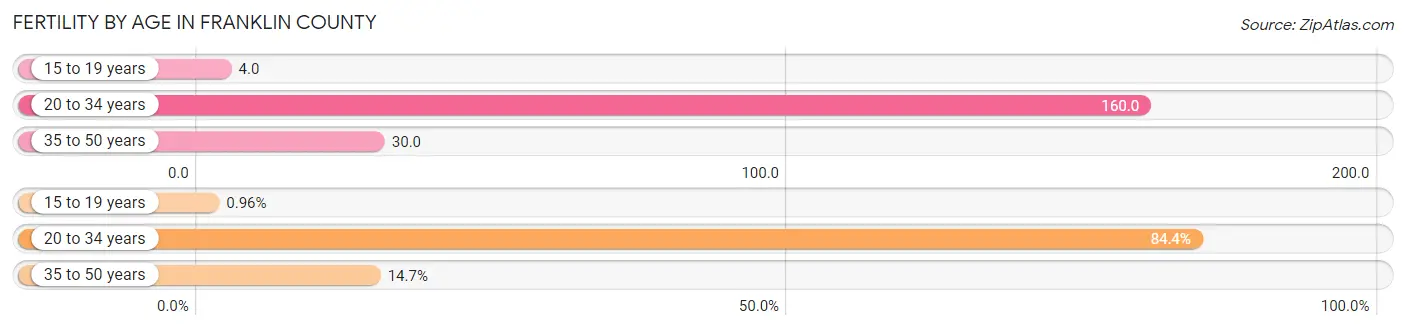
| Age Bracket | Women with Births | Births / 1,000 Women |
| 15 to 19 years | 18 (1.0%) | 4.0 |
| 20 to 34 years | 1,590 (84.4%) | 160.0 |
| 35 to 50 years | 276 (14.6%) | 30.0 |
| Total | 1,884 (100.0%) | 82.0 |
Fertility by Age by Marriage Status in Franklin County
69.0% of women with births (1,884) in Franklin County are married. The highest percentage of unmarried women with births falls into 15 to 19 years age bracket with 100.0% of them unmarried at the time of birth, while the lowest percentage of unmarried women with births belong to 35 to 50 years age bracket with 16.7% of them unmarried.
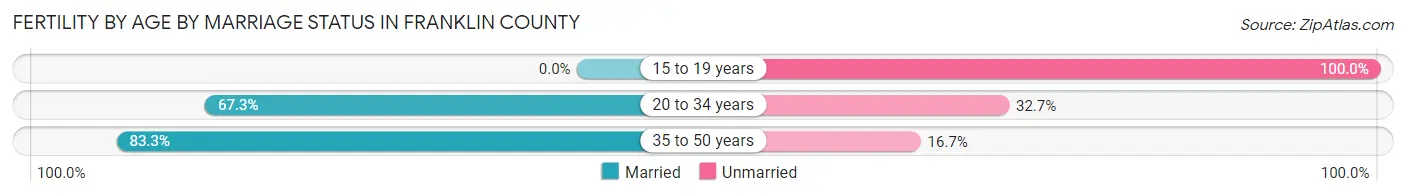
| Age Bracket | Married | Unmarried |
| 15 to 19 years | 0 (0.0%) | 18 (100.0%) |
| 20 to 34 years | 1,070 (67.3%) | 520 (32.7%) |
| 35 to 50 years | 230 (83.3%) | 46 (16.7%) |
| Total | 1,300 (69.0%) | 584 (31.0%) |
Fertility by Education in Franklin County
Average fertility rate in Franklin County is 82.0 births per 1,000 women. Women with the education attainment of graduate degree have the highest fertility rate of 166.0 births per 1,000 women, while women with the education attainment of less than high school have the lowest fertility at 45.0 births per 1,000 women. Women with the education attainment of high school diploma represent 40.5% of all women with births.
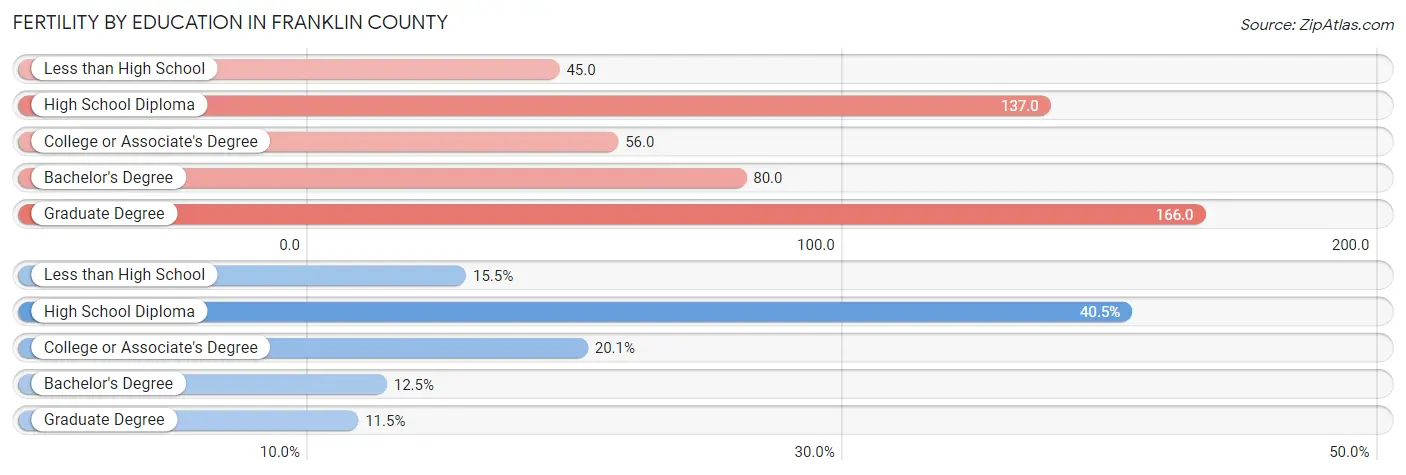
| Educational Attainment | Women with Births | Births / 1,000 Women |
| Less than High School | 292 (15.5%) | 45.0 |
| High School Diploma | 762 (40.5%) | 137.0 |
| College or Associate's Degree | 378 (20.1%) | 56.0 |
| Bachelor's Degree | 236 (12.5%) | 80.0 |
| Graduate Degree | 216 (11.5%) | 166.0 |
| Total | 1,884 (100.0%) | 82.0 |
Fertility by Education by Marriage Status in Franklin County
31.0% of women with births in Franklin County are unmarried. Women with the educational attainment of graduate degree are most likely to be married with 100.0% of them married at childbirth, while women with the educational attainment of less than high school are least likely to be married with 50.7% of them unmarried at childbirth.
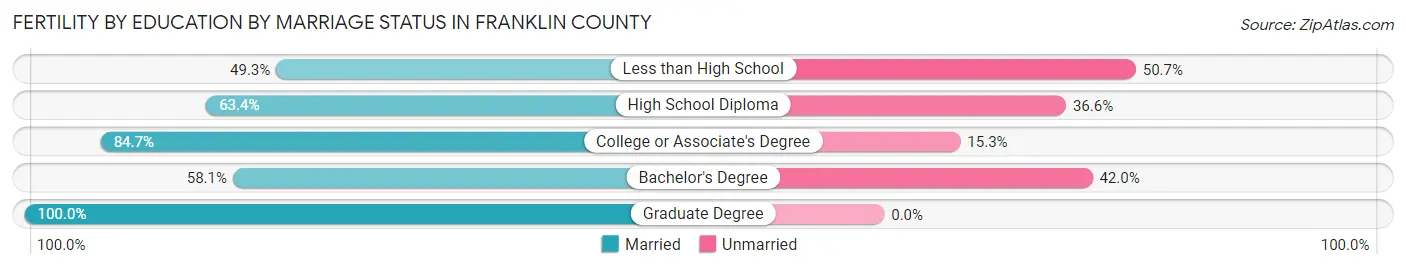
| Educational Attainment | Married | Unmarried |
| Less than High School | 144 (49.3%) | 148 (50.7%) |
| High School Diploma | 483 (63.4%) | 279 (36.6%) |
| College or Associate's Degree | 320 (84.7%) | 58 (15.3%) |
| Bachelor's Degree | 137 (58.1%) | 99 (41.9%) |
| Graduate Degree | 216 (100.0%) | 0 (0.0%) |
| Total | 1,300 (69.0%) | 584 (31.0%) |
Income in Franklin County
Income Overview in Franklin County
Per Capita Income in Franklin County is $31,346, while median incomes of families and households are $83,228 and $77,877 respectively.
| Characteristic | Number | Measure |
| Per Capita Income | 96,692 | $31,346 |
| Median Family Income | 22,517 | $83,228 |
| Mean Family Income | 22,517 | $104,650 |
| Median Household Income | 28,350 | $77,877 |
| Mean Household Income | 28,350 | $100,234 |
| Income Deficit | 22,517 | $11,847 |
| Wage / Income Gap (%) | 96,692 | 27.94% |
| Wage / Income Gap ($) | 96,692 | 72.06¢ per $1 |
| Gini / Inequality Index | 96,692 | 0.42 |
Earnings by Sex in Franklin County
Average Earnings in Franklin County are $38,288, $45,326 for men and $32,661 for women, a difference of 27.9%.
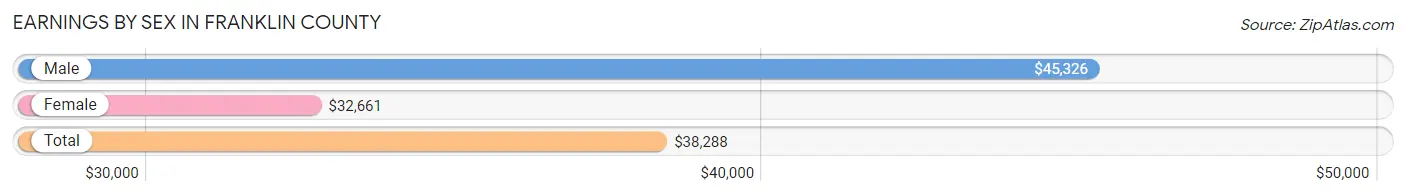
| Sex | Number | Average Earnings |
| Male | 26,594 (55.8%) | $45,326 |
| Female | 21,065 (44.2%) | $32,661 |
| Total | 47,659 (100.0%) | $38,288 |
Earnings by Sex by Income Bracket in Franklin County
The most common earnings brackets in Franklin County are $100,000+ for men (4,045 | 15.2%) and $25,000 to $29,999 for women (2,025 | 9.6%).
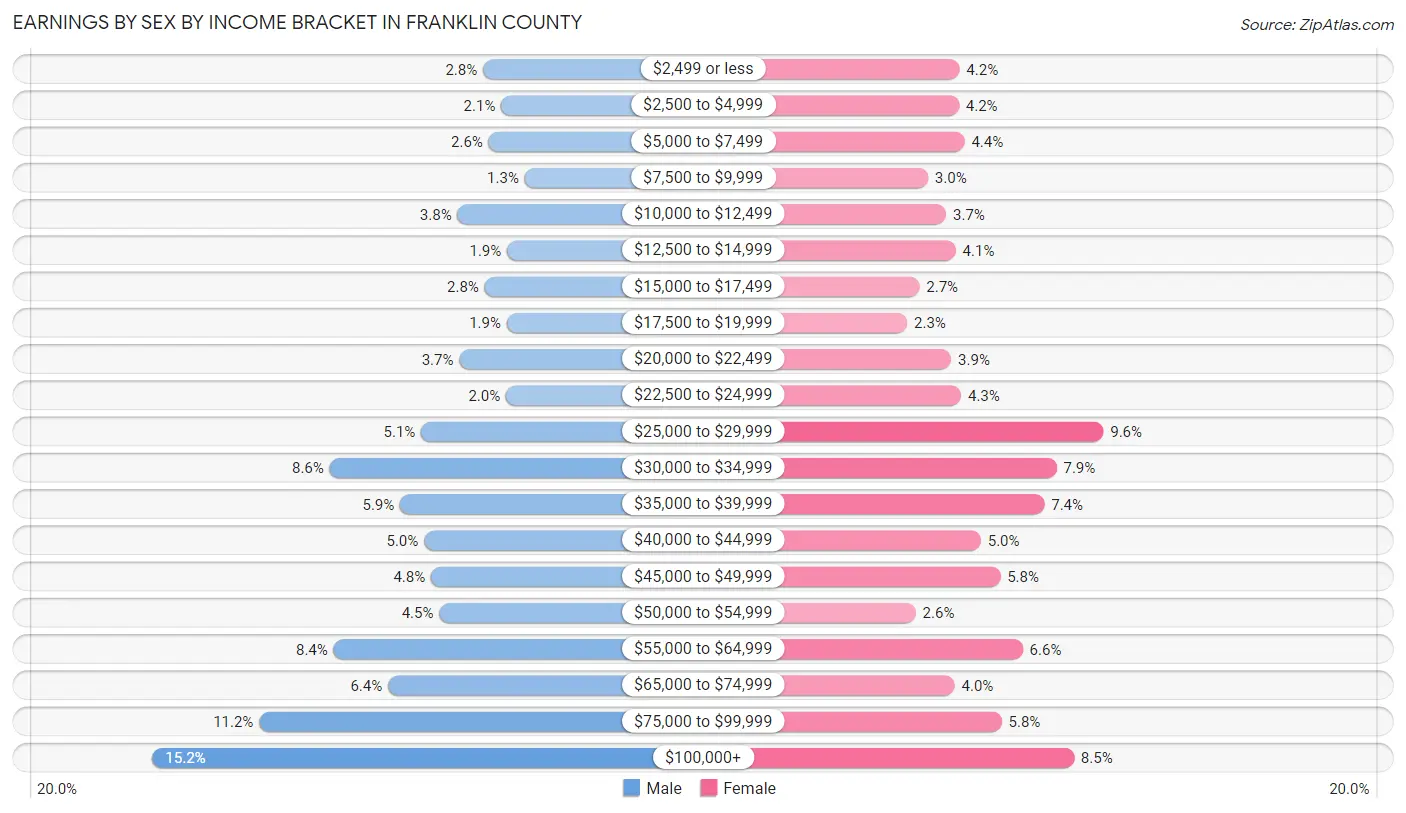
| Income | Male | Female |
| $2,499 or less | 749 (2.8%) | 888 (4.2%) |
| $2,500 to $4,999 | 568 (2.1%) | 885 (4.2%) |
| $5,000 to $7,499 | 694 (2.6%) | 930 (4.4%) |
| $7,500 to $9,999 | 336 (1.3%) | 641 (3.0%) |
| $10,000 to $12,499 | 1,006 (3.8%) | 784 (3.7%) |
| $12,500 to $14,999 | 511 (1.9%) | 860 (4.1%) |
| $15,000 to $17,499 | 734 (2.8%) | 572 (2.7%) |
| $17,500 to $19,999 | 513 (1.9%) | 477 (2.3%) |
| $20,000 to $22,499 | 987 (3.7%) | 823 (3.9%) |
| $22,500 to $24,999 | 520 (2.0%) | 902 (4.3%) |
| $25,000 to $29,999 | 1,366 (5.1%) | 2,025 (9.6%) |
| $30,000 to $34,999 | 2,279 (8.6%) | 1,655 (7.9%) |
| $35,000 to $39,999 | 1,577 (5.9%) | 1,559 (7.4%) |
| $40,000 to $44,999 | 1,337 (5.0%) | 1,057 (5.0%) |
| $45,000 to $49,999 | 1,268 (4.8%) | 1,211 (5.8%) |
| $50,000 to $54,999 | 1,187 (4.5%) | 543 (2.6%) |
| $55,000 to $64,999 | 2,240 (8.4%) | 1,388 (6.6%) |
| $65,000 to $74,999 | 1,696 (6.4%) | 851 (4.0%) |
| $75,000 to $99,999 | 2,981 (11.2%) | 1,222 (5.8%) |
| $100,000+ | 4,045 (15.2%) | 1,792 (8.5%) |
| Total | 26,594 (100.0%) | 21,065 (100.0%) |
Earnings by Sex by Educational Attainment in Franklin County
Average earnings in Franklin County are $53,637 for men and $37,277 for women, a difference of 30.5%. Men with an educational attainment of graduate degree enjoy the highest average annual earnings of $92,773, while those with less than high school education earn the least with $36,875. Women with an educational attainment of graduate degree earn the most with the average annual earnings of $89,181, while those with less than high school education have the smallest earnings of $25,563.
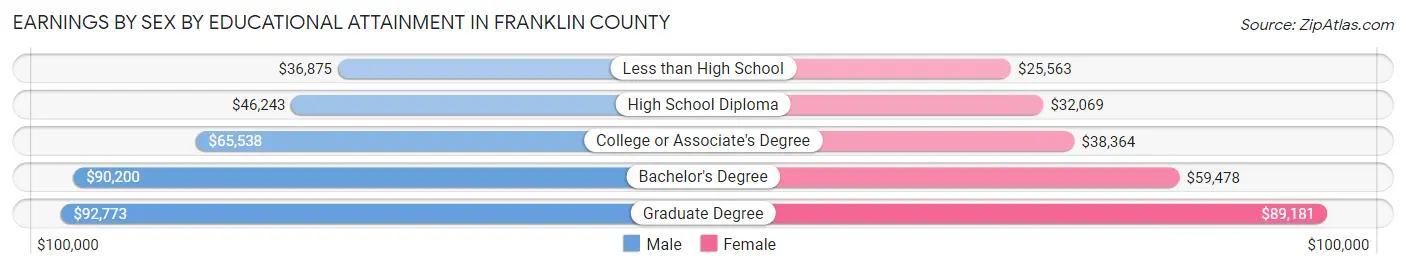
| Educational Attainment | Male Income | Female Income |
| Less than High School | $36,875 | $25,563 |
| High School Diploma | $46,243 | $32,069 |
| College or Associate's Degree | $65,538 | $38,364 |
| Bachelor's Degree | $90,200 | $59,478 |
| Graduate Degree | $92,773 | $89,181 |
| Total | $53,637 | $37,277 |
Family Income in Franklin County
Family Income Brackets in Franklin County
According to the Franklin County family income data, there are 4,413 families falling into the $100,000 to $149,999 income range, which is the most common income bracket and makes up 19.6% of all families. Conversely, the $10,000 to $14,999 income bracket is the least frequent group with only 338 families (1.5%) belonging to this category.
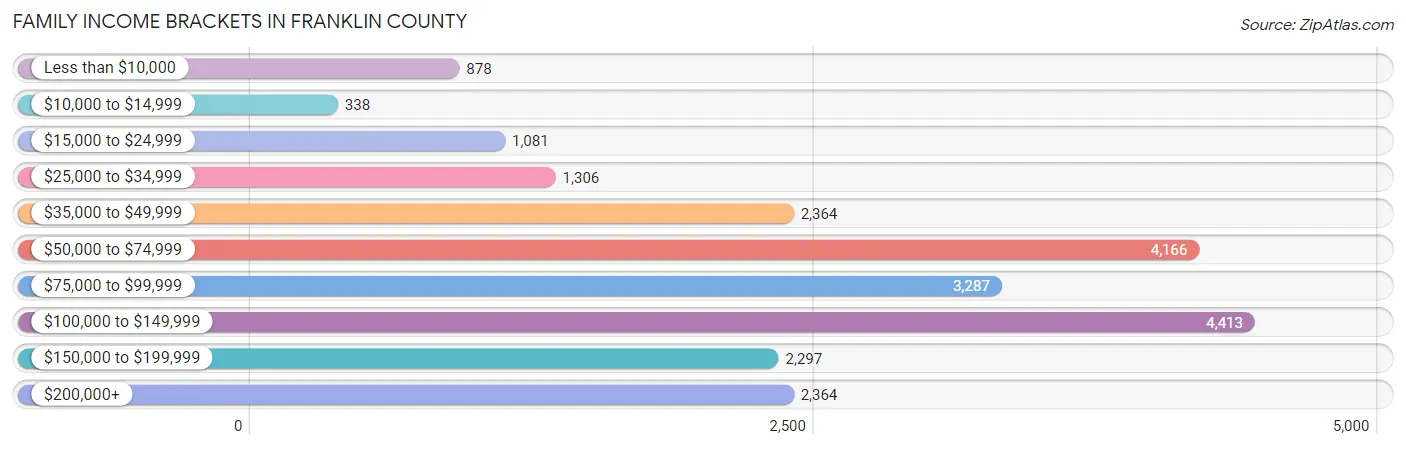
| Income Bracket | # Families | % Families |
| Less than $10,000 | 878 | 3.9% |
| $10,000 to $14,999 | 338 | 1.5% |
| $15,000 to $24,999 | 1,081 | 4.8% |
| $25,000 to $34,999 | 1,306 | 5.8% |
| $35,000 to $49,999 | 2,364 | 10.5% |
| $50,000 to $74,999 | 4,166 | 18.5% |
| $75,000 to $99,999 | 3,287 | 14.6% |
| $100,000 to $149,999 | 4,413 | 19.6% |
| $150,000 to $199,999 | 2,297 | 10.2% |
| $200,000+ | 2,364 | 10.5% |
Family Income by Famaliy Size in Franklin County
7+ person families (764 | 3.4%) account for the highest median family income in Franklin County with $162,993 per family, while 2-person families (8,226 | 36.5%) have the highest median income of $42,130 per family member.
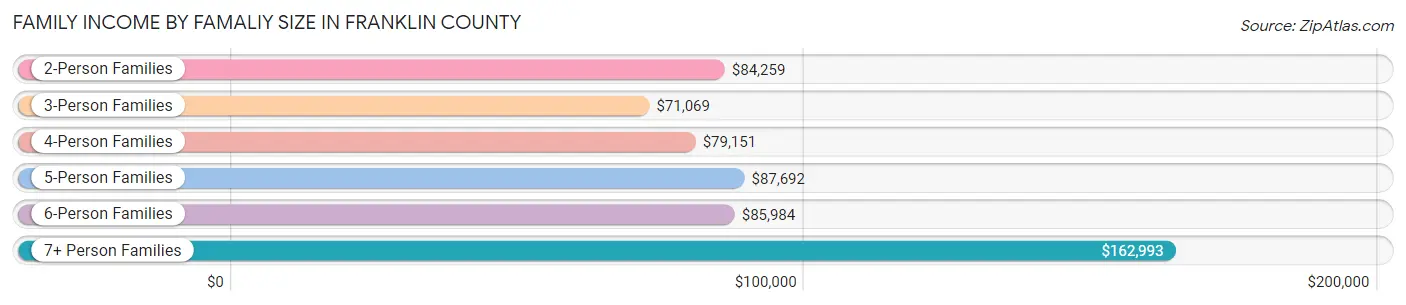
| Income Bracket | # Families | Median Income |
| 2-Person Families | 8,226 (36.5%) | $84,259 |
| 3-Person Families | 4,775 (21.2%) | $71,069 |
| 4-Person Families | 4,505 (20.0%) | $79,151 |
| 5-Person Families | 2,796 (12.4%) | $87,692 |
| 6-Person Families | 1,451 (6.4%) | $85,984 |
| 7+ Person Families | 764 (3.4%) | $162,993 |
| Total | 22,517 (100.0%) | $83,228 |
Family Income by Number of Earners in Franklin County
The median family income in Franklin County is $83,228, with families comprising 3+ earners (3,877) having the highest median family income of $124,540, while families with no earners (2,498) have the lowest median family income of $52,933, accounting for 17.2% and 11.1% of families, respectively.
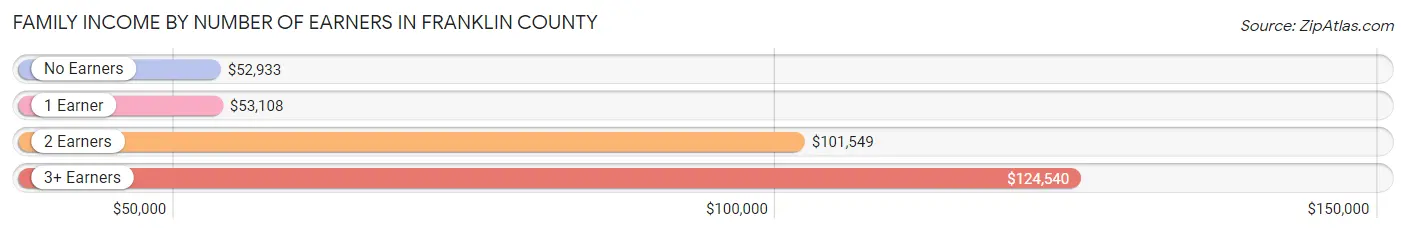
| Number of Earners | # Families | Median Income |
| No Earners | 2,498 (11.1%) | $52,933 |
| 1 Earner | 7,711 (34.3%) | $53,108 |
| 2 Earners | 8,431 (37.4%) | $101,549 |
| 3+ Earners | 3,877 (17.2%) | $124,540 |
| Total | 22,517 (100.0%) | $83,228 |
Household Income in Franklin County
Household Income Brackets in Franklin County
With 5,472 households falling in the category, the $50,000 to $74,999 income range is the most frequent in Franklin County, accounting for 19.3% of all households. In contrast, only 680 households (2.4%) fall into the $10,000 to $14,999 income bracket, making it the least populous group.
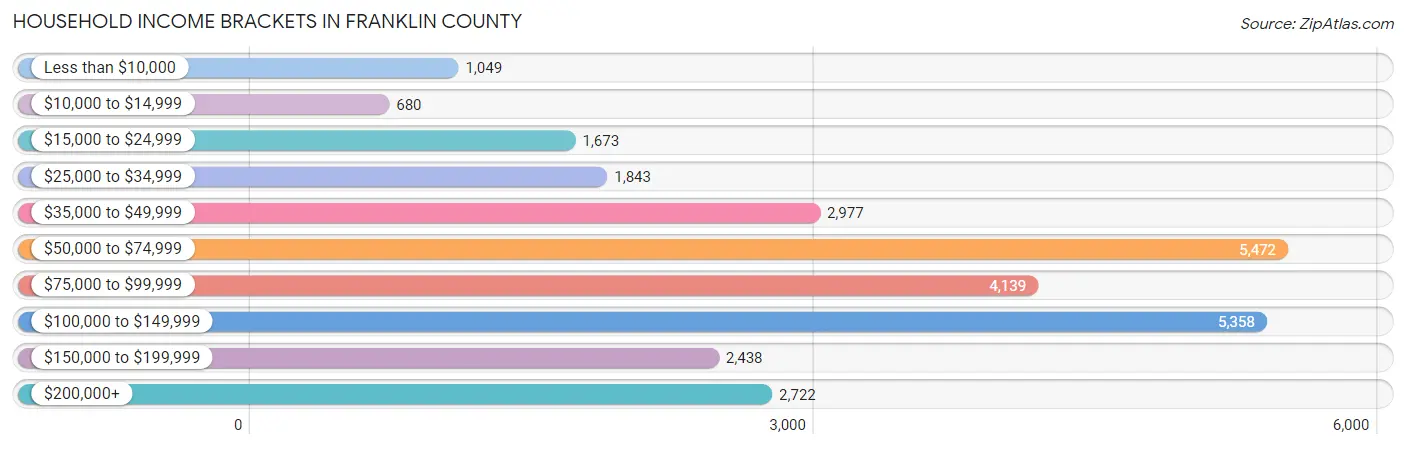
| Income Bracket | # Households | % Households |
| Less than $10,000 | 1,049 | 3.7% |
| $10,000 to $14,999 | 680 | 2.4% |
| $15,000 to $24,999 | 1,673 | 5.9% |
| $25,000 to $34,999 | 1,843 | 6.5% |
| $35,000 to $49,999 | 2,977 | 10.5% |
| $50,000 to $74,999 | 5,472 | 19.3% |
| $75,000 to $99,999 | 4,139 | 14.6% |
| $100,000 to $149,999 | 5,358 | 18.9% |
| $150,000 to $199,999 | 2,438 | 8.6% |
| $200,000+ | 2,722 | 9.6% |
Household Income by Householder Age in Franklin County
The median household income in Franklin County is $77,877, with the highest median household income of $92,276 found in the 45 to 64 years age bracket for the primary householder. A total of 9,264 households (32.7%) fall into this category. Meanwhile, the 15 to 24 years age bracket for the primary householder has the lowest median household income of $56,283, with 1,241 households (4.4%) in this group.
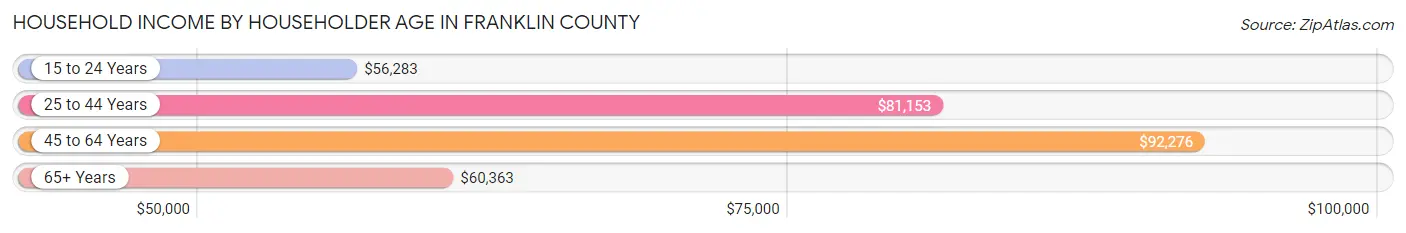
| Income Bracket | # Households | Median Income |
| 15 to 24 Years | 1,241 (4.4%) | $56,283 |
| 25 to 44 Years | 12,429 (43.8%) | $81,153 |
| 45 to 64 Years | 9,264 (32.7%) | $92,276 |
| 65+ Years | 5,416 (19.1%) | $60,363 |
| Total | 28,350 (100.0%) | $77,877 |
Poverty in Franklin County
Income Below Poverty by Sex and Age in Franklin County
With 12.2% poverty level for males and 14.7% for females among the residents of Franklin County, 5 year old males and 25 to 34 year old females are the most vulnerable to poverty, with 389 males (36.5%) and 1,315 females (19.8%) in their respective age groups living below the poverty level.
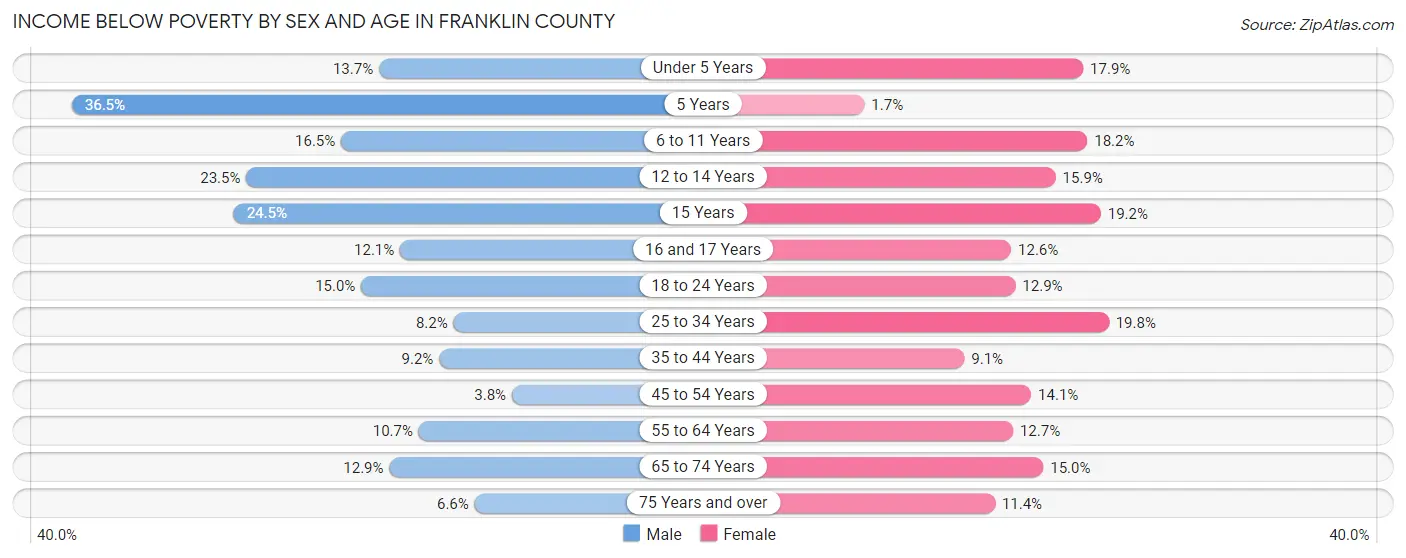
| Age Bracket | Male | Female |
| Under 5 Years | 555 (13.7%) | 692 (17.9%) |
| 5 Years | 389 (36.5%) | 11 (1.7%) |
| 6 to 11 Years | 713 (16.5%) | 964 (18.2%) |
| 12 to 14 Years | 654 (23.5%) | 421 (15.9%) |
| 15 Years | 150 (24.5%) | 169 (19.2%) |
| 16 and 17 Years | 228 (12.1%) | 215 (12.6%) |
| 18 to 24 Years | 765 (15.0%) | 600 (12.9%) |
| 25 to 34 Years | 588 (8.2%) | 1,315 (19.8%) |
| 35 to 44 Years | 626 (9.2%) | 565 (9.1%) |
| 45 to 54 Years | 202 (3.8%) | 705 (14.1%) |
| 55 to 64 Years | 434 (10.7%) | 508 (12.7%) |
| 65 to 74 Years | 407 (12.9%) | 446 (15.0%) |
| 75 Years and over | 89 (6.6%) | 208 (11.4%) |
| Total | 5,800 (12.2%) | 6,819 (14.7%) |
Income Above Poverty by Sex and Age in Franklin County
According to the poverty statistics in Franklin County, males aged 45 to 54 years and females aged 5 years are the age groups that are most secure financially, with 96.2% of males and 98.3% of females in these age groups living above the poverty line.
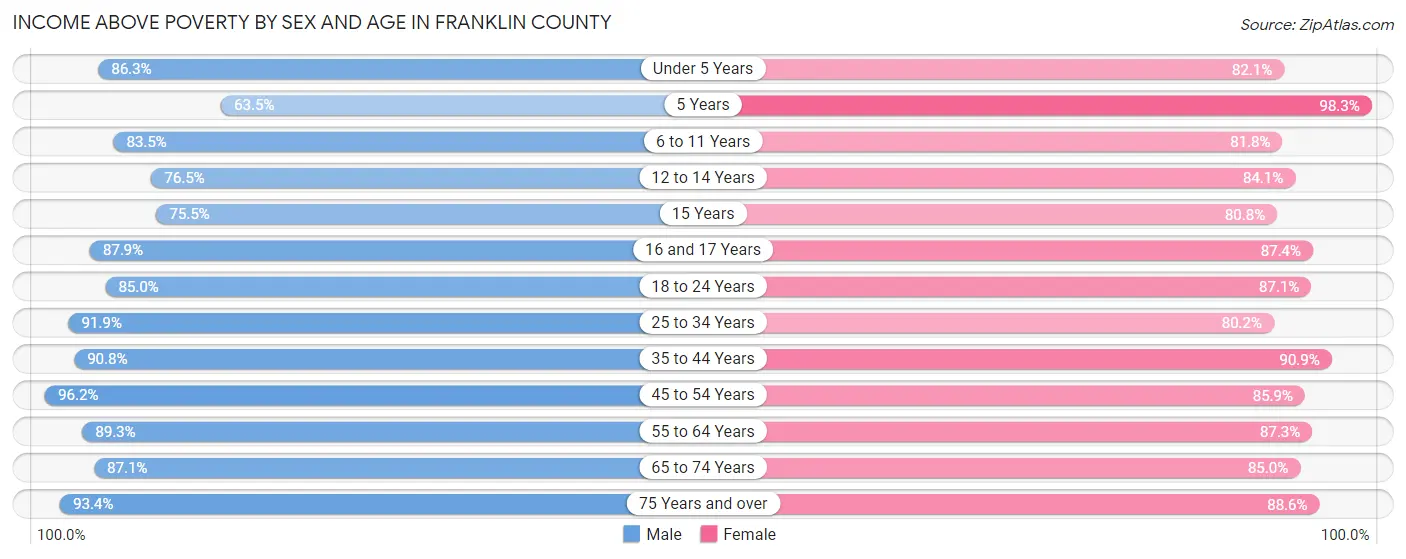
| Age Bracket | Male | Female |
| Under 5 Years | 3,498 (86.3%) | 3,170 (82.1%) |
| 5 Years | 677 (63.5%) | 645 (98.3%) |
| 6 to 11 Years | 3,608 (83.5%) | 4,324 (81.8%) |
| 12 to 14 Years | 2,124 (76.5%) | 2,230 (84.1%) |
| 15 Years | 463 (75.5%) | 710 (80.8%) |
| 16 and 17 Years | 1,653 (87.9%) | 1,496 (87.4%) |
| 18 to 24 Years | 4,330 (85.0%) | 4,056 (87.1%) |
| 25 to 34 Years | 6,631 (91.8%) | 5,319 (80.2%) |
| 35 to 44 Years | 6,165 (90.8%) | 5,646 (90.9%) |
| 45 to 54 Years | 5,088 (96.2%) | 4,309 (85.9%) |
| 55 to 64 Years | 3,612 (89.3%) | 3,489 (87.3%) |
| 65 to 74 Years | 2,743 (87.1%) | 2,535 (85.0%) |
| 75 Years and over | 1,261 (93.4%) | 1,621 (88.6%) |
| Total | 41,853 (87.8%) | 39,550 (85.3%) |
Income Below Poverty Among Married-Couple Families in Franklin County
The poverty statistics for married-couple families in Franklin County show that 5.3% or 816 of the total 15,346 families live below the poverty line. Families with 3 or 4 children have the highest poverty rate of 14.6%, comprising of 328 families. On the other hand, families with 5 or more children have the lowest poverty rate of 1.2%, which includes 4 families.
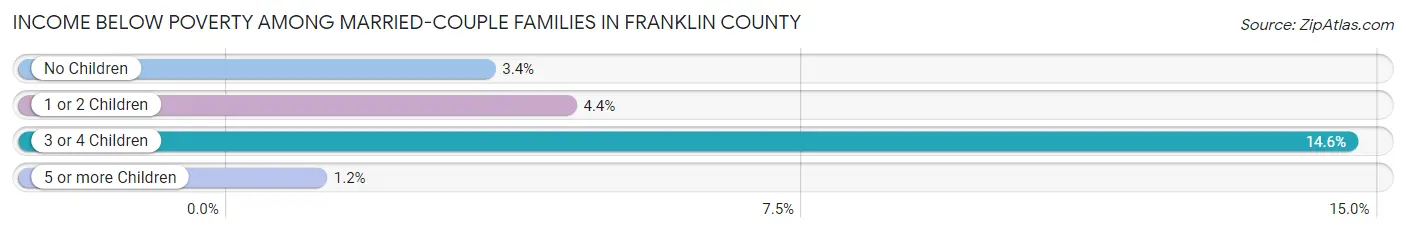
| Children | Above Poverty | Below Poverty |
| No Children | 7,255 (96.6%) | 252 (3.4%) |
| 1 or 2 Children | 5,018 (95.6%) | 232 (4.4%) |
| 3 or 4 Children | 1,916 (85.4%) | 328 (14.6%) |
| 5 or more Children | 341 (98.8%) | 4 (1.2%) |
| Total | 14,530 (94.7%) | 816 (5.3%) |
Income Below Poverty Among Single-Parent Households in Franklin County
According to the poverty data in Franklin County, 5.1% or 106 single-father households and 27.5% or 1,393 single-mother households are living below the poverty line. Among single-father households, those with no children have the highest poverty rate, with 71 households (11.6%) experiencing poverty. Likewise, among single-mother households, those with 5 or more children have the highest poverty rate, with 77 households (70.0%) falling below the poverty line.
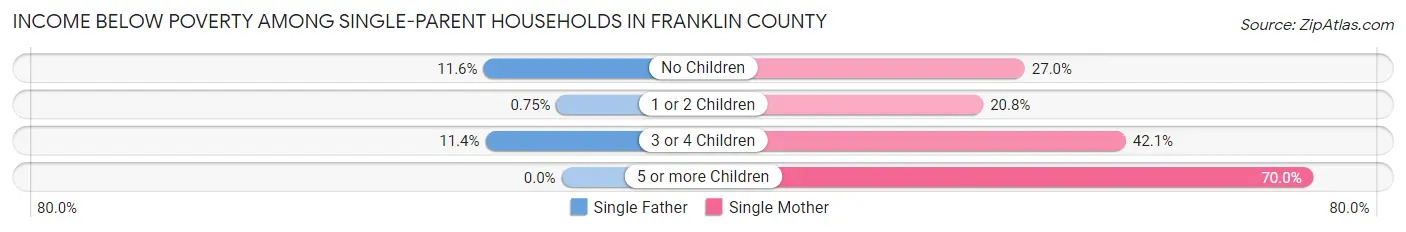
| Children | Single Father | Single Mother |
| No Children | 71 (11.6%) | 277 (27.0%) |
| 1 or 2 Children | 9 (0.7%) | 602 (20.8%) |
| 3 or 4 Children | 26 (11.4%) | 437 (42.1%) |
| 5 or more Children | 0 (0.0%) | 77 (70.0%) |
| Total | 106 (5.1%) | 1,393 (27.5%) |
Income Below Poverty Among Married-Couple vs Single-Parent Households in Franklin County
The poverty data for Franklin County shows that 816 of the married-couple family households (5.3%) and 1,499 of the single-parent households (20.9%) are living below the poverty level. Within the married-couple family households, those with 3 or 4 children have the highest poverty rate, with 328 households (14.6%) falling below the poverty line. Among the single-parent households, those with 5 or more children have the highest poverty rate, with 77 household (45.3%) living below poverty.
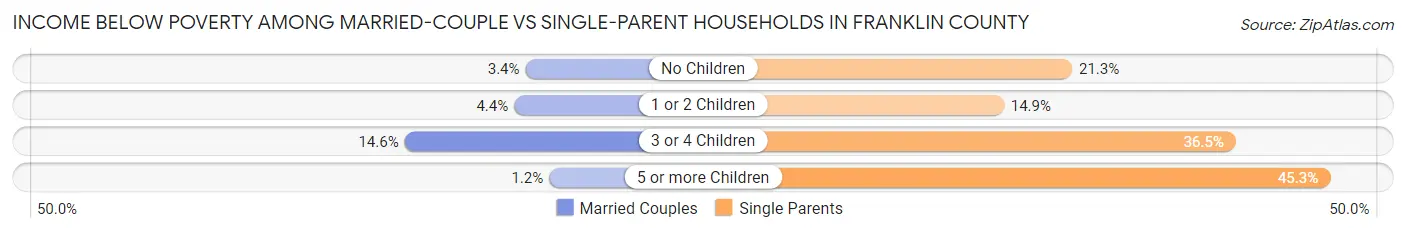
| Children | Married-Couple Families | Single-Parent Households |
| No Children | 252 (3.4%) | 348 (21.3%) |
| 1 or 2 Children | 232 (4.4%) | 611 (14.9%) |
| 3 or 4 Children | 328 (14.6%) | 463 (36.5%) |
| 5 or more Children | 4 (1.2%) | 77 (45.3%) |
| Total | 816 (5.3%) | 1,499 (20.9%) |
Employment Characteristics in Franklin County
Employment by Class of Employer in Franklin County
Among the 42,094 employed individuals in Franklin County, private company employees (28,995 | 68.9%), local government employees (2,861 | 6.8%), and not-for-profit organizations (2,580 | 6.1%) make up the most common classes of employment.
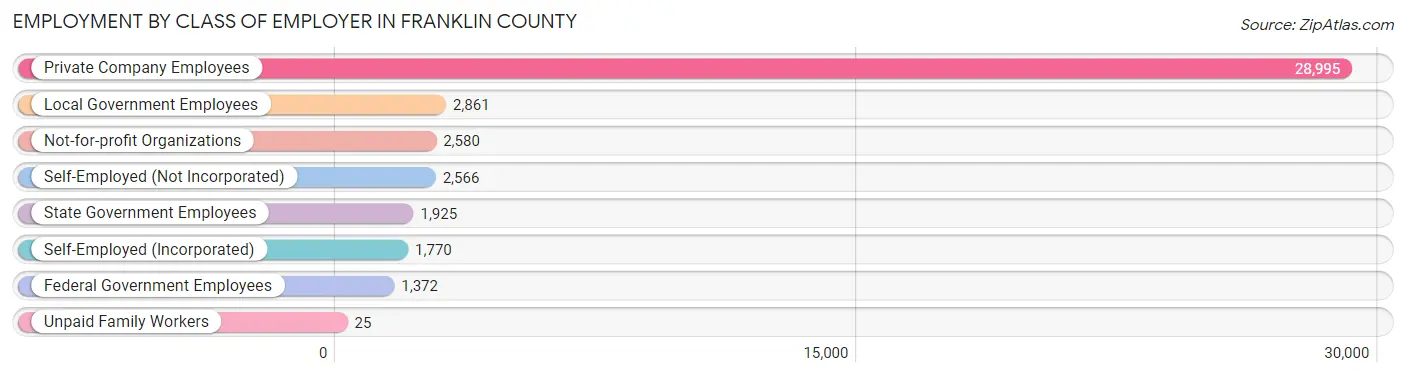
| Employer Class | # Employees | % Employees |
| Private Company Employees | 28,995 | 68.9% |
| Self-Employed (Incorporated) | 1,770 | 4.2% |
| Self-Employed (Not Incorporated) | 2,566 | 6.1% |
| Not-for-profit Organizations | 2,580 | 6.1% |
| Local Government Employees | 2,861 | 6.8% |
| State Government Employees | 1,925 | 4.6% |
| Federal Government Employees | 1,372 | 3.3% |
| Unpaid Family Workers | 25 | 0.1% |
| Total | 42,094 | 100.0% |
Employment Status by Age in Franklin County
According to the labor force statistics for Franklin County, out of the total population over 16 years of age (69,785), 66.3% or 46,267 individuals are in the labor force, with 5.7% or 2,637 of them unemployed. The age group with the highest labor force participation rate is 20 to 24 years, with 85.8% or 5,986 individuals in the labor force. Within the labor force, the 16 to 19 years age range has the highest percentage of unemployed individuals, with 21.6% or 509 of them being unemployed.
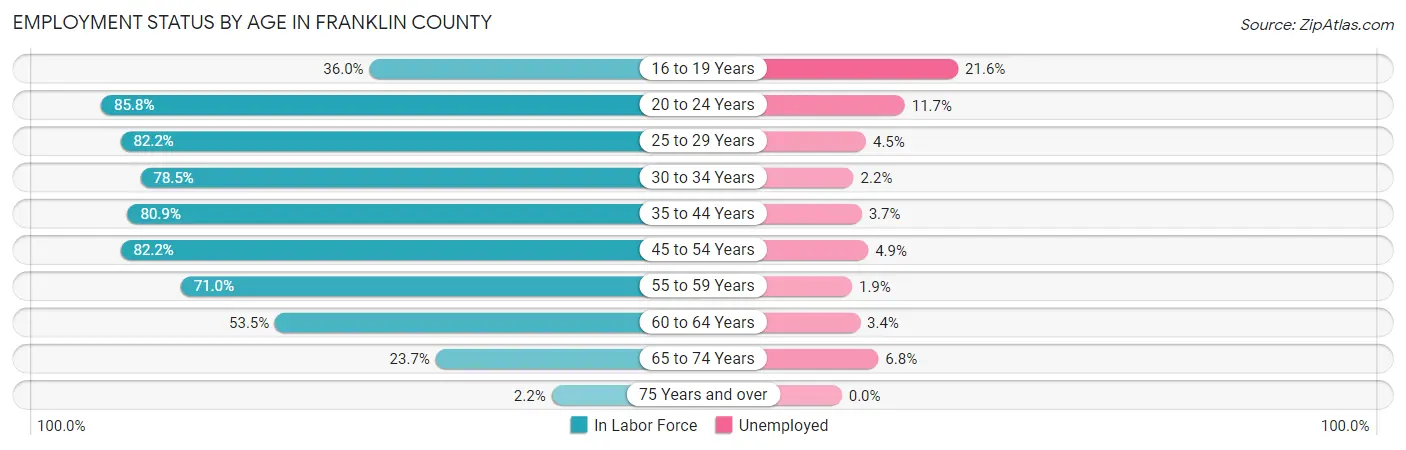
| Age Bracket | In Labor Force | Unemployed |
| 16 to 19 Years | 2,355 (36.0%) | 509 (21.6%) |
| 20 to 24 Years | 5,986 (85.8%) | 700 (11.7%) |
| 25 to 29 Years | 5,645 (82.2%) | 254 (4.5%) |
| 30 to 34 Years | 5,821 (78.5%) | 128 (2.2%) |
| 35 to 44 Years | 10,989 (80.9%) | 407 (3.7%) |
| 45 to 54 Years | 8,679 (82.2%) | 425 (4.9%) |
| 55 to 59 Years | 3,064 (71.0%) | 58 (1.9%) |
| 60 to 64 Years | 2,180 (53.5%) | 74 (3.4%) |
| 65 to 74 Years | 1,464 (23.7%) | 100 (6.8%) |
| 75 Years and over | 72 (2.2%) | 0 (0.0%) |
| Total | 46,267 (66.3%) | 2,637 (5.7%) |
Employment Status by Educational Attainment in Franklin County
According to labor force statistics for Franklin County, 77.7% of individuals (36,374) out of the total population between 25 and 64 years of age (46,814) are in the labor force, with 3.7% or 1,346 of them being unemployed. The group with the highest labor force participation rate are those with the educational attainment of bachelor's degree or higher, with 86.3% or 8,101 individuals in the labor force. Within the labor force, individuals with less than high school education have the highest percentage of unemployment, with 6.4% or 515 of them being unemployed.
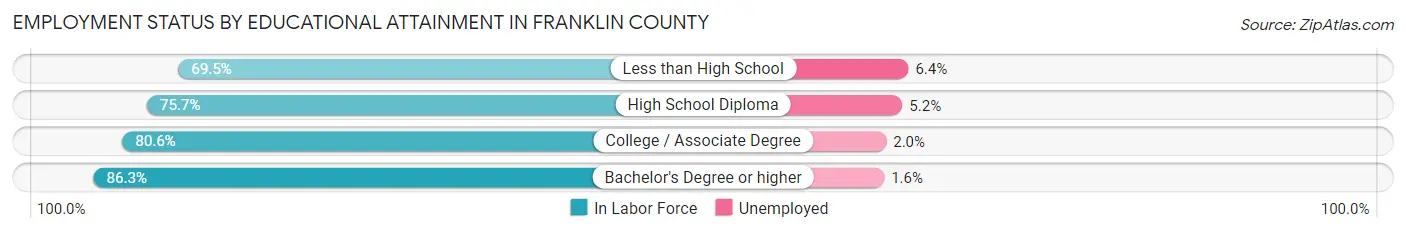
| Educational Attainment | In Labor Force | Unemployed |
| Less than High School | 8,052 (69.5%) | 742 (6.4%) |
| High School Diploma | 9,116 (75.7%) | 626 (5.2%) |
| College / Associate Degree | 11,122 (80.6%) | 276 (2.0%) |
| Bachelor's Degree or higher | 8,101 (86.3%) | 150 (1.6%) |
| Total | 36,374 (77.7%) | 1,732 (3.7%) |
Employment Occupations by Sex in Franklin County
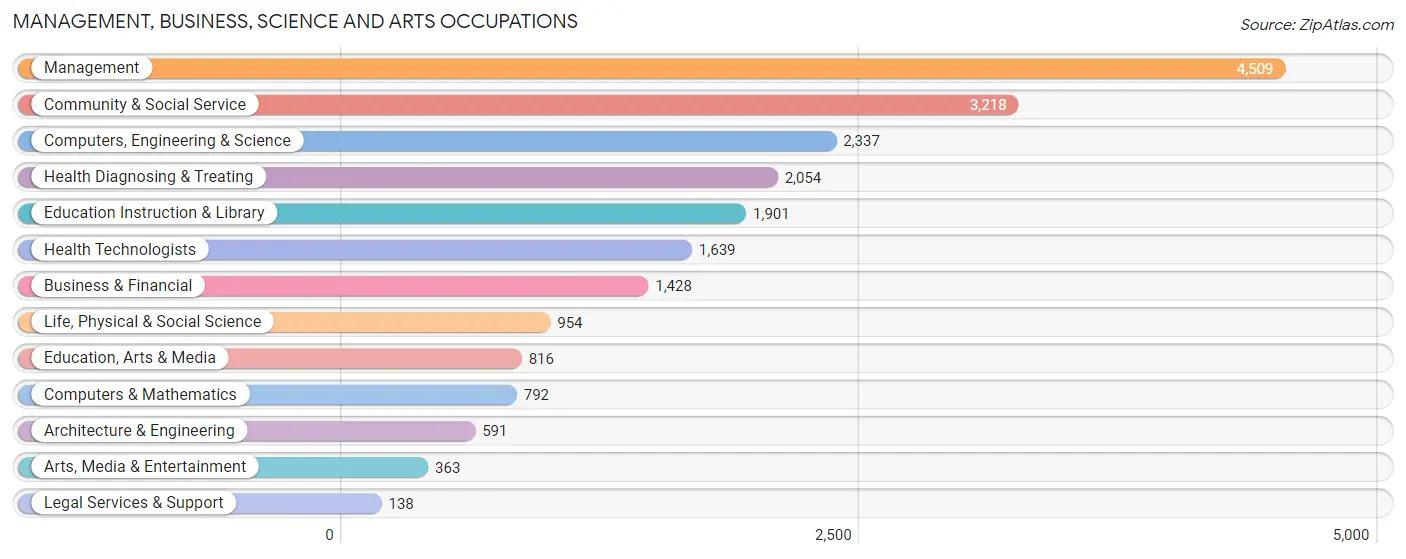
Management, Business, Science and Arts Occupations
The most common Management, Business, Science and Arts occupations in Franklin County are Management (4,509 | 10.4%), Community & Social Service (3,218 | 7.4%), Computers, Engineering & Science (2,337 | 5.4%), Health Diagnosing & Treating (2,054 | 4.7%), and Education Instruction & Library (1,901 | 4.4%).
Management, Business, Science and Arts Occupations by Sex
Within the Management, Business, Science and Arts occupations in Franklin County, the most male-oriented occupations are Architecture & Engineering (85.5%), Legal Services & Support (71.0%), and Management (71.0%), while the most female-oriented occupations are Education Instruction & Library (77.6%), Arts, Media & Entertainment (74.9%), and Community & Social Service (73.7%).
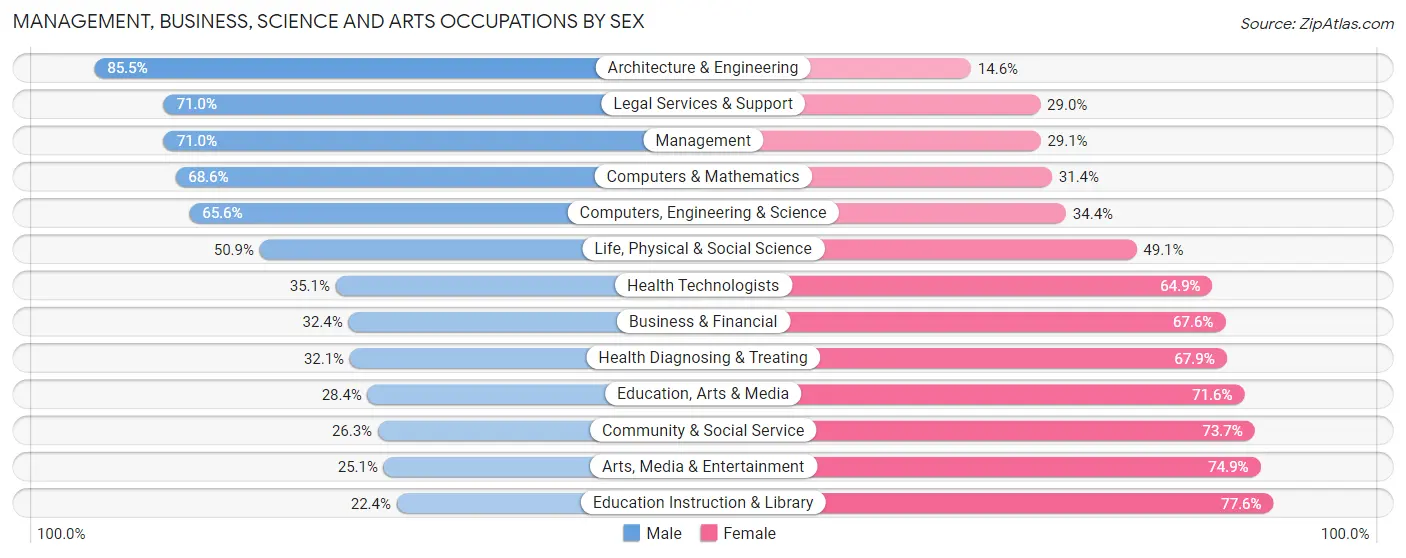
| Occupation | Male | Female |
| Management | 3,199 (71.0%) | 1,310 (29.0%) |
| Business & Financial | 463 (32.4%) | 965 (67.6%) |
| Computers, Engineering & Science | 1,534 (65.6%) | 803 (34.4%) |
| Computers & Mathematics | 543 (68.6%) | 249 (31.4%) |
| Architecture & Engineering | 505 (85.5%) | 86 (14.5%) |
| Life, Physical & Social Science | 486 (50.9%) | 468 (49.1%) |
| Community & Social Service | 846 (26.3%) | 2,372 (73.7%) |
| Education, Arts & Media | 232 (28.4%) | 584 (71.6%) |
| Legal Services & Support | 98 (71.0%) | 40 (29.0%) |
| Education Instruction & Library | 425 (22.4%) | 1,476 (77.6%) |
| Arts, Media & Entertainment | 91 (25.1%) | 272 (74.9%) |
| Health Diagnosing & Treating | 660 (32.1%) | 1,394 (67.9%) |
| Health Technologists | 575 (35.1%) | 1,064 (64.9%) |
| Total (Category) | 6,702 (49.5%) | 6,844 (50.5%) |
| Total (Overall) | 24,293 (55.8%) | 19,202 (44.2%) |
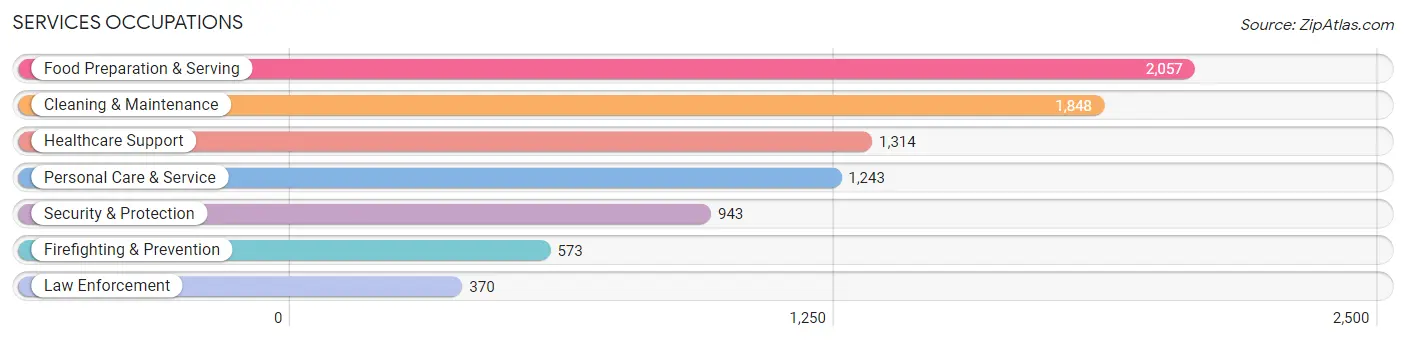
Services Occupations
The most common Services occupations in Franklin County are Food Preparation & Serving (2,057 | 4.7%), Cleaning & Maintenance (1,848 | 4.3%), Healthcare Support (1,314 | 3.0%), Personal Care & Service (1,243 | 2.9%), and Security & Protection (943 | 2.2%).
Services Occupations by Sex
Within the Services occupations in Franklin County, the most male-oriented occupations are Law Enforcement (84.3%), Security & Protection (82.6%), and Firefighting & Prevention (81.5%), while the most female-oriented occupations are Personal Care & Service (92.2%), Healthcare Support (89.6%), and Food Preparation & Serving (67.0%).
| Occupation | Male | Female |
| Healthcare Support | 136 (10.3%) | 1,178 (89.6%) |
| Security & Protection | 779 (82.6%) | 164 (17.4%) |
| Firefighting & Prevention | 467 (81.5%) | 106 (18.5%) |
| Law Enforcement | 312 (84.3%) | 58 (15.7%) |
| Food Preparation & Serving | 679 (33.0%) | 1,378 (67.0%) |
| Cleaning & Maintenance | 1,279 (69.2%) | 569 (30.8%) |
| Personal Care & Service | 97 (7.8%) | 1,146 (92.2%) |
| Total (Category) | 2,970 (40.1%) | 4,435 (59.9%) |
| Total (Overall) | 24,293 (55.8%) | 19,202 (44.2%) |
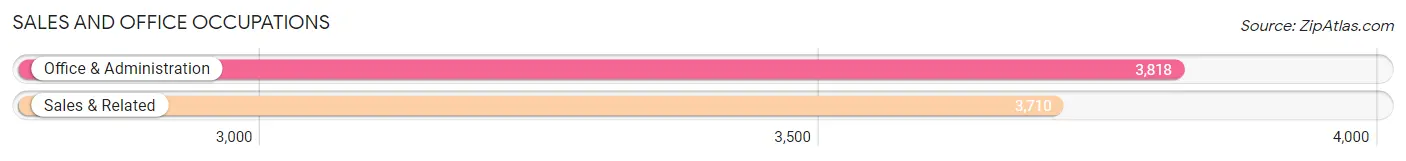
Sales and Office Occupations
The most common Sales and Office occupations in Franklin County are Office & Administration (3,818 | 8.8%), and Sales & Related (3,710 | 8.5%).
Sales and Office Occupations by Sex
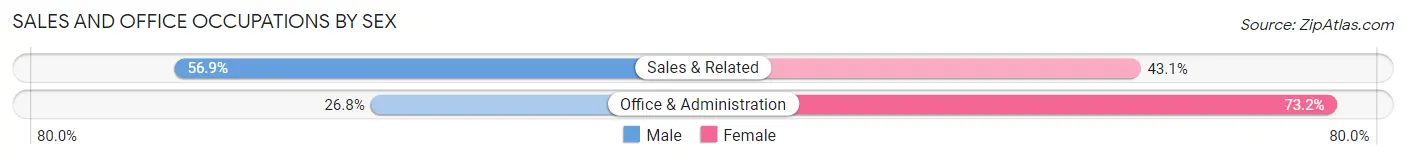
| Occupation | Male | Female |
| Sales & Related | 2,112 (56.9%) | 1,598 (43.1%) |
| Office & Administration | 1,023 (26.8%) | 2,795 (73.2%) |
| Total (Category) | 3,135 (41.6%) | 4,393 (58.4%) |
| Total (Overall) | 24,293 (55.8%) | 19,202 (44.2%) |
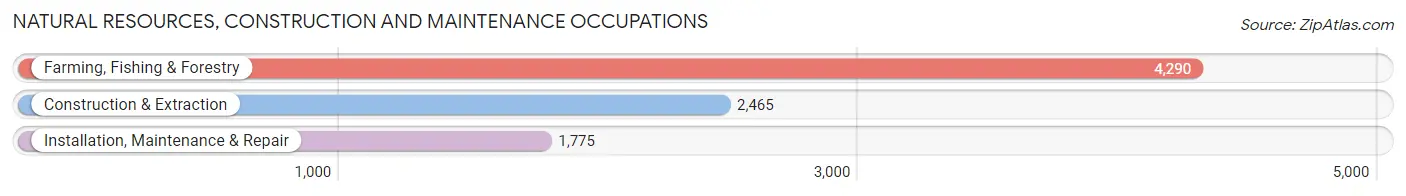
Natural Resources, Construction and Maintenance Occupations
The most common Natural Resources, Construction and Maintenance occupations in Franklin County are Farming, Fishing & Forestry (4,290 | 9.9%), Construction & Extraction (2,465 | 5.7%), and Installation, Maintenance & Repair (1,775 | 4.1%).
Natural Resources, Construction and Maintenance Occupations by Sex
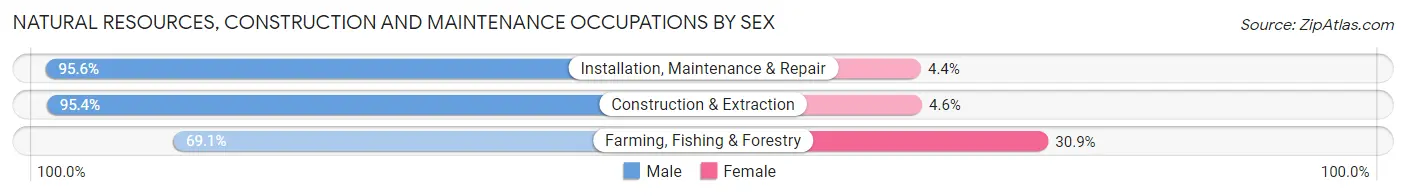
| Occupation | Male | Female |
| Farming, Fishing & Forestry | 2,965 (69.1%) | 1,325 (30.9%) |
| Construction & Extraction | 2,351 (95.4%) | 114 (4.6%) |
| Installation, Maintenance & Repair | 1,697 (95.6%) | 78 (4.4%) |
| Total (Category) | 7,013 (82.2%) | 1,517 (17.8%) |
| Total (Overall) | 24,293 (55.8%) | 19,202 (44.2%) |
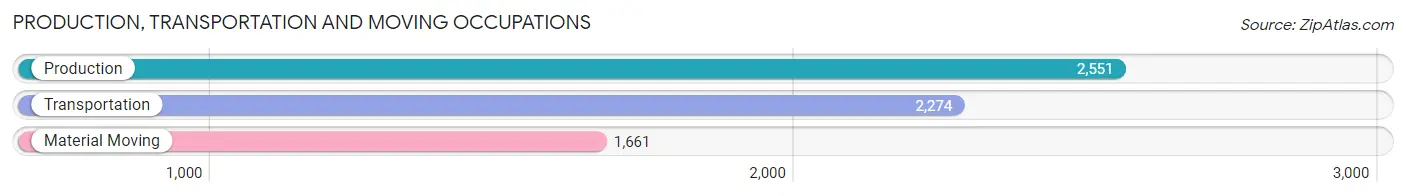
Production, Transportation and Moving Occupations
The most common Production, Transportation and Moving occupations in Franklin County are Production (2,551 | 5.9%), Transportation (2,274 | 5.2%), and Material Moving (1,661 | 3.8%).
Production, Transportation and Moving Occupations by Sex
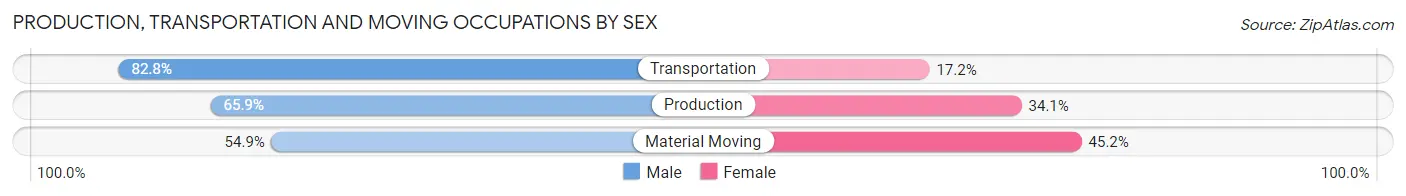
| Occupation | Male | Female |
| Production | 1,680 (65.9%) | 871 (34.1%) |
| Transportation | 1,882 (82.8%) | 392 (17.2%) |
| Material Moving | 911 (54.8%) | 750 (45.2%) |
| Total (Category) | 4,473 (69.0%) | 2,013 (31.0%) |
| Total (Overall) | 24,293 (55.8%) | 19,202 (44.2%) |
Employment Industries by Sex in Franklin County
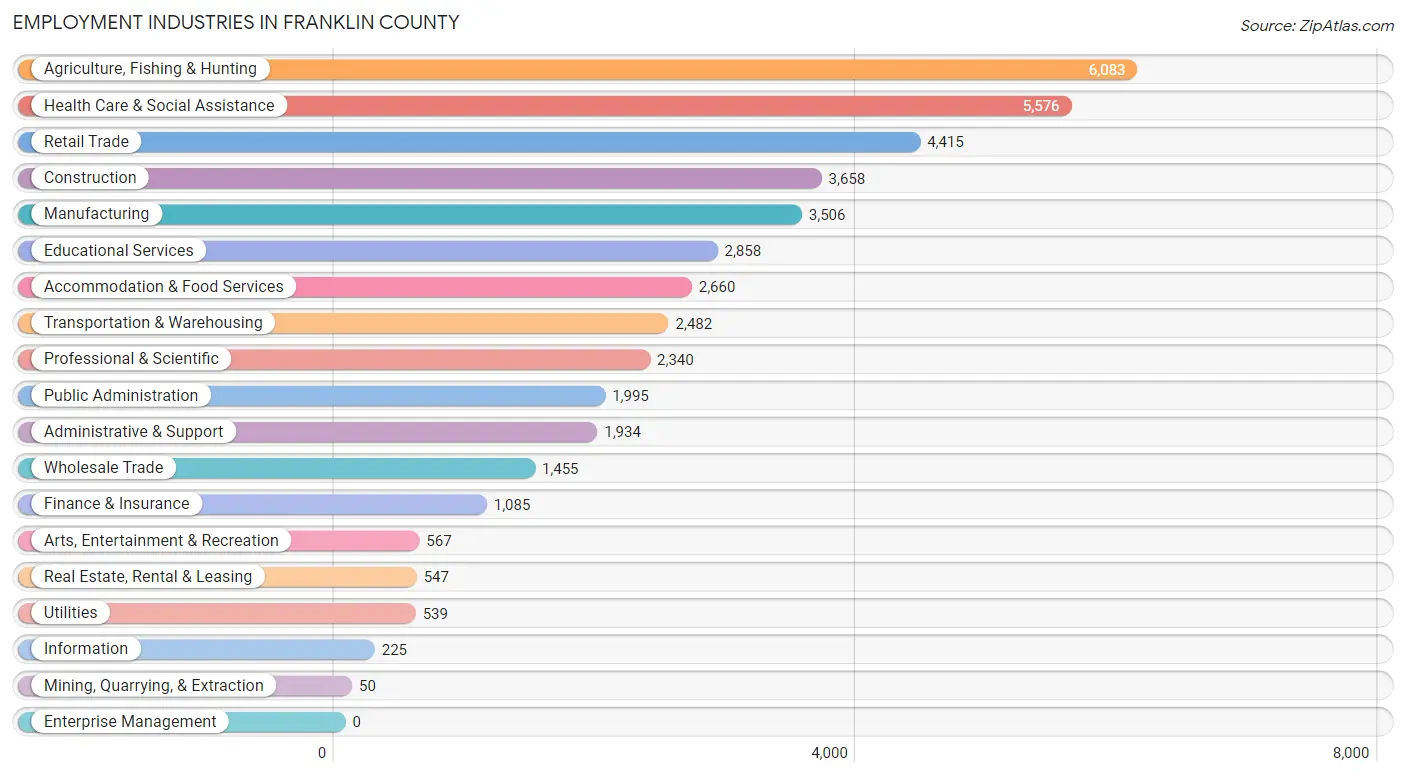
Employment Industries in Franklin County
The major employment industries in Franklin County include Agriculture, Fishing & Hunting (6,083 | 14.0%), Health Care & Social Assistance (5,576 | 12.8%), Retail Trade (4,415 | 10.2%), Construction (3,658 | 8.4%), and Manufacturing (3,506 | 8.1%).
Employment Industries by Sex in Franklin County
The Franklin County industries that see more men than women are Mining, Quarrying, & Extraction (100.0%), Construction (89.7%), and Information (88.4%), whereas the industries that tend to have a higher number of women are Health Care & Social Assistance (84.5%), Educational Services (76.4%), and Finance & Insurance (74.0%).
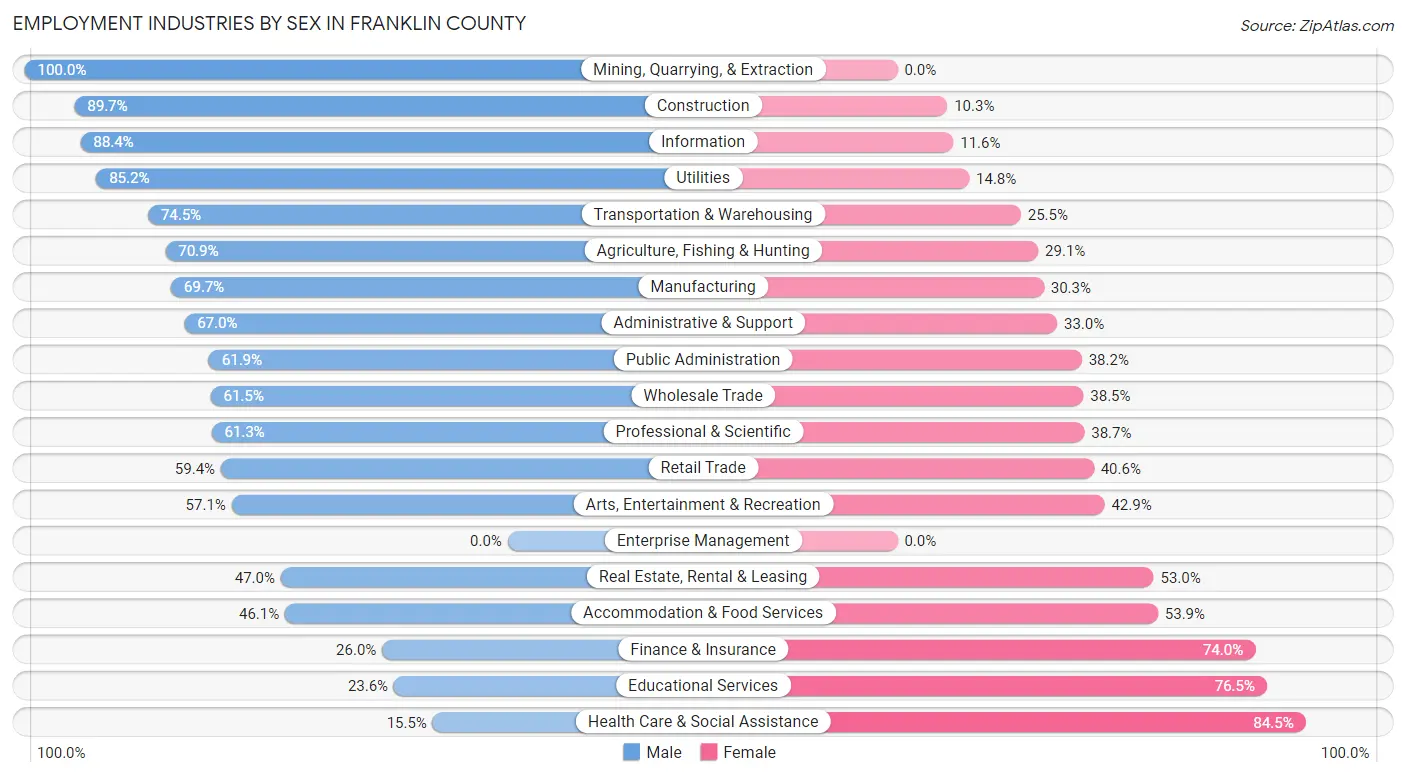
| Industry | Male | Female |
| Agriculture, Fishing & Hunting | 4,311 (70.9%) | 1,772 (29.1%) |
| Mining, Quarrying, & Extraction | 50 (100.0%) | 0 (0.0%) |
| Construction | 3,281 (89.7%) | 377 (10.3%) |
| Manufacturing | 2,444 (69.7%) | 1,062 (30.3%) |
| Wholesale Trade | 895 (61.5%) | 560 (38.5%) |
| Retail Trade | 2,621 (59.4%) | 1,794 (40.6%) |
| Transportation & Warehousing | 1,848 (74.5%) | 634 (25.5%) |
| Utilities | 459 (85.2%) | 80 (14.8%) |
| Information | 199 (88.4%) | 26 (11.6%) |
| Finance & Insurance | 282 (26.0%) | 803 (74.0%) |
| Real Estate, Rental & Leasing | 257 (47.0%) | 290 (53.0%) |
| Professional & Scientific | 1,435 (61.3%) | 905 (38.7%) |
| Enterprise Management | 0 (0.0%) | 0 (0.0%) |
| Administrative & Support | 1,295 (67.0%) | 639 (33.0%) |
| Educational Services | 673 (23.5%) | 2,185 (76.4%) |
| Health Care & Social Assistance | 866 (15.5%) | 4,710 (84.5%) |
| Arts, Entertainment & Recreation | 324 (57.1%) | 243 (42.9%) |
| Accommodation & Food Services | 1,226 (46.1%) | 1,434 (53.9%) |
| Public Administration | 1,234 (61.9%) | 761 (38.2%) |
| Total | 24,293 (55.8%) | 19,202 (44.2%) |
Education in Franklin County
School Enrollment in Franklin County
The most common levels of schooling among the 28,006 students in Franklin County are middle school (7,803 | 27.9%), high school (6,598 | 23.6%), and elementary school (5,589 | 20.0%).
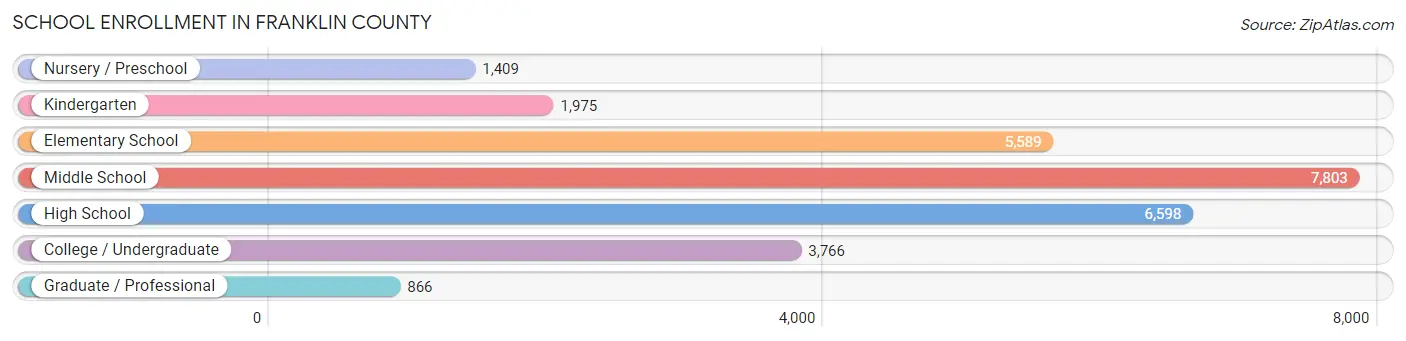
| School Level | # Students | % Students |
| Nursery / Preschool | 1,409 | 5.0% |
| Kindergarten | 1,975 | 7.0% |
| Elementary School | 5,589 | 20.0% |
| Middle School | 7,803 | 27.9% |
| High School | 6,598 | 23.6% |
| College / Undergraduate | 3,766 | 13.5% |
| Graduate / Professional | 866 | 3.1% |
| Total | 28,006 | 100.0% |
School Enrollment by Age by Funding Source in Franklin County
Out of a total of 28,006 students who are enrolled in schools in Franklin County, 2,661 (9.5%) attend a private institution, while the remaining 25,345 (90.5%) are enrolled in public schools. The age group of 3 to 4 year olds has the highest likelihood of being enrolled in private schools, with 492 (42.0% in the age bracket) enrolled. Conversely, the age group of 18 to 19 year olds has the lowest likelihood of being enrolled in a private school, with 1,634 (98.6% in the age bracket) attending a public institution.
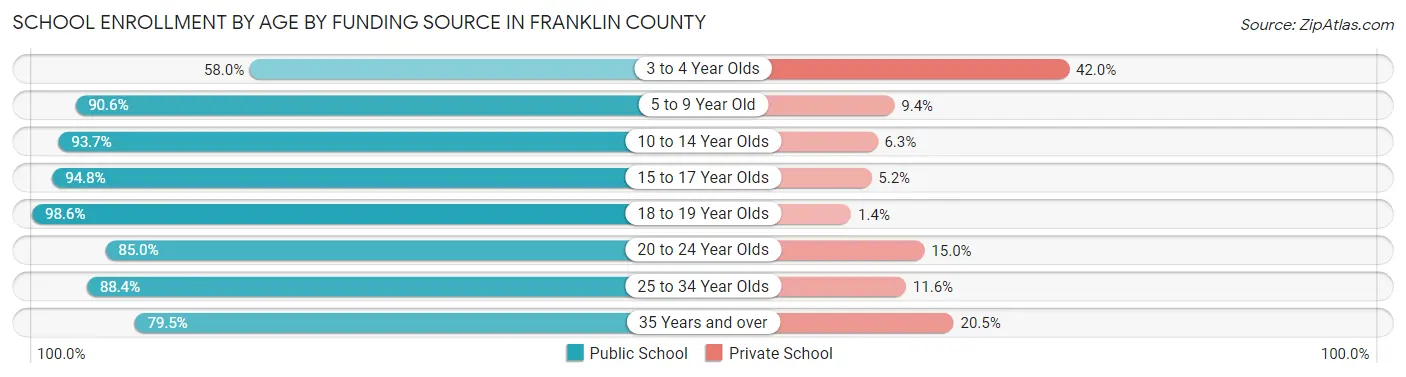
| Age Bracket | Public School | Private School |
| 3 to 4 Year Olds | 680 (58.0%) | 492 (42.0%) |
| 5 to 9 Year Old | 6,111 (90.6%) | 637 (9.4%) |
| 10 to 14 Year Olds | 8,697 (93.7%) | 584 (6.3%) |
| 15 to 17 Year Olds | 4,799 (94.8%) | 261 (5.2%) |
| 18 to 19 Year Olds | 1,634 (98.6%) | 23 (1.4%) |
| 20 to 24 Year Olds | 1,282 (85.0%) | 227 (15.0%) |
| 25 to 34 Year Olds | 915 (88.4%) | 120 (11.6%) |
| 35 Years and over | 1,228 (79.5%) | 316 (20.5%) |
| Total | 25,345 (90.5%) | 2,661 (9.5%) |
Educational Attainment by Field of Study in Franklin County
Business (1,966 | 15.6%), science & technology (1,907 | 15.1%), education (1,747 | 13.9%), bio, nature & agricultural (1,359 | 10.8%), and psychology (721 | 5.7%) are the most common fields of study among 12,596 individuals in Franklin County who have obtained a bachelor's degree or higher.
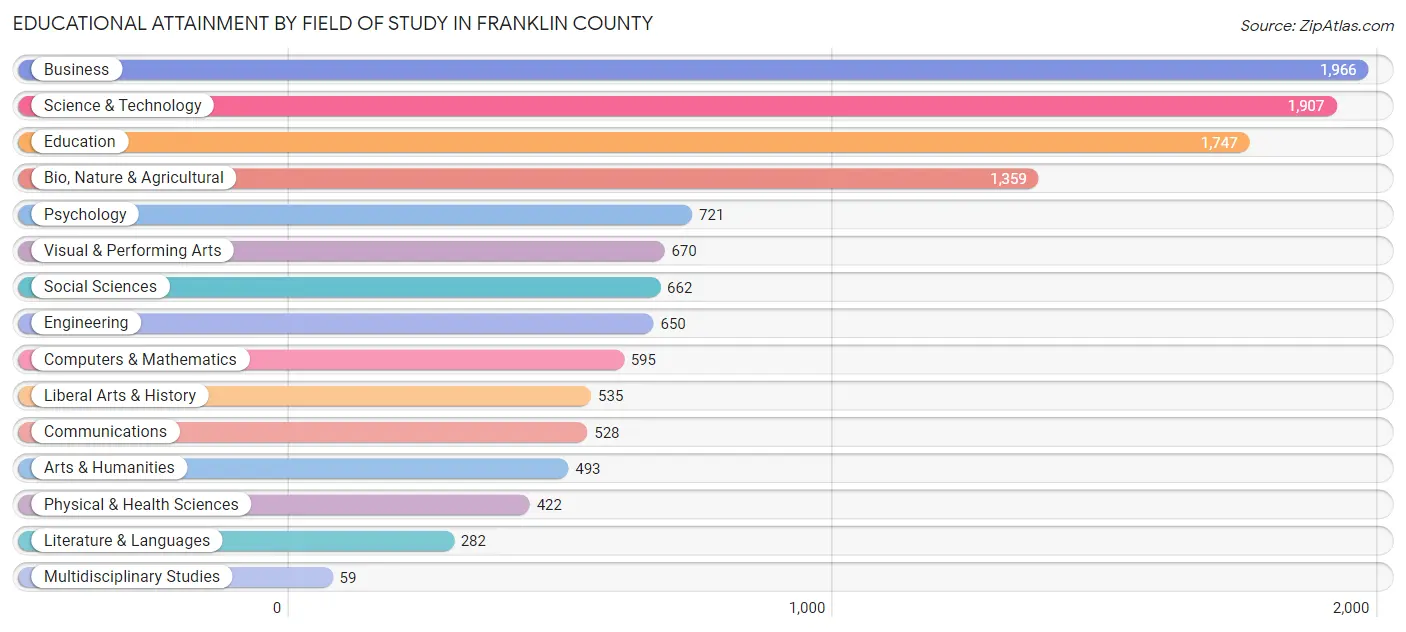
| Field of Study | # Graduates | % Graduates |
| Computers & Mathematics | 595 | 4.7% |
| Bio, Nature & Agricultural | 1,359 | 10.8% |
| Physical & Health Sciences | 422 | 3.4% |
| Psychology | 721 | 5.7% |
| Social Sciences | 662 | 5.3% |
| Engineering | 650 | 5.2% |
| Multidisciplinary Studies | 59 | 0.5% |
| Science & Technology | 1,907 | 15.1% |
| Business | 1,966 | 15.6% |
| Education | 1,747 | 13.9% |
| Literature & Languages | 282 | 2.2% |
| Liberal Arts & History | 535 | 4.3% |
| Visual & Performing Arts | 670 | 5.3% |
| Communications | 528 | 4.2% |
| Arts & Humanities | 493 | 3.9% |
| Total | 12,596 | 100.0% |
Transportation & Commute in Franklin County
Vehicle Availability by Sex in Franklin County
The most prevalent vehicle ownership categories in Franklin County are males with 2 vehicles (7,409, accounting for 31.9%) and females with 2 vehicles (5,949, making up 39.8%).
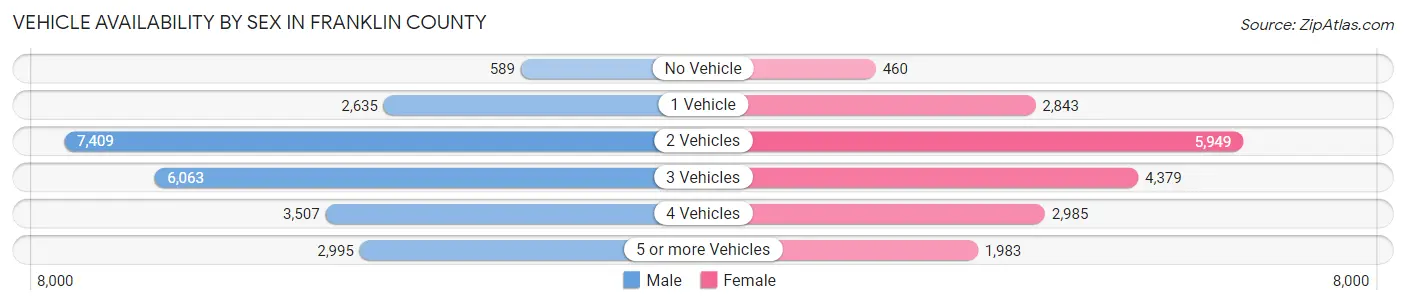
| Vehicles Available | Male | Female |
| No Vehicle | 589 (2.5%) | 460 (2.5%) |
| 1 Vehicle | 2,635 (11.4%) | 2,843 (15.3%) |
| 2 Vehicles | 7,409 (31.9%) | 5,949 (32.0%) |
| 3 Vehicles | 6,063 (26.1%) | 4,379 (23.5%) |
| 4 Vehicles | 3,507 (15.1%) | 2,985 (16.1%) |
| 5 or more Vehicles | 2,995 (12.9%) | 1,983 (10.7%) |
| Total | 23,198 (100.0%) | 18,599 (100.0%) |
Commute Time in Franklin County
The most frequently occuring commute durations in Franklin County are 15 to 19 minutes (10,307 commuters, 26.1%), 20 to 24 minutes (6,126 commuters, 15.5%), and 10 to 14 minutes (5,540 commuters, 14.0%).
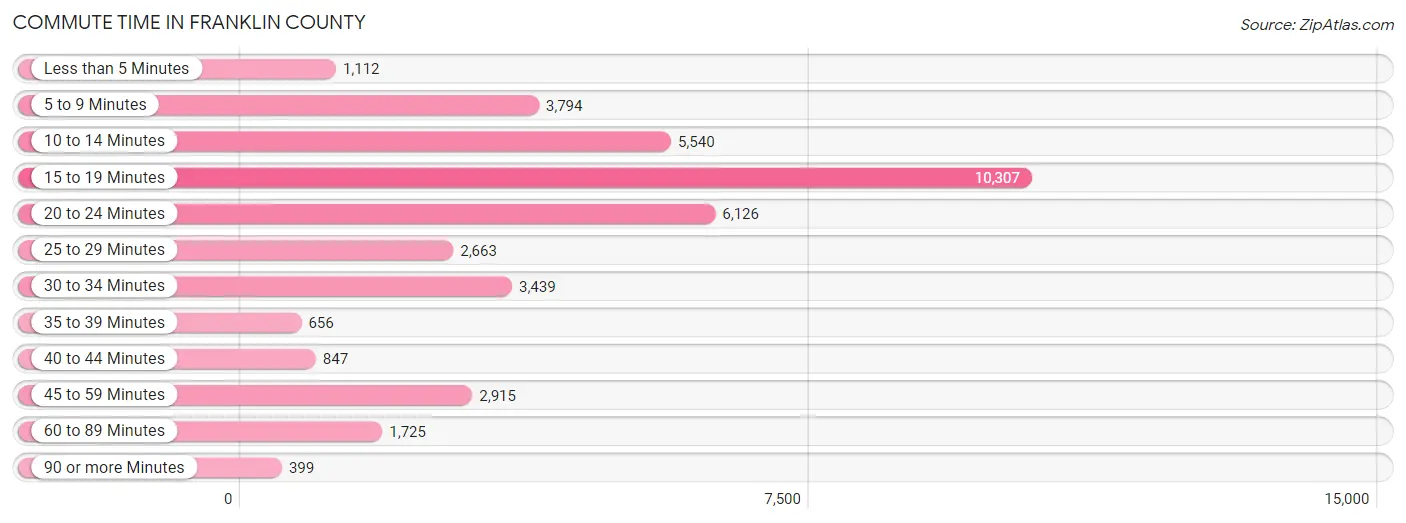
| Commute Time | # Commuters | % Commuters |
| Less than 5 Minutes | 1,112 | 2.8% |
| 5 to 9 Minutes | 3,794 | 9.6% |
| 10 to 14 Minutes | 5,540 | 14.0% |
| 15 to 19 Minutes | 10,307 | 26.1% |
| 20 to 24 Minutes | 6,126 | 15.5% |
| 25 to 29 Minutes | 2,663 | 6.7% |
| 30 to 34 Minutes | 3,439 | 8.7% |
| 35 to 39 Minutes | 656 | 1.7% |
| 40 to 44 Minutes | 847 | 2.1% |
| 45 to 59 Minutes | 2,915 | 7.4% |
| 60 to 89 Minutes | 1,725 | 4.4% |
| 90 or more Minutes | 399 | 1.0% |
Commute Time by Sex in Franklin County
The most common commute times in Franklin County are 15 to 19 minutes (5,002 commuters, 22.5%) for males and 15 to 19 minutes (5,305 commuters, 30.7%) for females.
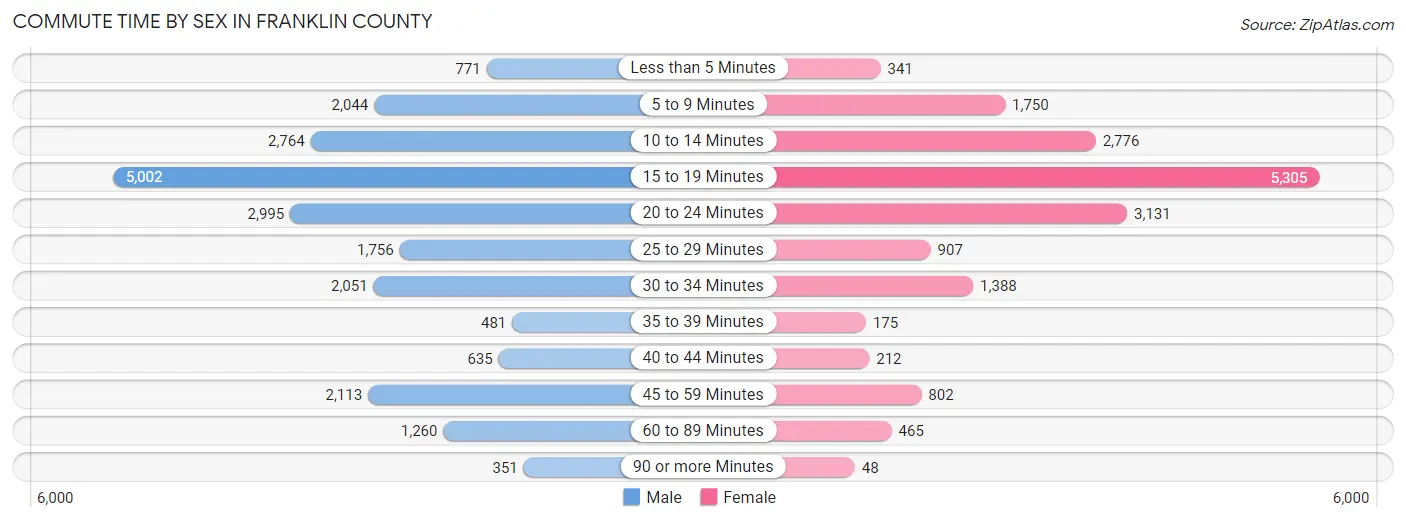
| Commute Time | Male | Female |
| Less than 5 Minutes | 771 (3.5%) | 341 (2.0%) |
| 5 to 9 Minutes | 2,044 (9.2%) | 1,750 (10.1%) |
| 10 to 14 Minutes | 2,764 (12.4%) | 2,776 (16.1%) |
| 15 to 19 Minutes | 5,002 (22.5%) | 5,305 (30.7%) |
| 20 to 24 Minutes | 2,995 (13.5%) | 3,131 (18.1%) |
| 25 to 29 Minutes | 1,756 (7.9%) | 907 (5.2%) |
| 30 to 34 Minutes | 2,051 (9.2%) | 1,388 (8.0%) |
| 35 to 39 Minutes | 481 (2.2%) | 175 (1.0%) |
| 40 to 44 Minutes | 635 (2.9%) | 212 (1.2%) |
| 45 to 59 Minutes | 2,113 (9.5%) | 802 (4.6%) |
| 60 to 89 Minutes | 1,260 (5.7%) | 465 (2.7%) |
| 90 or more Minutes | 351 (1.6%) | 48 (0.3%) |
Time of Departure to Work by Sex in Franklin County
The most frequent times of departure to work in Franklin County are 7:00 AM to 7:29 AM (3,351, 15.1%) for males and 7:00 AM to 7:29 AM (3,023, 17.5%) for females.
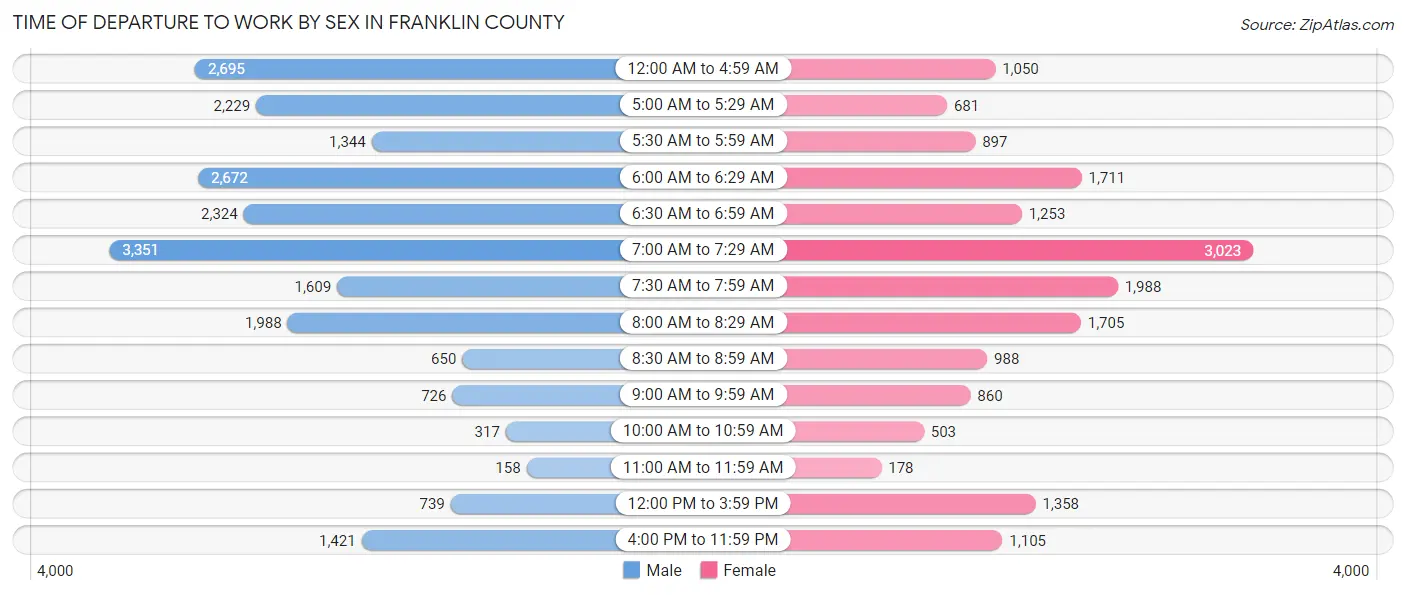
| Time of Departure | Male | Female |
| 12:00 AM to 4:59 AM | 2,695 (12.1%) | 1,050 (6.1%) |
| 5:00 AM to 5:29 AM | 2,229 (10.0%) | 681 (3.9%) |
| 5:30 AM to 5:59 AM | 1,344 (6.0%) | 897 (5.2%) |
| 6:00 AM to 6:29 AM | 2,672 (12.0%) | 1,711 (9.9%) |
| 6:30 AM to 6:59 AM | 2,324 (10.5%) | 1,253 (7.2%) |
| 7:00 AM to 7:29 AM | 3,351 (15.1%) | 3,023 (17.5%) |
| 7:30 AM to 7:59 AM | 1,609 (7.2%) | 1,988 (11.5%) |
| 8:00 AM to 8:29 AM | 1,988 (8.9%) | 1,705 (9.9%) |
| 8:30 AM to 8:59 AM | 650 (2.9%) | 988 (5.7%) |
| 9:00 AM to 9:59 AM | 726 (3.3%) | 860 (5.0%) |
| 10:00 AM to 10:59 AM | 317 (1.4%) | 503 (2.9%) |
| 11:00 AM to 11:59 AM | 158 (0.7%) | 178 (1.0%) |
| 12:00 PM to 3:59 PM | 739 (3.3%) | 1,358 (7.9%) |
| 4:00 PM to 11:59 PM | 1,421 (6.4%) | 1,105 (6.4%) |
| Total | 22,223 (100.0%) | 17,300 (100.0%) |
Housing Occupancy in Franklin County
Occupancy by Ownership in Franklin County
Of the total 28,350 dwellings in Franklin County, owner-occupied units account for 19,824 (69.9%), while renter-occupied units make up 8,526 (30.1%).
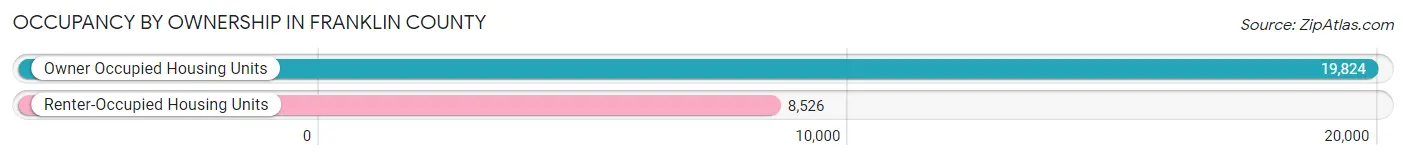
| Occupancy | # Housing Units | % Housing Units |
| Owner Occupied Housing Units | 19,824 | 69.9% |
| Renter-Occupied Housing Units | 8,526 | 30.1% |
| Total Occupied Housing Units | 28,350 | 100.0% |
Occupancy by Household Size in Franklin County
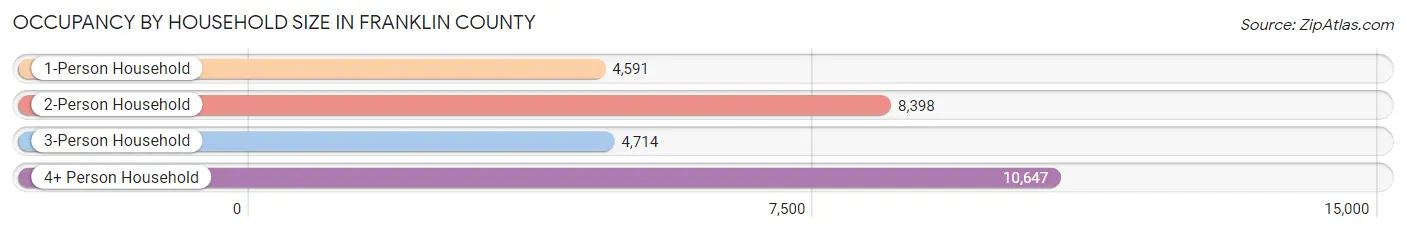
| Household Size | # Housing Units | % Housing Units |
| 1-Person Household | 4,591 | 16.2% |
| 2-Person Household | 8,398 | 29.6% |
| 3-Person Household | 4,714 | 16.6% |
| 4+ Person Household | 10,647 | 37.6% |
| Total Housing Units | 28,350 | 100.0% |
Occupancy by Ownership by Household Size in Franklin County
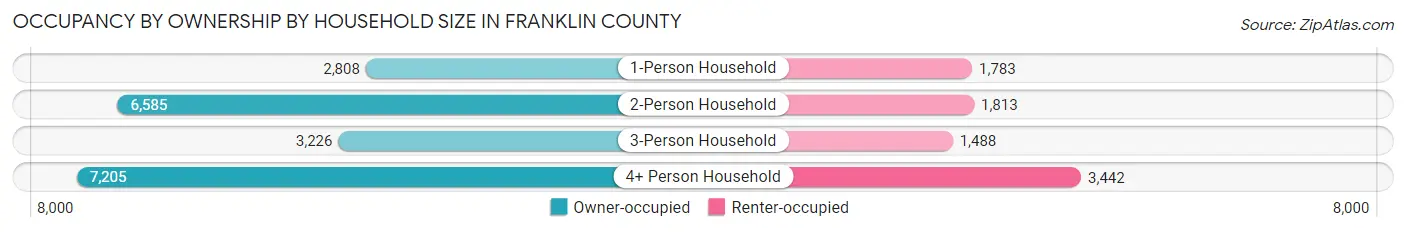
| Household Size | Owner-occupied | Renter-occupied |
| 1-Person Household | 2,808 (61.2%) | 1,783 (38.8%) |
| 2-Person Household | 6,585 (78.4%) | 1,813 (21.6%) |
| 3-Person Household | 3,226 (68.4%) | 1,488 (31.6%) |
| 4+ Person Household | 7,205 (67.7%) | 3,442 (32.3%) |
| Total Housing Units | 19,824 (69.9%) | 8,526 (30.1%) |
Occupancy by Educational Attainment in Franklin County
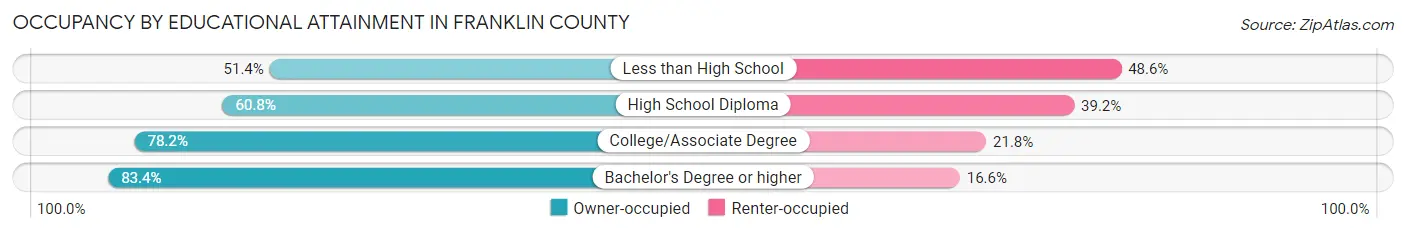
| Household Size | Owner-occupied | Renter-occupied |
| Less than High School | 2,924 (51.4%) | 2,763 (48.6%) |
| High School Diploma | 4,099 (60.8%) | 2,647 (39.2%) |
| College/Associate Degree | 7,151 (78.2%) | 1,993 (21.8%) |
| Bachelor's Degree or higher | 5,650 (83.4%) | 1,123 (16.6%) |
Occupancy by Age of Householder in Franklin County
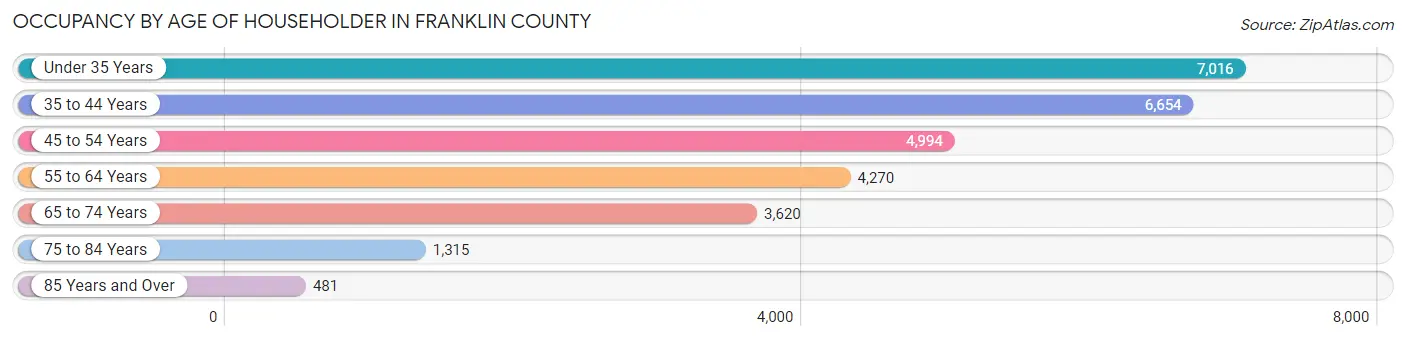
| Age Bracket | # Households | % Households |
| Under 35 Years | 7,016 | 24.7% |
| 35 to 44 Years | 6,654 | 23.5% |
| 45 to 54 Years | 4,994 | 17.6% |
| 55 to 64 Years | 4,270 | 15.1% |
| 65 to 74 Years | 3,620 | 12.8% |
| 75 to 84 Years | 1,315 | 4.6% |
| 85 Years and Over | 481 | 1.7% |
| Total | 28,350 | 100.0% |
Housing Finances in Franklin County
Median Income by Occupancy in Franklin County
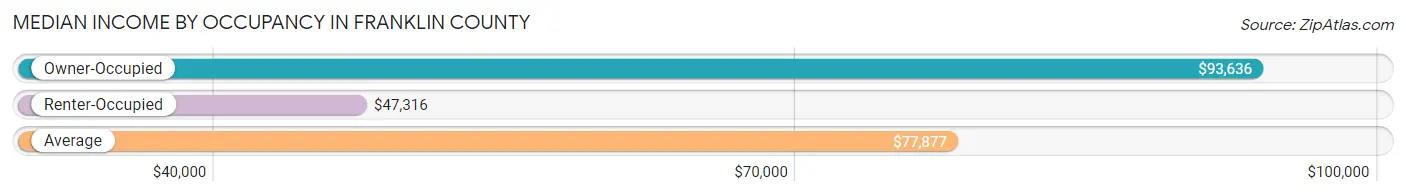
| Occupancy Type | # Households | Median Income |
| Owner-Occupied | 19,824 (69.9%) | $93,636 |
| Renter-Occupied | 8,526 (30.1%) | $47,316 |
| Average | 28,350 (100.0%) | $77,877 |
Occupancy by Householder Income Bracket in Franklin County
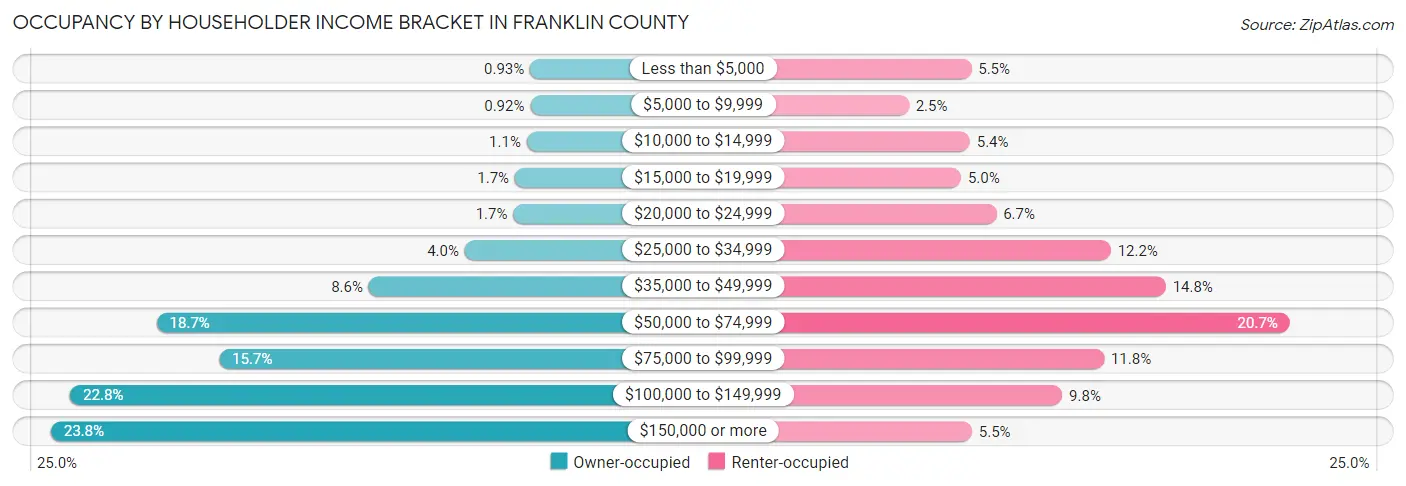
| Income Bracket | Owner-occupied | Renter-occupied |
| Less than $5,000 | 184 (0.9%) | 470 (5.5%) |
| $5,000 to $9,999 | 182 (0.9%) | 216 (2.5%) |
| $10,000 to $14,999 | 216 (1.1%) | 464 (5.4%) |
| $15,000 to $19,999 | 327 (1.7%) | 428 (5.0%) |
| $20,000 to $24,999 | 342 (1.7%) | 571 (6.7%) |
| $25,000 to $34,999 | 800 (4.0%) | 1,036 (12.1%) |
| $35,000 to $49,999 | 1,707 (8.6%) | 1,259 (14.8%) |
| $50,000 to $74,999 | 3,711 (18.7%) | 1,762 (20.7%) |
| $75,000 to $99,999 | 3,120 (15.7%) | 1,009 (11.8%) |
| $100,000 to $149,999 | 4,526 (22.8%) | 839 (9.8%) |
| $150,000 or more | 4,709 (23.7%) | 472 (5.5%) |
| Total | 19,824 (100.0%) | 8,526 (100.0%) |
Monthly Housing Cost Tiers in Franklin County
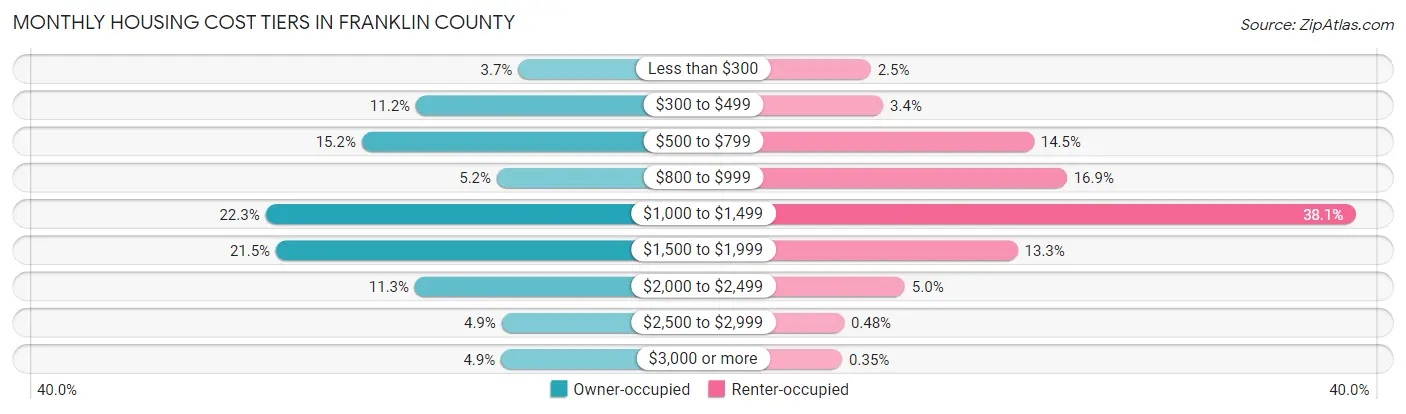
| Monthly Cost | Owner-occupied | Renter-occupied |
| Less than $300 | 723 (3.6%) | 209 (2.5%) |
| $300 to $499 | 2,216 (11.2%) | 287 (3.4%) |
| $500 to $799 | 3,007 (15.2%) | 1,233 (14.5%) |
| $800 to $999 | 1,034 (5.2%) | 1,440 (16.9%) |
| $1,000 to $1,499 | 4,412 (22.3%) | 3,251 (38.1%) |
| $1,500 to $1,999 | 4,261 (21.5%) | 1,131 (13.3%) |
| $2,000 to $2,499 | 2,232 (11.3%) | 424 (5.0%) |
| $2,500 to $2,999 | 966 (4.9%) | 41 (0.5%) |
| $3,000 or more | 973 (4.9%) | 30 (0.4%) |
| Total | 19,824 (100.0%) | 8,526 (100.0%) |
Physical Housing Characteristics in Franklin County
Housing Structures in Franklin County
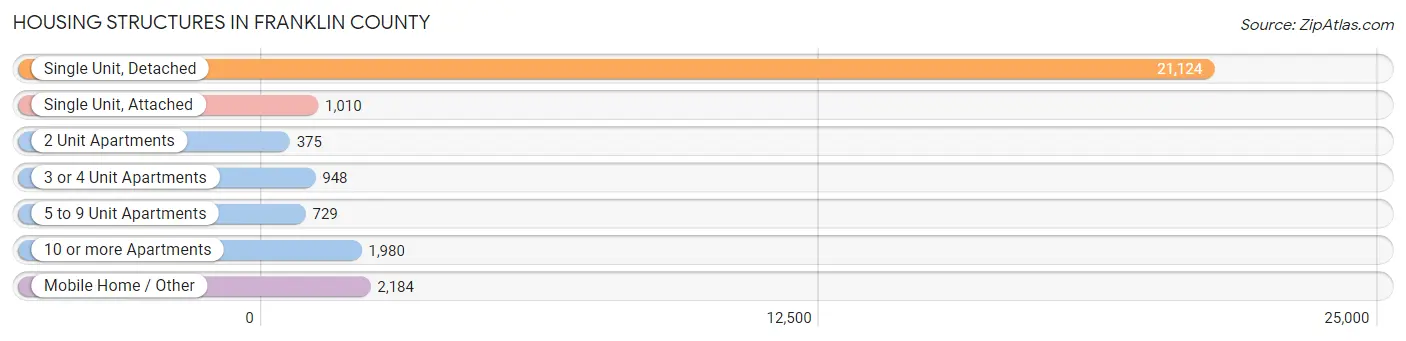
| Structure Type | # Housing Units | % Housing Units |
| Single Unit, Detached | 21,124 | 74.5% |
| Single Unit, Attached | 1,010 | 3.6% |
| 2 Unit Apartments | 375 | 1.3% |
| 3 or 4 Unit Apartments | 948 | 3.3% |
| 5 to 9 Unit Apartments | 729 | 2.6% |
| 10 or more Apartments | 1,980 | 7.0% |
| Mobile Home / Other | 2,184 | 7.7% |
| Total | 28,350 | 100.0% |
Housing Structures by Occupancy in Franklin County
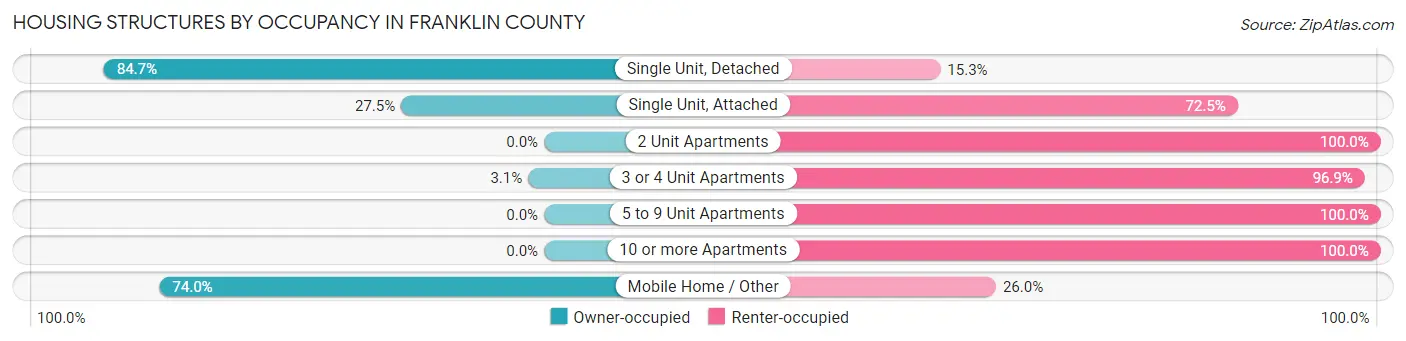
| Structure Type | Owner-occupied | Renter-occupied |
| Single Unit, Detached | 17,900 (84.7%) | 3,224 (15.3%) |
| Single Unit, Attached | 278 (27.5%) | 732 (72.5%) |
| 2 Unit Apartments | 0 (0.0%) | 375 (100.0%) |
| 3 or 4 Unit Apartments | 29 (3.1%) | 919 (96.9%) |
| 5 to 9 Unit Apartments | 0 (0.0%) | 729 (100.0%) |
| 10 or more Apartments | 0 (0.0%) | 1,980 (100.0%) |
| Mobile Home / Other | 1,617 (74.0%) | 567 (26.0%) |
| Total | 19,824 (69.9%) | 8,526 (30.1%) |
Housing Structures by Number of Rooms in Franklin County
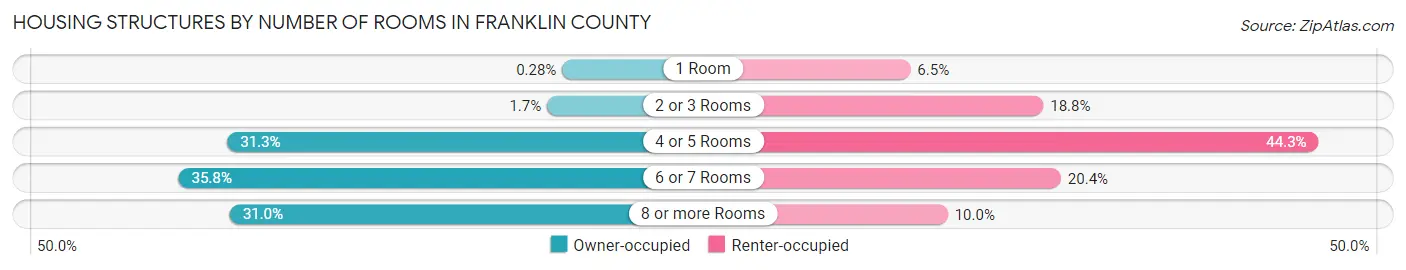
| Number of Rooms | Owner-occupied | Renter-occupied |
| 1 Room | 56 (0.3%) | 556 (6.5%) |
| 2 or 3 Rooms | 334 (1.7%) | 1,604 (18.8%) |
| 4 or 5 Rooms | 6,195 (31.2%) | 3,773 (44.3%) |
| 6 or 7 Rooms | 7,090 (35.8%) | 1,743 (20.4%) |
| 8 or more Rooms | 6,149 (31.0%) | 850 (10.0%) |
| Total | 19,824 (100.0%) | 8,526 (100.0%) |
Housing Structure by Heating Type in Franklin County
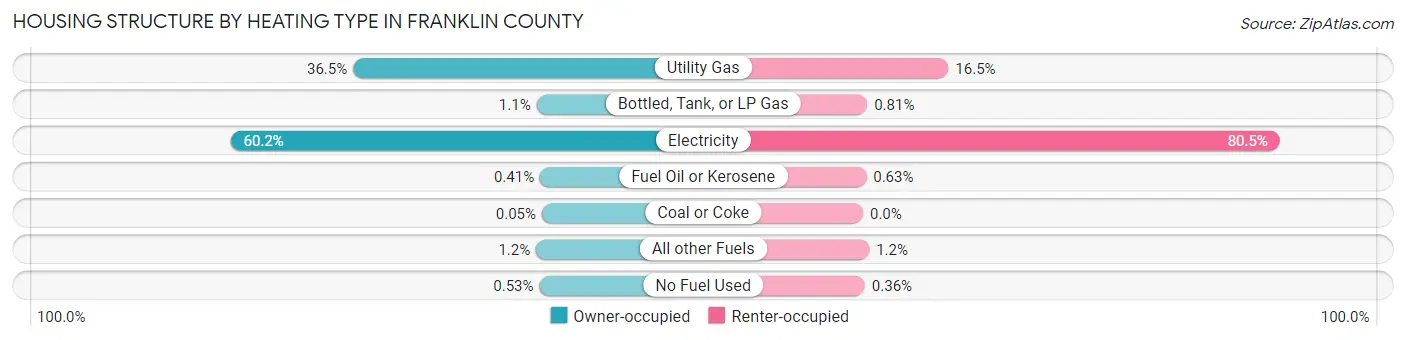
| Heating Type | Owner-occupied | Renter-occupied |
| Utility Gas | 7,244 (36.5%) | 1,406 (16.5%) |
| Bottled, Tank, or LP Gas | 214 (1.1%) | 69 (0.8%) |
| Electricity | 11,938 (60.2%) | 6,864 (80.5%) |
| Fuel Oil or Kerosene | 82 (0.4%) | 54 (0.6%) |
| Coal or Coke | 9 (0.1%) | 0 (0.0%) |
| All other Fuels | 232 (1.2%) | 102 (1.2%) |
| No Fuel Used | 105 (0.5%) | 31 (0.4%) |
| Total | 19,824 (100.0%) | 8,526 (100.0%) |
Household Vehicle Usage in Franklin County
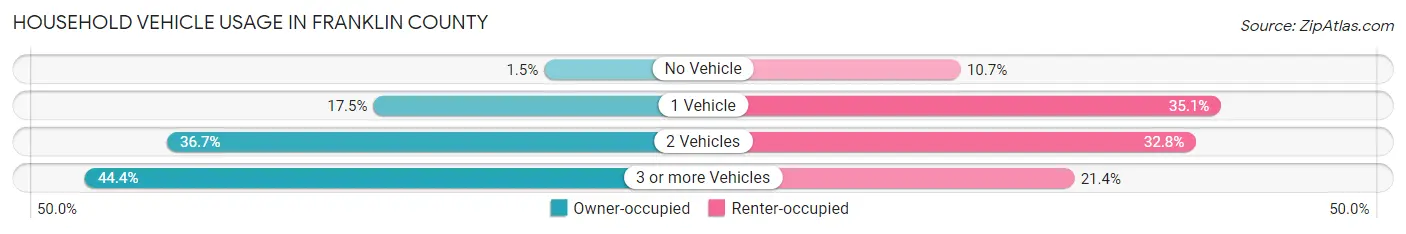
| Vehicles per Household | Owner-occupied | Renter-occupied |
| No Vehicle | 299 (1.5%) | 916 (10.7%) |
| 1 Vehicle | 3,459 (17.4%) | 2,994 (35.1%) |
| 2 Vehicles | 7,273 (36.7%) | 2,795 (32.8%) |
| 3 or more Vehicles | 8,793 (44.4%) | 1,821 (21.4%) |
| Total | 19,824 (100.0%) | 8,526 (100.0%) |
Real Estate & Mortgages in Franklin County
Real Estate and Mortgage Overview in Franklin County
| Characteristic | Without Mortgage | With Mortgage |
| Housing Units | 6,344 | 13,480 |
| Median Property Value | $259,100 | $325,300 |
| Median Household Income | $74,320 | $3,466 |
| Monthly Housing Costs | $520 | $973 |
| Real Estate Taxes | $2,358 | $241 |
Property Value by Mortgage Status in Franklin County
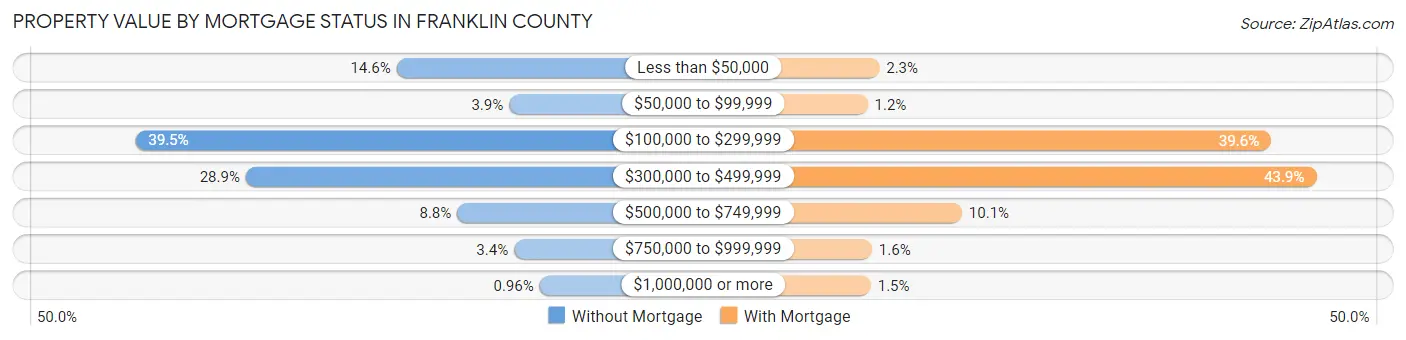
| Property Value | Without Mortgage | With Mortgage |
| Less than $50,000 | 925 (14.6%) | 305 (2.3%) |
| $50,000 to $99,999 | 245 (3.9%) | 155 (1.1%) |
| $100,000 to $299,999 | 2,503 (39.5%) | 5,334 (39.6%) |
| $300,000 to $499,999 | 1,836 (28.9%) | 5,914 (43.9%) |
| $500,000 to $749,999 | 559 (8.8%) | 1,366 (10.1%) |
| $750,000 to $999,999 | 215 (3.4%) | 210 (1.6%) |
| $1,000,000 or more | 61 (1.0%) | 196 (1.5%) |
| Total | 6,344 (100.0%) | 13,480 (100.0%) |
Household Income by Mortgage Status in Franklin County
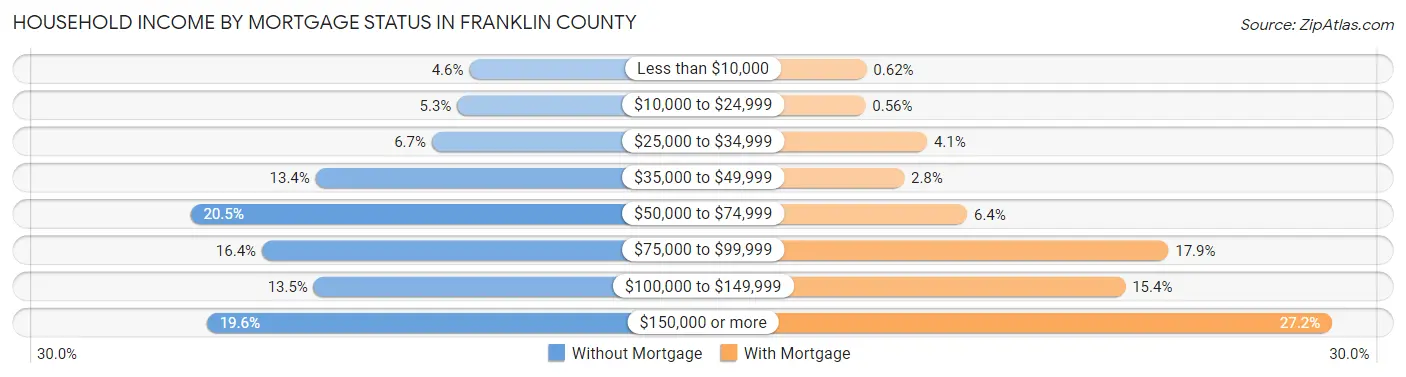
| Household Income | Without Mortgage | With Mortgage |
| Less than $10,000 | 291 (4.6%) | 84 (0.6%) |
| $10,000 to $24,999 | 335 (5.3%) | 75 (0.6%) |
| $25,000 to $34,999 | 427 (6.7%) | 550 (4.1%) |
| $35,000 to $49,999 | 848 (13.4%) | 373 (2.8%) |
| $50,000 to $74,999 | 1,302 (20.5%) | 859 (6.4%) |
| $75,000 to $99,999 | 1,043 (16.4%) | 2,409 (17.9%) |
| $100,000 to $149,999 | 855 (13.5%) | 2,077 (15.4%) |
| $150,000 or more | 1,243 (19.6%) | 3,671 (27.2%) |
| Total | 6,344 (100.0%) | 13,480 (100.0%) |
Property Value to Household Income Ratio in Franklin County
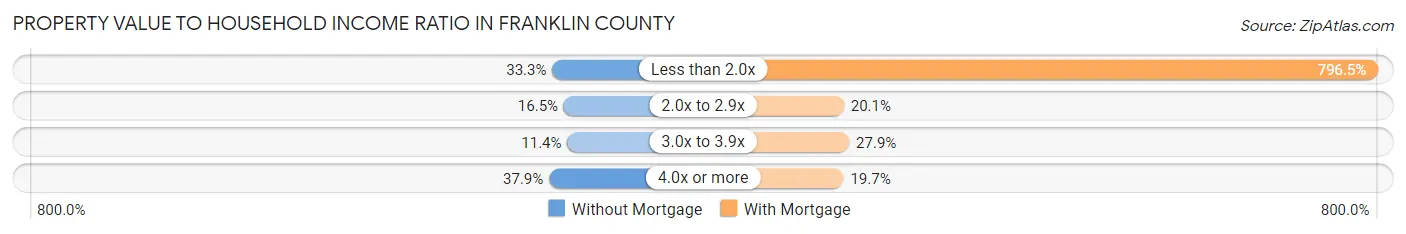
| Value-to-Income Ratio | Without Mortgage | With Mortgage |
| Less than 2.0x | 2,113 (33.3%) | 107,373 (796.5%) |
| 2.0x to 2.9x | 1,044 (16.5%) | 2,712 (20.1%) |
| 3.0x to 3.9x | 726 (11.4%) | 3,766 (27.9%) |
| 4.0x or more | 2,407 (37.9%) | 2,652 (19.7%) |
| Total | 6,344 (100.0%) | 13,480 (100.0%) |
Real Estate Taxes by Mortgage Status in Franklin County
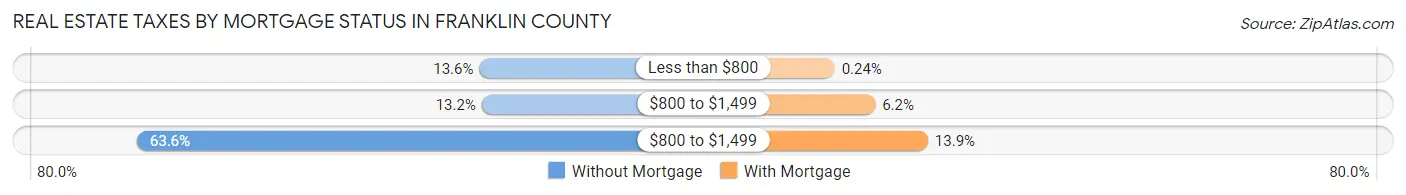
| Property Taxes | Without Mortgage | With Mortgage |
| Less than $800 | 860 (13.6%) | 33 (0.2%) |
| $800 to $1,499 | 838 (13.2%) | 830 (6.2%) |
| $800 to $1,499 | 4,034 (63.6%) | 1,868 (13.9%) |
| Total | 6,344 (100.0%) | 13,480 (100.0%) |
Health & Disability in Franklin County
Health Insurance Coverage by Age in Franklin County
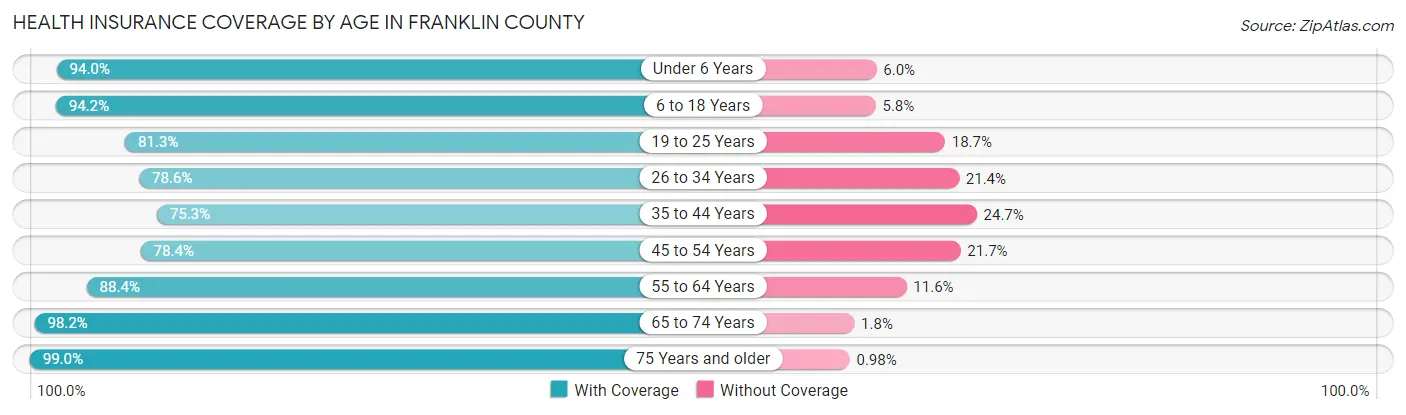
| Age Bracket | With Coverage | Without Coverage |
| Under 6 Years | 9,384 (94.0%) | 596 (6.0%) |
| 6 to 18 Years | 20,724 (94.2%) | 1,283 (5.8%) |
| 19 to 25 Years | 7,635 (81.3%) | 1,761 (18.7%) |
| 26 to 34 Years | 10,035 (78.6%) | 2,726 (21.4%) |
| 35 to 44 Years | 9,715 (75.3%) | 3,182 (24.7%) |
| 45 to 54 Years | 8,073 (78.3%) | 2,231 (21.6%) |
| 55 to 64 Years | 7,112 (88.4%) | 931 (11.6%) |
| 65 to 74 Years | 6,018 (98.2%) | 113 (1.8%) |
| 75 Years and older | 3,148 (99.0%) | 31 (1.0%) |
| Total | 81,844 (86.4%) | 12,854 (13.6%) |
Health Insurance Coverage by Citizenship Status in Franklin County
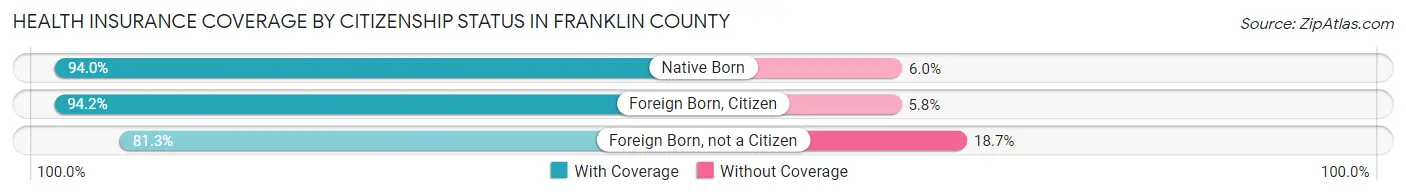
| Citizenship Status | With Coverage | Without Coverage |
| Native Born | 9,384 (94.0%) | 596 (6.0%) |
| Foreign Born, Citizen | 20,724 (94.2%) | 1,283 (5.8%) |
| Foreign Born, not a Citizen | 7,635 (81.3%) | 1,761 (18.7%) |
Health Insurance Coverage by Household Income in Franklin County
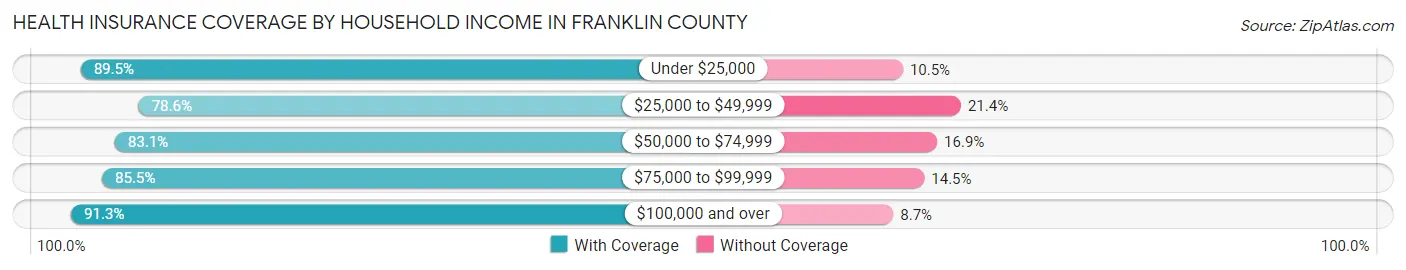
| Household Income | With Coverage | Without Coverage |
| Under $25,000 | 6,990 (89.5%) | 822 (10.5%) |
| $25,000 to $49,999 | 11,619 (78.6%) | 3,161 (21.4%) |
| $50,000 to $74,999 | 15,211 (83.1%) | 3,099 (16.9%) |
| $75,000 to $99,999 | 13,017 (85.5%) | 2,213 (14.5%) |
| $100,000 and over | 34,696 (91.3%) | 3,316 (8.7%) |
Public vs Private Health Insurance Coverage by Age in Franklin County
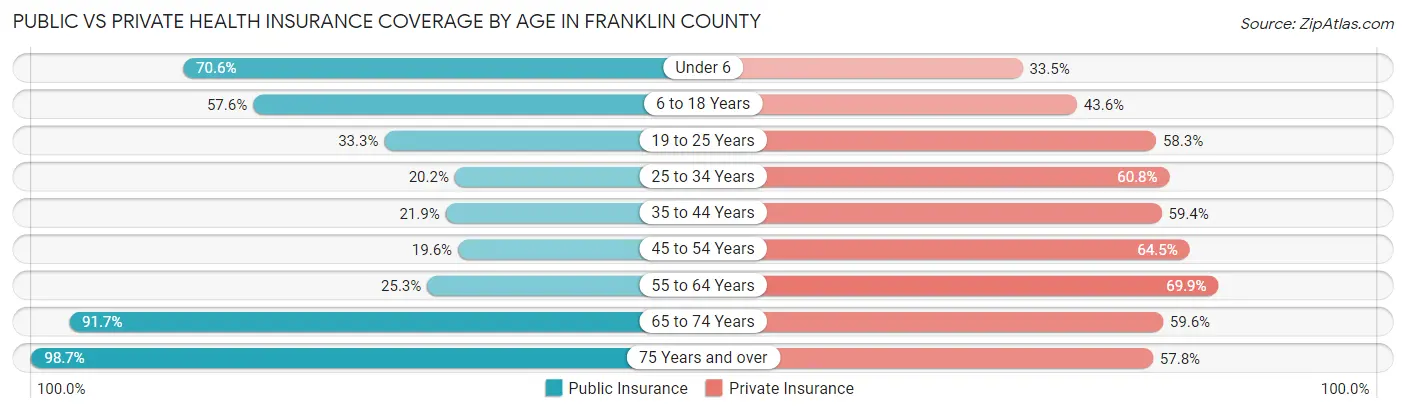
| Age Bracket | Public Insurance | Private Insurance |
| Under 6 | 7,042 (70.6%) | 3,347 (33.5%) |
| 6 to 18 Years | 12,678 (57.6%) | 9,604 (43.6%) |
| 19 to 25 Years | 3,124 (33.3%) | 5,480 (58.3%) |
| 25 to 34 Years | 2,572 (20.2%) | 7,757 (60.8%) |
| 35 to 44 Years | 2,822 (21.9%) | 7,656 (59.4%) |
| 45 to 54 Years | 2,017 (19.6%) | 6,650 (64.5%) |
| 55 to 64 Years | 2,034 (25.3%) | 5,621 (69.9%) |
| 65 to 74 Years | 5,624 (91.7%) | 3,654 (59.6%) |
| 75 Years and over | 3,139 (98.7%) | 1,836 (57.8%) |
| Total | 41,052 (43.3%) | 51,605 (54.5%) |
Disability Status by Sex by Age in Franklin County
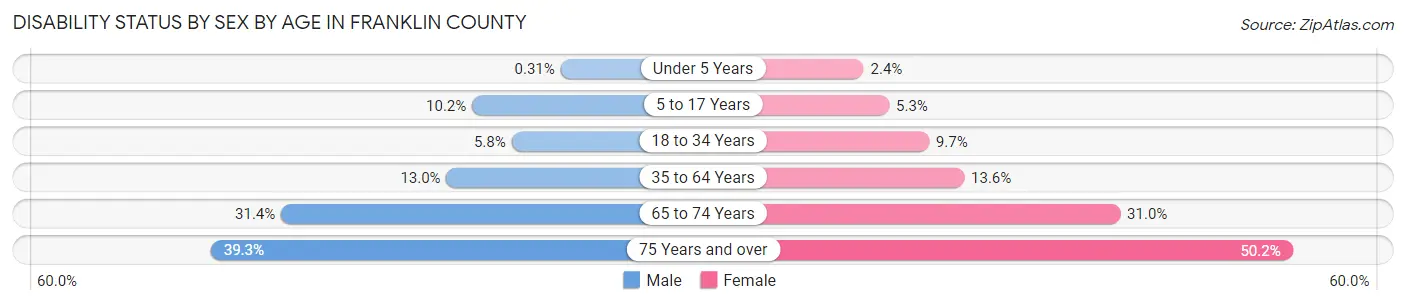
| Age Bracket | Male | Female |
| Under 5 Years | 13 (0.3%) | 96 (2.4%) |
| 5 to 17 Years | 1,115 (10.2%) | 600 (5.3%) |
| 18 to 34 Years | 711 (5.8%) | 1,098 (9.7%) |
| 35 to 64 Years | 2,086 (13.0%) | 2,073 (13.6%) |
| 65 to 74 Years | 990 (31.4%) | 924 (31.0%) |
| 75 Years and over | 530 (39.3%) | 918 (50.2%) |
Disability Class by Sex by Age in Franklin County
Disability Class: Hearing Difficulty
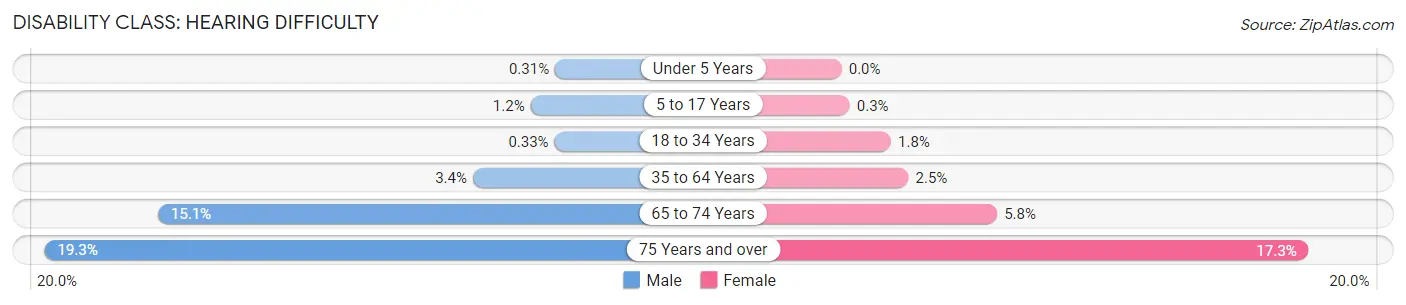
| Age Bracket | Male | Female |
| Under 5 Years | 13 (0.3%) | 0 (0.0%) |
| 5 to 17 Years | 134 (1.2%) | 34 (0.3%) |
| 18 to 34 Years | 41 (0.3%) | 207 (1.8%) |
| 35 to 64 Years | 538 (3.4%) | 377 (2.5%) |
| 65 to 74 Years | 474 (15.0%) | 172 (5.8%) |
| 75 Years and over | 260 (19.3%) | 317 (17.3%) |
Disability Class: Vision Difficulty
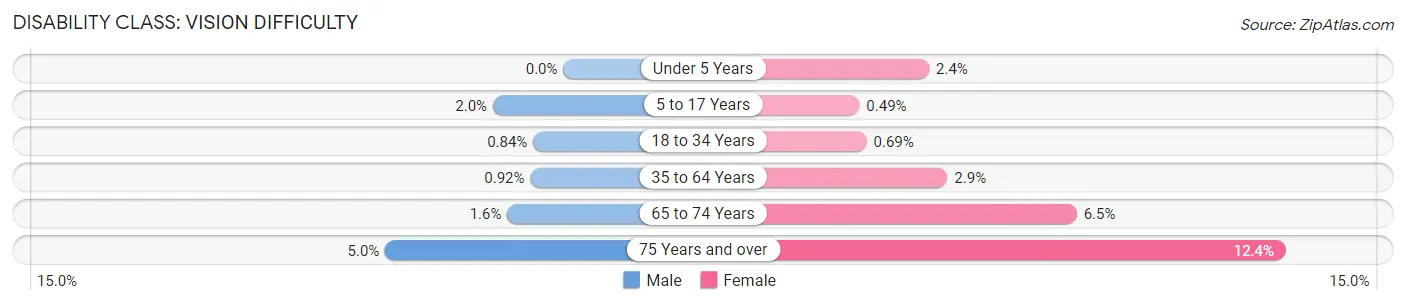
| Age Bracket | Male | Female |
| Under 5 Years | 0 (0.0%) | 96 (2.4%) |
| 5 to 17 Years | 215 (2.0%) | 56 (0.5%) |
| 18 to 34 Years | 104 (0.8%) | 78 (0.7%) |
| 35 to 64 Years | 148 (0.9%) | 448 (2.9%) |
| 65 to 74 Years | 49 (1.6%) | 195 (6.5%) |
| 75 Years and over | 67 (5.0%) | 226 (12.4%) |
Disability Class: Cognitive Difficulty
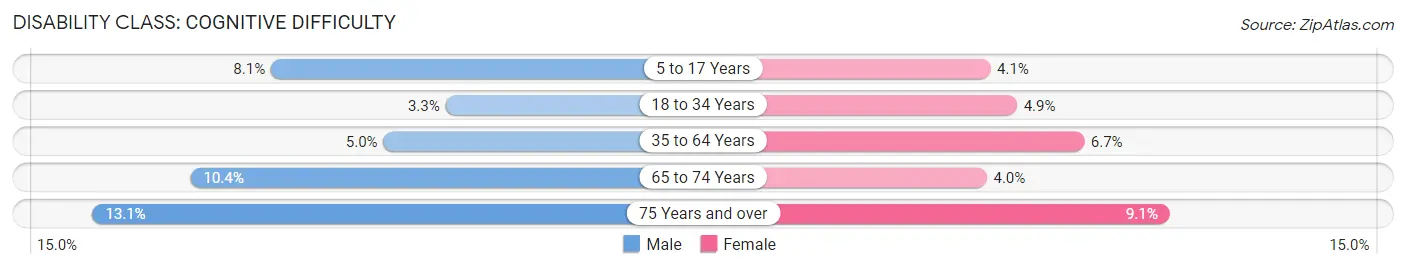
| Age Bracket | Male | Female |
| 5 to 17 Years | 893 (8.1%) | 470 (4.1%) |
| 18 to 34 Years | 405 (3.3%) | 551 (4.9%) |
| 35 to 64 Years | 802 (5.0%) | 1,026 (6.7%) |
| 65 to 74 Years | 327 (10.4%) | 120 (4.0%) |
| 75 Years and over | 177 (13.1%) | 167 (9.1%) |
Disability Class: Ambulatory Difficulty
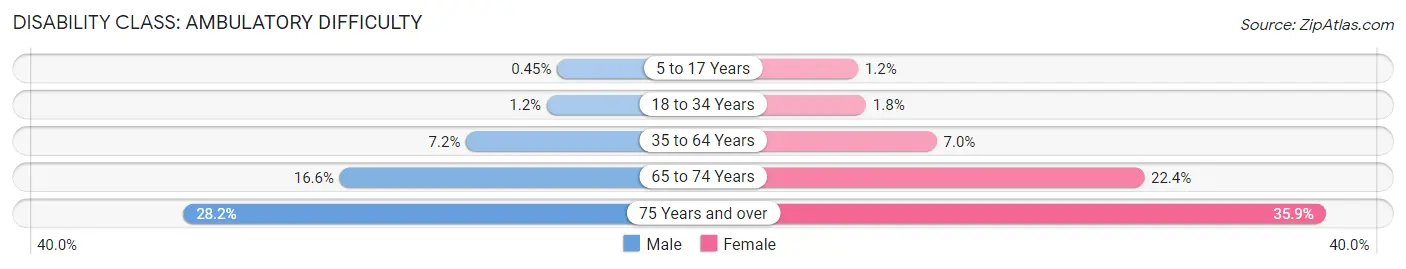
| Age Bracket | Male | Female |
| 5 to 17 Years | 49 (0.4%) | 137 (1.2%) |
| 18 to 34 Years | 150 (1.2%) | 202 (1.8%) |
| 35 to 64 Years | 1,155 (7.2%) | 1,072 (7.0%) |
| 65 to 74 Years | 523 (16.6%) | 669 (22.4%) |
| 75 Years and over | 381 (28.2%) | 657 (35.9%) |
Disability Class: Self-Care Difficulty
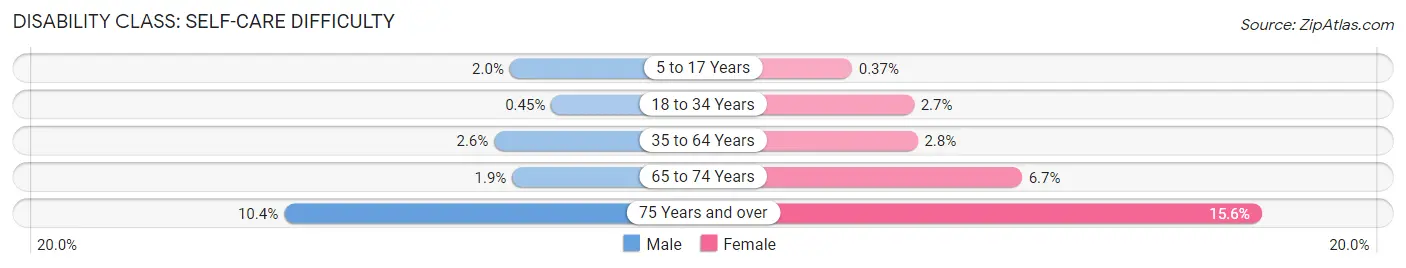
| Age Bracket | Male | Female |
| 5 to 17 Years | 218 (2.0%) | 42 (0.4%) |
| 18 to 34 Years | 55 (0.4%) | 302 (2.7%) |
| 35 to 64 Years | 412 (2.6%) | 427 (2.8%) |
| 65 to 74 Years | 60 (1.9%) | 199 (6.7%) |
| 75 Years and over | 140 (10.4%) | 285 (15.6%) |
Technology Access in Franklin County
Computing Device Access in Franklin County
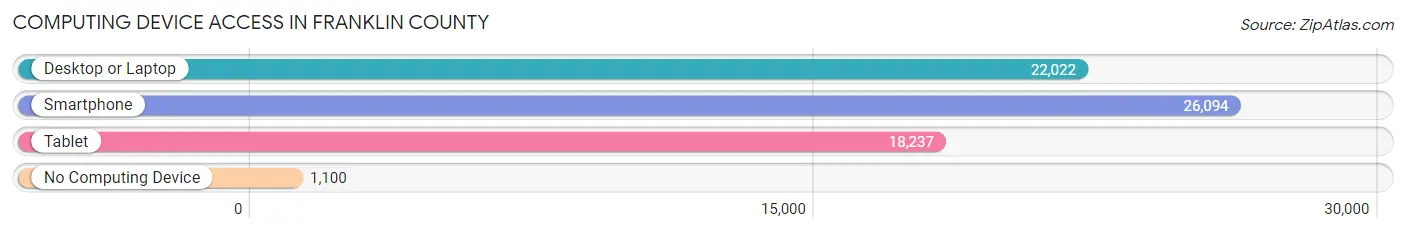
| Device Type | # Households | % Households |
| Desktop or Laptop | 22,022 | 77.7% |
| Smartphone | 26,094 | 92.0% |
| Tablet | 18,237 | 64.3% |
| No Computing Device | 1,100 | 3.9% |
| Total | 28,350 | 100.0% |
Internet Access in Franklin County
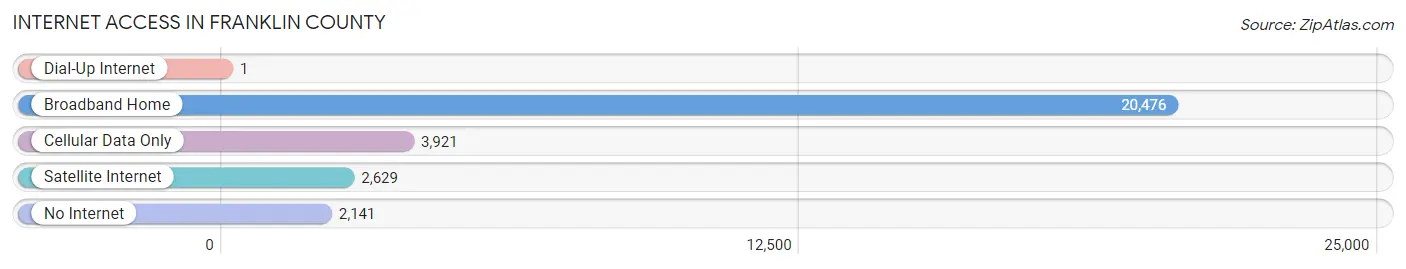
| Internet Type | # Households | % Households |
| Dial-Up Internet | 1 | 0.0% |
| Broadband Home | 20,476 | 72.2% |
| Cellular Data Only | 3,921 | 13.8% |
| Satellite Internet | 2,629 | 9.3% |
| No Internet | 2,141 | 7.5% |
| Total | 28,350 | 100.0% |
Franklin County Summary
Franklin County, Washington is located in the southeastern corner of the state, bordered by the Columbia River to the north, the Snake River to the east, and the Yakima River to the south. The county seat is Pasco, and the largest city is Pasco. The county was created in 1883 and named after Benjamin Franklin.
Geography
Franklin County covers an area of 1,945 square miles, making it the second-largest county in Washington. The terrain is mostly flat, with some rolling hills in the northern part of the county. The Columbia River forms the northern border of the county, and the Snake River forms the eastern border. The Yakima River forms the southern border. The county is home to several lakes, including Lake Wallula, Lake Sacajawea, and Lake Umatilla.
The climate of Franklin County is semi-arid, with hot summers and cold winters. The average annual precipitation is 8.5 inches, with most of it falling in the winter months.
Demographics
As of the 2010 census, Franklin County had a population of 78,163. The population was spread out, with 24.3% under the age of 18, 8.2% from 18 to 24, 28.2% from 25 to 44, 24.2% from 45 to 64, and 15.1% who were 65 years of age or older. The median age was 36.4 years.
The racial makeup of the county was 73.2% White, 1.3% African American, 0.7% Native American, 1.3% Asian, 0.2% Pacific Islander, 19.7% from other races, and 3.7% from two or more races. Hispanic or Latino of any race were 33.2% of the population.
Economy
Franklin County’s economy is largely based on agriculture, with wheat, corn, and potatoes being the main crops. The county is also home to several food processing plants, including a Nestle plant in Pasco.
The county is also home to several large employers, including the Hanford Nuclear Reservation, the Tri-Cities Airport, and the Port of Pasco. The Tri-Cities Airport is the largest employer in the county, with over 4,000 employees.
The unemployment rate in Franklin County was 6.2% in 2019, slightly lower than the national average of 3.7%.
History
The area that is now Franklin County was originally inhabited by the Yakama, Umatilla, and Nez Perce tribes. The first non-native settlers arrived in the area in the early 1800s, and the county was officially established in 1883.
The county was named after Benjamin Franklin, and the county seat was established in Pasco in 1891. The county experienced rapid growth in the early 1900s, due to the construction of the Grand Coulee Dam and the Hanford Nuclear Reservation.
The county continued to grow throughout the 20th century, and today it is home to a diverse population and a thriving economy.
Common Questions
What is the Total Population of Franklin County?
Total Population of Franklin County is 96,692.
What is the Total Male Population of Franklin County?
Total Male Population of Franklin County is 49,955.
What is the Total Female Population of Franklin County?
Total Female Population of Franklin County is 46,737.
What is the Ratio of Males per 100 Females in Franklin County?
There are 106.89 Males per 100 Females in Franklin County.
What is the Ratio of Females per 100 Males in Franklin County?
There are 93.56 Females per 100 Males in Franklin County.
What is the Median Population Age in Franklin County?
Median Population Age in Franklin County is 30.6 Years.
What is the Average Family Size in Franklin County
Average Family Size in Franklin County is 3.7 People.
What is the Average Household Size in Franklin County
Average Household Size in Franklin County is 3.3 People.
What is Per Capita Income in Franklin County?
Per Capita income in Franklin County is $31,346.
What is the Median Family Income in Franklin County?
Median Family Income in Franklin County is $83,228.
What is the Median Household income in Franklin County?
Median Household Income in Franklin County is $77,877.
What is Income or Wage Gap in Franklin County?
Income or Wage Gap in Franklin County is 27.9%.
Women in Franklin County earn 72.1 cents for every dollar earned by a man.
What is Family Income Deficit in Franklin County?
Family Income Deficit in Franklin County is $11,847.
Families that are below poverty line in Franklin County earn $11,847 less on average than the poverty threshold level.
What is Inequality or Gini Index in Franklin County?
Inequality or Gini Index in Franklin County is 0.42.
How Large is the Labor Force in Franklin County?
There are 46,267 People in the Labor Forcein in Franklin County.
What is the Percentage of People in the Labor Force in Franklin County?
66.3% of People are in the Labor Force in Franklin County.
What is the Unemployment Rate in Franklin County?
Unemployment Rate in Franklin County is 5.7%.