Chelan County, WA
Chelan County Map
Chelan County Overview
79,076
TOTAL POPULATION
39,895
MALE POPULATION
39,181
FEMALE POPULATION
101.82
MALES / 100 FEMALES
98.21
FEMALES / 100 MALES
40.1
MEDIAN AGE
3.1
AVG FAMILY SIZE
2.5
AVG HOUSEHOLD SIZE
$39,746
PER CAPITA INCOME
$85,727
AVG FAMILY INCOME
$71,876
AVG HOUSEHOLD INCOME
22.7%
WAGE / INCOME GAP [ % ]
77.3¢/ $1
WAGE / INCOME GAP [ $ ]
$9,952
FAMILY INCOME DEFICIT
0.45
INEQUALITY / GINI INDEX
38,713
LABOR FORCE [ PEOPLE ]
61.6%
PERCENT IN LABOR FORCE
3.4%
UNEMPLOYMENT RATE
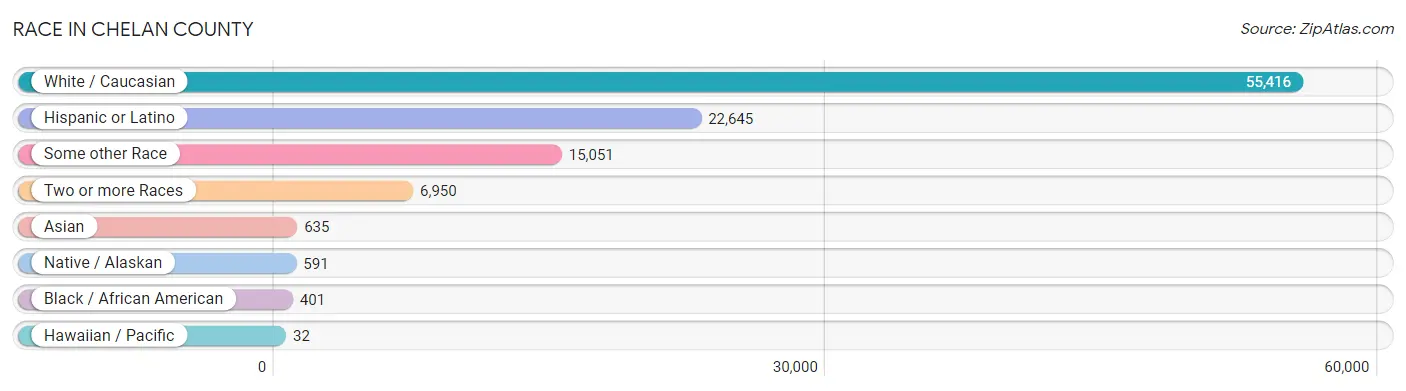
Race in Chelan County
The most populous races in Chelan County are White / Caucasian (55,416 | 70.1%), Hispanic or Latino (22,645 | 28.6%), and Some other Race (15,051 | 19.0%).
| Race | # Population | % Population |
| Asian | 635 | 0.8% |
| Black / African American | 401 | 0.5% |
| Hawaiian / Pacific | 32 | 0.0% |
| Hispanic or Latino | 22,645 | 28.6% |
| Native / Alaskan | 591 | 0.7% |
| White / Caucasian | 55,416 | 70.1% |
| Two or more Races | 6,950 | 8.8% |
| Some other Race | 15,051 | 19.0% |
| Total | 79,076 | 100.0% |
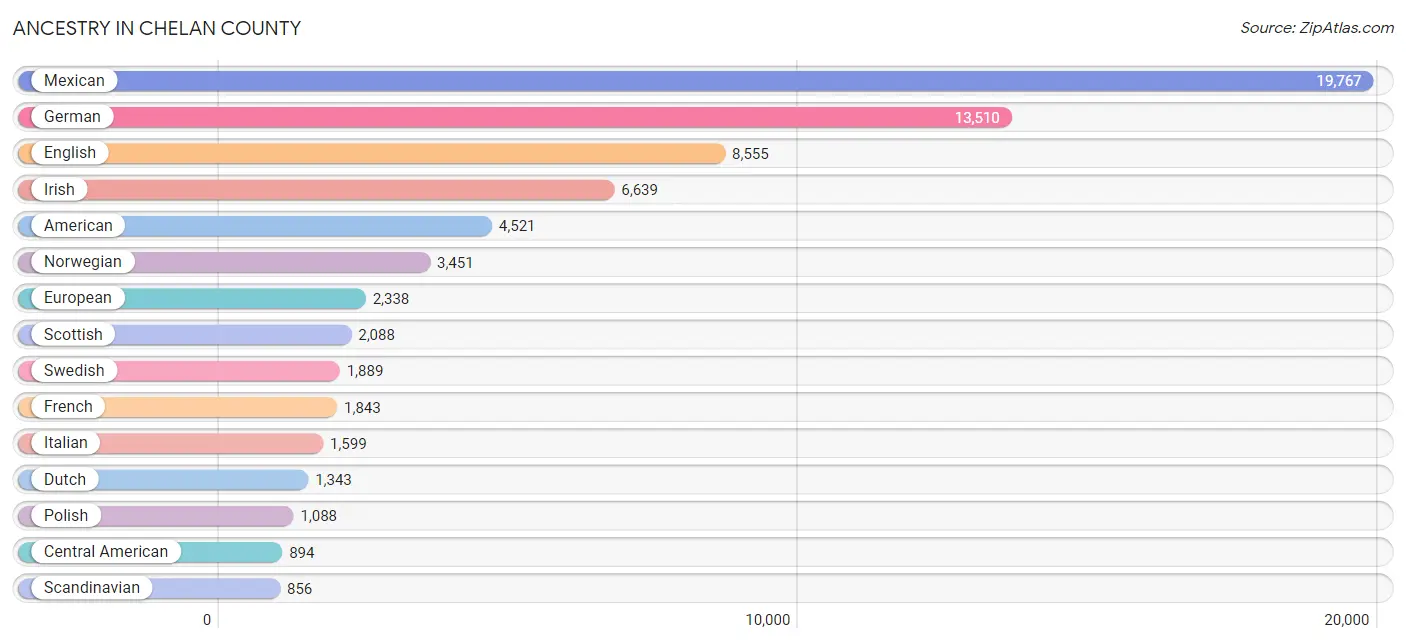
Ancestry in Chelan County
The most populous ancestries reported in Chelan County are Mexican (19,767 | 25.0%), German (13,510 | 17.1%), English (8,555 | 10.8%), Irish (6,639 | 8.4%), and American (4,521 | 5.7%), together accounting for 67.0% of all Chelan County residents.
| Ancestry | # Population | % Population |
| African | 20 | 0.0% |
| Alaska Native | 6 | 0.0% |
| Aleut | 2 | 0.0% |
| American | 4,521 | 5.7% |
| Arab | 121 | 0.2% |
| Argentinean | 179 | 0.2% |
| Armenian | 57 | 0.1% |
| Australian | 13 | 0.0% |
| Austrian | 260 | 0.3% |
| Belgian | 85 | 0.1% |
| Bhutanese | 282 | 0.4% |
| Blackfeet | 122 | 0.2% |
| Bolivian | 10 | 0.0% |
| British | 797 | 1.0% |
| Burmese | 69 | 0.1% |
| Canadian | 166 | 0.2% |
| Carpatho Rusyn | 7 | 0.0% |
| Celtic | 80 | 0.1% |
| Central American | 894 | 1.1% |
| Central American Indian | 30 | 0.0% |
| Cherokee | 146 | 0.2% |
| Chickasaw | 39 | 0.1% |
| Chilean | 11 | 0.0% |
| Chinese | 36 | 0.1% |
| Chippewa | 148 | 0.2% |
| Choctaw | 38 | 0.1% |
| Colombian | 55 | 0.1% |
| Colville | 61 | 0.1% |
| Costa Rican | 14 | 0.0% |
| Cree | 13 | 0.0% |
| Croatian | 118 | 0.2% |
| Crow | 2 | 0.0% |
| Cuban | 39 | 0.1% |
| Czech | 350 | 0.4% |
| Czechoslovakian | 36 | 0.1% |
| Danish | 473 | 0.6% |
| Dominican | 247 | 0.3% |
| Dutch | 1,343 | 1.7% |
| Eastern European | 116 | 0.2% |
| Egyptian | 8 | 0.0% |
| English | 8,555 | 10.8% |
| Estonian | 23 | 0.0% |
| Ethiopian | 46 | 0.1% |
| European | 2,338 | 3.0% |
| Finnish | 350 | 0.4% |
| French | 1,843 | 2.3% |
| French American Indian | 7 | 0.0% |
| French Canadian | 355 | 0.4% |
| German | 13,510 | 17.1% |
| German Russian | 41 | 0.1% |
| Greek | 190 | 0.2% |
| Guamanian / Chamorro | 100 | 0.1% |
| Guatemalan | 292 | 0.4% |
| Honduran | 26 | 0.0% |
| Hungarian | 116 | 0.2% |
| Icelander | 73 | 0.1% |
| Indian (Asian) | 236 | 0.3% |
| Iranian | 2 | 0.0% |
| Irish | 6,639 | 8.4% |
| Italian | 1,599 | 2.0% |
| Japanese | 8 | 0.0% |
| Jordanian | 18 | 0.0% |
| Korean | 257 | 0.3% |
| Laotian | 35 | 0.0% |
| Latvian | 10 | 0.0% |
| Lebanese | 32 | 0.0% |
| Lithuanian | 135 | 0.2% |
| Luxembourger | 7 | 0.0% |
| Mexican | 19,767 | 25.0% |
| Mexican American Indian | 212 | 0.3% |
| Native Hawaiian | 69 | 0.1% |
| Navajo | 43 | 0.1% |
| New Zealander | 9 | 0.0% |
| Nicaraguan | 32 | 0.0% |
| Northern European | 288 | 0.4% |
| Norwegian | 3,451 | 4.4% |
| Osage | 5 | 0.0% |
| Panamanian | 71 | 0.1% |
| Peruvian | 3 | 0.0% |
| Polish | 1,088 | 1.4% |
| Portuguese | 198 | 0.3% |
| Puerto Rican | 121 | 0.2% |
| Puget Sound Salish | 132 | 0.2% |
| Romanian | 35 | 0.0% |
| Russian | 402 | 0.5% |
| Salvadoran | 459 | 0.6% |
| Samoan | 50 | 0.1% |
| Scandinavian | 856 | 1.1% |
| Scotch-Irish | 690 | 0.9% |
| Scottish | 2,088 | 2.6% |
| Seminole | 16 | 0.0% |
| Sioux | 50 | 0.1% |
| Slavic | 7 | 0.0% |
| Slovak | 22 | 0.0% |
| Slovene | 31 | 0.0% |
| South American | 301 | 0.4% |
| South American Indian | 1 | 0.0% |
| Spaniard | 298 | 0.4% |
| Spanish | 217 | 0.3% |
| Spanish American Indian | 69 | 0.1% |
| Sri Lankan | 163 | 0.2% |
| Subsaharan African | 66 | 0.1% |
| Swedish | 1,889 | 2.4% |
| Swiss | 263 | 0.3% |
| Thai | 188 | 0.2% |
| Tlingit-Haida | 80 | 0.1% |
| Turkish | 20 | 0.0% |
| Ukrainian | 91 | 0.1% |
| Venezuelan | 43 | 0.1% |
| Welsh | 597 | 0.7% |
| Yakama | 42 | 0.1% |
| Yugoslavian | 43 | 0.1% | View All 112 Rows |
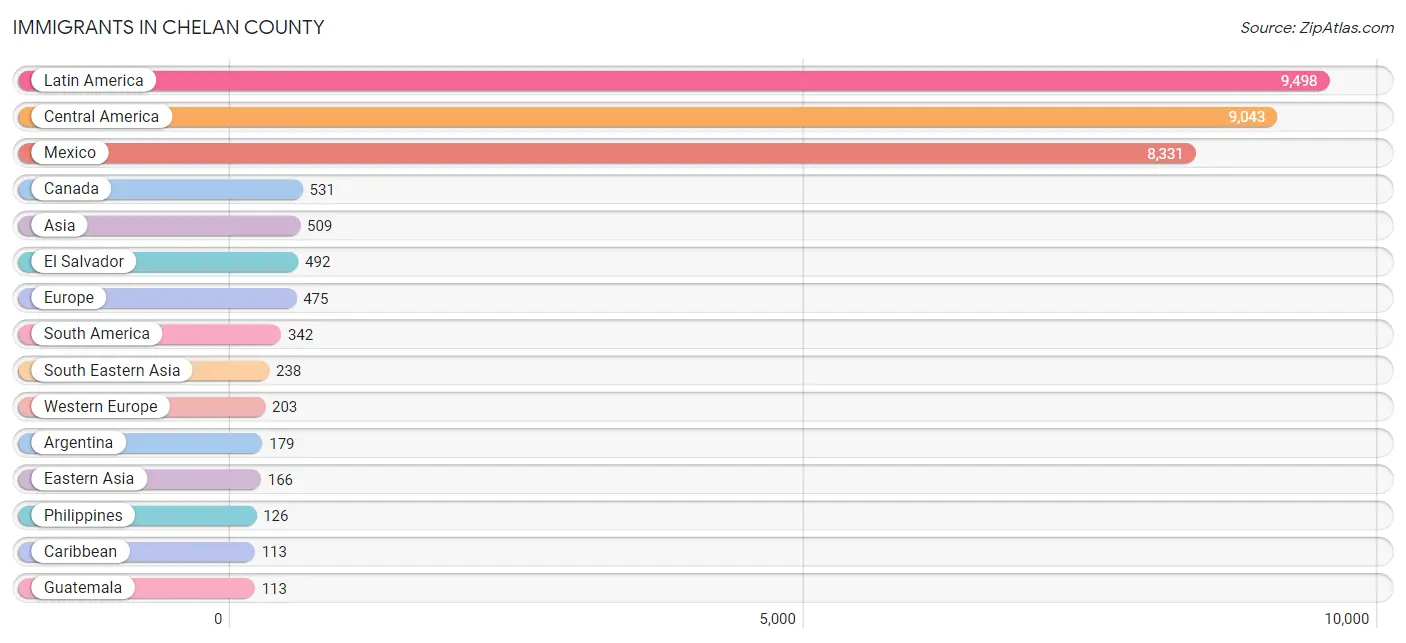
Immigrants in Chelan County
The most numerous immigrant groups reported in Chelan County came from Latin America (9,498 | 12.0%), Central America (9,043 | 11.4%), Mexico (8,331 | 10.5%), Canada (531 | 0.7%), and Asia (509 | 0.6%), together accounting for 35.3% of all Chelan County residents.
| Immigration Origin | # Population | % Population |
| Africa | 28 | 0.0% |
| Argentina | 179 | 0.2% |
| Asia | 509 | 0.6% |
| Australia | 15 | 0.0% |
| Belarus | 2 | 0.0% |
| Belgium | 82 | 0.1% |
| Bolivia | 13 | 0.0% |
| Brazil | 30 | 0.0% |
| Cambodia | 8 | 0.0% |
| Canada | 531 | 0.7% |
| Caribbean | 113 | 0.1% |
| Central America | 9,043 | 11.4% |
| China | 78 | 0.1% |
| Colombia | 14 | 0.0% |
| Costa Rica | 14 | 0.0% |
| Cuba | 9 | 0.0% |
| Denmark | 16 | 0.0% |
| Dominican Republic | 104 | 0.1% |
| Eastern Africa | 15 | 0.0% |
| Eastern Asia | 166 | 0.2% |
| Eastern Europe | 108 | 0.1% |
| El Salvador | 492 | 0.6% |
| England | 22 | 0.0% |
| Ethiopia | 15 | 0.0% |
| Europe | 475 | 0.6% |
| France | 30 | 0.0% |
| Germany | 67 | 0.1% |
| Greece | 24 | 0.0% |
| Guatemala | 113 | 0.1% |
| Honduras | 26 | 0.0% |
| Hungary | 7 | 0.0% |
| India | 102 | 0.1% |
| Iran | 2 | 0.0% |
| Italy | 21 | 0.0% |
| Japan | 74 | 0.1% |
| Korea | 14 | 0.0% |
| Latin America | 9,498 | 12.0% |
| Mexico | 8,331 | 10.5% |
| Moldova | 2 | 0.0% |
| Nepal | 1 | 0.0% |
| Netherlands | 8 | 0.0% |
| Nicaragua | 32 | 0.0% |
| Northern Africa | 9 | 0.0% |
| Northern Europe | 104 | 0.1% |
| Norway | 11 | 0.0% |
| Oceania | 28 | 0.0% |
| Panama | 35 | 0.0% |
| Peru | 3 | 0.0% |
| Philippines | 126 | 0.2% |
| Poland | 19 | 0.0% |
| Russia | 30 | 0.0% |
| South America | 342 | 0.4% |
| South Central Asia | 105 | 0.1% |
| South Eastern Asia | 238 | 0.3% |
| Southern Europe | 60 | 0.1% |
| Spain | 15 | 0.0% |
| Sweden | 10 | 0.0% |
| Switzerland | 16 | 0.0% |
| Taiwan | 7 | 0.0% |
| Ukraine | 48 | 0.1% |
| Venezuela | 103 | 0.1% |
| Vietnam | 104 | 0.1% |
| Western Africa | 4 | 0.0% |
| Western Europe | 203 | 0.3% | View All 64 Rows |
Sex and Age in Chelan County
Sex and Age in Chelan County
The most populous age groups in Chelan County are 55 to 59 Years (2,854 | 7.1%) for men and 60 to 64 Years (2,910 | 7.4%) for women.
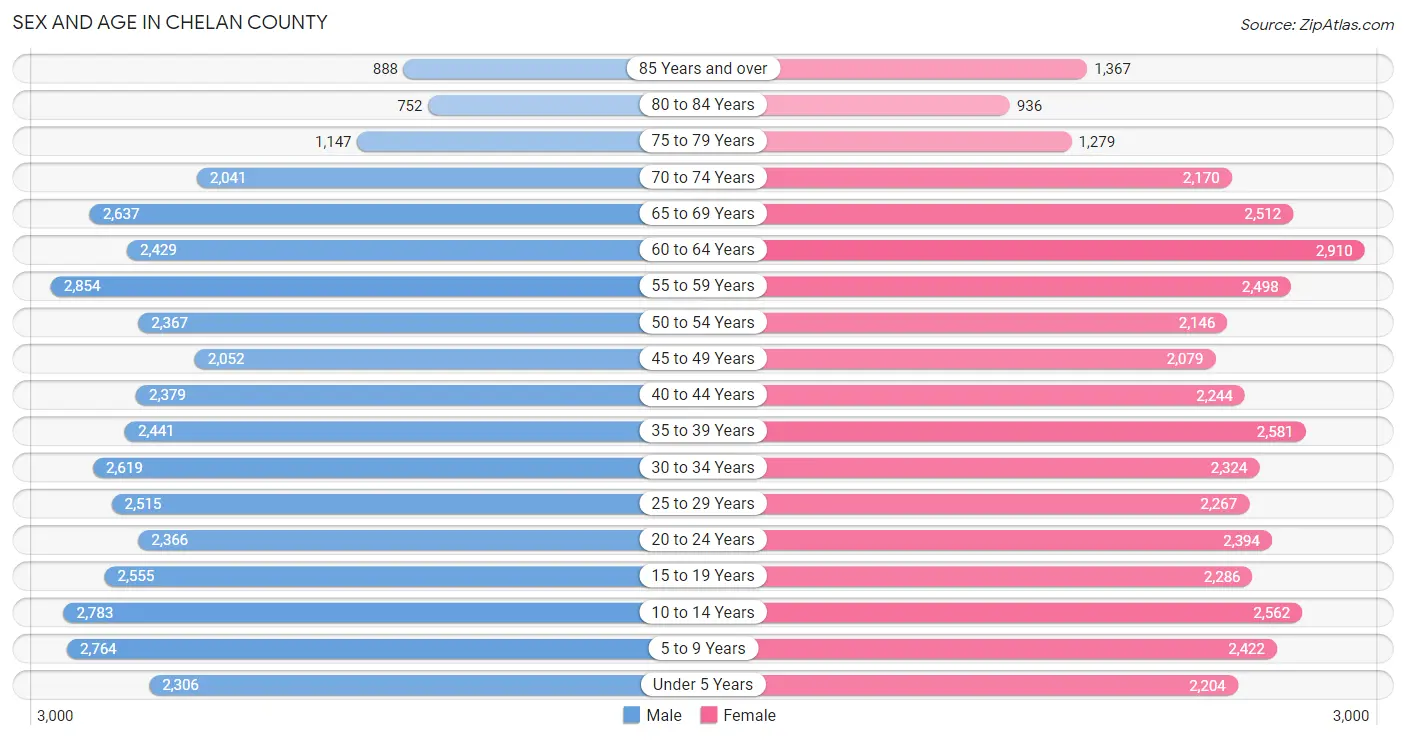
| Age Bracket | Male | Female |
| Under 5 Years | 2,306 (5.8%) | 2,204 (5.6%) |
| 5 to 9 Years | 2,764 (6.9%) | 2,422 (6.2%) |
| 10 to 14 Years | 2,783 (7.0%) | 2,562 (6.5%) |
| 15 to 19 Years | 2,555 (6.4%) | 2,286 (5.8%) |
| 20 to 24 Years | 2,366 (5.9%) | 2,394 (6.1%) |
| 25 to 29 Years | 2,515 (6.3%) | 2,267 (5.8%) |
| 30 to 34 Years | 2,619 (6.6%) | 2,324 (5.9%) |
| 35 to 39 Years | 2,441 (6.1%) | 2,581 (6.6%) |
| 40 to 44 Years | 2,379 (6.0%) | 2,244 (5.7%) |
| 45 to 49 Years | 2,052 (5.1%) | 2,079 (5.3%) |
| 50 to 54 Years | 2,367 (5.9%) | 2,146 (5.5%) |
| 55 to 59 Years | 2,854 (7.1%) | 2,498 (6.4%) |
| 60 to 64 Years | 2,429 (6.1%) | 2,910 (7.4%) |
| 65 to 69 Years | 2,637 (6.6%) | 2,512 (6.4%) |
| 70 to 74 Years | 2,041 (5.1%) | 2,170 (5.5%) |
| 75 to 79 Years | 1,147 (2.9%) | 1,279 (3.3%) |
| 80 to 84 Years | 752 (1.9%) | 936 (2.4%) |
| 85 Years and over | 888 (2.2%) | 1,367 (3.5%) |
| Total | 39,895 (100.0%) | 39,181 (100.0%) |
Families and Households in Chelan County
Median Family Size in Chelan County
The median family size in Chelan County is 3.13 persons per family, with single female/mother families (3,279 | 16.5%) accounting for the largest median family size of 3.25 persons per family. On the other hand, single male/father families (1,477 | 7.4%) represent the smallest median family size with 2.46 persons per family.
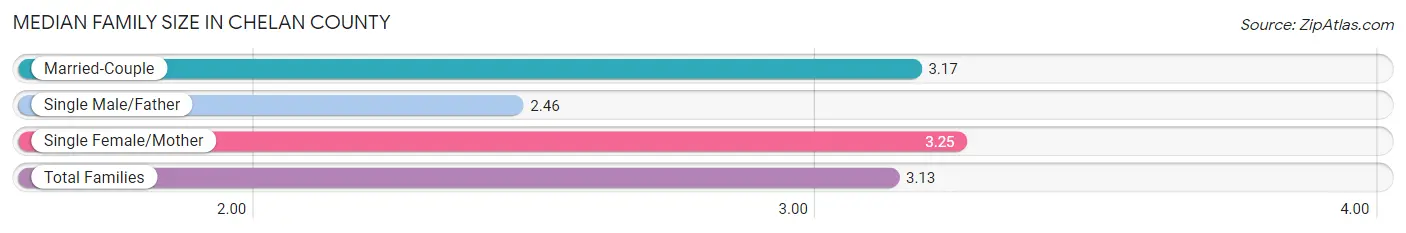
| Family Type | # Families | Family Size |
| Married-Couple | 15,128 (76.1%) | 3.17 |
| Single Male/Father | 1,477 (7.4%) | 2.46 |
| Single Female/Mother | 3,279 (16.5%) | 3.25 |
| Total Families | 19,884 (100.0%) | 3.13 |
Median Household Size in Chelan County
The median household size in Chelan County is 2.55 persons per household, with single female/mother households (3,279 | 10.8%) accounting for the largest median household size of 3.55 persons per household. non-family households (10,530 | 34.6%) represent the smallest median household size with 1.24 persons per household.
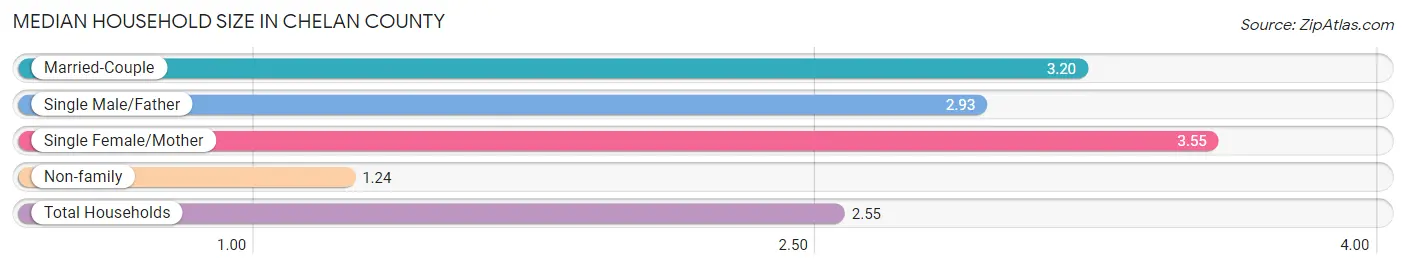
| Household Type | # Households | Household Size |
| Married-Couple | 15,128 (49.7%) | 3.20 |
| Single Male/Father | 1,477 (4.9%) | 2.93 |
| Single Female/Mother | 3,279 (10.8%) | 3.55 |
| Non-family | 10,530 (34.6%) | 1.24 |
| Total Households | 30,414 (100.0%) | 2.55 |
Household Size by Marriage Status in Chelan County
Out of a total of 30,414 households in Chelan County, 19,884 (65.4%) are family households, while 10,530 (34.6%) are nonfamily households. The most numerous type of family households are 2-person households, comprising 9,144, and the most common type of nonfamily households are 1-person households, comprising 8,563.
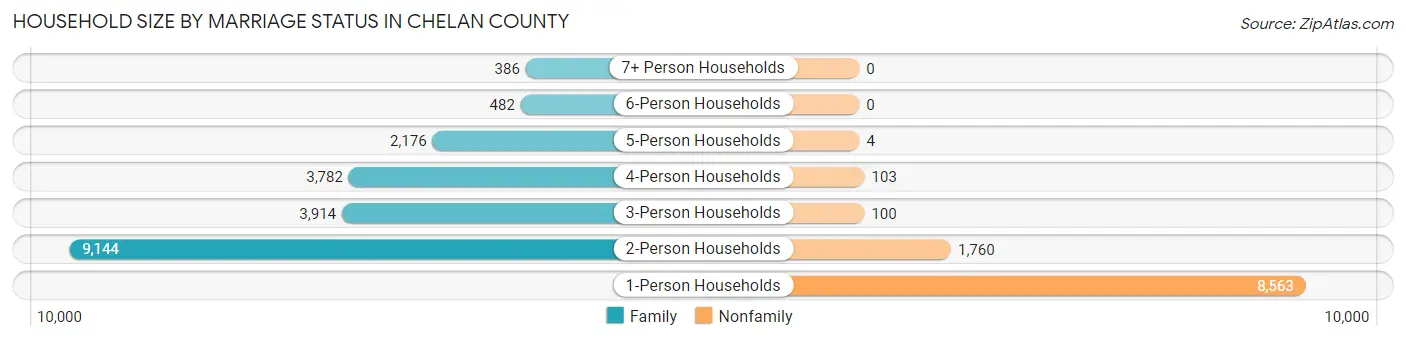
| Household Size | Family Households | Nonfamily Households |
| 1-Person Households | - | 8,563 (28.1%) |
| 2-Person Households | 9,144 (30.1%) | 1,760 (5.8%) |
| 3-Person Households | 3,914 (12.9%) | 100 (0.3%) |
| 4-Person Households | 3,782 (12.4%) | 103 (0.3%) |
| 5-Person Households | 2,176 (7.1%) | 4 (0.0%) |
| 6-Person Households | 482 (1.6%) | 0 (0.0%) |
| 7+ Person Households | 386 (1.3%) | 0 (0.0%) |
| Total | 19,884 (65.4%) | 10,530 (34.6%) |
Female Fertility in Chelan County
Fertility by Age in Chelan County
Average fertility rate in Chelan County is 59.0 births per 1,000 women. Women in the age bracket of 20 to 34 years have the highest fertility rate with 112.0 births per 1,000 women. Women in the age bracket of 20 to 34 years acount for 79.8% of all women with births.
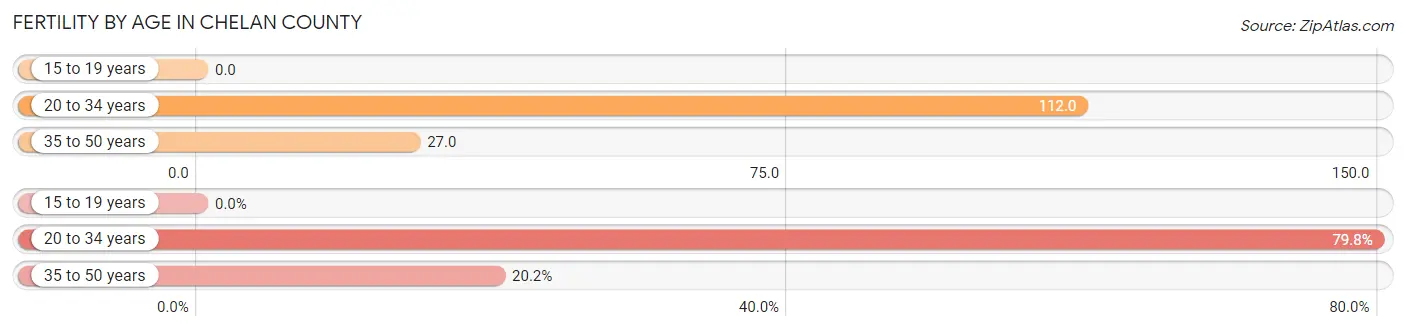
| Age Bracket | Women with Births | Births / 1,000 Women |
| 15 to 19 years | 0 (0.0%) | 0.0 |
| 20 to 34 years | 780 (79.8%) | 112.0 |
| 35 to 50 years | 197 (20.2%) | 27.0 |
| Total | 977 (100.0%) | 59.0 |
Fertility by Age by Marriage Status in Chelan County
84.2% of women with births (977) in Chelan County are married. The highest percentage of unmarried women with births falls into 20 to 34 years age bracket with 19.7% of them unmarried at the time of birth, while the lowest percentage of unmarried women with births belong to 35 to 50 years age bracket with 0.0% of them unmarried.
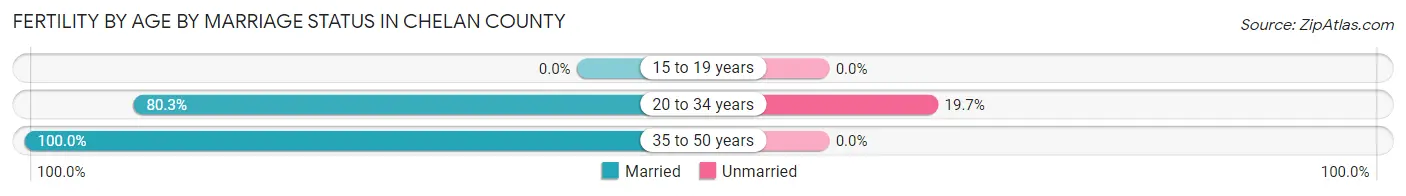
| Age Bracket | Married | Unmarried |
| 15 to 19 years | 0 (0.0%) | 0 (0.0%) |
| 20 to 34 years | 626 (80.3%) | 154 (19.7%) |
| 35 to 50 years | 197 (100.0%) | 0 (0.0%) |
| Total | 823 (84.2%) | 154 (15.8%) |
Fertility by Education in Chelan County
Average fertility rate in Chelan County is 59.0 births per 1,000 women. Women with the education attainment of graduate degree have the highest fertility rate of 104.0 births per 1,000 women, while women with the education attainment of less than high school have the lowest fertility at 29.0 births per 1,000 women. Women with the education attainment of high school diploma represent 30.8% of all women with births.
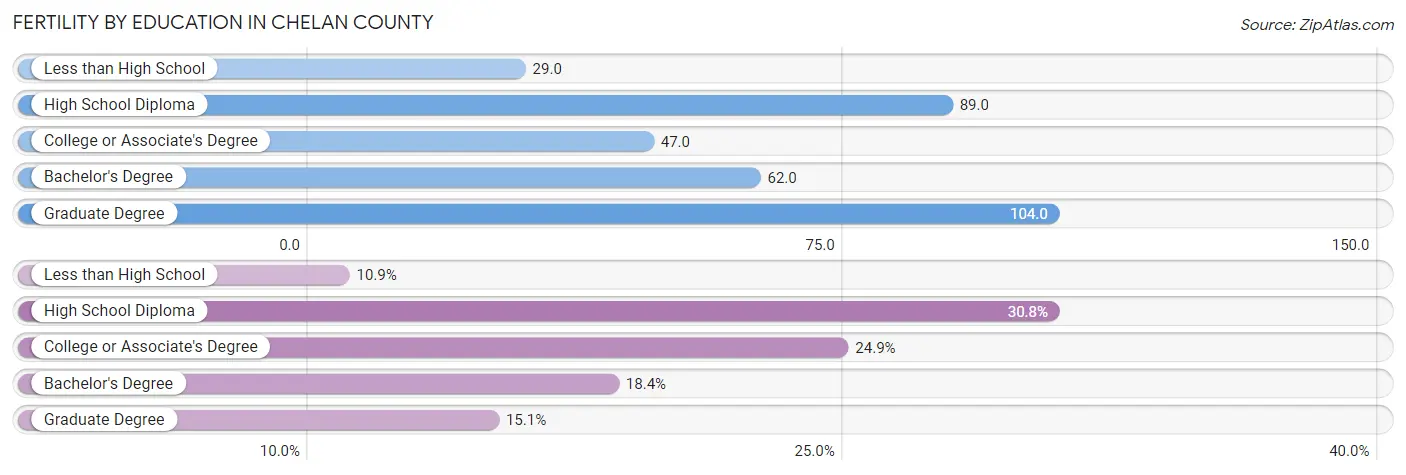
| Educational Attainment | Women with Births | Births / 1,000 Women |
| Less than High School | 106 (10.8%) | 29.0 |
| High School Diploma | 301 (30.8%) | 89.0 |
| College or Associate's Degree | 243 (24.9%) | 47.0 |
| Bachelor's Degree | 180 (18.4%) | 62.0 |
| Graduate Degree | 147 (15.0%) | 104.0 |
| Total | 977 (100.0%) | 59.0 |
Fertility by Education by Marriage Status in Chelan County
15.8% of women with births in Chelan County are unmarried. Women with the educational attainment of graduate degree are most likely to be married with 100.0% of them married at childbirth, while women with the educational attainment of high school diploma are least likely to be married with 26.9% of them unmarried at childbirth.
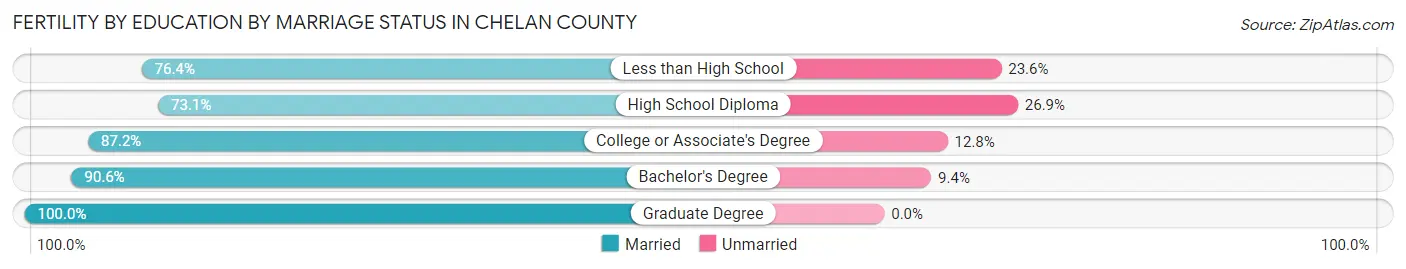
| Educational Attainment | Married | Unmarried |
| Less than High School | 81 (76.4%) | 25 (23.6%) |
| High School Diploma | 220 (73.1%) | 81 (26.9%) |
| College or Associate's Degree | 212 (87.2%) | 31 (12.8%) |
| Bachelor's Degree | 163 (90.6%) | 17 (9.4%) |
| Graduate Degree | 147 (100.0%) | 0 (0.0%) |
| Total | 823 (84.2%) | 154 (15.8%) |
Income in Chelan County
Income Overview in Chelan County
Per Capita Income in Chelan County is $39,746, while median incomes of families and households are $85,727 and $71,876 respectively.
| Characteristic | Number | Measure |
| Per Capita Income | 79,076 | $39,746 |
| Median Family Income | 19,884 | $85,727 |
| Mean Family Income | 19,884 | $115,550 |
| Median Household Income | 30,414 | $71,876 |
| Mean Household Income | 30,414 | $99,583 |
| Income Deficit | 19,884 | $9,952 |
| Wage / Income Gap (%) | 79,076 | 22.69% |
| Wage / Income Gap ($) | 79,076 | 77.31¢ per $1 |
| Gini / Inequality Index | 79,076 | 0.45 |
Earnings by Sex in Chelan County
Average Earnings in Chelan County are $38,450, $43,781 for men and $33,848 for women, a difference of 22.7%.
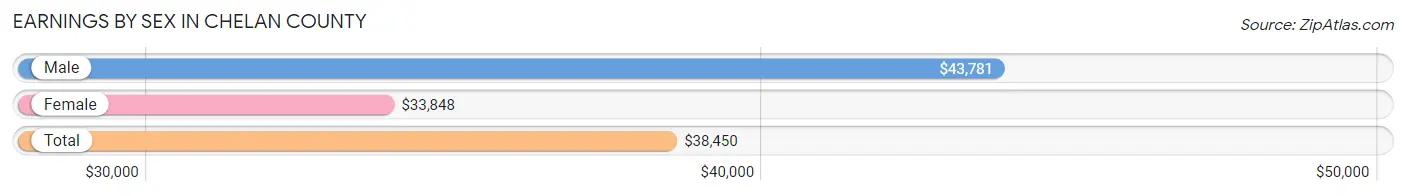
| Sex | Number | Average Earnings |
| Male | 22,215 (54.0%) | $43,781 |
| Female | 18,933 (46.0%) | $33,848 |
| Total | 41,148 (100.0%) | $38,450 |
Earnings by Sex by Income Bracket in Chelan County
The most common earnings brackets in Chelan County are $100,000+ for men (3,859 | 17.4%) and $25,000 to $29,999 for women (1,801 | 9.5%).
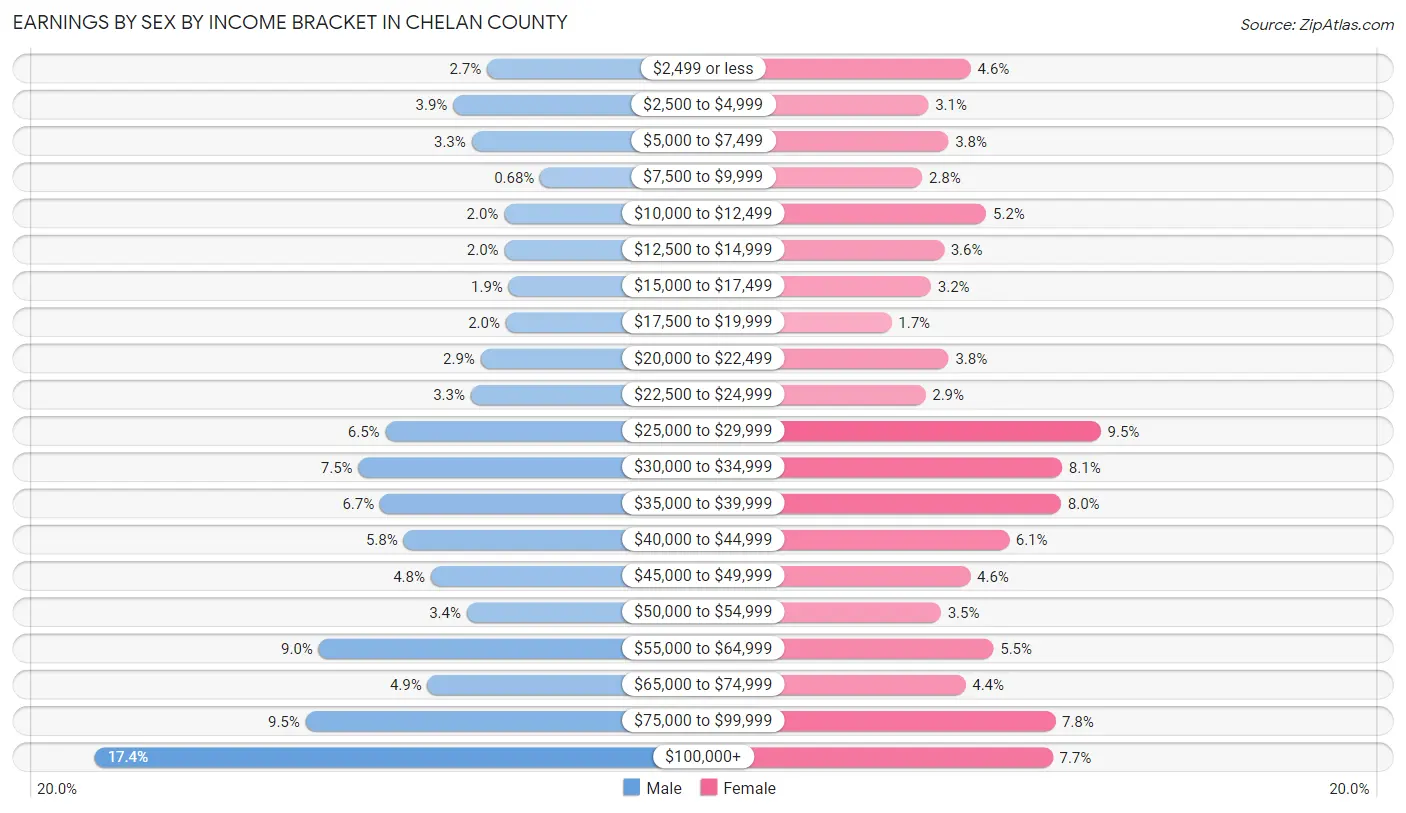
| Income | Male | Female |
| $2,499 or less | 593 (2.7%) | 879 (4.6%) |
| $2,500 to $4,999 | 875 (3.9%) | 578 (3.0%) |
| $5,000 to $7,499 | 722 (3.3%) | 719 (3.8%) |
| $7,500 to $9,999 | 152 (0.7%) | 534 (2.8%) |
| $10,000 to $12,499 | 451 (2.0%) | 989 (5.2%) |
| $12,500 to $14,999 | 449 (2.0%) | 688 (3.6%) |
| $15,000 to $17,499 | 413 (1.9%) | 597 (3.2%) |
| $17,500 to $19,999 | 438 (2.0%) | 316 (1.7%) |
| $20,000 to $22,499 | 647 (2.9%) | 722 (3.8%) |
| $22,500 to $24,999 | 729 (3.3%) | 557 (2.9%) |
| $25,000 to $29,999 | 1,440 (6.5%) | 1,801 (9.5%) |
| $30,000 to $34,999 | 1,665 (7.5%) | 1,526 (8.1%) |
| $35,000 to $39,999 | 1,484 (6.7%) | 1,519 (8.0%) |
| $40,000 to $44,999 | 1,288 (5.8%) | 1,150 (6.1%) |
| $45,000 to $49,999 | 1,061 (4.8%) | 875 (4.6%) |
| $50,000 to $54,999 | 761 (3.4%) | 666 (3.5%) |
| $55,000 to $64,999 | 1,995 (9.0%) | 1,039 (5.5%) |
| $65,000 to $74,999 | 1,089 (4.9%) | 841 (4.4%) |
| $75,000 to $99,999 | 2,104 (9.5%) | 1,477 (7.8%) |
| $100,000+ | 3,859 (17.4%) | 1,460 (7.7%) |
| Total | 22,215 (100.0%) | 18,933 (100.0%) |
Earnings by Sex by Educational Attainment in Chelan County
Average earnings in Chelan County are $49,891 for men and $38,370 for women, a difference of 23.1%. Men with an educational attainment of graduate degree enjoy the highest average annual earnings of $96,875, while those with less than high school education earn the least with $35,965. Women with an educational attainment of graduate degree earn the most with the average annual earnings of $77,872, while those with less than high school education have the smallest earnings of $25,971.
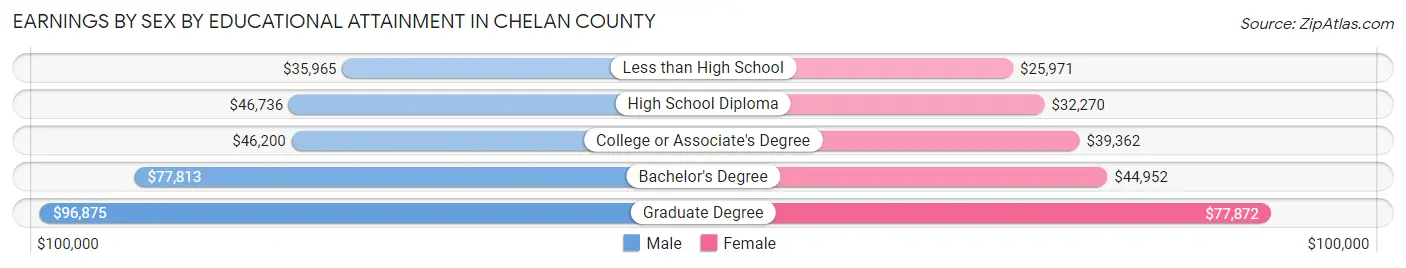
| Educational Attainment | Male Income | Female Income |
| Less than High School | $35,965 | $25,971 |
| High School Diploma | $46,736 | $32,270 |
| College or Associate's Degree | $46,200 | $39,362 |
| Bachelor's Degree | $77,813 | $44,952 |
| Graduate Degree | $96,875 | $77,872 |
| Total | $49,891 | $38,370 |
Family Income in Chelan County
Family Income Brackets in Chelan County
According to the Chelan County family income data, there are 3,937 families falling into the $100,000 to $149,999 income range, which is the most common income bracket and makes up 19.8% of all families. Conversely, the $10,000 to $14,999 income bracket is the least frequent group with only 239 families (1.2%) belonging to this category.
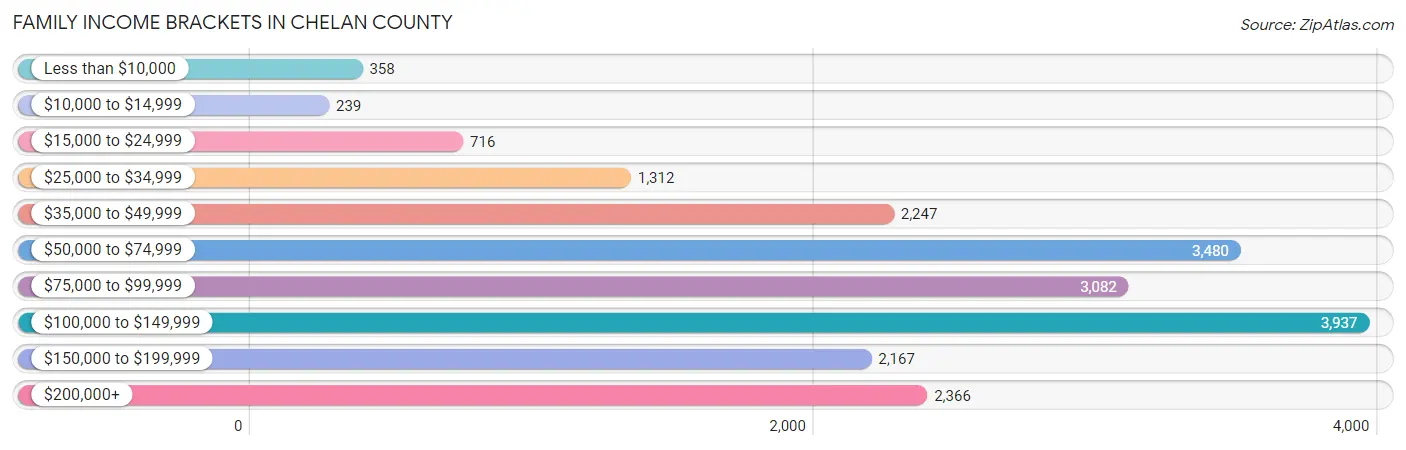
| Income Bracket | # Families | % Families |
| Less than $10,000 | 358 | 1.8% |
| $10,000 to $14,999 | 239 | 1.2% |
| $15,000 to $24,999 | 716 | 3.6% |
| $25,000 to $34,999 | 1,312 | 6.6% |
| $35,000 to $49,999 | 2,247 | 11.3% |
| $50,000 to $74,999 | 3,480 | 17.5% |
| $75,000 to $99,999 | 3,082 | 15.5% |
| $100,000 to $149,999 | 3,937 | 19.8% |
| $150,000 to $199,999 | 2,167 | 10.9% |
| $200,000+ | 2,366 | 11.9% |
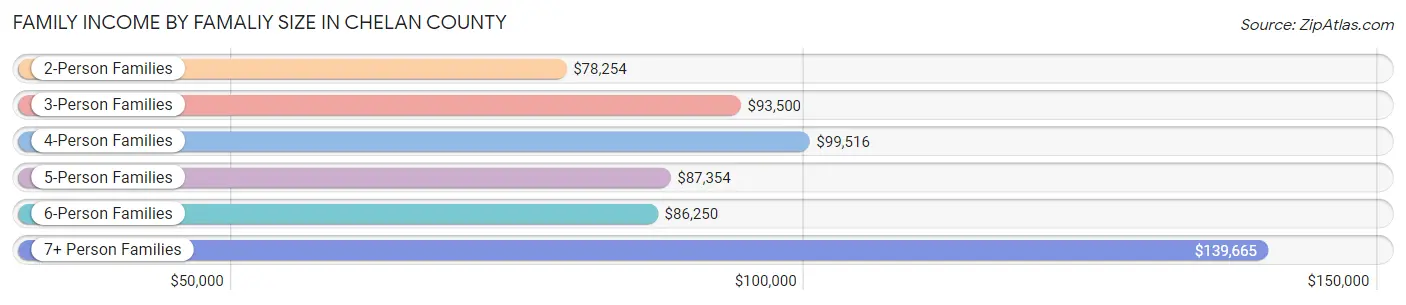
Family Income by Famaliy Size in Chelan County
7+ person families (283 | 1.4%) account for the highest median family income in Chelan County with $139,665 per family, while 2-person families (9,938 | 50.0%) have the highest median income of $39,127 per family member.
| Income Bracket | # Families | Median Income |
| 2-Person Families | 9,938 (50.0%) | $78,254 |
| 3-Person Families | 3,800 (19.1%) | $93,500 |
| 4-Person Families | 3,454 (17.4%) | $99,516 |
| 5-Person Families | 1,950 (9.8%) | $87,354 |
| 6-Person Families | 459 (2.3%) | $86,250 |
| 7+ Person Families | 283 (1.4%) | $139,665 |
| Total | 19,884 (100.0%) | $85,727 |
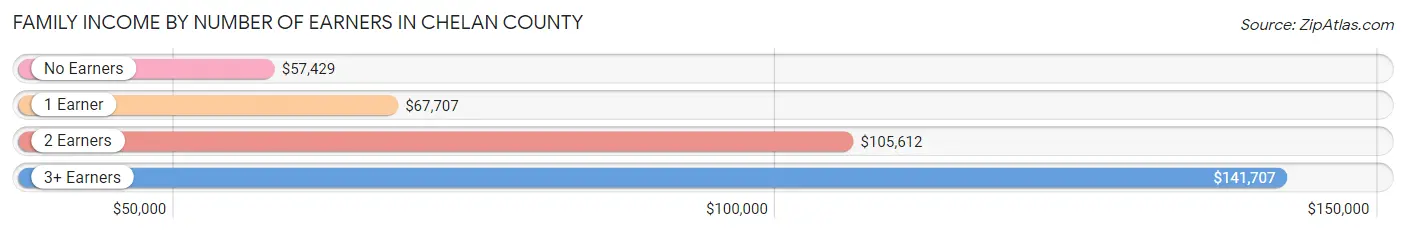
Family Income by Number of Earners in Chelan County
The median family income in Chelan County is $85,727, with families comprising 3+ earners (2,325) having the highest median family income of $141,707, while families with no earners (3,753) have the lowest median family income of $57,429, accounting for 11.7% and 18.9% of families, respectively.
| Number of Earners | # Families | Median Income |
| No Earners | 3,753 (18.9%) | $57,429 |
| 1 Earner | 5,728 (28.8%) | $67,707 |
| 2 Earners | 8,078 (40.6%) | $105,612 |
| 3+ Earners | 2,325 (11.7%) | $141,707 |
| Total | 19,884 (100.0%) | $85,727 |
Household Income in Chelan County
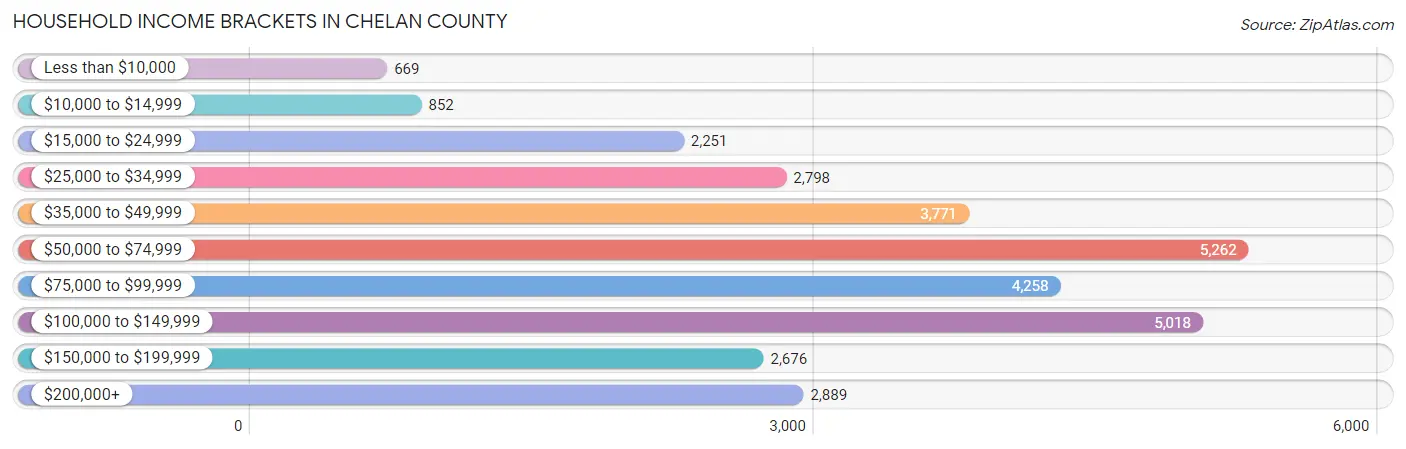
Household Income Brackets in Chelan County
With 5,262 households falling in the category, the $50,000 to $74,999 income range is the most frequent in Chelan County, accounting for 17.3% of all households. In contrast, only 669 households (2.2%) fall into the less than $10,000 income bracket, making it the least populous group.
| Income Bracket | # Households | % Households |
| Less than $10,000 | 669 | 2.2% |
| $10,000 to $14,999 | 852 | 2.8% |
| $15,000 to $24,999 | 2,251 | 7.4% |
| $25,000 to $34,999 | 2,798 | 9.2% |
| $35,000 to $49,999 | 3,771 | 12.4% |
| $50,000 to $74,999 | 5,262 | 17.3% |
| $75,000 to $99,999 | 4,258 | 14.0% |
| $100,000 to $149,999 | 5,018 | 16.5% |
| $150,000 to $199,999 | 2,676 | 8.8% |
| $200,000+ | 2,889 | 9.5% |
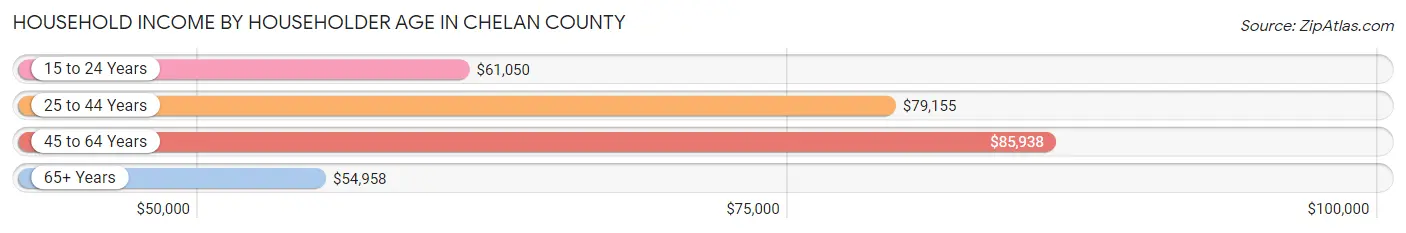
Household Income by Householder Age in Chelan County
The median household income in Chelan County is $71,876, with the highest median household income of $85,938 found in the 45 to 64 years age bracket for the primary householder. A total of 10,852 households (35.7%) fall into this category. Meanwhile, the 65+ years age bracket for the primary householder has the lowest median household income of $54,958, with 9,575 households (31.5%) in this group.
| Income Bracket | # Households | Median Income |
| 15 to 24 Years | 957 (3.2%) | $61,050 |
| 25 to 44 Years | 9,030 (29.7%) | $79,155 |
| 45 to 64 Years | 10,852 (35.7%) | $85,938 |
| 65+ Years | 9,575 (31.5%) | $54,958 |
| Total | 30,414 (100.0%) | $71,876 |
Poverty in Chelan County
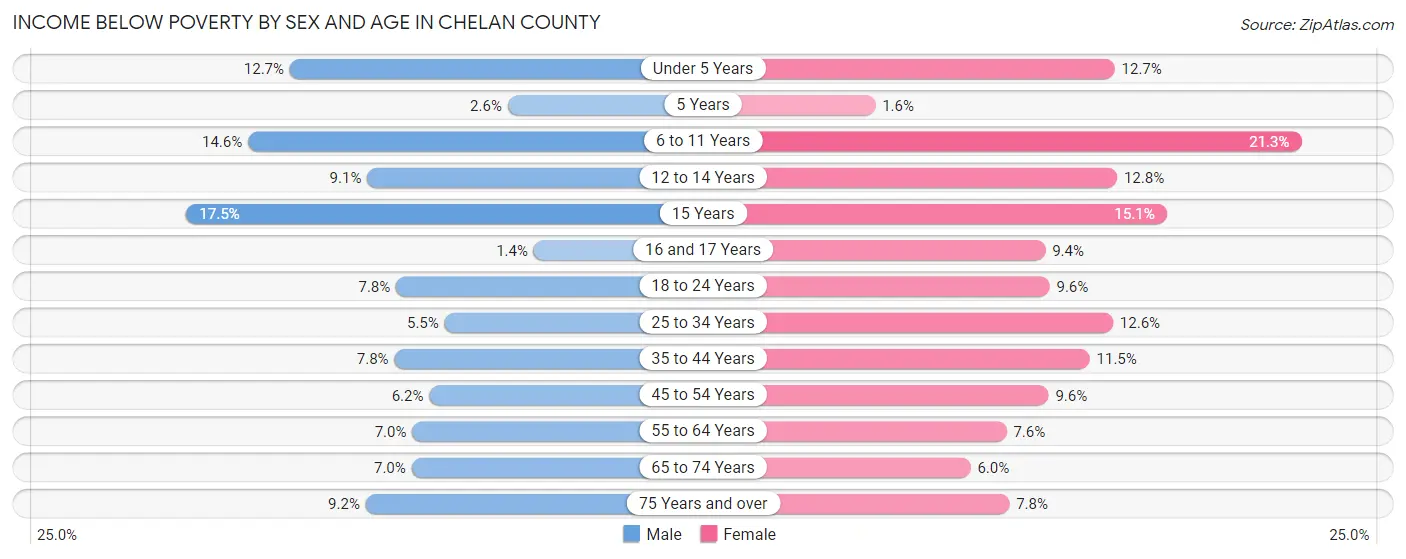
Income Below Poverty by Sex and Age in Chelan County
With 8.0% poverty level for males and 10.4% for females among the residents of Chelan County, 15 year old males and 6 to 11 year old females are the most vulnerable to poverty, with 113 males (17.5%) and 576 females (21.3%) in their respective age groups living below the poverty level.
| Age Bracket | Male | Female |
| Under 5 Years | 288 (12.7%) | 279 (12.7%) |
| 5 Years | 13 (2.6%) | 8 (1.5%) |
| 6 to 11 Years | 453 (14.6%) | 576 (21.3%) |
| 12 to 14 Years | 166 (9.1%) | 215 (12.8%) |
| 15 Years | 113 (17.5%) | 82 (15.1%) |
| 16 and 17 Years | 13 (1.4%) | 88 (9.4%) |
| 18 to 24 Years | 253 (7.8%) | 306 (9.6%) |
| 25 to 34 Years | 280 (5.5%) | 576 (12.6%) |
| 35 to 44 Years | 375 (7.8%) | 554 (11.5%) |
| 45 to 54 Years | 274 (6.2%) | 404 (9.6%) |
| 55 to 64 Years | 368 (7.0%) | 411 (7.6%) |
| 65 to 74 Years | 328 (7.0%) | 276 (6.0%) |
| 75 Years and over | 249 (9.2%) | 264 (7.8%) |
| Total | 3,173 (8.0%) | 4,039 (10.4%) |
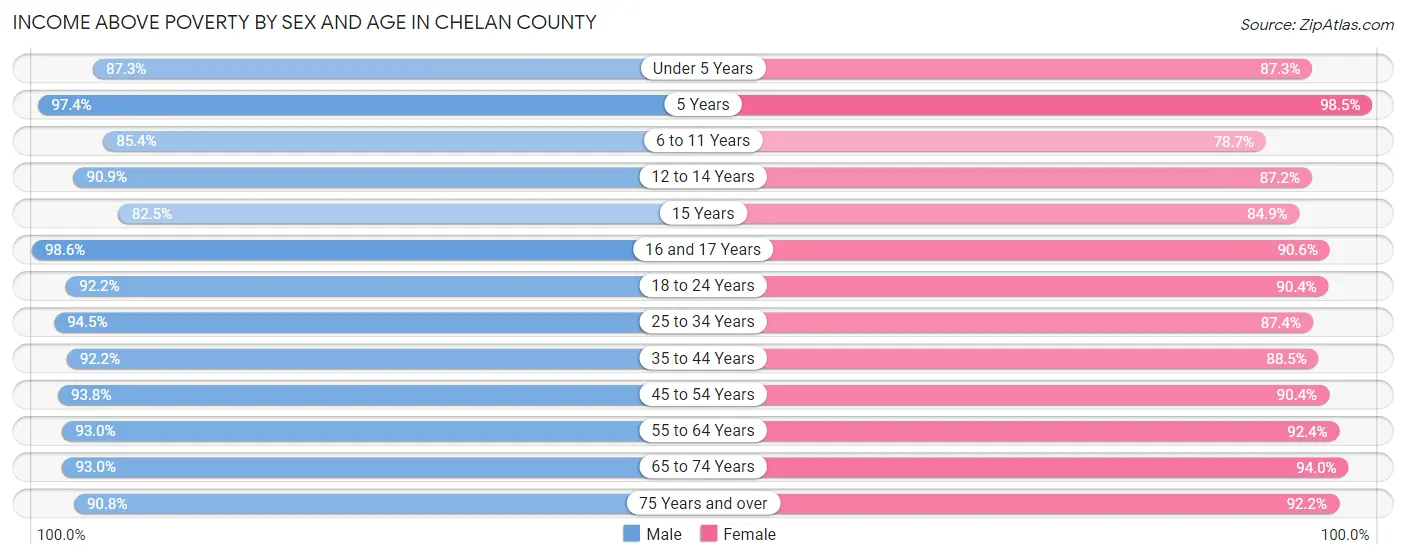
Income Above Poverty by Sex and Age in Chelan County
According to the poverty statistics in Chelan County, males aged 16 and 17 years and females aged 5 years are the age groups that are most secure financially, with 98.6% of males and 98.5% of females in these age groups living above the poverty line.
| Age Bracket | Male | Female |
| Under 5 Years | 1,981 (87.3%) | 1,925 (87.3%) |
| 5 Years | 490 (97.4%) | 508 (98.5%) |
| 6 to 11 Years | 2,643 (85.4%) | 2,126 (78.7%) |
| 12 to 14 Years | 1,658 (90.9%) | 1,469 (87.2%) |
| 15 Years | 533 (82.5%) | 462 (84.9%) |
| 16 and 17 Years | 939 (98.6%) | 844 (90.6%) |
| 18 to 24 Years | 3,009 (92.2%) | 2,869 (90.4%) |
| 25 to 34 Years | 4,803 (94.5%) | 4,001 (87.4%) |
| 35 to 44 Years | 4,408 (92.2%) | 4,263 (88.5%) |
| 45 to 54 Years | 4,134 (93.8%) | 3,808 (90.4%) |
| 55 to 64 Years | 4,883 (93.0%) | 4,968 (92.4%) |
| 65 to 74 Years | 4,329 (93.0%) | 4,349 (94.0%) |
| 75 Years and over | 2,465 (90.8%) | 3,134 (92.2%) |
| Total | 36,275 (92.0%) | 34,726 (89.6%) |
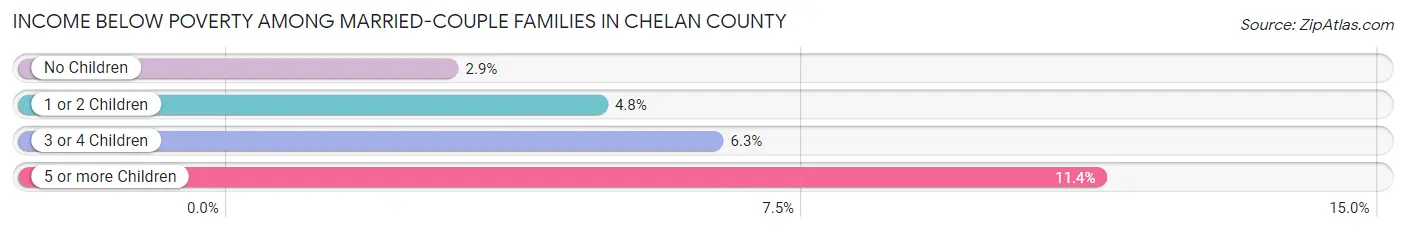
Income Below Poverty Among Married-Couple Families in Chelan County
The poverty statistics for married-couple families in Chelan County show that 3.8% or 582 of the total 15,128 families live below the poverty line. Families with 5 or more children have the highest poverty rate of 11.4%, comprising of 16 families. On the other hand, families with no children have the lowest poverty rate of 2.9%, which includes 262 families.
| Children | Above Poverty | Below Poverty |
| No Children | 8,851 (97.1%) | 262 (2.9%) |
| 1 or 2 Children | 4,314 (95.2%) | 219 (4.8%) |
| 3 or 4 Children | 1,256 (93.7%) | 85 (6.3%) |
| 5 or more Children | 125 (88.6%) | 16 (11.4%) |
| Total | 14,546 (96.2%) | 582 (3.8%) |
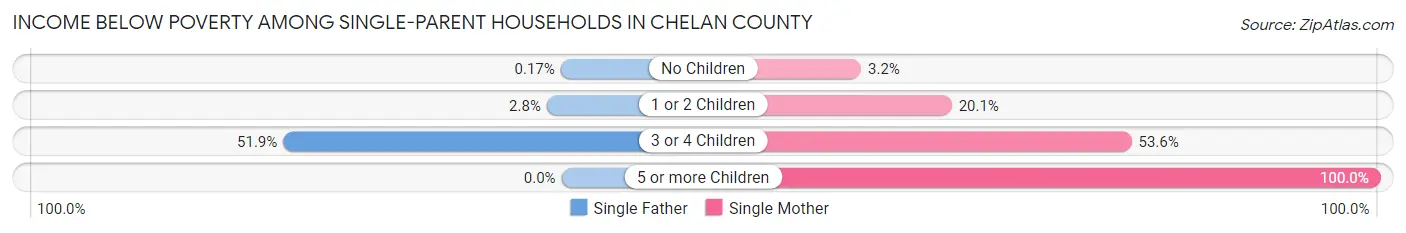
Income Below Poverty Among Single-Parent Households in Chelan County
According to the poverty data in Chelan County, 2.6% or 39 single-father households and 20.1% or 658 single-mother households are living below the poverty line. Among single-father households, those with 3 or 4 children have the highest poverty rate, with 14 households (51.8%) experiencing poverty. Likewise, among single-mother households, those with 5 or more children have the highest poverty rate, with 29 households (100.0%) falling below the poverty line.
| Children | Single Father | Single Mother |
| No Children | 1 (0.2%) | 42 (3.2%) |
| 1 or 2 Children | 24 (2.8%) | 276 (20.1%) |
| 3 or 4 Children | 14 (51.8%) | 311 (53.6%) |
| 5 or more Children | 0 (0.0%) | 29 (100.0%) |
| Total | 39 (2.6%) | 658 (20.1%) |
Income Below Poverty Among Married-Couple vs Single-Parent Households in Chelan County
The poverty data for Chelan County shows that 582 of the married-couple family households (3.8%) and 697 of the single-parent households (14.7%) are living below the poverty level. Within the married-couple family households, those with 5 or more children have the highest poverty rate, with 16 households (11.4%) falling below the poverty line. Among the single-parent households, those with 5 or more children have the highest poverty rate, with 29 household (100.0%) living below poverty.
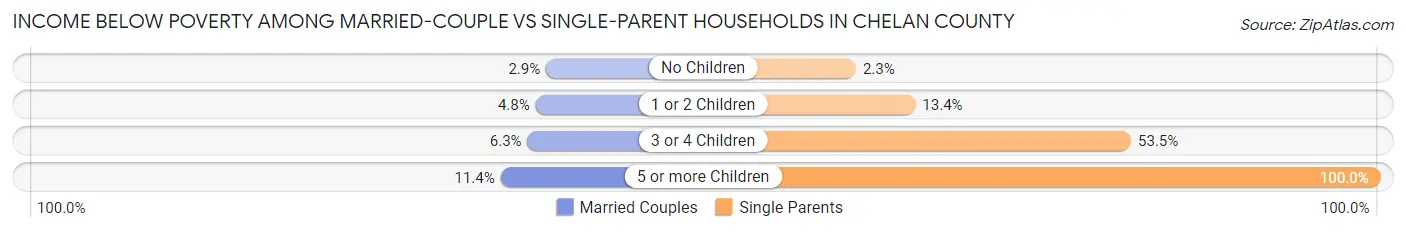
| Children | Married-Couple Families | Single-Parent Households |
| No Children | 262 (2.9%) | 43 (2.3%) |
| 1 or 2 Children | 219 (4.8%) | 300 (13.4%) |
| 3 or 4 Children | 85 (6.3%) | 325 (53.5%) |
| 5 or more Children | 16 (11.4%) | 29 (100.0%) |
| Total | 582 (3.8%) | 697 (14.7%) |
Employment Characteristics in Chelan County
Employment by Class of Employer in Chelan County
Among the 36,824 employed individuals in Chelan County, private company employees (24,159 | 65.6%), not-for-profit organizations (2,958 | 8.0%), and local government employees (2,773 | 7.5%) make up the most common classes of employment.
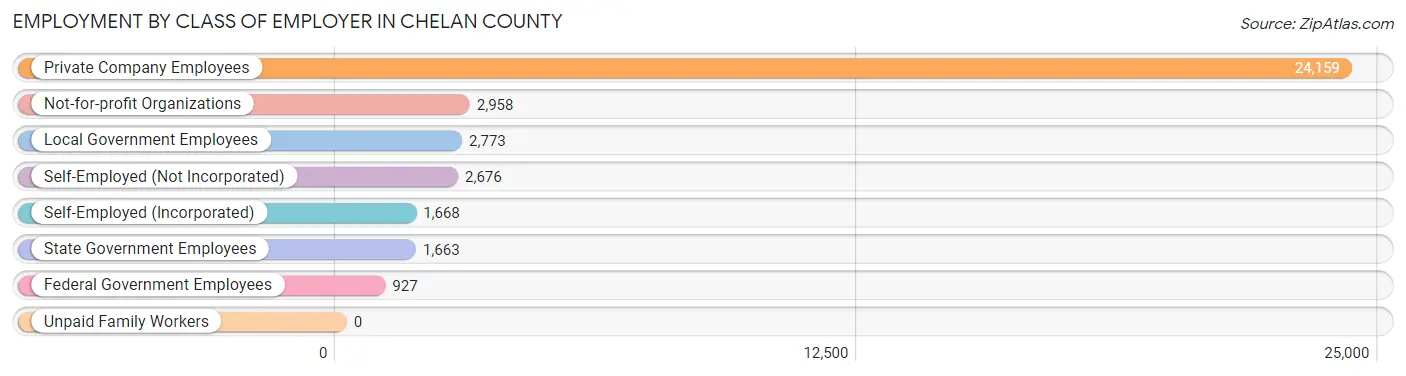
| Employer Class | # Employees | % Employees |
| Private Company Employees | 24,159 | 65.6% |
| Self-Employed (Incorporated) | 1,668 | 4.5% |
| Self-Employed (Not Incorporated) | 2,676 | 7.3% |
| Not-for-profit Organizations | 2,958 | 8.0% |
| Local Government Employees | 2,773 | 7.5% |
| State Government Employees | 1,663 | 4.5% |
| Federal Government Employees | 927 | 2.5% |
| Unpaid Family Workers | 0 | 0.0% |
| Total | 36,824 | 100.0% |
Employment Status by Age in Chelan County
According to the labor force statistics for Chelan County, out of the total population over 16 years of age (62,845), 61.6% or 38,713 individuals are in the labor force, with 3.4% or 1,316 of them unemployed. The age group with the highest labor force participation rate is 30 to 34 years, with 86.4% or 4,271 individuals in the labor force. Within the labor force, the 16 to 19 years age range has the highest percentage of unemployed individuals, with 10.9% or 176 of them being unemployed.
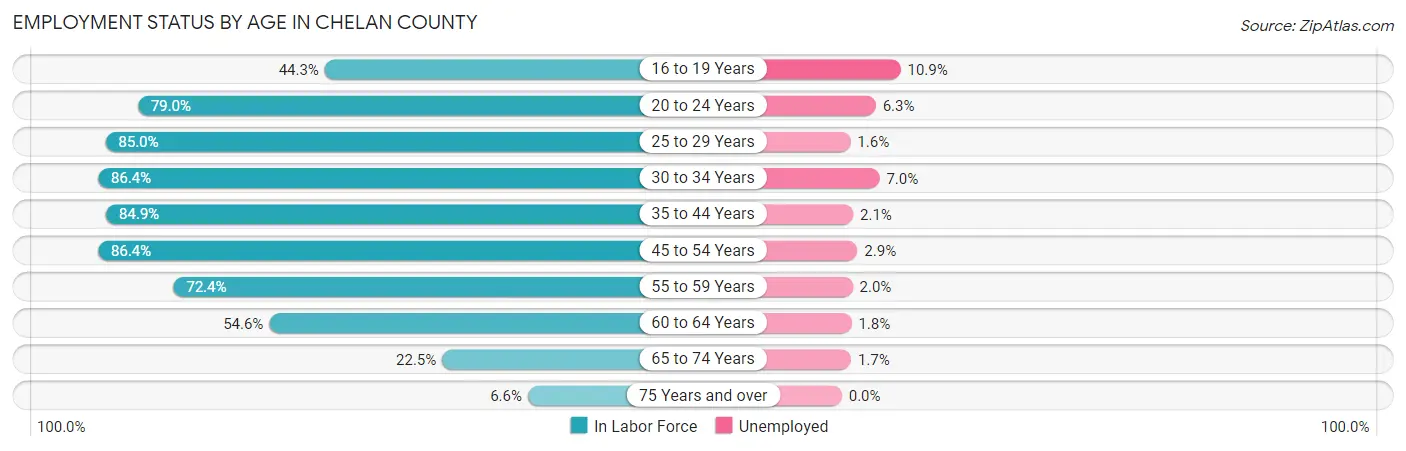
| Age Bracket | In Labor Force | Unemployed |
| 16 to 19 Years | 1,617 (44.3%) | 176 (10.9%) |
| 20 to 24 Years | 3,760 (79.0%) | 237 (6.3%) |
| 25 to 29 Years | 4,065 (85.0%) | 65 (1.6%) |
| 30 to 34 Years | 4,271 (86.4%) | 299 (7.0%) |
| 35 to 44 Years | 8,189 (84.9%) | 172 (2.1%) |
| 45 to 54 Years | 7,468 (86.4%) | 217 (2.9%) |
| 55 to 59 Years | 3,875 (72.4%) | 78 (2.0%) |
| 60 to 64 Years | 2,915 (54.6%) | 52 (1.8%) |
| 65 to 74 Years | 2,106 (22.5%) | 36 (1.7%) |
| 75 Years and over | 420 (6.6%) | 0 (0.0%) |
| Total | 38,713 (61.6%) | 1,316 (3.4%) |
Employment Status by Educational Attainment in Chelan County
According to labor force statistics for Chelan County, 79.5% of individuals (30,770) out of the total population between 25 and 64 years of age (38,705) are in the labor force, with 2.9% or 892 of them being unemployed. The group with the highest labor force participation rate are those with the educational attainment of bachelor's degree or higher, with 84.6% or 9,589 individuals in the labor force. Within the labor force, individuals with less than high school education have the highest percentage of unemployment, with 4.0% or 194 of them being unemployed.
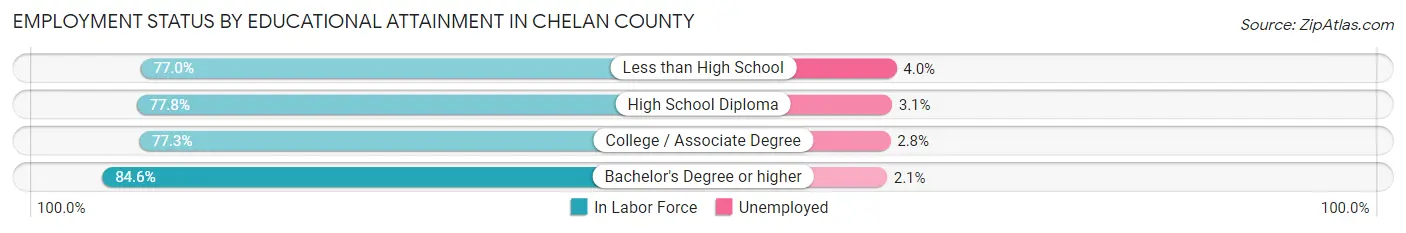
| Educational Attainment | In Labor Force | Unemployed |
| Less than High School | 4,846 (77.0%) | 252 (4.0%) |
| High School Diploma | 7,159 (77.8%) | 285 (3.1%) |
| College / Associate Degree | 9,180 (77.3%) | 333 (2.8%) |
| Bachelor's Degree or higher | 9,589 (84.6%) | 238 (2.1%) |
| Total | 30,770 (79.5%) | 1,122 (2.9%) |
Employment Occupations by Sex in Chelan County
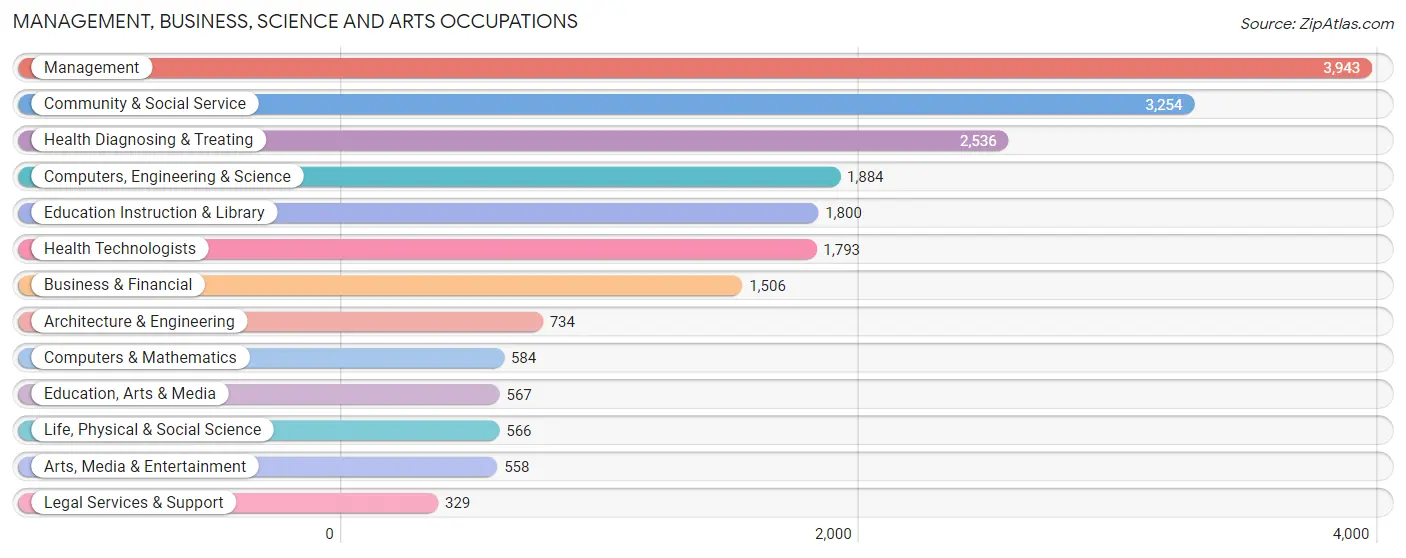
Management, Business, Science and Arts Occupations
The most common Management, Business, Science and Arts occupations in Chelan County are Management (3,943 | 10.6%), Community & Social Service (3,254 | 8.7%), Health Diagnosing & Treating (2,536 | 6.8%), Computers, Engineering & Science (1,884 | 5.1%), and Education Instruction & Library (1,800 | 4.8%).
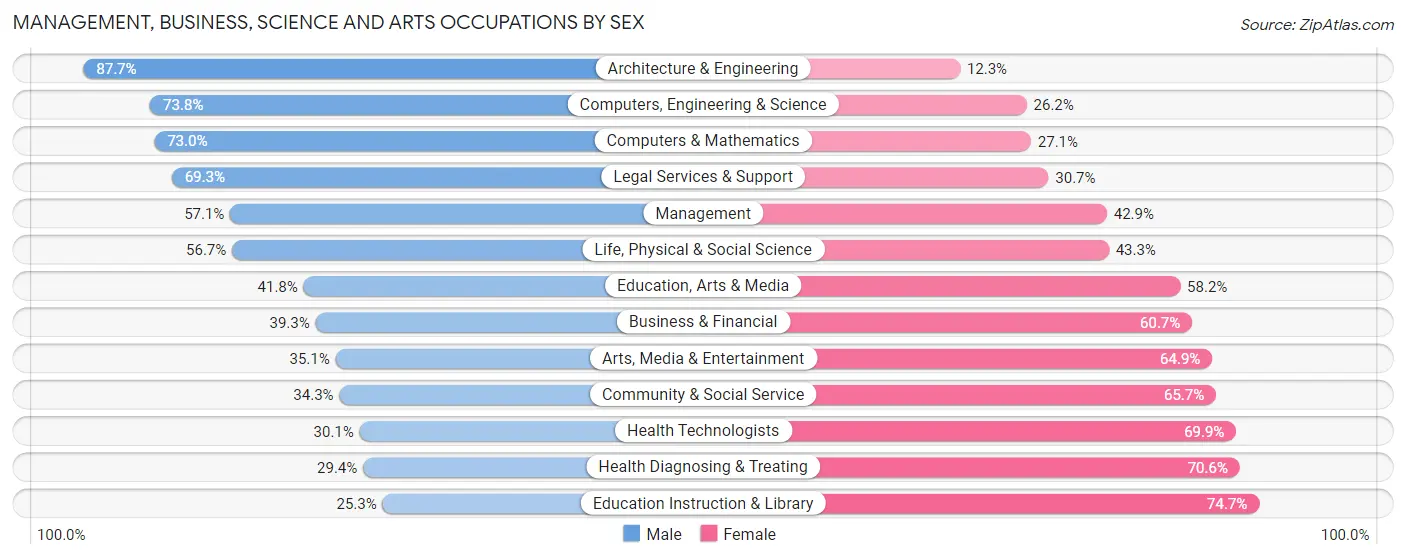
Management, Business, Science and Arts Occupations by Sex
Within the Management, Business, Science and Arts occupations in Chelan County, the most male-oriented occupations are Architecture & Engineering (87.7%), Computers, Engineering & Science (73.8%), and Computers & Mathematics (73.0%), while the most female-oriented occupations are Education Instruction & Library (74.7%), Health Diagnosing & Treating (70.6%), and Health Technologists (69.9%).
| Occupation | Male | Female |
| Management | 2,252 (57.1%) | 1,691 (42.9%) |
| Business & Financial | 592 (39.3%) | 914 (60.7%) |
| Computers, Engineering & Science | 1,391 (73.8%) | 493 (26.2%) |
| Computers & Mathematics | 426 (73.0%) | 158 (27.1%) |
| Architecture & Engineering | 644 (87.7%) | 90 (12.3%) |
| Life, Physical & Social Science | 321 (56.7%) | 245 (43.3%) |
| Community & Social Service | 1,117 (34.3%) | 2,137 (65.7%) |
| Education, Arts & Media | 237 (41.8%) | 330 (58.2%) |
| Legal Services & Support | 228 (69.3%) | 101 (30.7%) |
| Education Instruction & Library | 456 (25.3%) | 1,344 (74.7%) |
| Arts, Media & Entertainment | 196 (35.1%) | 362 (64.9%) |
| Health Diagnosing & Treating | 745 (29.4%) | 1,791 (70.6%) |
| Health Technologists | 540 (30.1%) | 1,253 (69.9%) |
| Total (Category) | 6,097 (46.5%) | 7,026 (53.5%) |
| Total (Overall) | 19,904 (53.4%) | 17,332 (46.6%) |
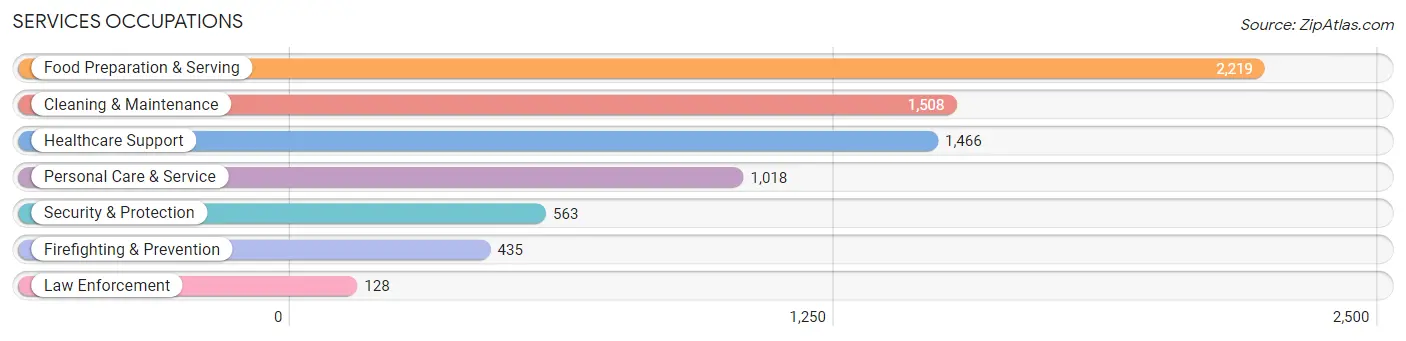
Services Occupations
The most common Services occupations in Chelan County are Food Preparation & Serving (2,219 | 6.0%), Cleaning & Maintenance (1,508 | 4.1%), Healthcare Support (1,466 | 3.9%), Personal Care & Service (1,018 | 2.7%), and Security & Protection (563 | 1.5%).
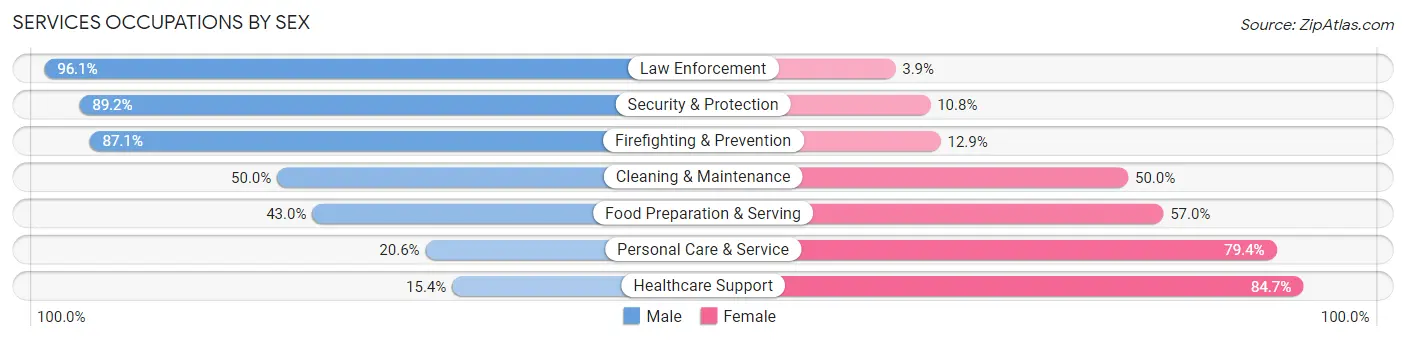
Services Occupations by Sex
Within the Services occupations in Chelan County, the most male-oriented occupations are Law Enforcement (96.1%), Security & Protection (89.2%), and Firefighting & Prevention (87.1%), while the most female-oriented occupations are Healthcare Support (84.7%), Personal Care & Service (79.4%), and Food Preparation & Serving (57.0%).
| Occupation | Male | Female |
| Healthcare Support | 225 (15.3%) | 1,241 (84.7%) |
| Security & Protection | 502 (89.2%) | 61 (10.8%) |
| Firefighting & Prevention | 379 (87.1%) | 56 (12.9%) |
| Law Enforcement | 123 (96.1%) | 5 (3.9%) |
| Food Preparation & Serving | 955 (43.0%) | 1,264 (57.0%) |
| Cleaning & Maintenance | 754 (50.0%) | 754 (50.0%) |
| Personal Care & Service | 210 (20.6%) | 808 (79.4%) |
| Total (Category) | 2,646 (39.1%) | 4,128 (60.9%) |
| Total (Overall) | 19,904 (53.4%) | 17,332 (46.6%) |
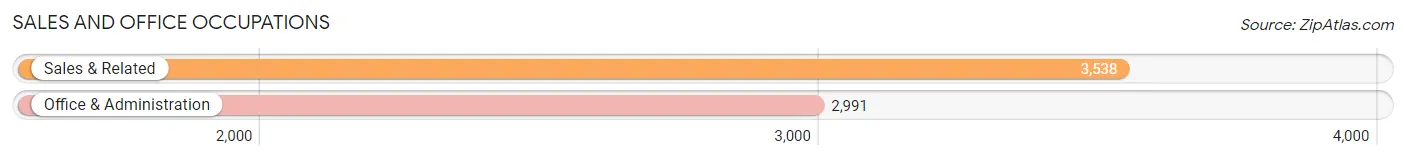
Sales and Office Occupations
The most common Sales and Office occupations in Chelan County are Sales & Related (3,538 | 9.5%), and Office & Administration (2,991 | 8.0%).
Sales and Office Occupations by Sex
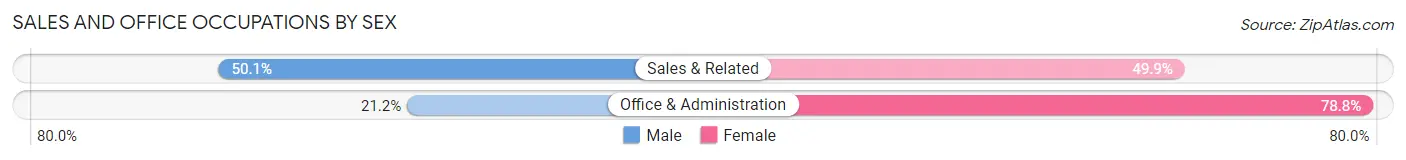
| Occupation | Male | Female |
| Sales & Related | 1,774 (50.1%) | 1,764 (49.9%) |
| Office & Administration | 633 (21.2%) | 2,358 (78.8%) |
| Total (Category) | 2,407 (36.9%) | 4,122 (63.1%) |
| Total (Overall) | 19,904 (53.4%) | 17,332 (46.6%) |
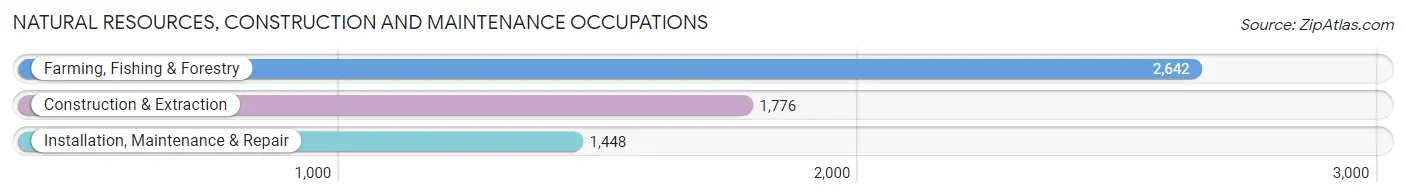
Natural Resources, Construction and Maintenance Occupations
The most common Natural Resources, Construction and Maintenance occupations in Chelan County are Farming, Fishing & Forestry (2,642 | 7.1%), Construction & Extraction (1,776 | 4.8%), and Installation, Maintenance & Repair (1,448 | 3.9%).
Natural Resources, Construction and Maintenance Occupations by Sex
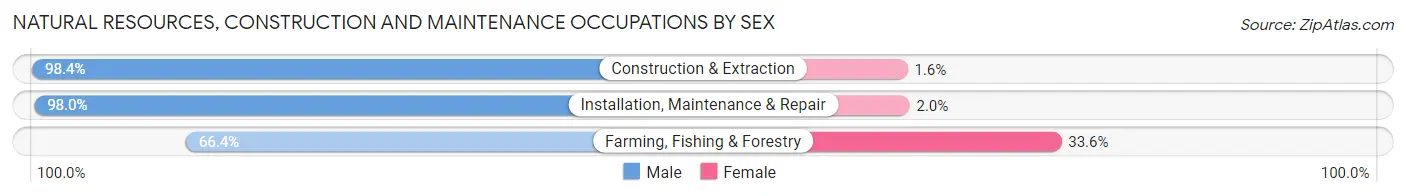
| Occupation | Male | Female |
| Farming, Fishing & Forestry | 1,755 (66.4%) | 887 (33.6%) |
| Construction & Extraction | 1,748 (98.4%) | 28 (1.6%) |
| Installation, Maintenance & Repair | 1,419 (98.0%) | 29 (2.0%) |
| Total (Category) | 4,922 (83.9%) | 944 (16.1%) |
| Total (Overall) | 19,904 (53.4%) | 17,332 (46.6%) |
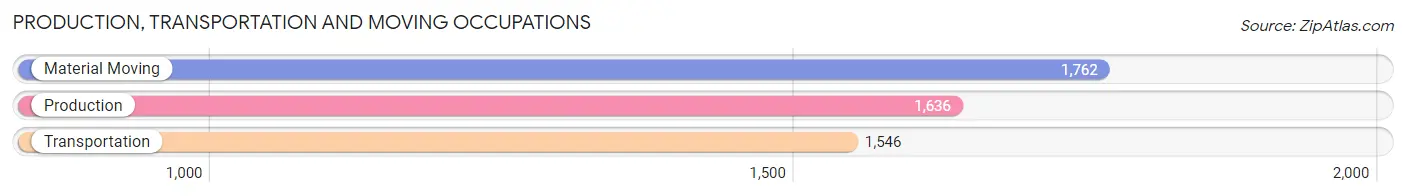
Production, Transportation and Moving Occupations
The most common Production, Transportation and Moving occupations in Chelan County are Material Moving (1,762 | 4.7%), Production (1,636 | 4.4%), and Transportation (1,546 | 4.2%).
Production, Transportation and Moving Occupations by Sex
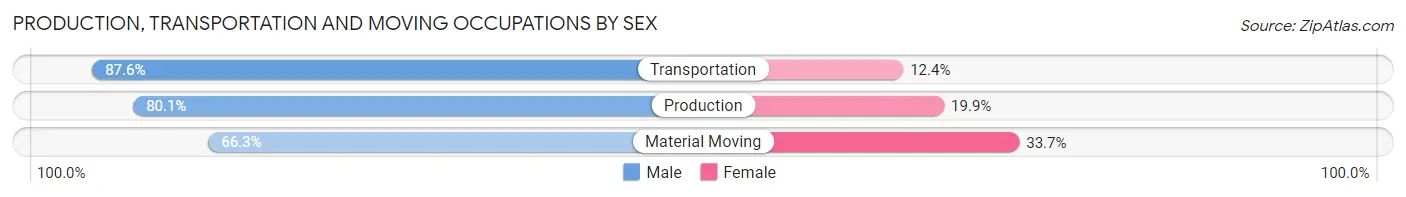
| Occupation | Male | Female |
| Production | 1,310 (80.1%) | 326 (19.9%) |
| Transportation | 1,354 (87.6%) | 192 (12.4%) |
| Material Moving | 1,168 (66.3%) | 594 (33.7%) |
| Total (Category) | 3,832 (77.5%) | 1,112 (22.5%) |
| Total (Overall) | 19,904 (53.4%) | 17,332 (46.6%) |
Employment Industries by Sex in Chelan County
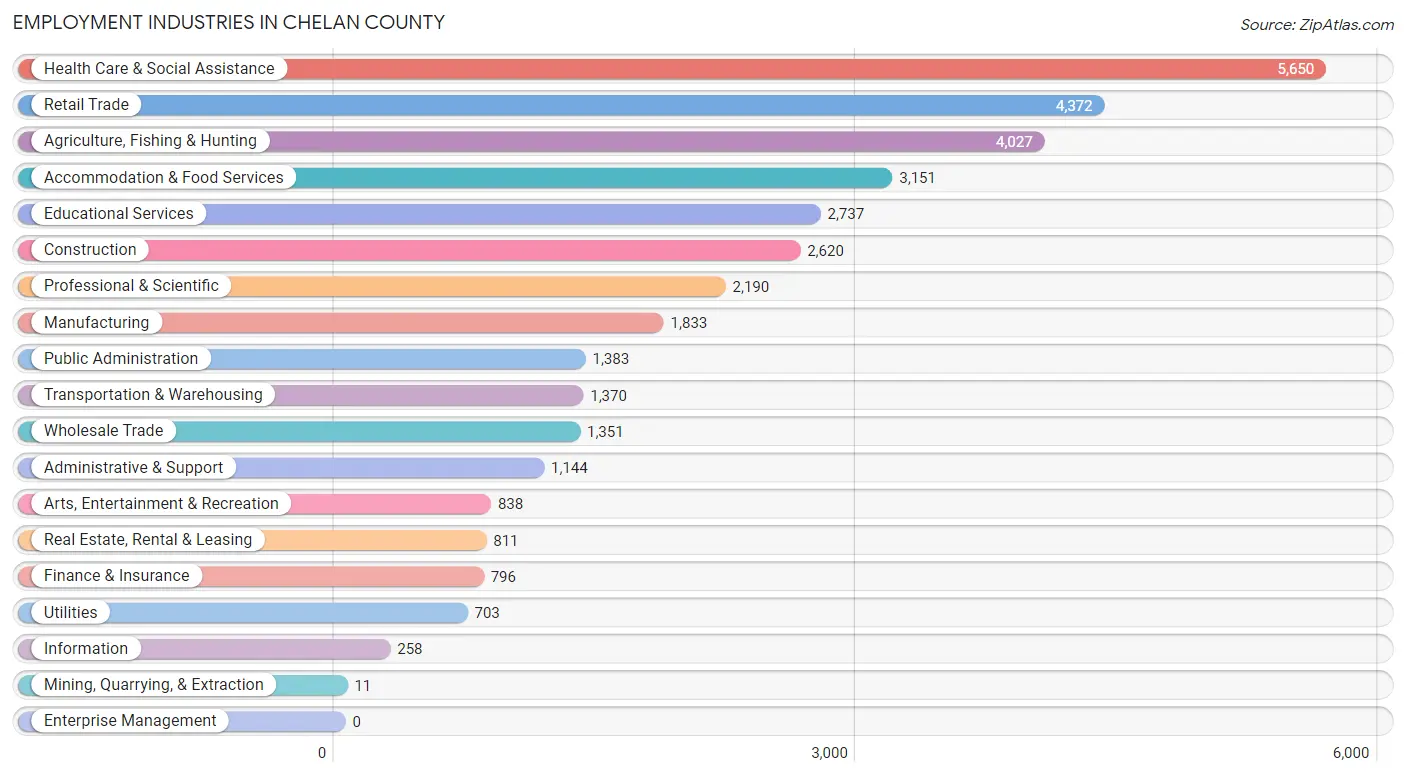
Employment Industries in Chelan County
The major employment industries in Chelan County include Health Care & Social Assistance (5,650 | 15.2%), Retail Trade (4,372 | 11.7%), Agriculture, Fishing & Hunting (4,027 | 10.8%), Accommodation & Food Services (3,151 | 8.5%), and Educational Services (2,737 | 7.3%).
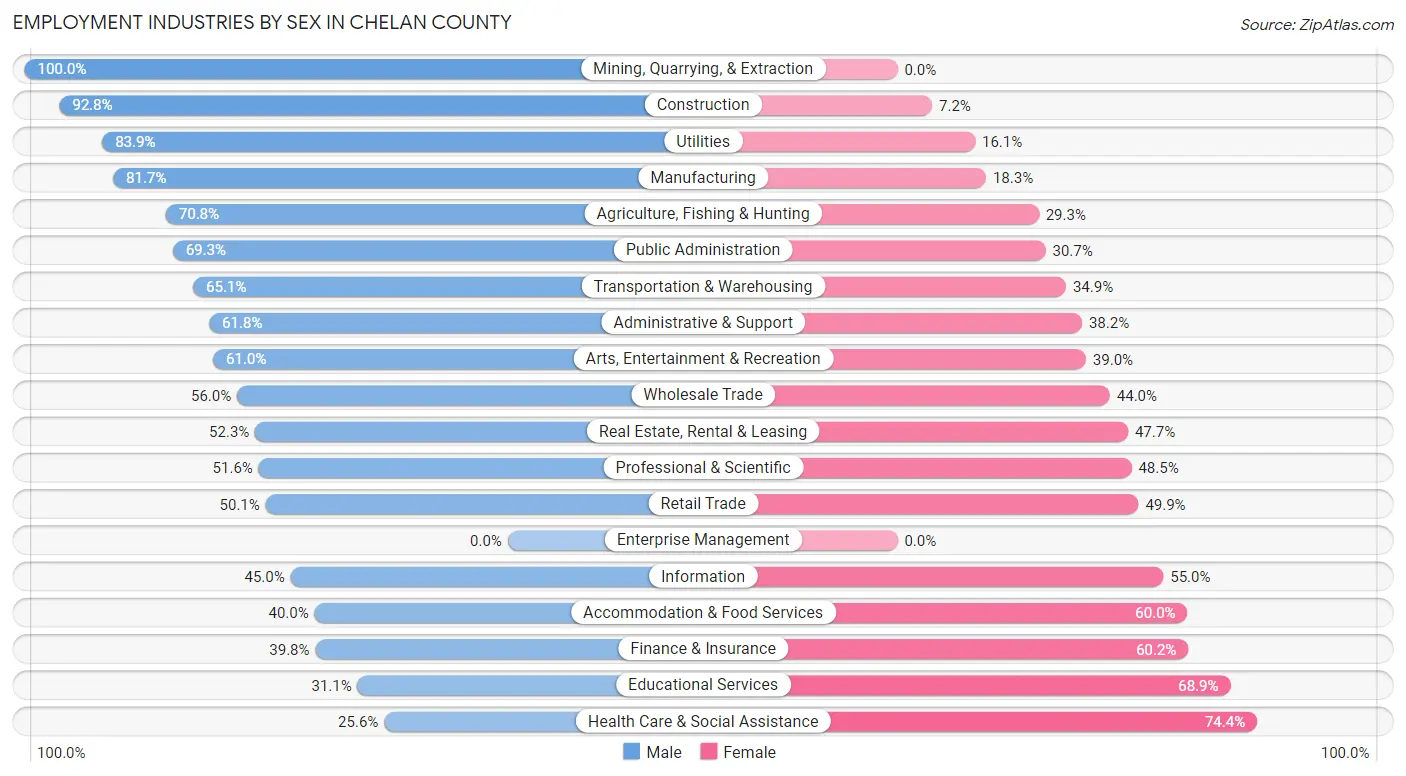
Employment Industries by Sex in Chelan County
The Chelan County industries that see more men than women are Mining, Quarrying, & Extraction (100.0%), Construction (92.8%), and Utilities (83.9%), whereas the industries that tend to have a higher number of women are Health Care & Social Assistance (74.4%), Educational Services (68.9%), and Finance & Insurance (60.2%).
| Industry | Male | Female |
| Agriculture, Fishing & Hunting | 2,849 (70.8%) | 1,178 (29.2%) |
| Mining, Quarrying, & Extraction | 11 (100.0%) | 0 (0.0%) |
| Construction | 2,432 (92.8%) | 188 (7.2%) |
| Manufacturing | 1,497 (81.7%) | 336 (18.3%) |
| Wholesale Trade | 757 (56.0%) | 594 (44.0%) |
| Retail Trade | 2,191 (50.1%) | 2,181 (49.9%) |
| Transportation & Warehousing | 892 (65.1%) | 478 (34.9%) |
| Utilities | 590 (83.9%) | 113 (16.1%) |
| Information | 116 (45.0%) | 142 (55.0%) |
| Finance & Insurance | 317 (39.8%) | 479 (60.2%) |
| Real Estate, Rental & Leasing | 424 (52.3%) | 387 (47.7%) |
| Professional & Scientific | 1,129 (51.5%) | 1,061 (48.4%) |
| Enterprise Management | 0 (0.0%) | 0 (0.0%) |
| Administrative & Support | 707 (61.8%) | 437 (38.2%) |
| Educational Services | 851 (31.1%) | 1,886 (68.9%) |
| Health Care & Social Assistance | 1,445 (25.6%) | 4,205 (74.4%) |
| Arts, Entertainment & Recreation | 511 (61.0%) | 327 (39.0%) |
| Accommodation & Food Services | 1,260 (40.0%) | 1,891 (60.0%) |
| Public Administration | 959 (69.3%) | 424 (30.7%) |
| Total | 19,904 (53.4%) | 17,332 (46.6%) |
Education in Chelan County
School Enrollment in Chelan County
The most common levels of schooling among the 17,955 students in Chelan County are middle school (4,197 | 23.4%), high school (4,123 | 23.0%), and elementary school (4,119 | 22.9%).
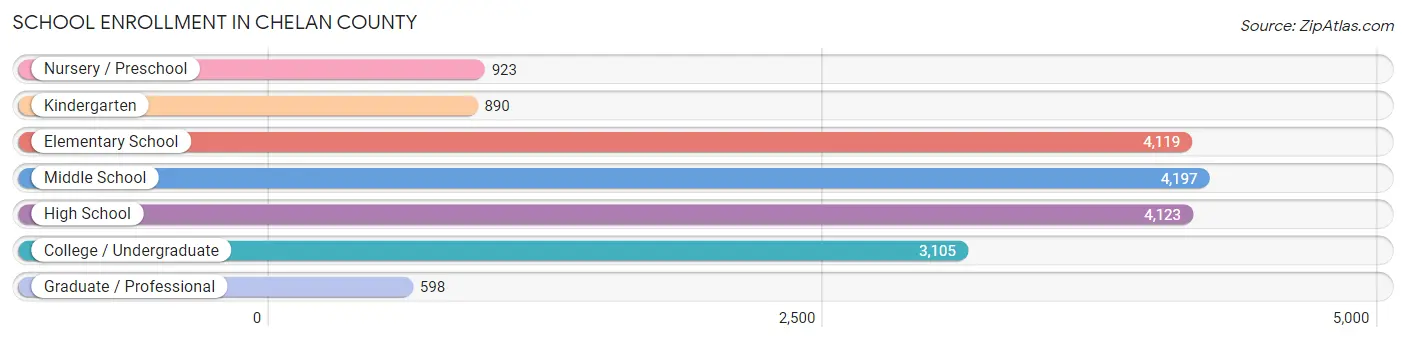
| School Level | # Students | % Students |
| Nursery / Preschool | 923 | 5.1% |
| Kindergarten | 890 | 5.0% |
| Elementary School | 4,119 | 22.9% |
| Middle School | 4,197 | 23.4% |
| High School | 4,123 | 23.0% |
| College / Undergraduate | 3,105 | 17.3% |
| Graduate / Professional | 598 | 3.3% |
| Total | 17,955 | 100.0% |
School Enrollment by Age by Funding Source in Chelan County
Out of a total of 17,955 students who are enrolled in schools in Chelan County, 2,173 (12.1%) attend a private institution, while the remaining 15,782 (87.9%) are enrolled in public schools. The age group of 3 to 4 year olds has the highest likelihood of being enrolled in private schools, with 325 (42.6% in the age bracket) enrolled. Conversely, the age group of 15 to 17 year olds has the lowest likelihood of being enrolled in a private school, with 2,810 (95.2% in the age bracket) attending a public institution.
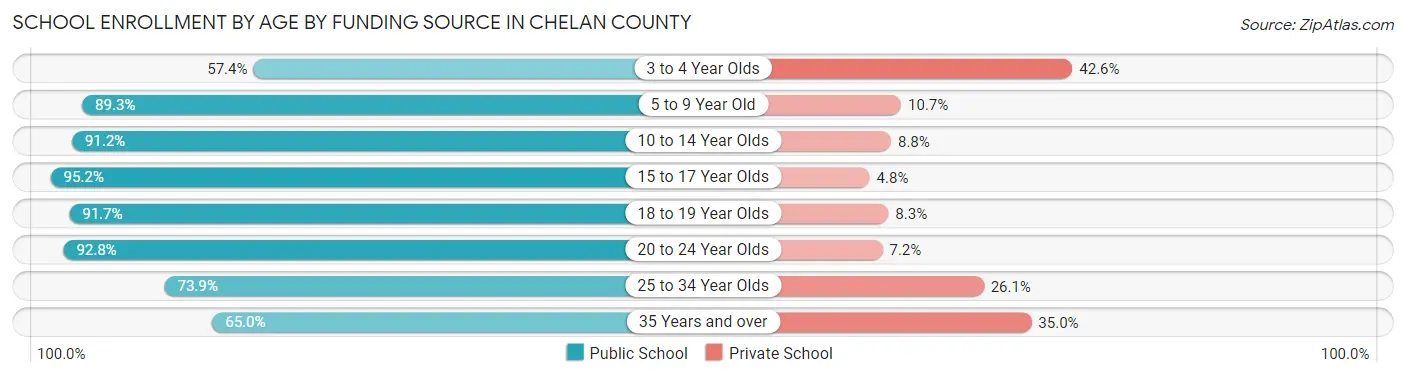
| Age Bracket | Public School | Private School |
| 3 to 4 Year Olds | 438 (57.4%) | 325 (42.6%) |
| 5 to 9 Year Old | 4,241 (89.3%) | 508 (10.7%) |
| 10 to 14 Year Olds | 4,827 (91.2%) | 467 (8.8%) |
| 15 to 17 Year Olds | 2,810 (95.2%) | 143 (4.8%) |
| 18 to 19 Year Olds | 1,023 (91.7%) | 93 (8.3%) |
| 20 to 24 Year Olds | 1,217 (92.8%) | 95 (7.2%) |
| 25 to 34 Year Olds | 584 (73.9%) | 206 (26.1%) |
| 35 Years and over | 636 (65.0%) | 342 (35.0%) |
| Total | 15,782 (87.9%) | 2,173 (12.1%) |
Educational Attainment by Field of Study in Chelan County
Business (3,127 | 17.7%), education (2,558 | 14.5%), science & technology (1,781 | 10.1%), bio, nature & agricultural (1,700 | 9.6%), and social sciences (1,470 | 8.3%) are the most common fields of study among 17,691 individuals in Chelan County who have obtained a bachelor's degree or higher.
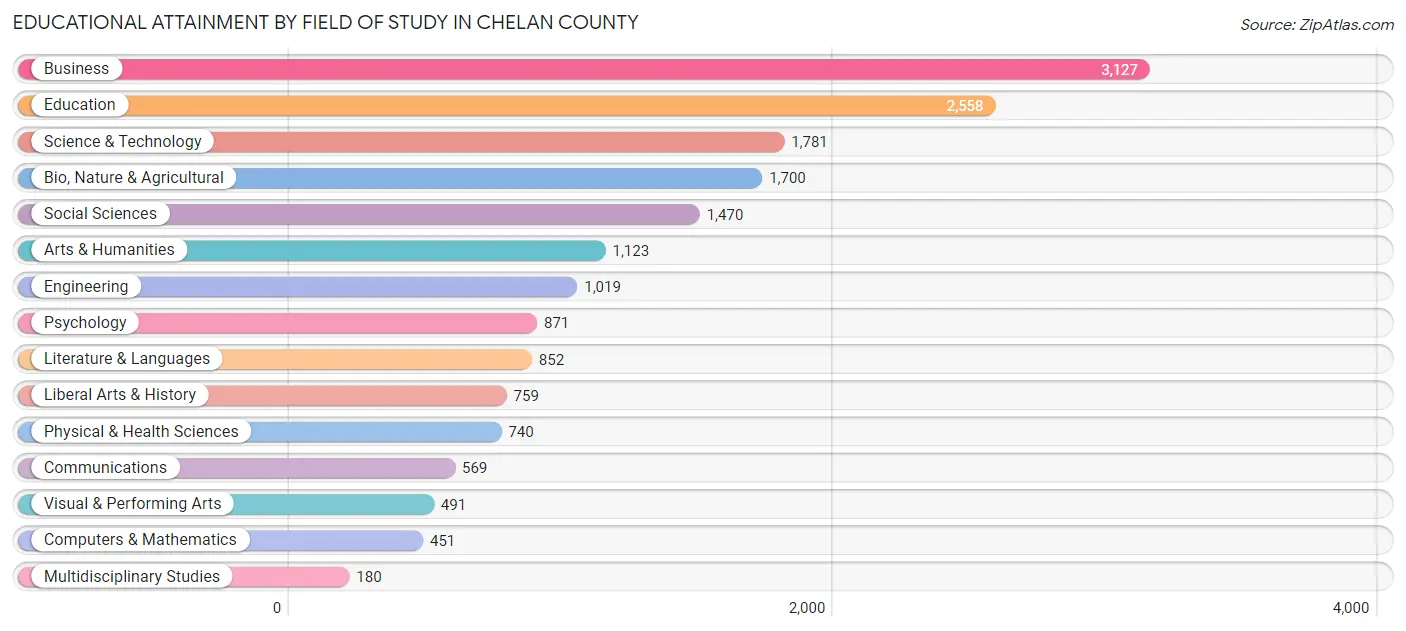
| Field of Study | # Graduates | % Graduates |
| Computers & Mathematics | 451 | 2.5% |
| Bio, Nature & Agricultural | 1,700 | 9.6% |
| Physical & Health Sciences | 740 | 4.2% |
| Psychology | 871 | 4.9% |
| Social Sciences | 1,470 | 8.3% |
| Engineering | 1,019 | 5.8% |
| Multidisciplinary Studies | 180 | 1.0% |
| Science & Technology | 1,781 | 10.1% |
| Business | 3,127 | 17.7% |
| Education | 2,558 | 14.5% |
| Literature & Languages | 852 | 4.8% |
| Liberal Arts & History | 759 | 4.3% |
| Visual & Performing Arts | 491 | 2.8% |
| Communications | 569 | 3.2% |
| Arts & Humanities | 1,123 | 6.4% |
| Total | 17,691 | 100.0% |
Transportation & Commute in Chelan County
Vehicle Availability by Sex in Chelan County
The most prevalent vehicle ownership categories in Chelan County are males with 2 vehicles (7,027, accounting for 36.1%) and females with 2 vehicles (5,787, making up 41.4%).
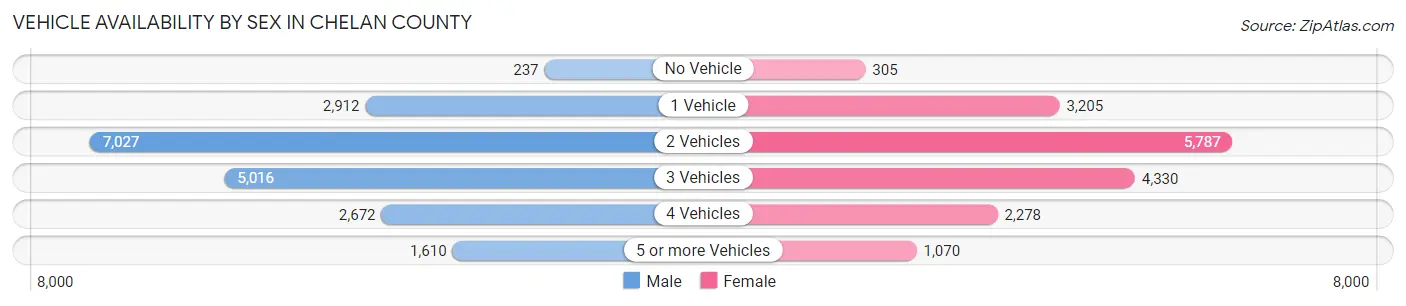
| Vehicles Available | Male | Female |
| No Vehicle | 237 (1.2%) | 305 (1.8%) |
| 1 Vehicle | 2,912 (14.9%) | 3,205 (18.9%) |
| 2 Vehicles | 7,027 (36.1%) | 5,787 (34.1%) |
| 3 Vehicles | 5,016 (25.8%) | 4,330 (25.5%) |
| 4 Vehicles | 2,672 (13.7%) | 2,278 (13.4%) |
| 5 or more Vehicles | 1,610 (8.3%) | 1,070 (6.3%) |
| Total | 19,474 (100.0%) | 16,975 (100.0%) |
Commute Time in Chelan County
The most frequently occuring commute durations in Chelan County are 15 to 19 minutes (7,020 commuters, 20.7%), 10 to 14 minutes (6,819 commuters, 20.2%), and 5 to 9 minutes (6,270 commuters, 18.5%).
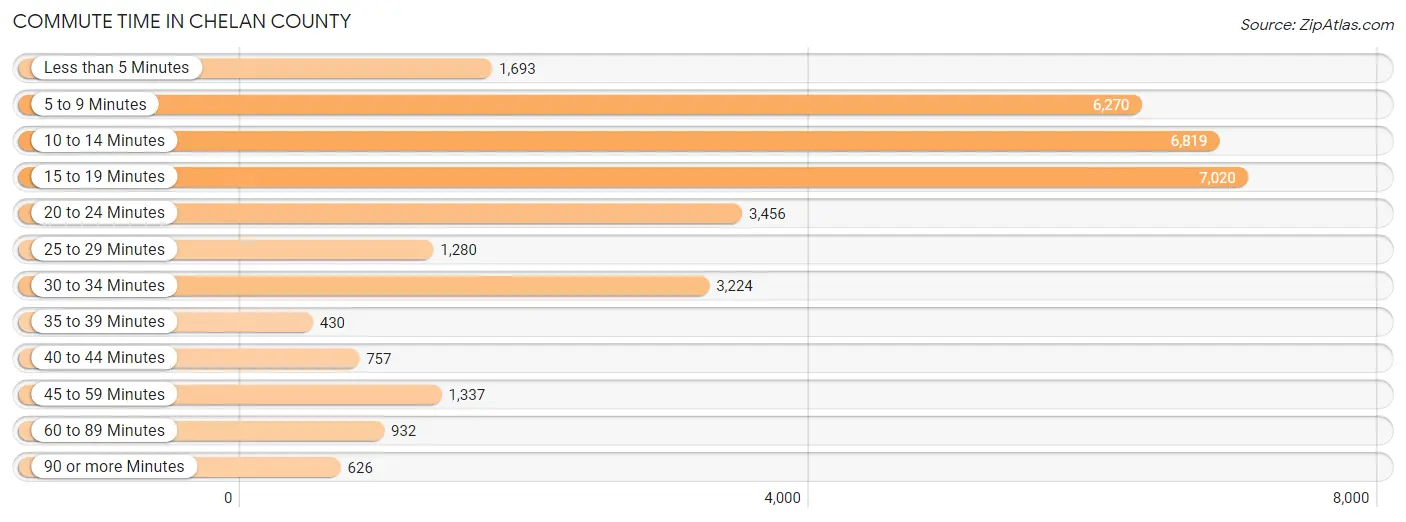
| Commute Time | # Commuters | % Commuters |
| Less than 5 Minutes | 1,693 | 5.0% |
| 5 to 9 Minutes | 6,270 | 18.5% |
| 10 to 14 Minutes | 6,819 | 20.2% |
| 15 to 19 Minutes | 7,020 | 20.7% |
| 20 to 24 Minutes | 3,456 | 10.2% |
| 25 to 29 Minutes | 1,280 | 3.8% |
| 30 to 34 Minutes | 3,224 | 9.5% |
| 35 to 39 Minutes | 430 | 1.3% |
| 40 to 44 Minutes | 757 | 2.2% |
| 45 to 59 Minutes | 1,337 | 4.0% |
| 60 to 89 Minutes | 932 | 2.8% |
| 90 or more Minutes | 626 | 1.8% |
Commute Time by Sex in Chelan County
The most common commute times in Chelan County are 10 to 14 minutes (4,066 commuters, 22.2%) for males and 5 to 9 minutes (3,439 commuters, 22.2%) for females.
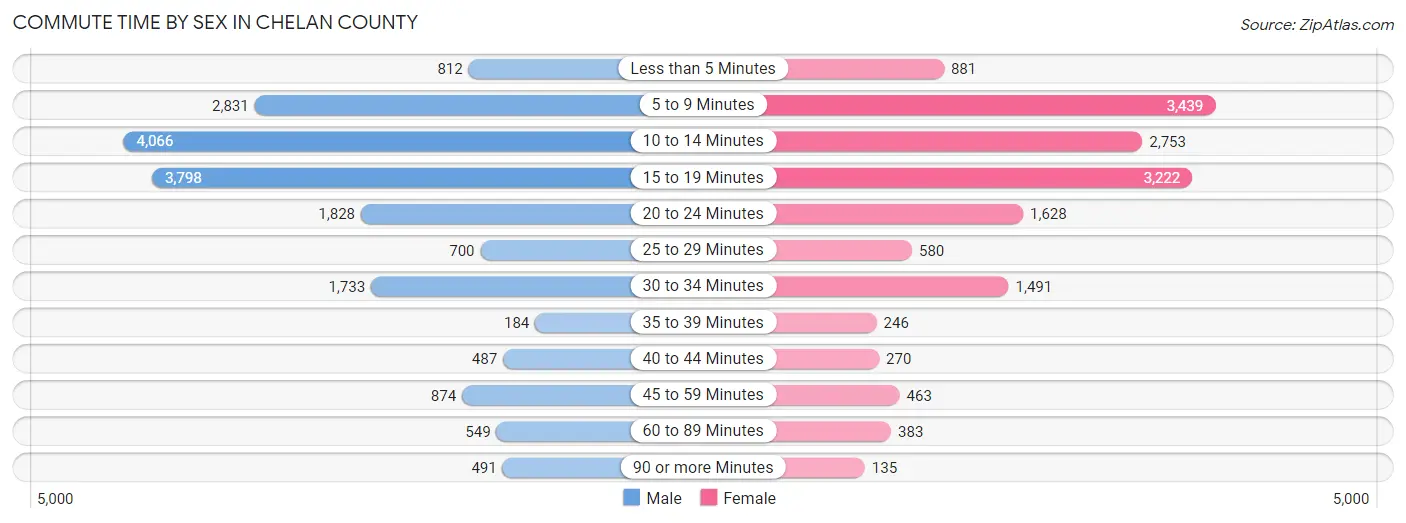
| Commute Time | Male | Female |
| Less than 5 Minutes | 812 (4.4%) | 881 (5.7%) |
| 5 to 9 Minutes | 2,831 (15.4%) | 3,439 (22.2%) |
| 10 to 14 Minutes | 4,066 (22.2%) | 2,753 (17.8%) |
| 15 to 19 Minutes | 3,798 (20.7%) | 3,222 (20.8%) |
| 20 to 24 Minutes | 1,828 (10.0%) | 1,628 (10.5%) |
| 25 to 29 Minutes | 700 (3.8%) | 580 (3.7%) |
| 30 to 34 Minutes | 1,733 (9.4%) | 1,491 (9.6%) |
| 35 to 39 Minutes | 184 (1.0%) | 246 (1.6%) |
| 40 to 44 Minutes | 487 (2.6%) | 270 (1.7%) |
| 45 to 59 Minutes | 874 (4.8%) | 463 (3.0%) |
| 60 to 89 Minutes | 549 (3.0%) | 383 (2.5%) |
| 90 or more Minutes | 491 (2.7%) | 135 (0.9%) |
Time of Departure to Work by Sex in Chelan County
The most frequent times of departure to work in Chelan County are 7:00 AM to 7:29 AM (3,043, 16.6%) for males and 7:00 AM to 7:29 AM (2,799, 18.1%) for females.
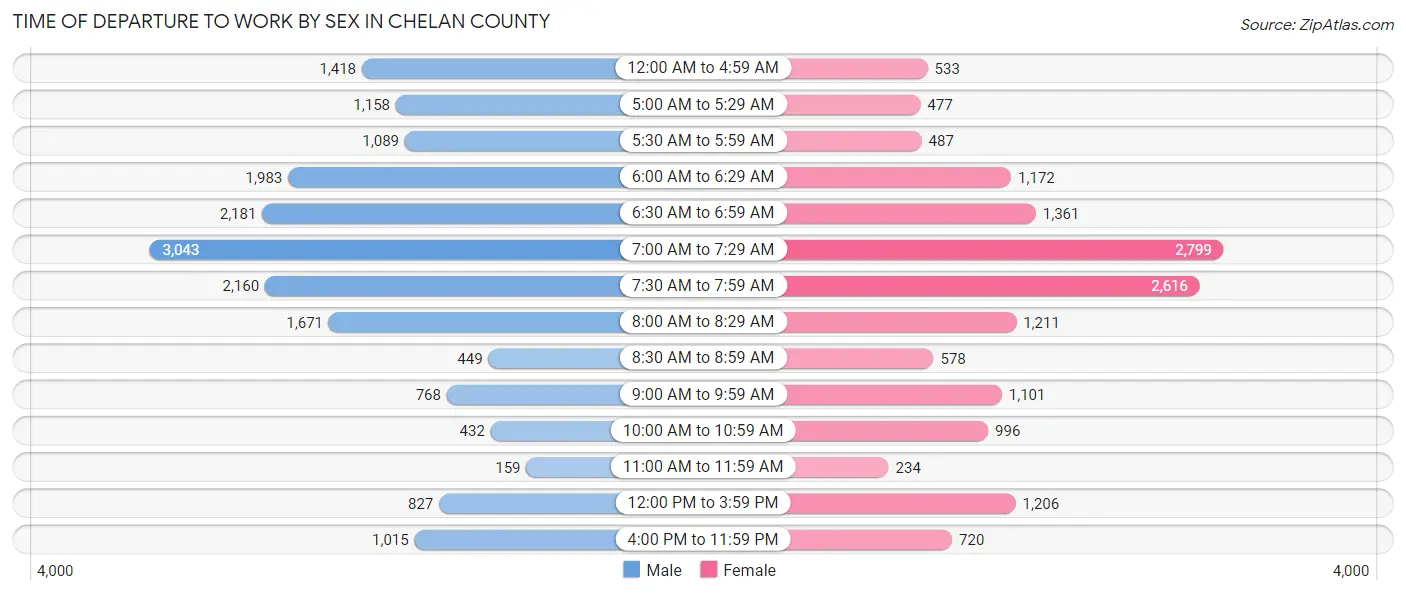
| Time of Departure | Male | Female |
| 12:00 AM to 4:59 AM | 1,418 (7.7%) | 533 (3.4%) |
| 5:00 AM to 5:29 AM | 1,158 (6.3%) | 477 (3.1%) |
| 5:30 AM to 5:59 AM | 1,089 (5.9%) | 487 (3.1%) |
| 6:00 AM to 6:29 AM | 1,983 (10.8%) | 1,172 (7.6%) |
| 6:30 AM to 6:59 AM | 2,181 (11.9%) | 1,361 (8.8%) |
| 7:00 AM to 7:29 AM | 3,043 (16.6%) | 2,799 (18.1%) |
| 7:30 AM to 7:59 AM | 2,160 (11.8%) | 2,616 (16.9%) |
| 8:00 AM to 8:29 AM | 1,671 (9.1%) | 1,211 (7.8%) |
| 8:30 AM to 8:59 AM | 449 (2.5%) | 578 (3.7%) |
| 9:00 AM to 9:59 AM | 768 (4.2%) | 1,101 (7.1%) |
| 10:00 AM to 10:59 AM | 432 (2.4%) | 996 (6.4%) |
| 11:00 AM to 11:59 AM | 159 (0.9%) | 234 (1.5%) |
| 12:00 PM to 3:59 PM | 827 (4.5%) | 1,206 (7.8%) |
| 4:00 PM to 11:59 PM | 1,015 (5.5%) | 720 (4.6%) |
| Total | 18,353 (100.0%) | 15,491 (100.0%) |
Housing Occupancy in Chelan County
Occupancy by Ownership in Chelan County
Of the total 30,414 dwellings in Chelan County, owner-occupied units account for 19,298 (63.4%), while renter-occupied units make up 11,116 (36.5%).
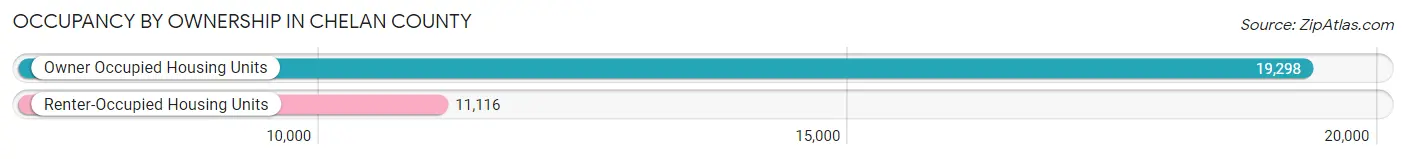
| Occupancy | # Housing Units | % Housing Units |
| Owner Occupied Housing Units | 19,298 | 63.4% |
| Renter-Occupied Housing Units | 11,116 | 36.5% |
| Total Occupied Housing Units | 30,414 | 100.0% |
Occupancy by Household Size in Chelan County
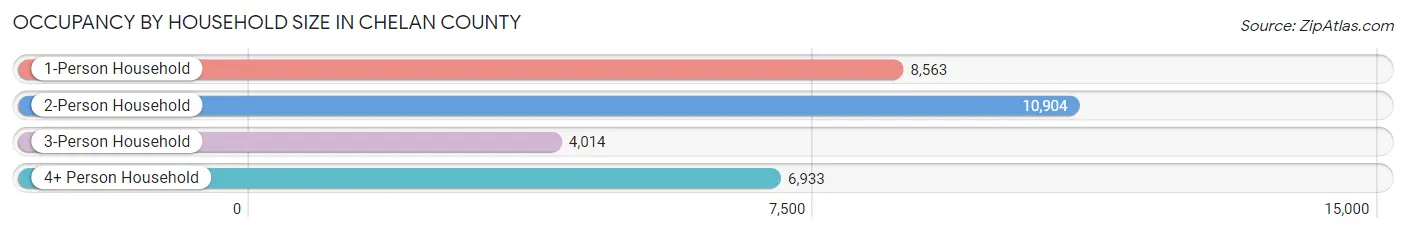
| Household Size | # Housing Units | % Housing Units |
| 1-Person Household | 8,563 | 28.1% |
| 2-Person Household | 10,904 | 35.8% |
| 3-Person Household | 4,014 | 13.2% |
| 4+ Person Household | 6,933 | 22.8% |
| Total Housing Units | 30,414 | 100.0% |
Occupancy by Ownership by Household Size in Chelan County
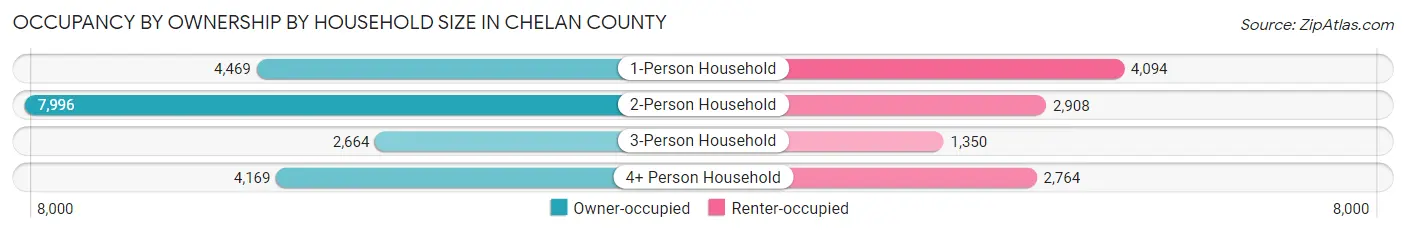
| Household Size | Owner-occupied | Renter-occupied |
| 1-Person Household | 4,469 (52.2%) | 4,094 (47.8%) |
| 2-Person Household | 7,996 (73.3%) | 2,908 (26.7%) |
| 3-Person Household | 2,664 (66.4%) | 1,350 (33.6%) |
| 4+ Person Household | 4,169 (60.1%) | 2,764 (39.9%) |
| Total Housing Units | 19,298 (63.4%) | 11,116 (36.5%) |
Occupancy by Educational Attainment in Chelan County
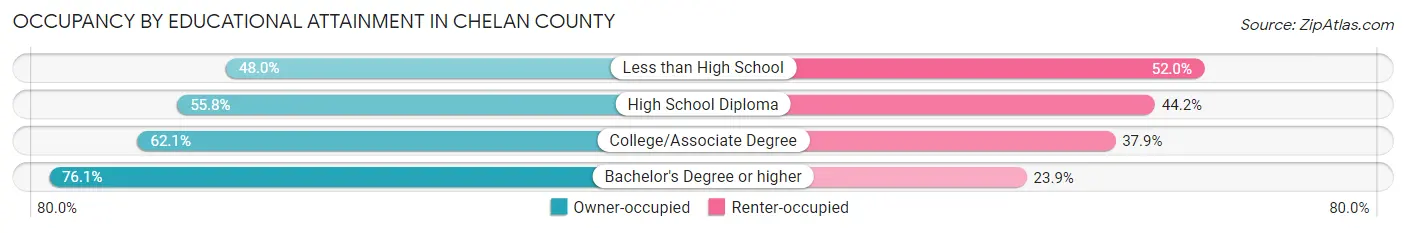
| Household Size | Owner-occupied | Renter-occupied |
| Less than High School | 1,826 (48.0%) | 1,975 (52.0%) |
| High School Diploma | 3,738 (55.8%) | 2,962 (44.2%) |
| College/Associate Degree | 6,297 (62.1%) | 3,847 (37.9%) |
| Bachelor's Degree or higher | 7,437 (76.1%) | 2,332 (23.9%) |
Occupancy by Age of Householder in Chelan County
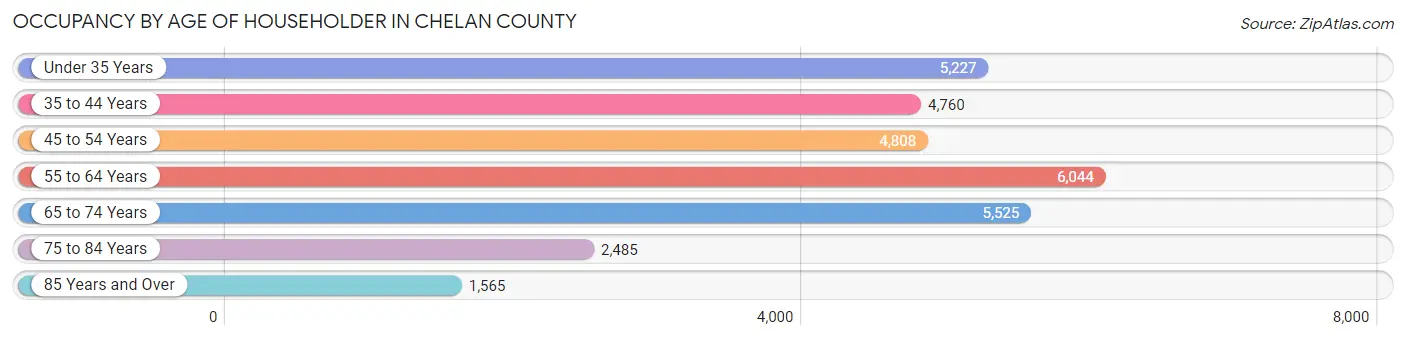
| Age Bracket | # Households | % Households |
| Under 35 Years | 5,227 | 17.2% |
| 35 to 44 Years | 4,760 | 15.7% |
| 45 to 54 Years | 4,808 | 15.8% |
| 55 to 64 Years | 6,044 | 19.9% |
| 65 to 74 Years | 5,525 | 18.2% |
| 75 to 84 Years | 2,485 | 8.2% |
| 85 Years and Over | 1,565 | 5.1% |
| Total | 30,414 | 100.0% |
Housing Finances in Chelan County
Median Income by Occupancy in Chelan County
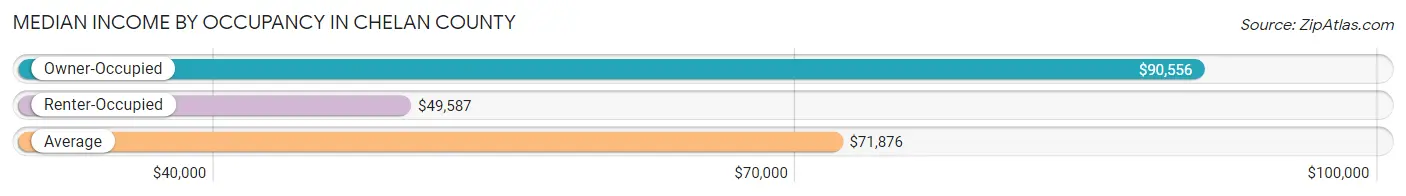
| Occupancy Type | # Households | Median Income |
| Owner-Occupied | 19,298 (63.4%) | $90,556 |
| Renter-Occupied | 11,116 (36.5%) | $49,587 |
| Average | 30,414 (100.0%) | $71,876 |
Occupancy by Householder Income Bracket in Chelan County
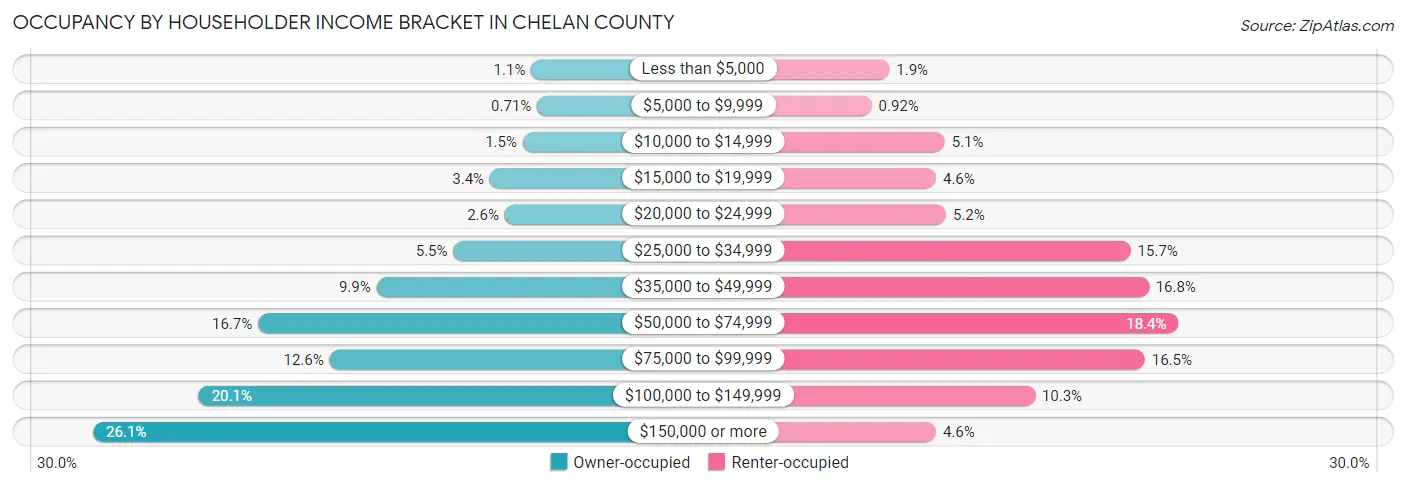
| Income Bracket | Owner-occupied | Renter-occupied |
| Less than $5,000 | 202 (1.1%) | 214 (1.9%) |
| $5,000 to $9,999 | 137 (0.7%) | 102 (0.9%) |
| $10,000 to $14,999 | 296 (1.5%) | 567 (5.1%) |
| $15,000 to $19,999 | 658 (3.4%) | 511 (4.6%) |
| $20,000 to $24,999 | 494 (2.6%) | 575 (5.2%) |
| $25,000 to $34,999 | 1,061 (5.5%) | 1,747 (15.7%) |
| $35,000 to $49,999 | 1,908 (9.9%) | 1,862 (16.8%) |
| $50,000 to $74,999 | 3,215 (16.7%) | 2,050 (18.4%) |
| $75,000 to $99,999 | 2,425 (12.6%) | 1,838 (16.5%) |
| $100,000 to $149,999 | 3,870 (20.1%) | 1,139 (10.2%) |
| $150,000 or more | 5,032 (26.1%) | 511 (4.6%) |
| Total | 19,298 (100.0%) | 11,116 (100.0%) |
Monthly Housing Cost Tiers in Chelan County
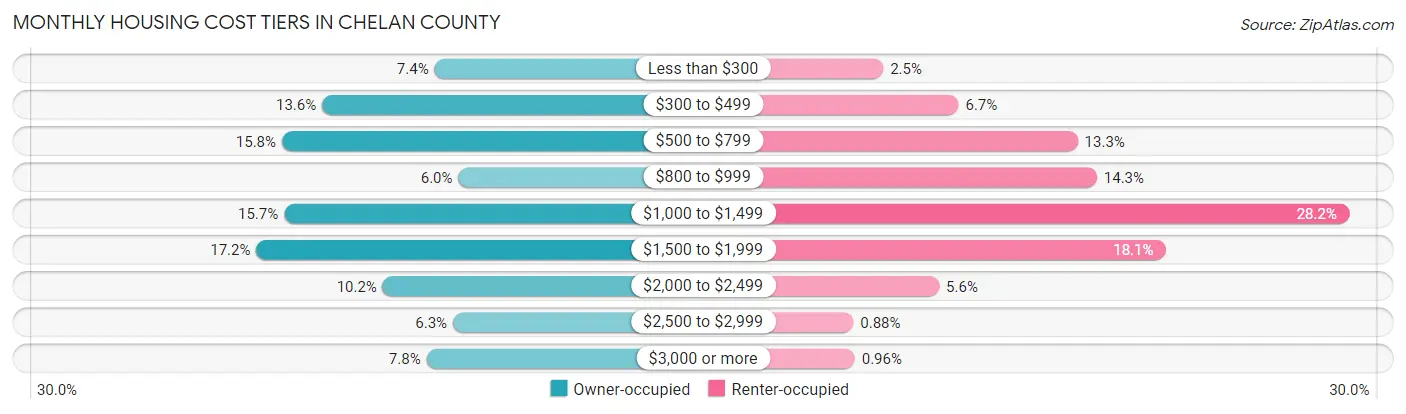
| Monthly Cost | Owner-occupied | Renter-occupied |
| Less than $300 | 1,420 (7.4%) | 281 (2.5%) |
| $300 to $499 | 2,619 (13.6%) | 744 (6.7%) |
| $500 to $799 | 3,048 (15.8%) | 1,475 (13.3%) |
| $800 to $999 | 1,166 (6.0%) | 1,593 (14.3%) |
| $1,000 to $1,499 | 3,024 (15.7%) | 3,139 (28.2%) |
| $1,500 to $1,999 | 3,320 (17.2%) | 2,013 (18.1%) |
| $2,000 to $2,499 | 1,972 (10.2%) | 625 (5.6%) |
| $2,500 to $2,999 | 1,223 (6.3%) | 98 (0.9%) |
| $3,000 or more | 1,506 (7.8%) | 107 (1.0%) |
| Total | 19,298 (100.0%) | 11,116 (100.0%) |
Physical Housing Characteristics in Chelan County
Housing Structures in Chelan County
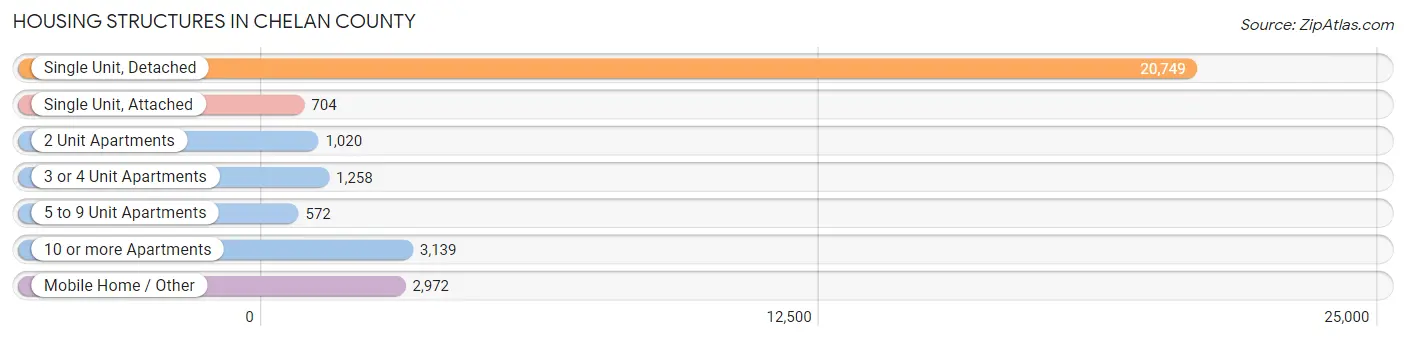
| Structure Type | # Housing Units | % Housing Units |
| Single Unit, Detached | 20,749 | 68.2% |
| Single Unit, Attached | 704 | 2.3% |
| 2 Unit Apartments | 1,020 | 3.4% |
| 3 or 4 Unit Apartments | 1,258 | 4.1% |
| 5 to 9 Unit Apartments | 572 | 1.9% |
| 10 or more Apartments | 3,139 | 10.3% |
| Mobile Home / Other | 2,972 | 9.8% |
| Total | 30,414 | 100.0% |
Housing Structures by Occupancy in Chelan County
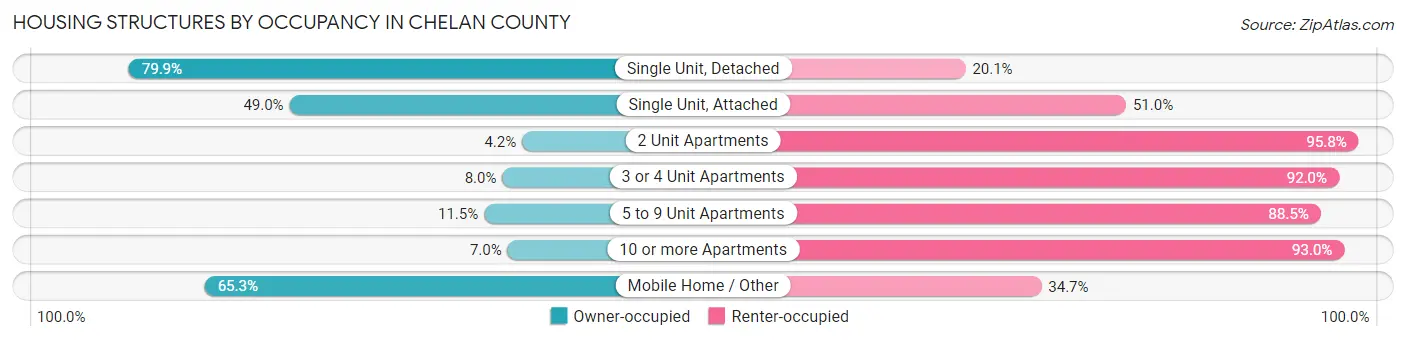
| Structure Type | Owner-occupied | Renter-occupied |
| Single Unit, Detached | 16,582 (79.9%) | 4,167 (20.1%) |
| Single Unit, Attached | 345 (49.0%) | 359 (51.0%) |
| 2 Unit Apartments | 43 (4.2%) | 977 (95.8%) |
| 3 or 4 Unit Apartments | 101 (8.0%) | 1,157 (92.0%) |
| 5 to 9 Unit Apartments | 66 (11.5%) | 506 (88.5%) |
| 10 or more Apartments | 220 (7.0%) | 2,919 (93.0%) |
| Mobile Home / Other | 1,941 (65.3%) | 1,031 (34.7%) |
| Total | 19,298 (63.4%) | 11,116 (36.5%) |
Housing Structures by Number of Rooms in Chelan County
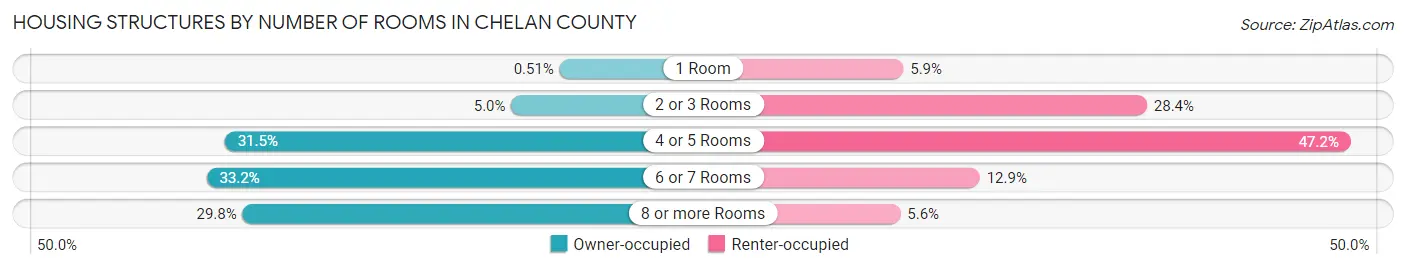
| Number of Rooms | Owner-occupied | Renter-occupied |
| 1 Room | 98 (0.5%) | 651 (5.9%) |
| 2 or 3 Rooms | 962 (5.0%) | 3,156 (28.4%) |
| 4 or 5 Rooms | 6,076 (31.5%) | 5,251 (47.2%) |
| 6 or 7 Rooms | 6,403 (33.2%) | 1,437 (12.9%) |
| 8 or more Rooms | 5,759 (29.8%) | 621 (5.6%) |
| Total | 19,298 (100.0%) | 11,116 (100.0%) |
Housing Structure by Heating Type in Chelan County
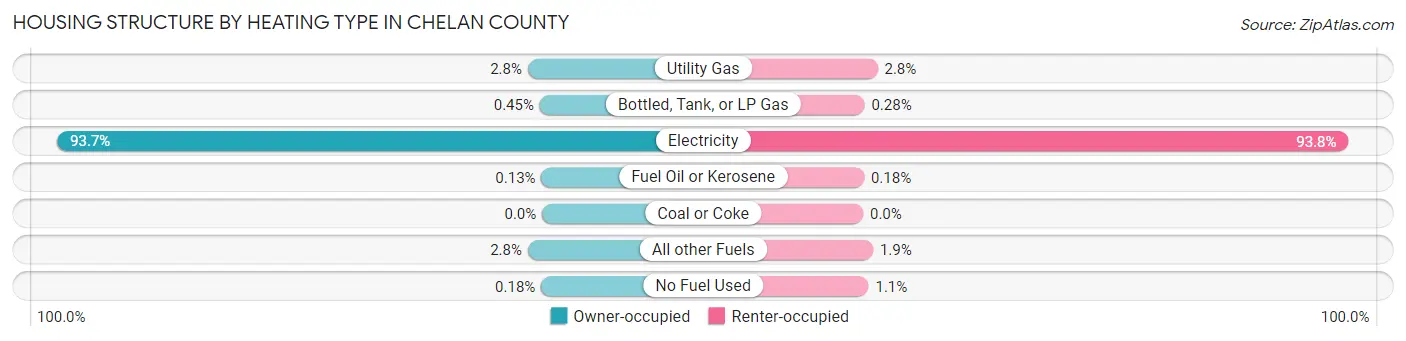
| Heating Type | Owner-occupied | Renter-occupied |
| Utility Gas | 532 (2.8%) | 311 (2.8%) |
| Bottled, Tank, or LP Gas | 86 (0.4%) | 31 (0.3%) |
| Electricity | 18,089 (93.7%) | 10,424 (93.8%) |
| Fuel Oil or Kerosene | 25 (0.1%) | 20 (0.2%) |
| Coal or Coke | 0 (0.0%) | 0 (0.0%) |
| All other Fuels | 532 (2.8%) | 212 (1.9%) |
| No Fuel Used | 34 (0.2%) | 118 (1.1%) |
| Total | 19,298 (100.0%) | 11,116 (100.0%) |
Household Vehicle Usage in Chelan County
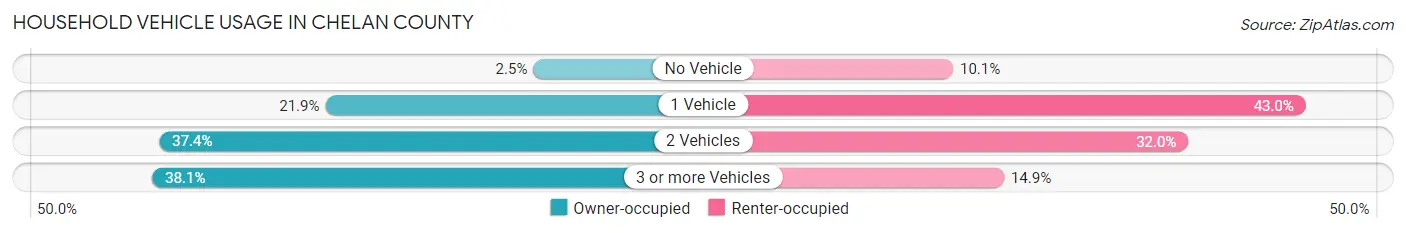
| Vehicles per Household | Owner-occupied | Renter-occupied |
| No Vehicle | 487 (2.5%) | 1,122 (10.1%) |
| 1 Vehicle | 4,232 (21.9%) | 4,781 (43.0%) |
| 2 Vehicles | 7,226 (37.4%) | 3,562 (32.0%) |
| 3 or more Vehicles | 7,353 (38.1%) | 1,651 (14.8%) |
| Total | 19,298 (100.0%) | 11,116 (100.0%) |
Real Estate & Mortgages in Chelan County
Real Estate and Mortgage Overview in Chelan County
| Characteristic | Without Mortgage | With Mortgage |
| Housing Units | 7,892 | 11,406 |
| Median Property Value | $379,600 | $430,900 |
| Median Household Income | $67,303 | $3,493 |
| Monthly Housing Costs | $498 | $1,476 |
| Real Estate Taxes | $3,020 | $170 |
Property Value by Mortgage Status in Chelan County
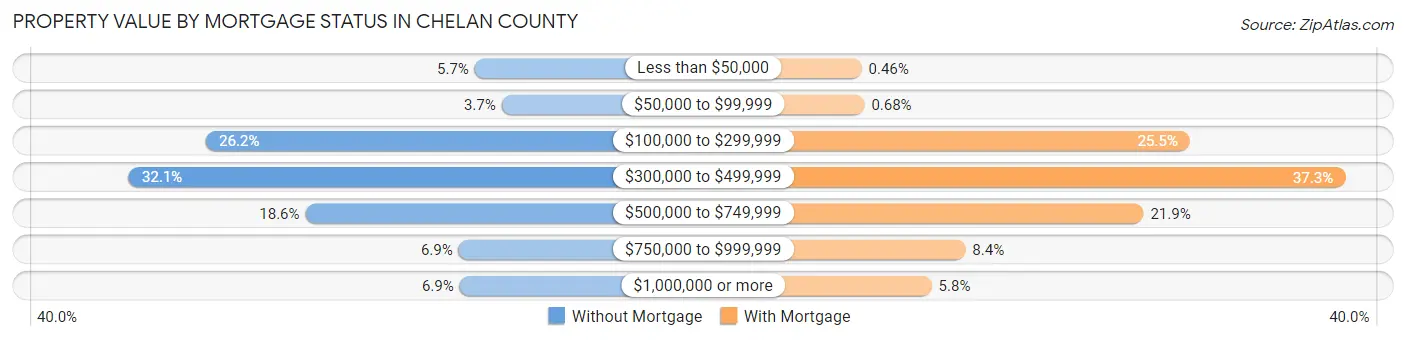
| Property Value | Without Mortgage | With Mortgage |
| Less than $50,000 | 451 (5.7%) | 52 (0.5%) |
| $50,000 to $99,999 | 289 (3.7%) | 77 (0.7%) |
| $100,000 to $299,999 | 2,065 (26.2%) | 2,904 (25.5%) |
| $300,000 to $499,999 | 2,529 (32.1%) | 4,254 (37.3%) |
| $500,000 to $749,999 | 1,469 (18.6%) | 2,503 (21.9%) |
| $750,000 to $999,999 | 548 (6.9%) | 955 (8.4%) |
| $1,000,000 or more | 541 (6.9%) | 661 (5.8%) |
| Total | 7,892 (100.0%) | 11,406 (100.0%) |
Household Income by Mortgage Status in Chelan County
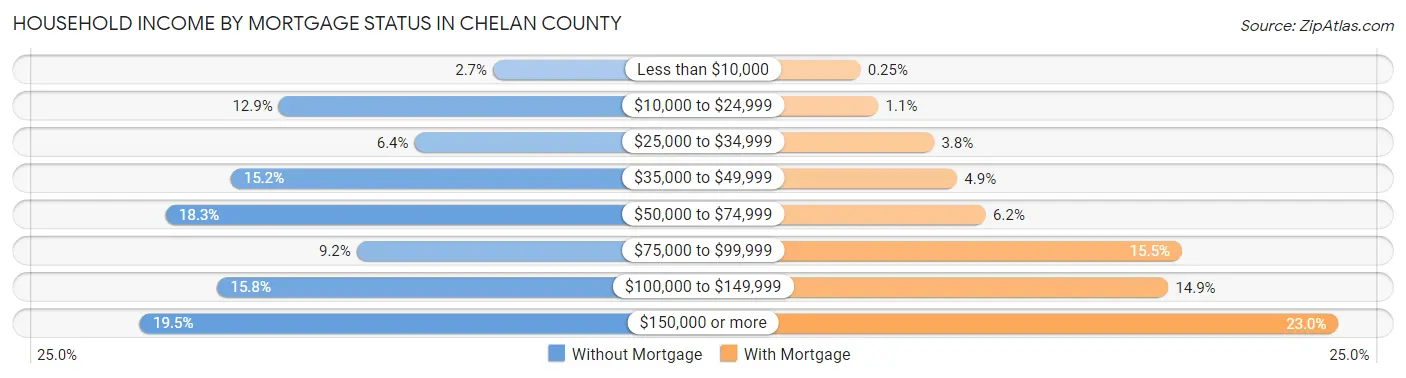
| Household Income | Without Mortgage | With Mortgage |
| Less than $10,000 | 213 (2.7%) | 29 (0.3%) |
| $10,000 to $24,999 | 1,019 (12.9%) | 126 (1.1%) |
| $25,000 to $34,999 | 508 (6.4%) | 429 (3.8%) |
| $35,000 to $49,999 | 1,198 (15.2%) | 553 (4.9%) |
| $50,000 to $74,999 | 1,442 (18.3%) | 710 (6.2%) |
| $75,000 to $99,999 | 725 (9.2%) | 1,773 (15.5%) |
| $100,000 to $149,999 | 1,248 (15.8%) | 1,700 (14.9%) |
| $150,000 or more | 1,539 (19.5%) | 2,622 (23.0%) |
| Total | 7,892 (100.0%) | 11,406 (100.0%) |
Property Value to Household Income Ratio in Chelan County
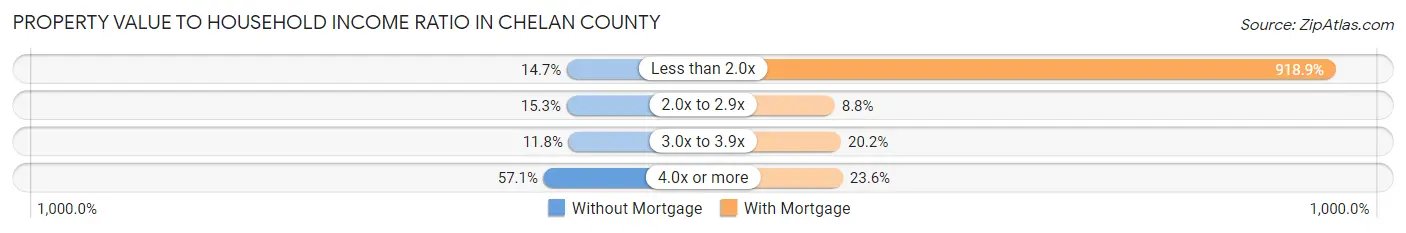
| Value-to-Income Ratio | Without Mortgage | With Mortgage |
| Less than 2.0x | 1,161 (14.7%) | 104,807 (918.9%) |
| 2.0x to 2.9x | 1,207 (15.3%) | 1,005 (8.8%) |
| 3.0x to 3.9x | 928 (11.8%) | 2,307 (20.2%) |
| 4.0x or more | 4,509 (57.1%) | 2,692 (23.6%) |
| Total | 7,892 (100.0%) | 11,406 (100.0%) |
Real Estate Taxes by Mortgage Status in Chelan County
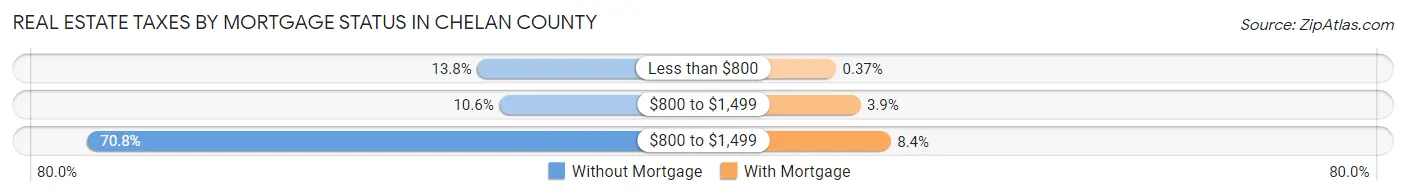
| Property Taxes | Without Mortgage | With Mortgage |
| Less than $800 | 1,090 (13.8%) | 42 (0.4%) |
| $800 to $1,499 | 837 (10.6%) | 448 (3.9%) |
| $800 to $1,499 | 5,589 (70.8%) | 954 (8.4%) |
| Total | 7,892 (100.0%) | 11,406 (100.0%) |
Health & Disability in Chelan County
Health Insurance Coverage by Age in Chelan County
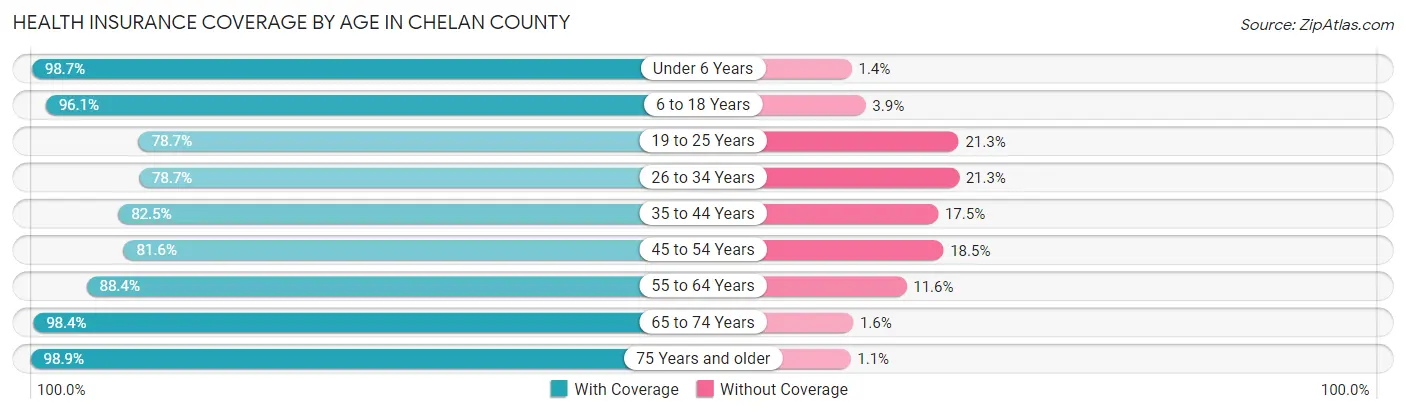
| Age Bracket | With Coverage | Without Coverage |
| Under 6 Years | 5,464 (98.7%) | 75 (1.3%) |
| 6 to 18 Years | 12,855 (96.1%) | 527 (3.9%) |
| 19 to 25 Years | 4,965 (78.7%) | 1,343 (21.3%) |
| 26 to 34 Years | 6,994 (78.7%) | 1,896 (21.3%) |
| 35 to 44 Years | 7,923 (82.5%) | 1,677 (17.5%) |
| 45 to 54 Years | 7,030 (81.6%) | 1,590 (18.4%) |
| 55 to 64 Years | 9,401 (88.4%) | 1,229 (11.6%) |
| 65 to 74 Years | 9,133 (98.4%) | 149 (1.6%) |
| 75 Years and older | 6,043 (98.9%) | 69 (1.1%) |
| Total | 69,808 (89.1%) | 8,555 (10.9%) |
Health Insurance Coverage by Citizenship Status in Chelan County
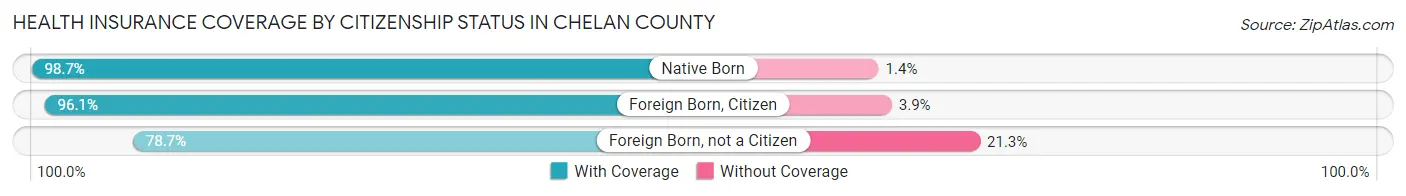
| Citizenship Status | With Coverage | Without Coverage |
| Native Born | 5,464 (98.7%) | 75 (1.3%) |
| Foreign Born, Citizen | 12,855 (96.1%) | 527 (3.9%) |
| Foreign Born, not a Citizen | 4,965 (78.7%) | 1,343 (21.3%) |
Health Insurance Coverage by Household Income in Chelan County
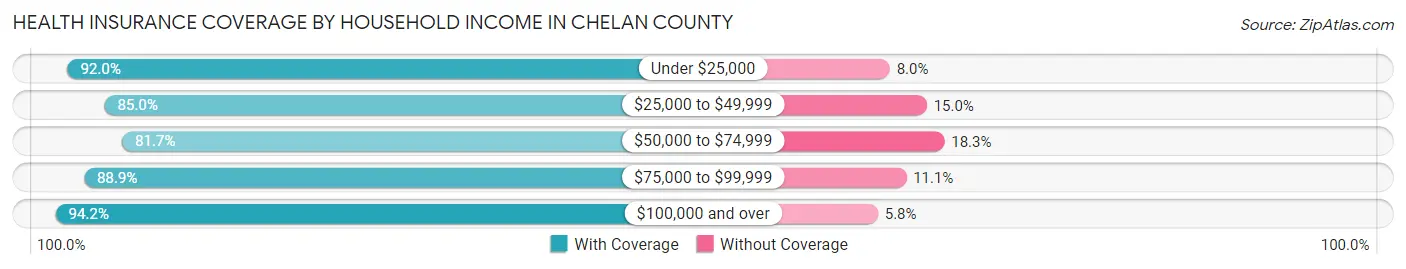
| Household Income | With Coverage | Without Coverage |
| Under $25,000 | 5,331 (92.0%) | 466 (8.0%) |
| $25,000 to $49,999 | 11,453 (85.0%) | 2,017 (15.0%) |
| $50,000 to $74,999 | 11,793 (81.7%) | 2,634 (18.3%) |
| $75,000 to $99,999 | 9,650 (88.9%) | 1,209 (11.1%) |
| $100,000 and over | 30,844 (94.2%) | 1,904 (5.8%) |
Public vs Private Health Insurance Coverage by Age in Chelan County
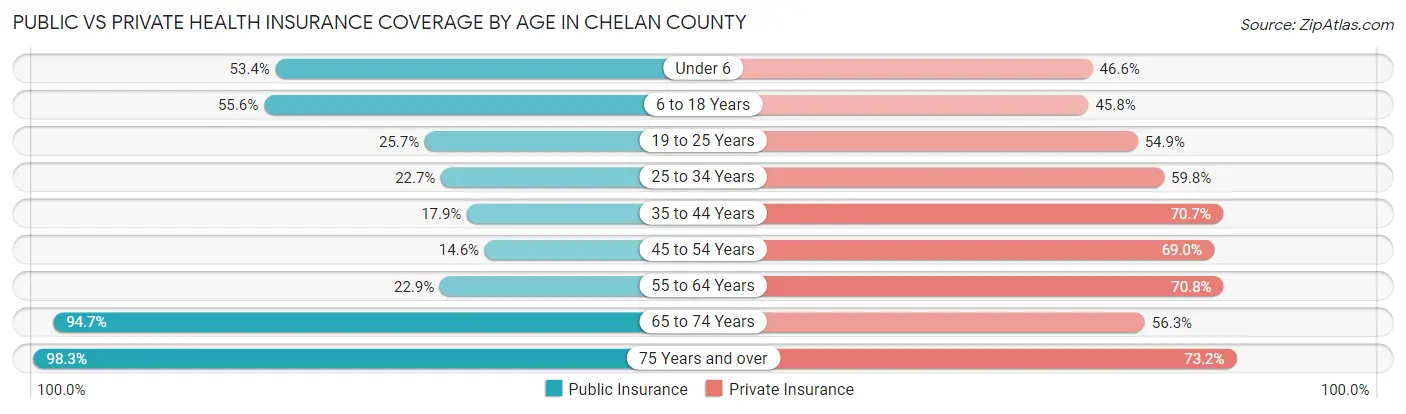
| Age Bracket | Public Insurance | Private Insurance |
| Under 6 | 2,958 (53.4%) | 2,579 (46.6%) |
| 6 to 18 Years | 7,436 (55.6%) | 6,127 (45.8%) |
| 19 to 25 Years | 1,619 (25.7%) | 3,465 (54.9%) |
| 25 to 34 Years | 2,015 (22.7%) | 5,317 (59.8%) |
| 35 to 44 Years | 1,714 (17.8%) | 6,786 (70.7%) |
| 45 to 54 Years | 1,255 (14.6%) | 5,950 (69.0%) |
| 55 to 64 Years | 2,432 (22.9%) | 7,529 (70.8%) |
| 65 to 74 Years | 8,788 (94.7%) | 5,222 (56.3%) |
| 75 Years and over | 6,010 (98.3%) | 4,476 (73.2%) |
| Total | 34,227 (43.7%) | 47,451 (60.6%) |
Disability Status by Sex by Age in Chelan County
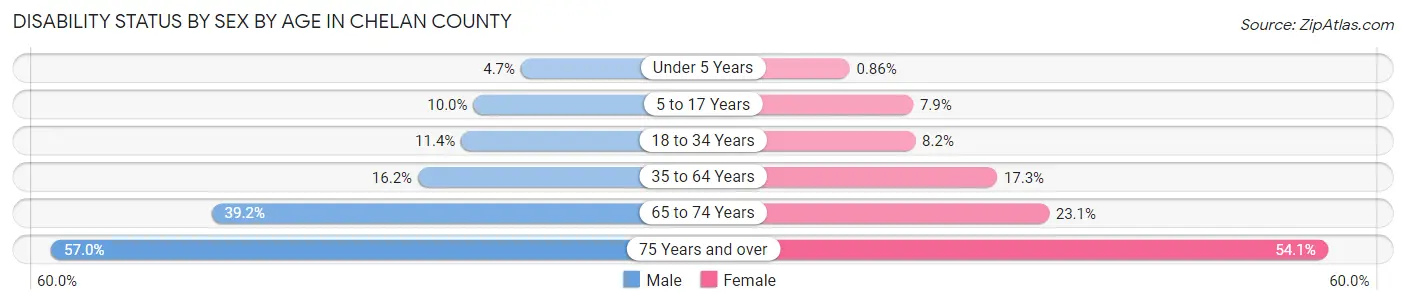
| Age Bracket | Male | Female |
| Under 5 Years | 109 (4.7%) | 19 (0.9%) |
| 5 to 17 Years | 716 (10.0%) | 512 (7.9%) |
| 18 to 34 Years | 937 (11.4%) | 635 (8.2%) |
| 35 to 64 Years | 2,339 (16.2%) | 2,490 (17.3%) |
| 65 to 74 Years | 1,824 (39.2%) | 1,066 (23.1%) |
| 75 Years and over | 1,548 (57.0%) | 1,838 (54.1%) |
Disability Class by Sex by Age in Chelan County
Disability Class: Hearing Difficulty
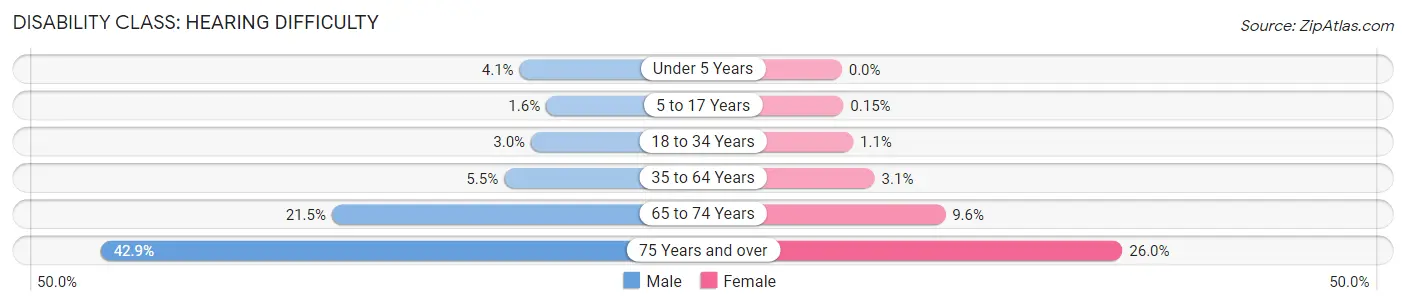
| Age Bracket | Male | Female |
| Under 5 Years | 94 (4.1%) | 0 (0.0%) |
| 5 to 17 Years | 115 (1.6%) | 10 (0.2%) |
| 18 to 34 Years | 248 (3.0%) | 82 (1.1%) |
| 35 to 64 Years | 796 (5.5%) | 440 (3.0%) |
| 65 to 74 Years | 1,001 (21.5%) | 444 (9.6%) |
| 75 Years and over | 1,165 (42.9%) | 885 (26.0%) |
Disability Class: Vision Difficulty
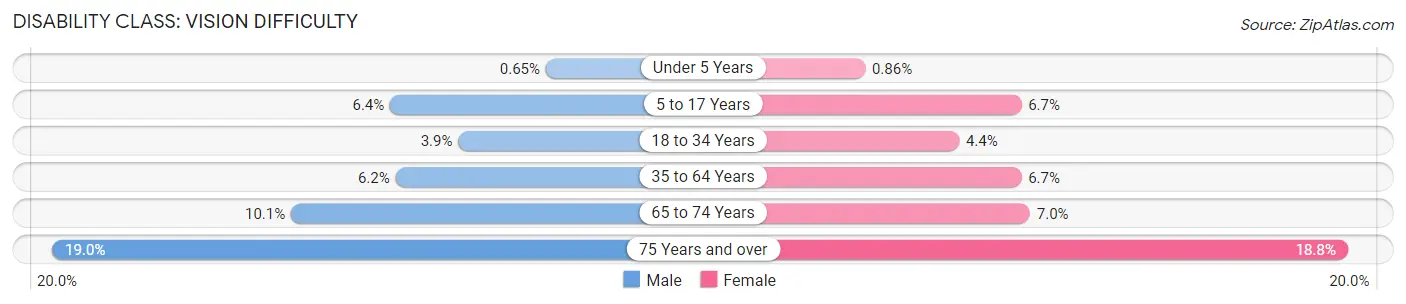
| Age Bracket | Male | Female |
| Under 5 Years | 15 (0.6%) | 19 (0.9%) |
| 5 to 17 Years | 459 (6.4%) | 430 (6.7%) |
| 18 to 34 Years | 321 (3.9%) | 338 (4.3%) |
| 35 to 64 Years | 900 (6.2%) | 960 (6.7%) |
| 65 to 74 Years | 471 (10.1%) | 323 (7.0%) |
| 75 Years and over | 515 (19.0%) | 638 (18.8%) |
Disability Class: Cognitive Difficulty
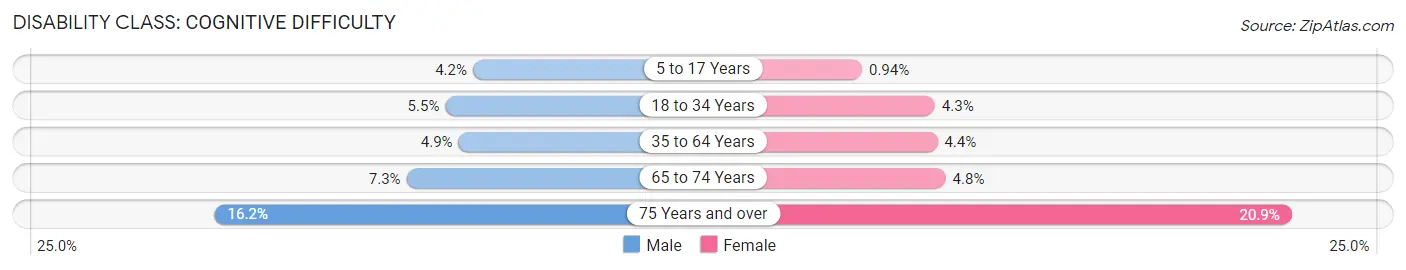
| Age Bracket | Male | Female |
| 5 to 17 Years | 300 (4.2%) | 61 (0.9%) |
| 18 to 34 Years | 451 (5.5%) | 336 (4.3%) |
| 35 to 64 Years | 704 (4.9%) | 640 (4.4%) |
| 65 to 74 Years | 339 (7.3%) | 223 (4.8%) |
| 75 Years and over | 439 (16.2%) | 709 (20.9%) |
Disability Class: Ambulatory Difficulty
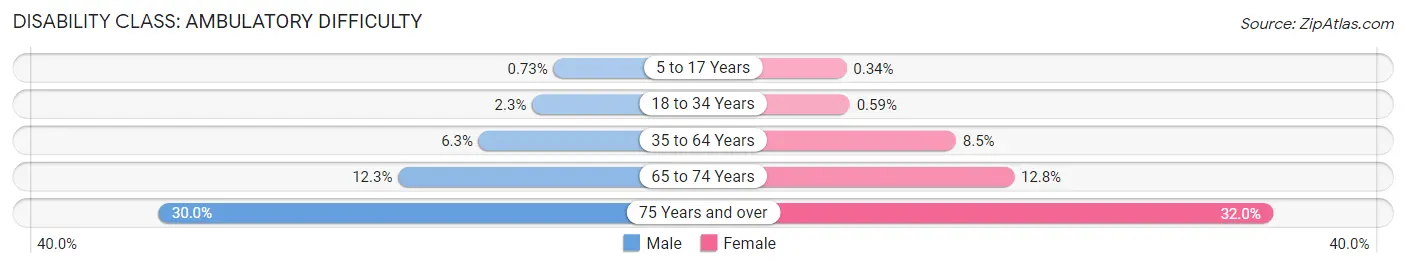
| Age Bracket | Male | Female |
| 5 to 17 Years | 52 (0.7%) | 22 (0.3%) |
| 18 to 34 Years | 190 (2.3%) | 46 (0.6%) |
| 35 to 64 Years | 907 (6.3%) | 1,221 (8.5%) |
| 65 to 74 Years | 571 (12.3%) | 591 (12.8%) |
| 75 Years and over | 815 (30.0%) | 1,087 (32.0%) |
Disability Class: Self-Care Difficulty
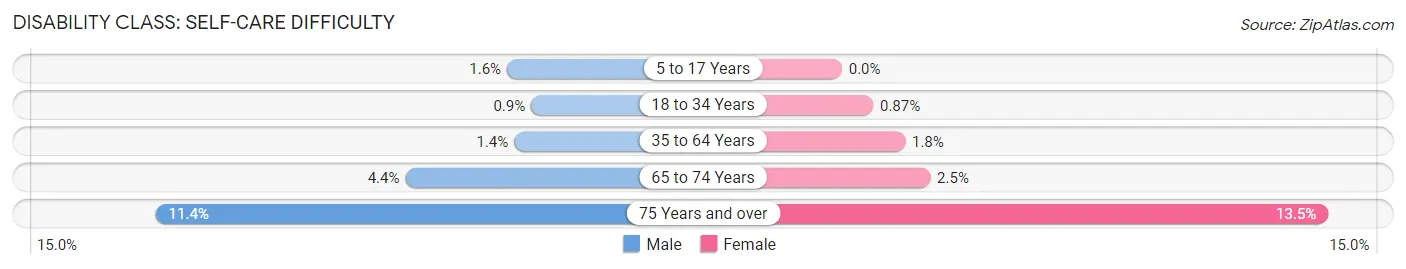
| Age Bracket | Male | Female |
| 5 to 17 Years | 112 (1.6%) | 0 (0.0%) |
| 18 to 34 Years | 74 (0.9%) | 68 (0.9%) |
| 35 to 64 Years | 198 (1.4%) | 254 (1.8%) |
| 65 to 74 Years | 205 (4.4%) | 114 (2.5%) |
| 75 Years and over | 308 (11.4%) | 460 (13.5%) |
Technology Access in Chelan County
Computing Device Access in Chelan County
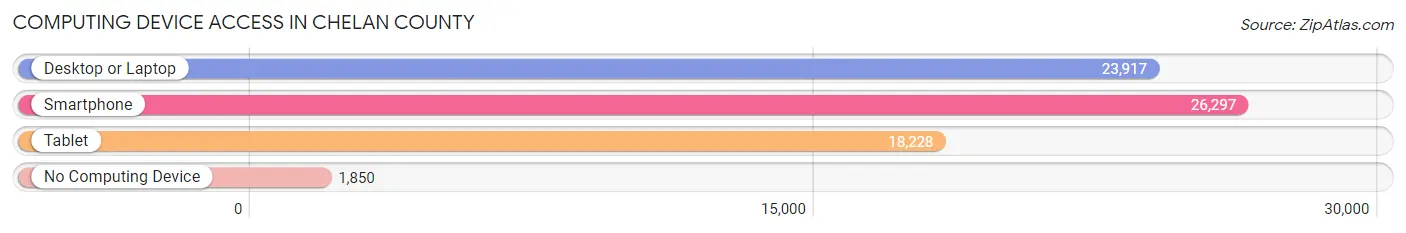
| Device Type | # Households | % Households |
| Desktop or Laptop | 23,917 | 78.6% |
| Smartphone | 26,297 | 86.5% |
| Tablet | 18,228 | 59.9% |
| No Computing Device | 1,850 | 6.1% |
| Total | 30,414 | 100.0% |
Internet Access in Chelan County
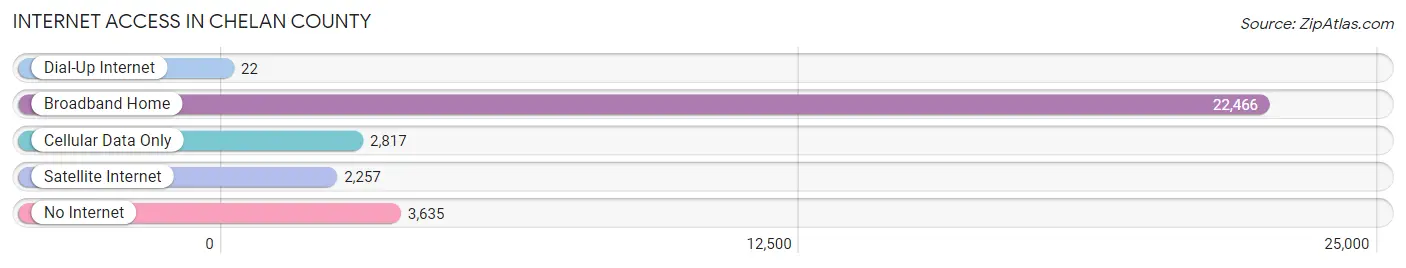
| Internet Type | # Households | % Households |
| Dial-Up Internet | 22 | 0.1% |
| Broadband Home | 22,466 | 73.9% |
| Cellular Data Only | 2,817 | 9.3% |
| Satellite Internet | 2,257 | 7.4% |
| No Internet | 3,635 | 11.9% |
| Total | 30,414 | 100.0% |
Chelan County Summary
Chelan County is located in the north-central region of Washington State, and is bordered by Okanogan County to the north, Douglas County to the east, Kittitas County to the south, and Grant County to the west. The county seat is Wenatchee, and the county is named after Chelan Falls, which was named after a Native American word meaning “deep water.”
History
The area that is now Chelan County was originally inhabited by the Wenatchi people, who were part of the Salish-speaking tribes of the Pacific Northwest. The first non-native settlers arrived in the area in the late 1800s, and the county was officially established in 1899.
The county’s economy was initially based on agriculture, with apples being the primary crop. In the early 1900s, the area began to develop as a tourist destination, with the opening of the Great Northern Railway in 1909. This allowed for easier access to the area, and the development of resorts and other attractions.
In the 1950s, the area began to develop as an industrial center, with the construction of the Grand Coulee Dam and the Columbia River Irrigation Project. This brought jobs and economic growth to the area, and the population began to grow rapidly.
Geography
Chelan County covers an area of 2,994 square miles, and is located in the Cascade Mountains. The county is home to several mountain ranges, including the Wenatchee Mountains, the Entiat Mountains, and the Chelan Mountains. The highest point in the county is Mount Stuart, which has an elevation of 9,415 feet.
The county is home to several rivers, including the Wenatchee River, the Entiat River, and the Chelan River. The county also contains several lakes, including Lake Chelan, Lake Wenatchee, and Lake Entiat.
Economy
The economy of Chelan County is largely based on agriculture, tourism, and manufacturing. The county is home to several large agricultural operations, including apple orchards, vineyards, and cattle ranches. The county is also home to several wineries, and is a popular tourist destination.
The county is home to several manufacturing companies, including Boeing, Microsoft, and Amazon. The county is also home to several technology companies, including Apple, Google, and Microsoft.
Demographics
As of the 2010 census, the population of Chelan County was 72,453. The population is largely white (90.2%), with small percentages of Hispanic (4.2%), Asian (2.2%), and African American (1.2%) residents. The median household income is $50,945, and the median age is 40.
Conclusion
Chelan County is a diverse and vibrant county located in the north-central region of Washington State. The county is home to several mountain ranges, rivers, and lakes, and is a popular tourist destination. The economy of the county is largely based on agriculture, tourism, and manufacturing, and the population is largely white.
Common Questions
What is the Total Population of Chelan County?
Total Population of Chelan County is 79,076.
What is the Total Male Population of Chelan County?
Total Male Population of Chelan County is 39,895.
What is the Total Female Population of Chelan County?
Total Female Population of Chelan County is 39,181.
What is the Ratio of Males per 100 Females in Chelan County?
There are 101.82 Males per 100 Females in Chelan County.
What is the Ratio of Females per 100 Males in Chelan County?
There are 98.21 Females per 100 Males in Chelan County.
What is the Median Population Age in Chelan County?
Median Population Age in Chelan County is 40.1 Years.
What is the Average Family Size in Chelan County
Average Family Size in Chelan County is 3.1 People.
What is the Average Household Size in Chelan County
Average Household Size in Chelan County is 2.5 People.
What is Per Capita Income in Chelan County?
Per Capita income in Chelan County is $39,746.
What is the Median Family Income in Chelan County?
Median Family Income in Chelan County is $85,727.
What is the Median Household income in Chelan County?
Median Household Income in Chelan County is $71,876.
What is Income or Wage Gap in Chelan County?
Income or Wage Gap in Chelan County is 22.7%.
Women in Chelan County earn 77.3 cents for every dollar earned by a man.
What is Family Income Deficit in Chelan County?
Family Income Deficit in Chelan County is $9,952.
Families that are below poverty line in Chelan County earn $9,952 less on average than the poverty threshold level.
What is Inequality or Gini Index in Chelan County?
Inequality or Gini Index in Chelan County is 0.45.
How Large is the Labor Force in Chelan County?
There are 38,713 People in the Labor Forcein in Chelan County.
What is the Percentage of People in the Labor Force in Chelan County?
61.6% of People are in the Labor Force in Chelan County.
What is the Unemployment Rate in Chelan County?
Unemployment Rate in Chelan County is 3.4%.