Asotin County, WA
Asotin County Map
Asotin County Overview
22,370
TOTAL POPULATION
11,031
MALE POPULATION
11,339
FEMALE POPULATION
97.28
MALES / 100 FEMALES
102.79
FEMALES / 100 MALES
45.4
MEDIAN AGE
2.9
AVG FAMILY SIZE
2.3
AVG HOUSEHOLD SIZE
$36,800
PER CAPITA INCOME
$74,936
AVG FAMILY INCOME
$63,724
AVG HOUSEHOLD INCOME
22.8%
WAGE / INCOME GAP [ % ]
77.2¢/ $1
WAGE / INCOME GAP [ $ ]
$14,286
FAMILY INCOME DEFICIT
0.47
INEQUALITY / GINI INDEX
10,239
LABOR FORCE [ PEOPLE ]
55.6%
PERCENT IN LABOR FORCE
5.9%
UNEMPLOYMENT RATE
Asotin County Area Codes
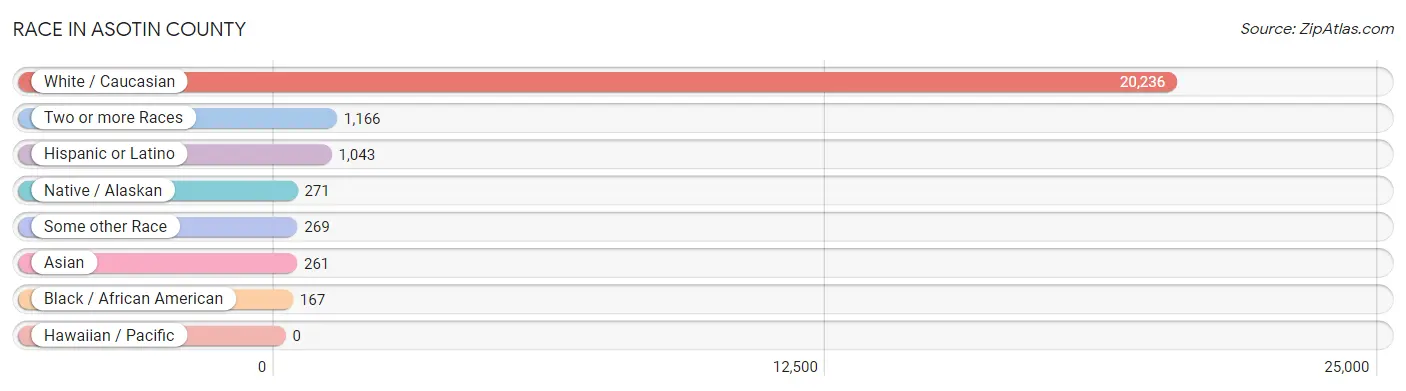
Race in Asotin County
The most populous races in Asotin County are White / Caucasian (20,236 | 90.5%), Two or more Races (1,166 | 5.2%), and Hispanic or Latino (1,043 | 4.7%).
| Race | # Population | % Population |
| Asian | 261 | 1.2% |
| Black / African American | 167 | 0.7% |
| Hawaiian / Pacific | 0 | 0.0% |
| Hispanic or Latino | 1,043 | 4.7% |
| Native / Alaskan | 271 | 1.2% |
| White / Caucasian | 20,236 | 90.5% |
| Two or more Races | 1,166 | 5.2% |
| Some other Race | 269 | 1.2% |
| Total | 22,370 | 100.0% |
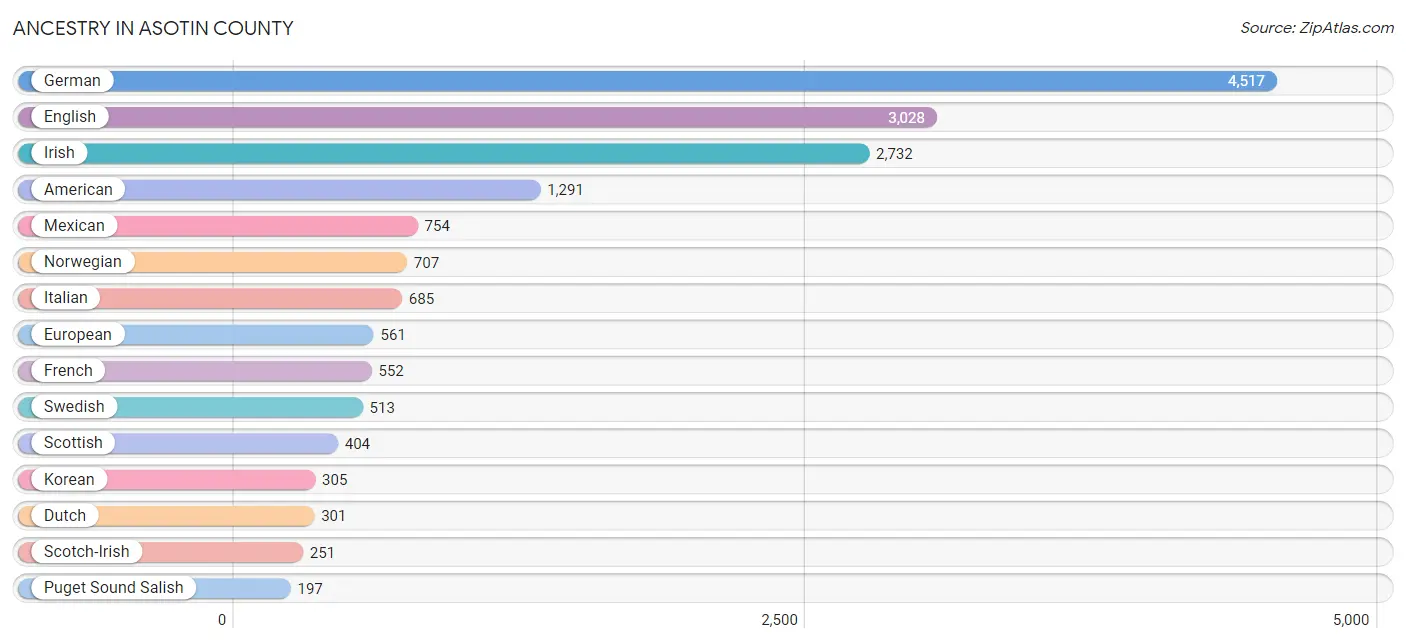
Ancestry in Asotin County
The most populous ancestries reported in Asotin County are German (4,517 | 20.2%), English (3,028 | 13.5%), Irish (2,732 | 12.2%), American (1,291 | 5.8%), and Mexican (754 | 3.4%), together accounting for 55.1% of all Asotin County residents.
| Ancestry | # Population | % Population |
| American | 1,291 | 5.8% |
| Austrian | 71 | 0.3% |
| Basque | 4 | 0.0% |
| Belgian | 14 | 0.1% |
| Bhutanese | 17 | 0.1% |
| Brazilian | 74 | 0.3% |
| British | 112 | 0.5% |
| Burmese | 13 | 0.1% |
| Canadian | 44 | 0.2% |
| Central American | 27 | 0.1% |
| Cherokee | 50 | 0.2% |
| Chippewa | 30 | 0.1% |
| Choctaw | 31 | 0.1% |
| Colombian | 47 | 0.2% |
| Cree | 100 | 0.4% |
| Cuban | 19 | 0.1% |
| Czech | 11 | 0.1% |
| Danish | 153 | 0.7% |
| Dutch | 301 | 1.3% |
| Eastern European | 18 | 0.1% |
| English | 3,028 | 13.5% |
| European | 561 | 2.5% |
| Finnish | 102 | 0.5% |
| French | 552 | 2.5% |
| French Canadian | 187 | 0.8% |
| German | 4,517 | 20.2% |
| Greek | 7 | 0.0% |
| Guyanese | 15 | 0.1% |
| Hungarian | 48 | 0.2% |
| Icelander | 31 | 0.1% |
| Indian (Asian) | 19 | 0.1% |
| Iranian | 7 | 0.0% |
| Irish | 2,732 | 12.2% |
| Italian | 685 | 3.1% |
| Kenyan | 22 | 0.1% |
| Korean | 305 | 1.4% |
| Mexican | 754 | 3.4% |
| Native Hawaiian | 38 | 0.2% |
| Nigerian | 9 | 0.0% |
| Northern European | 163 | 0.7% |
| Norwegian | 707 | 3.2% |
| Paiute | 119 | 0.5% |
| Pakistani | 15 | 0.1% |
| Polish | 83 | 0.4% |
| Portuguese | 33 | 0.2% |
| Puerto Rican | 26 | 0.1% |
| Puget Sound Salish | 197 | 0.9% |
| Romanian | 5 | 0.0% |
| Russian | 26 | 0.1% |
| Salvadoran | 27 | 0.1% |
| Scandinavian | 69 | 0.3% |
| Scotch-Irish | 251 | 1.1% |
| Scottish | 404 | 1.8% |
| Serbian | 11 | 0.1% |
| Sioux | 29 | 0.1% |
| Slovene | 9 | 0.0% |
| South American | 47 | 0.2% |
| Spaniard | 11 | 0.1% |
| Spanish | 44 | 0.2% |
| Subsaharan African | 53 | 0.2% |
| Swedish | 513 | 2.3% |
| Swiss | 60 | 0.3% |
| Turkish | 119 | 0.5% |
| Welsh | 121 | 0.5% |
| Yugoslavian | 41 | 0.2% | View All 65 Rows |
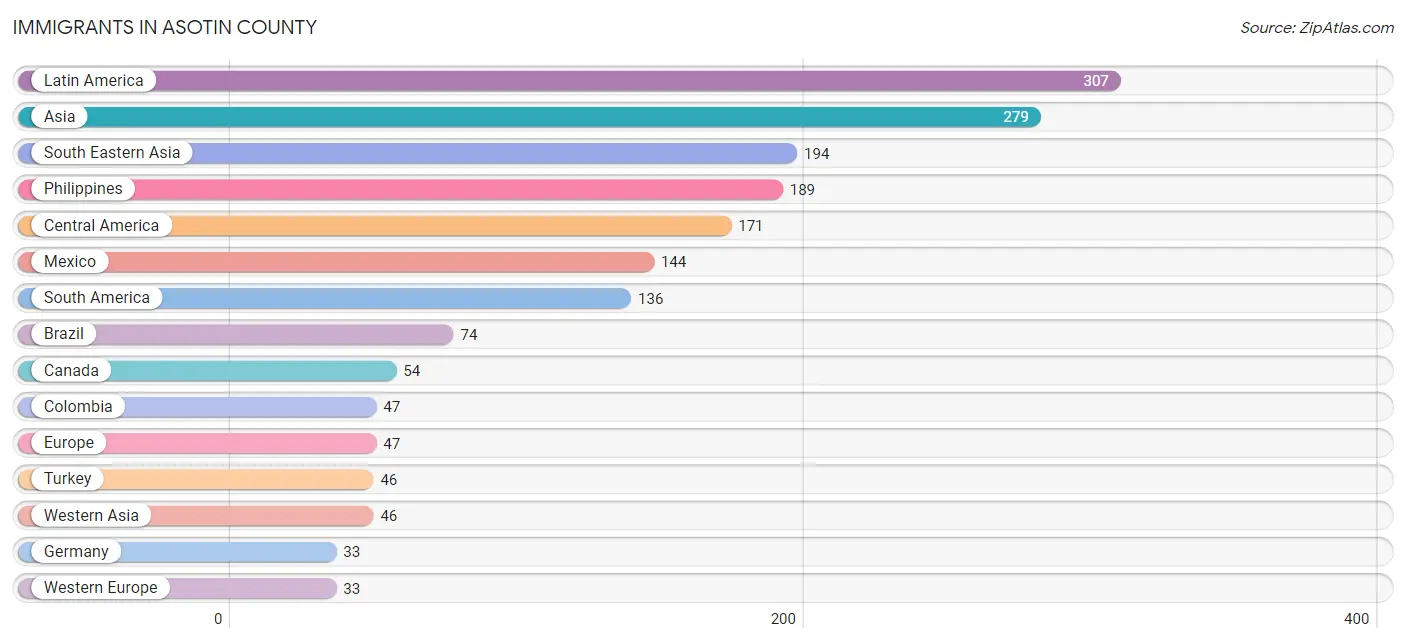
Immigrants in Asotin County
The most numerous immigrant groups reported in Asotin County came from Latin America (307 | 1.4%), Asia (279 | 1.3%), South Eastern Asia (194 | 0.9%), Philippines (189 | 0.8%), and Central America (171 | 0.8%), together accounting for 5.1% of all Asotin County residents.
| Immigration Origin | # Population | % Population |
| Africa | 29 | 0.1% |
| Asia | 279 | 1.3% |
| Brazil | 74 | 0.3% |
| Canada | 54 | 0.2% |
| Central America | 171 | 0.8% |
| China | 19 | 0.1% |
| Colombia | 47 | 0.2% |
| Eastern Africa | 29 | 0.1% |
| Eastern Asia | 32 | 0.1% |
| Eastern Europe | 14 | 0.1% |
| El Salvador | 27 | 0.1% |
| Ethiopia | 7 | 0.0% |
| Europe | 47 | 0.2% |
| Germany | 33 | 0.2% |
| Guyana | 15 | 0.1% |
| Iran | 7 | 0.0% |
| Kenya | 22 | 0.1% |
| Korea | 13 | 0.1% |
| Latin America | 307 | 1.4% |
| Mexico | 144 | 0.6% |
| Philippines | 189 | 0.8% |
| Romania | 5 | 0.0% |
| Russia | 9 | 0.0% |
| South America | 136 | 0.6% |
| South Central Asia | 7 | 0.0% |
| South Eastern Asia | 194 | 0.9% |
| Thailand | 5 | 0.0% |
| Turkey | 46 | 0.2% |
| Western Asia | 46 | 0.2% |
| Western Europe | 33 | 0.2% | View All 30 Rows |
Sex and Age in Asotin County
Sex and Age in Asotin County
The most populous age groups in Asotin County are 60 to 64 Years (949 | 8.6%) for men and 60 to 64 Years (934 | 8.2%) for women.
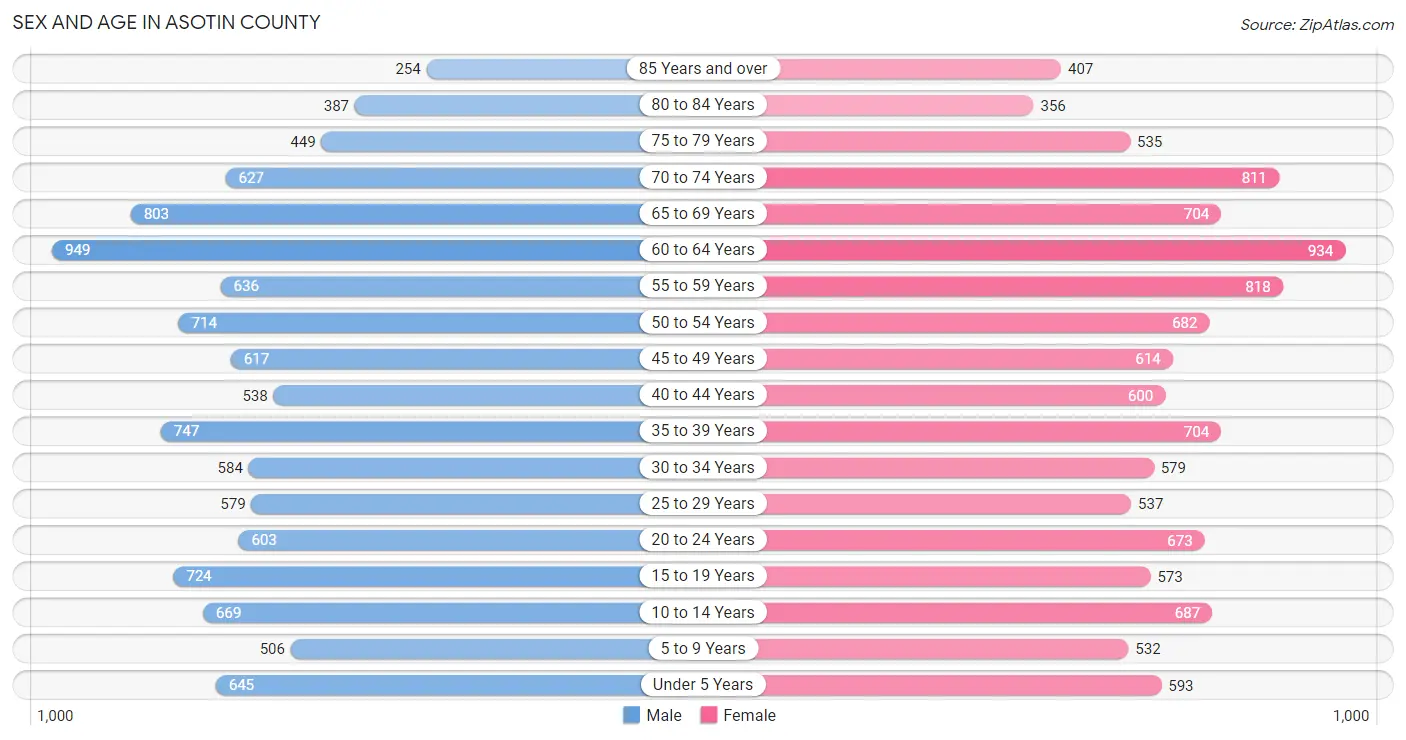
| Age Bracket | Male | Female |
| Under 5 Years | 645 (5.9%) | 593 (5.2%) |
| 5 to 9 Years | 506 (4.6%) | 532 (4.7%) |
| 10 to 14 Years | 669 (6.1%) | 687 (6.1%) |
| 15 to 19 Years | 724 (6.6%) | 573 (5.1%) |
| 20 to 24 Years | 603 (5.5%) | 673 (5.9%) |
| 25 to 29 Years | 579 (5.2%) | 537 (4.7%) |
| 30 to 34 Years | 584 (5.3%) | 579 (5.1%) |
| 35 to 39 Years | 747 (6.8%) | 704 (6.2%) |
| 40 to 44 Years | 538 (4.9%) | 600 (5.3%) |
| 45 to 49 Years | 617 (5.6%) | 614 (5.4%) |
| 50 to 54 Years | 714 (6.5%) | 682 (6.0%) |
| 55 to 59 Years | 636 (5.8%) | 818 (7.2%) |
| 60 to 64 Years | 949 (8.6%) | 934 (8.2%) |
| 65 to 69 Years | 803 (7.3%) | 704 (6.2%) |
| 70 to 74 Years | 627 (5.7%) | 811 (7.1%) |
| 75 to 79 Years | 449 (4.1%) | 535 (4.7%) |
| 80 to 84 Years | 387 (3.5%) | 356 (3.1%) |
| 85 Years and over | 254 (2.3%) | 407 (3.6%) |
| Total | 11,031 (100.0%) | 11,339 (100.0%) |
Families and Households in Asotin County
Median Family Size in Asotin County
The median family size in Asotin County is 2.93 persons per family, with single female/mother families (919 | 16.5%) accounting for the largest median family size of 3.31 persons per family. On the other hand, single male/father families (475 | 8.5%) represent the smallest median family size with 2.71 persons per family.
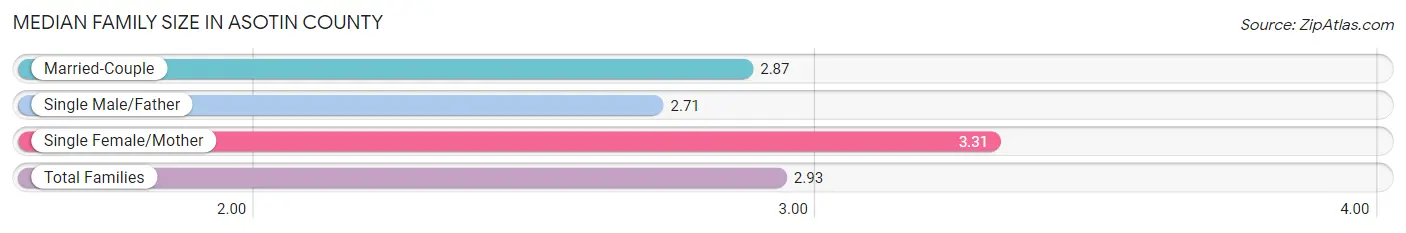
| Family Type | # Families | Family Size |
| Married-Couple | 4,180 (75.0%) | 2.87 |
| Single Male/Father | 475 (8.5%) | 2.71 |
| Single Female/Mother | 919 (16.5%) | 3.31 |
| Total Families | 5,574 (100.0%) | 2.93 |
Median Household Size in Asotin County
The median household size in Asotin County is 2.33 persons per household, with single female/mother households (919 | 9.7%) accounting for the largest median household size of 3.76 persons per household. non-family households (3,925 | 41.3%) represent the smallest median household size with 1.28 persons per household.
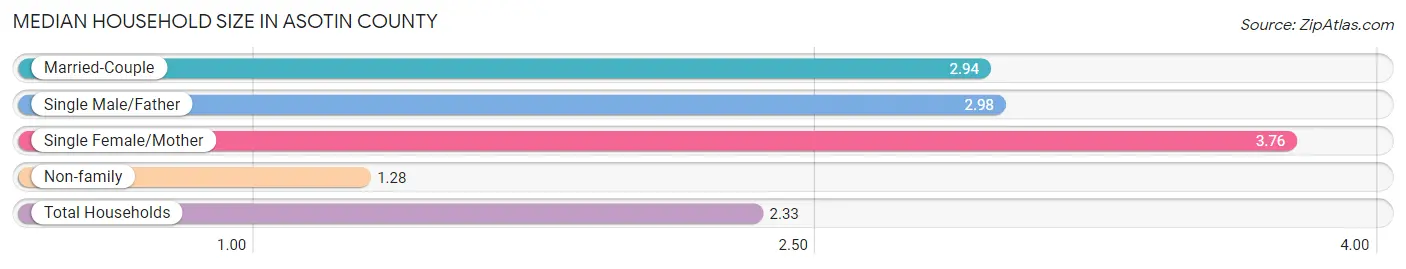
| Household Type | # Households | Household Size |
| Married-Couple | 4,180 (44.0%) | 2.94 |
| Single Male/Father | 475 (5.0%) | 2.98 |
| Single Female/Mother | 919 (9.7%) | 3.76 |
| Non-family | 3,925 (41.3%) | 1.28 |
| Total Households | 9,499 (100.0%) | 2.33 |
Household Size by Marriage Status in Asotin County
Out of a total of 9,499 households in Asotin County, 5,574 (58.7%) are family households, while 3,925 (41.3%) are nonfamily households. The most numerous type of family households are 2-person households, comprising 2,747, and the most common type of nonfamily households are 1-person households, comprising 3,131.
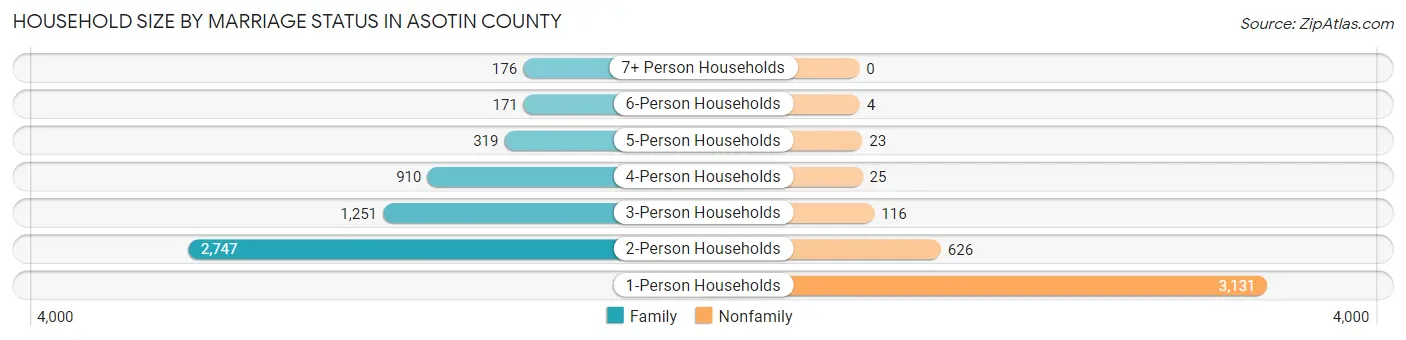
| Household Size | Family Households | Nonfamily Households |
| 1-Person Households | - | 3,131 (33.0%) |
| 2-Person Households | 2,747 (28.9%) | 626 (6.6%) |
| 3-Person Households | 1,251 (13.2%) | 116 (1.2%) |
| 4-Person Households | 910 (9.6%) | 25 (0.3%) |
| 5-Person Households | 319 (3.4%) | 23 (0.2%) |
| 6-Person Households | 171 (1.8%) | 4 (0.0%) |
| 7+ Person Households | 176 (1.8%) | 0 (0.0%) |
| Total | 5,574 (58.7%) | 3,925 (41.3%) |
Female Fertility in Asotin County
Fertility by Age in Asotin County
Average fertility rate in Asotin County is 60.0 births per 1,000 women. Women in the age bracket of 20 to 34 years have the highest fertility rate with 66.0 births per 1,000 women. Women in the age bracket of 20 to 34 years acount for 45.0% of all women with births.
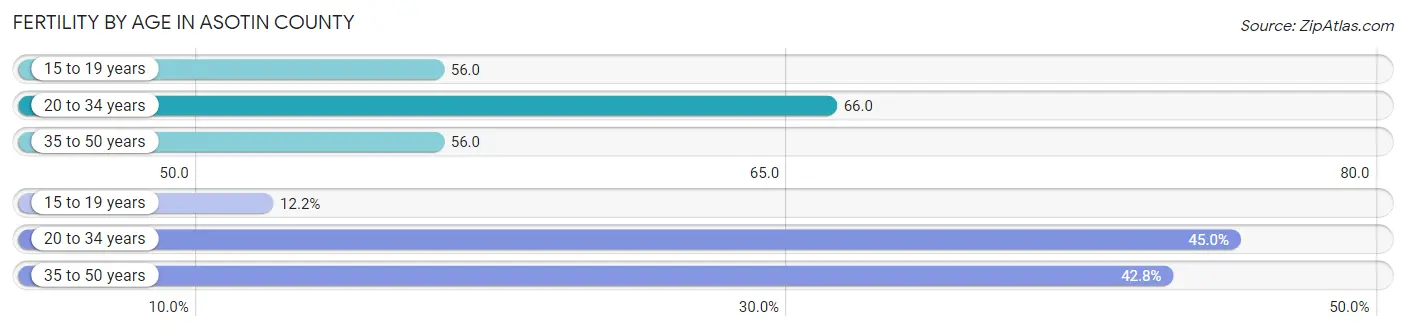
| Age Bracket | Women with Births | Births / 1,000 Women |
| 15 to 19 years | 32 (12.2%) | 56.0 |
| 20 to 34 years | 118 (45.0%) | 66.0 |
| 35 to 50 years | 112 (42.7%) | 56.0 |
| Total | 262 (100.0%) | 60.0 |
Fertility by Age by Marriage Status in Asotin County
61.5% of women with births (262) in Asotin County are married. The highest percentage of unmarried women with births falls into 15 to 19 years age bracket with 100.0% of them unmarried at the time of birth, while the lowest percentage of unmarried women with births belong to 20 to 34 years age bracket with 28.8% of them unmarried.
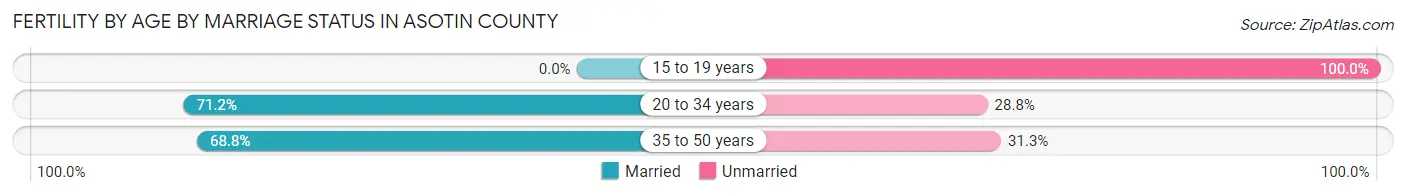
| Age Bracket | Married | Unmarried |
| 15 to 19 years | 0 (0.0%) | 32 (100.0%) |
| 20 to 34 years | 84 (71.2%) | 34 (28.8%) |
| 35 to 50 years | 77 (68.8%) | 35 (31.2%) |
| Total | 161 (61.5%) | 101 (38.6%) |
Fertility by Education in Asotin County
Average fertility rate in Asotin County is 60.0 births per 1,000 women. Women with the education attainment of bachelor's degree have the highest fertility rate of 142.0 births per 1,000 women, while women with the education attainment of high school diploma have the lowest fertility at 38.0 births per 1,000 women. Women with the education attainment of bachelor's degree represent 30.9% of all women with births.
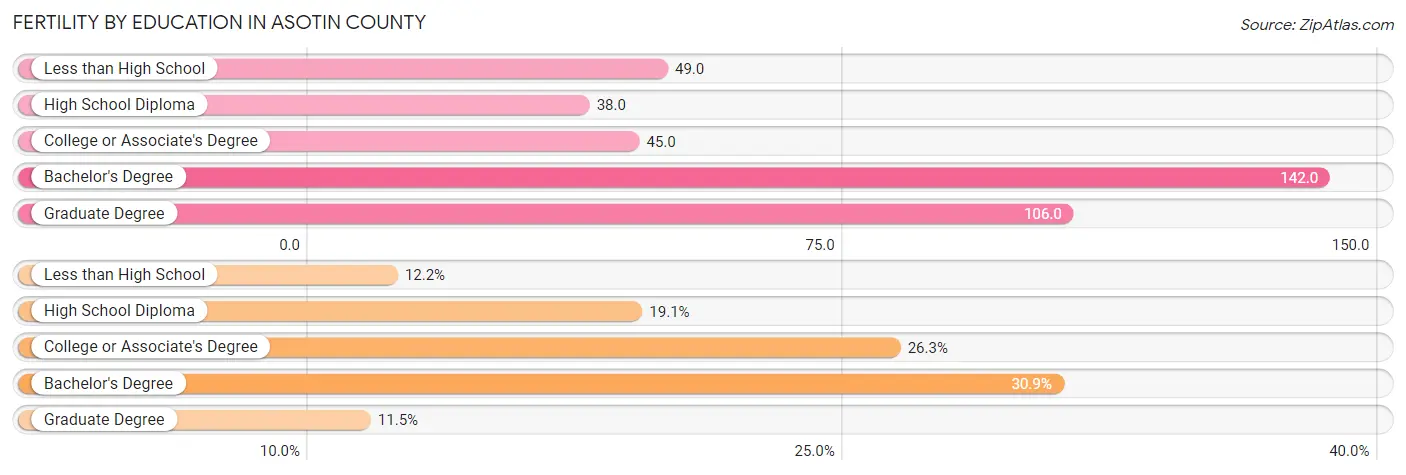
| Educational Attainment | Women with Births | Births / 1,000 Women |
| Less than High School | 32 (12.2%) | 49.0 |
| High School Diploma | 50 (19.1%) | 38.0 |
| College or Associate's Degree | 69 (26.3%) | 45.0 |
| Bachelor's Degree | 81 (30.9%) | 142.0 |
| Graduate Degree | 30 (11.5%) | 106.0 |
| Total | 262 (100.0%) | 60.0 |
Fertility by Education by Marriage Status in Asotin County
38.6% of women with births in Asotin County are unmarried. Women with the educational attainment of graduate degree are most likely to be married with 100.0% of them married at childbirth, while women with the educational attainment of less than high school are least likely to be married with 100.0% of them unmarried at childbirth.
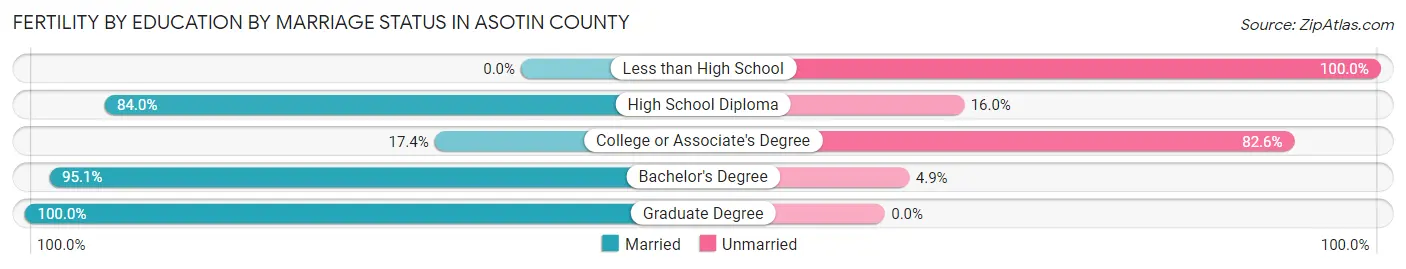
| Educational Attainment | Married | Unmarried |
| Less than High School | 0 (0.0%) | 32 (100.0%) |
| High School Diploma | 42 (84.0%) | 8 (16.0%) |
| College or Associate's Degree | 12 (17.4%) | 57 (82.6%) |
| Bachelor's Degree | 77 (95.1%) | 4 (4.9%) |
| Graduate Degree | 30 (100.0%) | 0 (0.0%) |
| Total | 161 (61.5%) | 101 (38.6%) |
Income in Asotin County
Income Overview in Asotin County
Per Capita Income in Asotin County is $36,800, while median incomes of families and households are $74,936 and $63,724 respectively.
| Characteristic | Number | Measure |
| Per Capita Income | 22,370 | $36,800 |
| Median Family Income | 5,574 | $74,936 |
| Mean Family Income | 5,574 | $98,317 |
| Median Household Income | 9,499 | $63,724 |
| Mean Household Income | 9,499 | $85,734 |
| Income Deficit | 5,574 | $14,286 |
| Wage / Income Gap (%) | 22,370 | 22.77% |
| Wage / Income Gap ($) | 22,370 | 77.23¢ per $1 |
| Gini / Inequality Index | 22,370 | 0.47 |
Earnings by Sex in Asotin County
Average Earnings in Asotin County are $35,196, $40,241 for men and $31,079 for women, a difference of 22.8%.
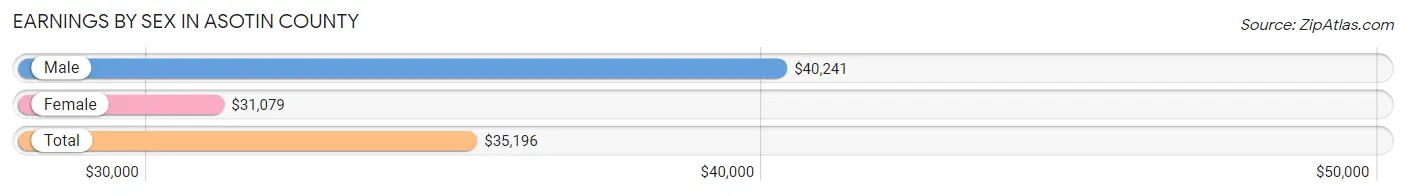
| Sex | Number | Average Earnings |
| Male | 5,217 (49.2%) | $40,241 |
| Female | 5,380 (50.8%) | $31,079 |
| Total | 10,597 (100.0%) | $35,196 |
Earnings by Sex by Income Bracket in Asotin County
The most common earnings brackets in Asotin County are $100,000+ for men (801 | 15.3%) and $30,000 to $34,999 for women (484 | 9.0%).
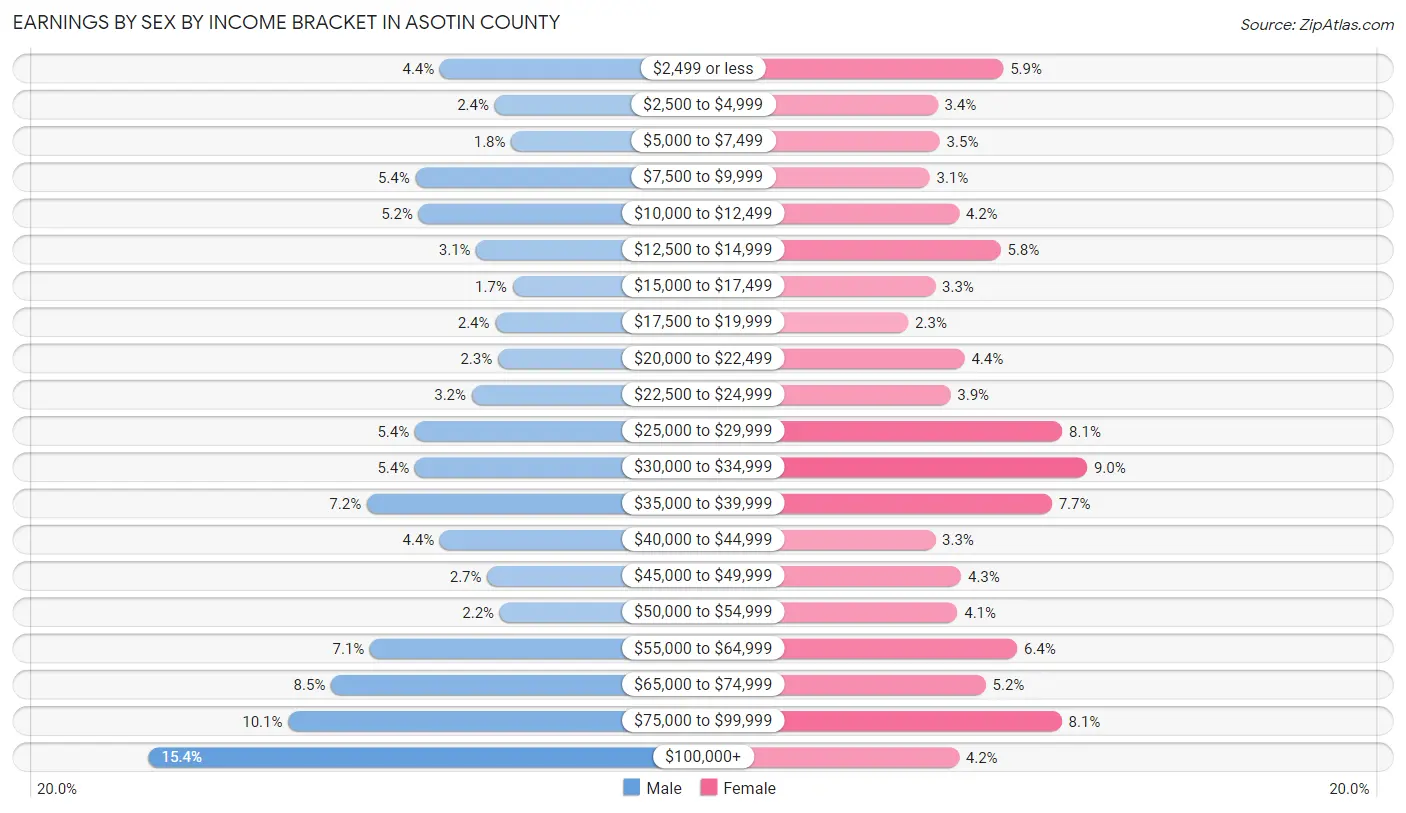
| Income | Male | Female |
| $2,499 or less | 231 (4.4%) | 315 (5.9%) |
| $2,500 to $4,999 | 124 (2.4%) | 183 (3.4%) |
| $5,000 to $7,499 | 92 (1.8%) | 187 (3.5%) |
| $7,500 to $9,999 | 279 (5.3%) | 167 (3.1%) |
| $10,000 to $12,499 | 273 (5.2%) | 226 (4.2%) |
| $12,500 to $14,999 | 160 (3.1%) | 310 (5.8%) |
| $15,000 to $17,499 | 89 (1.7%) | 178 (3.3%) |
| $17,500 to $19,999 | 123 (2.4%) | 124 (2.3%) |
| $20,000 to $22,499 | 118 (2.3%) | 237 (4.4%) |
| $22,500 to $24,999 | 169 (3.2%) | 209 (3.9%) |
| $25,000 to $29,999 | 280 (5.4%) | 434 (8.1%) |
| $30,000 to $34,999 | 280 (5.4%) | 484 (9.0%) |
| $35,000 to $39,999 | 374 (7.2%) | 413 (7.7%) |
| $40,000 to $44,999 | 231 (4.4%) | 178 (3.3%) |
| $45,000 to $49,999 | 139 (2.7%) | 230 (4.3%) |
| $50,000 to $54,999 | 114 (2.2%) | 223 (4.1%) |
| $55,000 to $64,999 | 368 (7.0%) | 343 (6.4%) |
| $65,000 to $74,999 | 444 (8.5%) | 280 (5.2%) |
| $75,000 to $99,999 | 528 (10.1%) | 433 (8.1%) |
| $100,000+ | 801 (15.3%) | 226 (4.2%) |
| Total | 5,217 (100.0%) | 5,380 (100.0%) |
Earnings by Sex by Educational Attainment in Asotin County
Average earnings in Asotin County are $49,322 for men and $33,513 for women, a difference of 32.1%. Men with an educational attainment of graduate degree enjoy the highest average annual earnings of $146,563, while those with less than high school education earn the least with $27,365. Women with an educational attainment of graduate degree earn the most with the average annual earnings of $64,750, while those with less than high school education have the smallest earnings of $11,402.
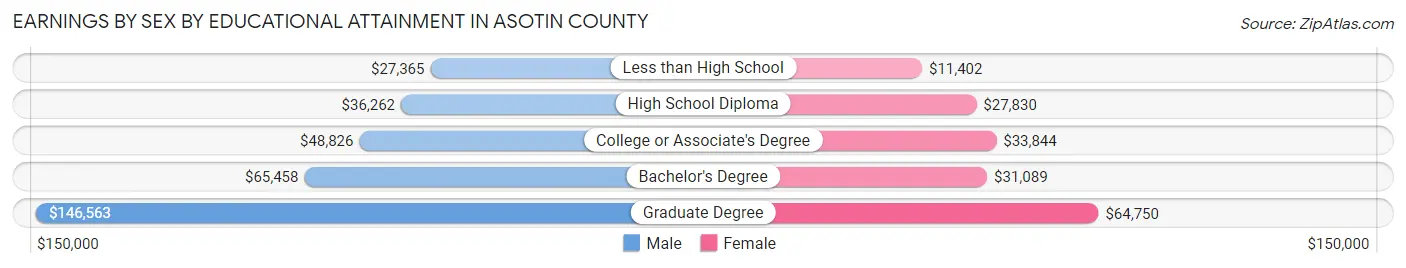
| Educational Attainment | Male Income | Female Income |
| Less than High School | $27,365 | $11,402 |
| High School Diploma | $36,262 | $27,830 |
| College or Associate's Degree | $48,826 | $33,844 |
| Bachelor's Degree | $65,458 | $31,089 |
| Graduate Degree | $146,563 | $64,750 |
| Total | $49,322 | $33,513 |
Family Income in Asotin County
Family Income Brackets in Asotin County
According to the Asotin County family income data, there are 1,126 families falling into the $100,000 to $149,999 income range, which is the most common income bracket and makes up 20.2% of all families. Conversely, the $10,000 to $14,999 income bracket is the least frequent group with only 72 families (1.3%) belonging to this category.
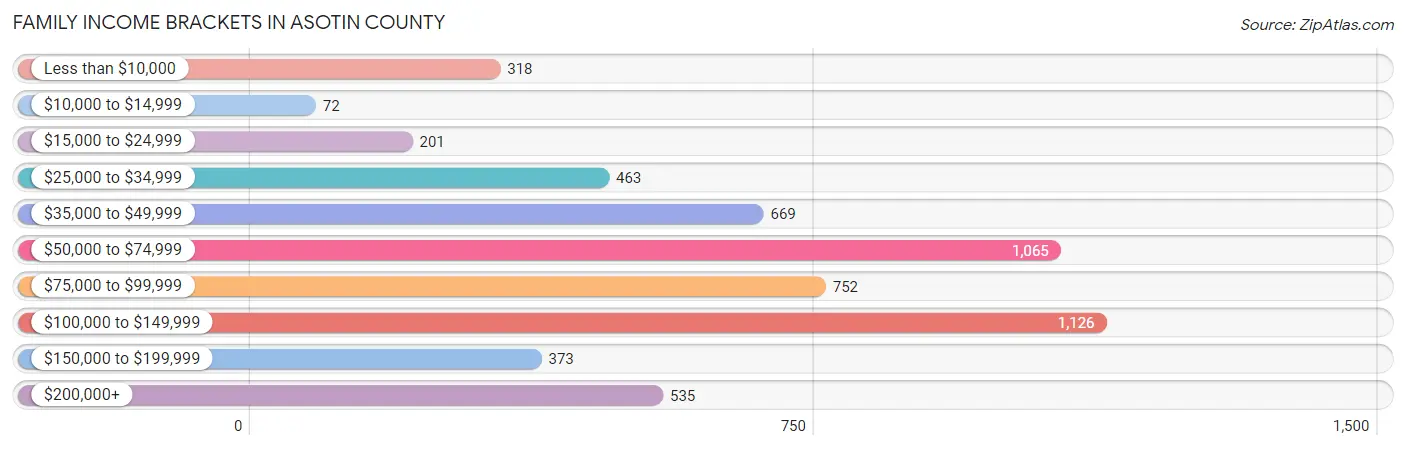
| Income Bracket | # Families | % Families |
| Less than $10,000 | 318 | 5.7% |
| $10,000 to $14,999 | 72 | 1.3% |
| $15,000 to $24,999 | 201 | 3.6% |
| $25,000 to $34,999 | 463 | 8.3% |
| $35,000 to $49,999 | 669 | 12.0% |
| $50,000 to $74,999 | 1,065 | 19.1% |
| $75,000 to $99,999 | 752 | 13.5% |
| $100,000 to $149,999 | 1,126 | 20.2% |
| $150,000 to $199,999 | 373 | 6.7% |
| $200,000+ | 535 | 9.6% |
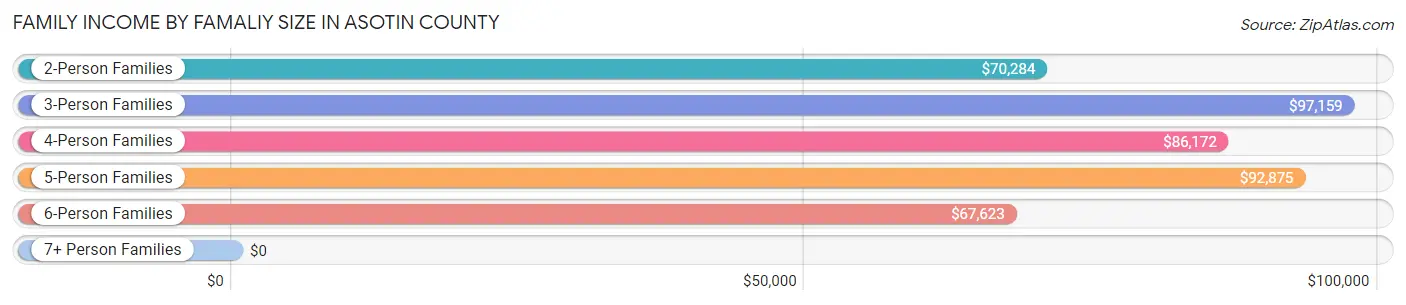
Family Income by Famaliy Size in Asotin County
3-person families (1,259 | 22.6%) account for the highest median family income in Asotin County with $97,159 per family, while 2-person families (2,963 | 53.2%) have the highest median income of $35,142 per family member.
| Income Bracket | # Families | Median Income |
| 2-Person Families | 2,963 (53.2%) | $70,284 |
| 3-Person Families | 1,259 (22.6%) | $97,159 |
| 4-Person Families | 737 (13.2%) | $86,172 |
| 5-Person Families | 311 (5.6%) | $92,875 |
| 6-Person Families | 199 (3.6%) | $67,623 |
| 7+ Person Families | 105 (1.9%) | $0 |
| Total | 5,574 (100.0%) | $74,936 |
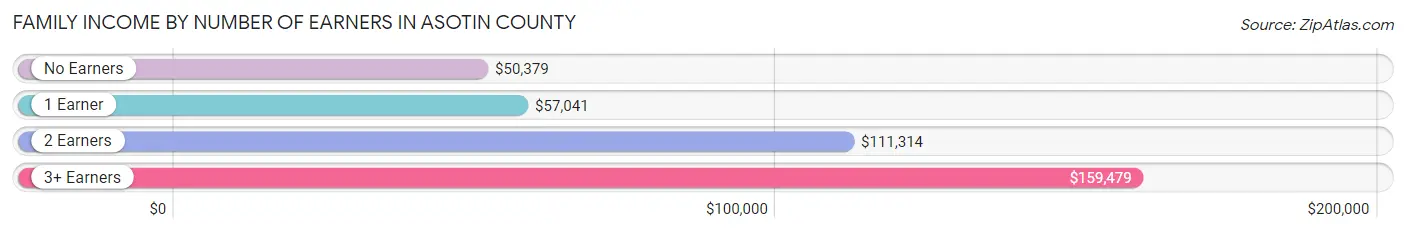
Family Income by Number of Earners in Asotin County
The median family income in Asotin County is $74,936, with families comprising 3+ earners (473) having the highest median family income of $159,479, while families with no earners (1,416) have the lowest median family income of $50,379, accounting for 8.5% and 25.4% of families, respectively.
| Number of Earners | # Families | Median Income |
| No Earners | 1,416 (25.4%) | $50,379 |
| 1 Earner | 1,906 (34.2%) | $57,041 |
| 2 Earners | 1,779 (31.9%) | $111,314 |
| 3+ Earners | 473 (8.5%) | $159,479 |
| Total | 5,574 (100.0%) | $74,936 |
Household Income in Asotin County
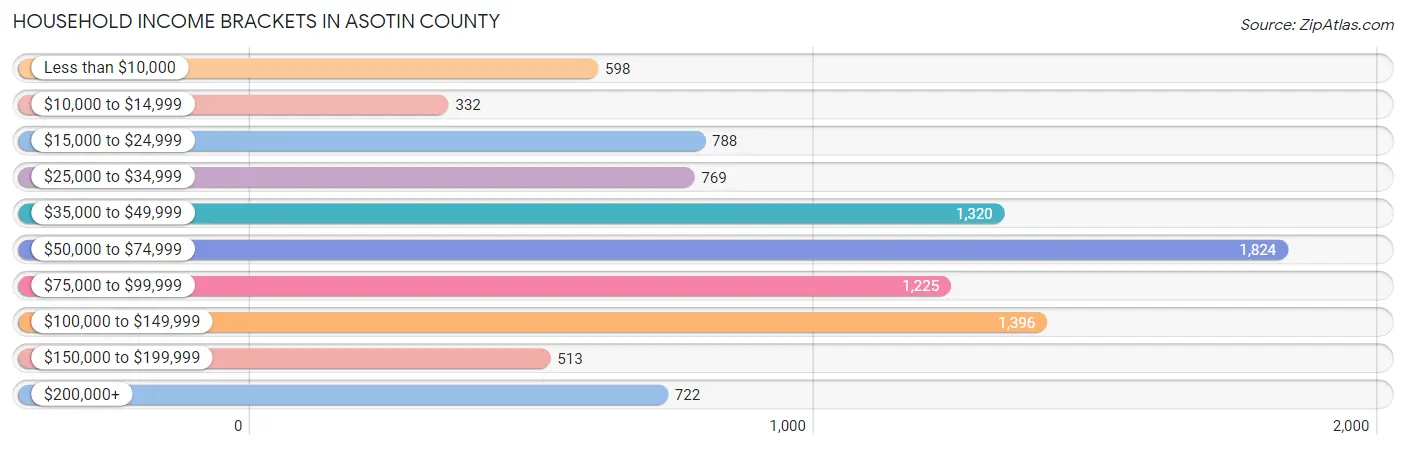
Household Income Brackets in Asotin County
With 1,824 households falling in the category, the $50,000 to $74,999 income range is the most frequent in Asotin County, accounting for 19.2% of all households. In contrast, only 332 households (3.5%) fall into the $10,000 to $14,999 income bracket, making it the least populous group.
| Income Bracket | # Households | % Households |
| Less than $10,000 | 598 | 6.3% |
| $10,000 to $14,999 | 332 | 3.5% |
| $15,000 to $24,999 | 788 | 8.3% |
| $25,000 to $34,999 | 769 | 8.1% |
| $35,000 to $49,999 | 1,320 | 13.9% |
| $50,000 to $74,999 | 1,824 | 19.2% |
| $75,000 to $99,999 | 1,225 | 12.9% |
| $100,000 to $149,999 | 1,396 | 14.7% |
| $150,000 to $199,999 | 513 | 5.4% |
| $200,000+ | 722 | 7.6% |
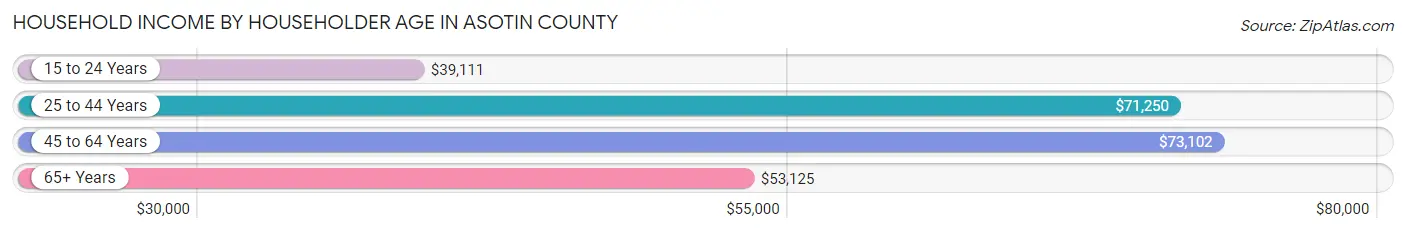
Household Income by Householder Age in Asotin County
The median household income in Asotin County is $63,724, with the highest median household income of $73,102 found in the 45 to 64 years age bracket for the primary householder. A total of 3,590 households (37.8%) fall into this category. Meanwhile, the 15 to 24 years age bracket for the primary householder has the lowest median household income of $39,111, with 447 households (4.7%) in this group.
| Income Bracket | # Households | Median Income |
| 15 to 24 Years | 447 (4.7%) | $39,111 |
| 25 to 44 Years | 1,981 (20.8%) | $71,250 |
| 45 to 64 Years | 3,590 (37.8%) | $73,102 |
| 65+ Years | 3,481 (36.6%) | $53,125 |
| Total | 9,499 (100.0%) | $63,724 |
Poverty in Asotin County
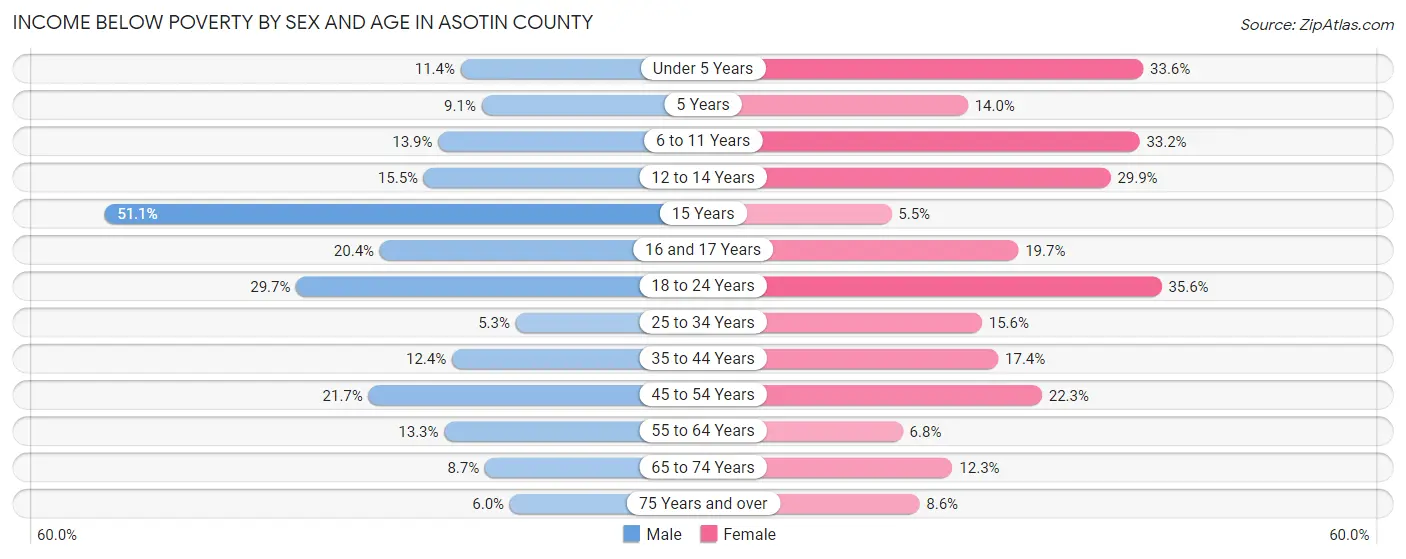
Income Below Poverty by Sex and Age in Asotin County
With 14.1% poverty level for males and 18.0% for females among the residents of Asotin County, 15 year old males and 18 to 24 year old females are the most vulnerable to poverty, with 91 males (51.1%) and 309 females (35.6%) in their respective age groups living below the poverty level.
| Age Bracket | Male | Female |
| Under 5 Years | 73 (11.4%) | 199 (33.6%) |
| 5 Years | 12 (9.1%) | 15 (14.0%) |
| 6 to 11 Years | 90 (13.9%) | 236 (33.2%) |
| 12 to 14 Years | 59 (15.5%) | 117 (29.9%) |
| 15 Years | 91 (51.1%) | 8 (5.5%) |
| 16 and 17 Years | 67 (20.4%) | 45 (19.7%) |
| 18 to 24 Years | 243 (29.7%) | 309 (35.6%) |
| 25 to 34 Years | 61 (5.3%) | 174 (15.6%) |
| 35 to 44 Years | 158 (12.4%) | 227 (17.4%) |
| 45 to 54 Years | 287 (21.7%) | 288 (22.3%) |
| 55 to 64 Years | 208 (13.3%) | 118 (6.8%) |
| 65 to 74 Years | 123 (8.7%) | 186 (12.3%) |
| 75 Years and over | 63 (5.9%) | 107 (8.6%) |
| Total | 1,535 (14.1%) | 2,029 (18.0%) |
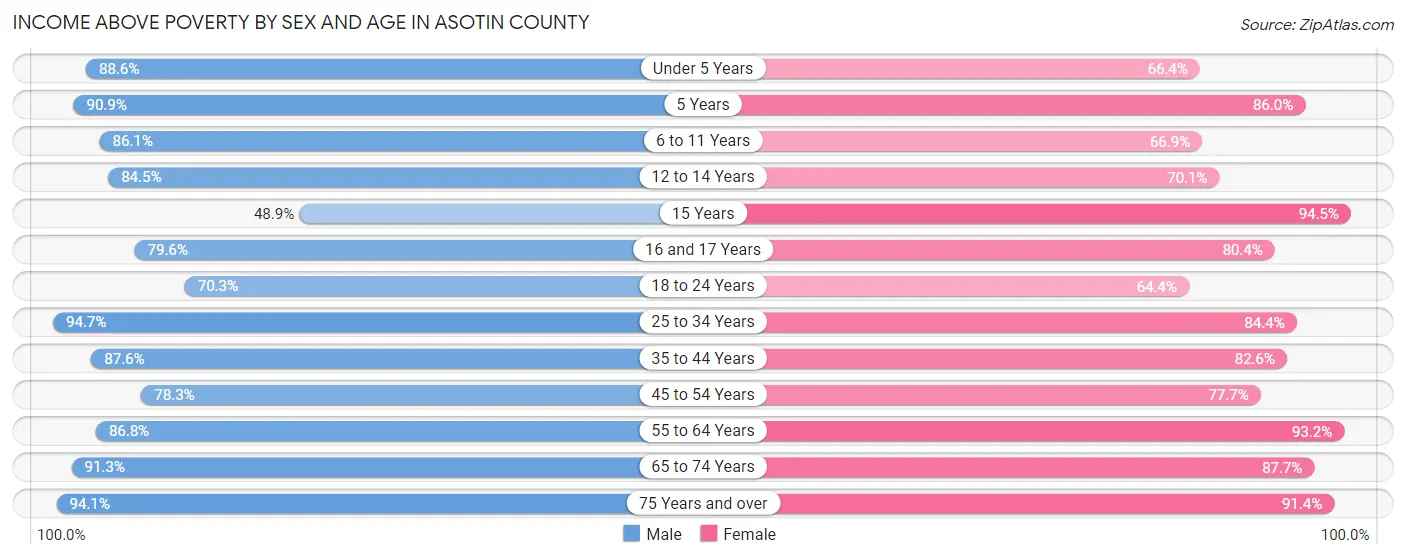
Income Above Poverty by Sex and Age in Asotin County
According to the poverty statistics in Asotin County, males aged 25 to 34 years and females aged 15 years are the age groups that are most secure financially, with 94.7% of males and 94.5% of females in these age groups living above the poverty line.
| Age Bracket | Male | Female |
| Under 5 Years | 566 (88.6%) | 394 (66.4%) |
| 5 Years | 120 (90.9%) | 92 (86.0%) |
| 6 to 11 Years | 556 (86.1%) | 476 (66.8%) |
| 12 to 14 Years | 321 (84.5%) | 274 (70.1%) |
| 15 Years | 87 (48.9%) | 137 (94.5%) |
| 16 and 17 Years | 261 (79.6%) | 184 (80.3%) |
| 18 to 24 Years | 574 (70.3%) | 559 (64.4%) |
| 25 to 34 Years | 1,090 (94.7%) | 942 (84.4%) |
| 35 to 44 Years | 1,116 (87.6%) | 1,077 (82.6%) |
| 45 to 54 Years | 1,036 (78.3%) | 1,005 (77.7%) |
| 55 to 64 Years | 1,362 (86.8%) | 1,623 (93.2%) |
| 65 to 74 Years | 1,287 (91.3%) | 1,324 (87.7%) |
| 75 Years and over | 996 (94.1%) | 1,131 (91.4%) |
| Total | 9,372 (85.9%) | 9,218 (82.0%) |
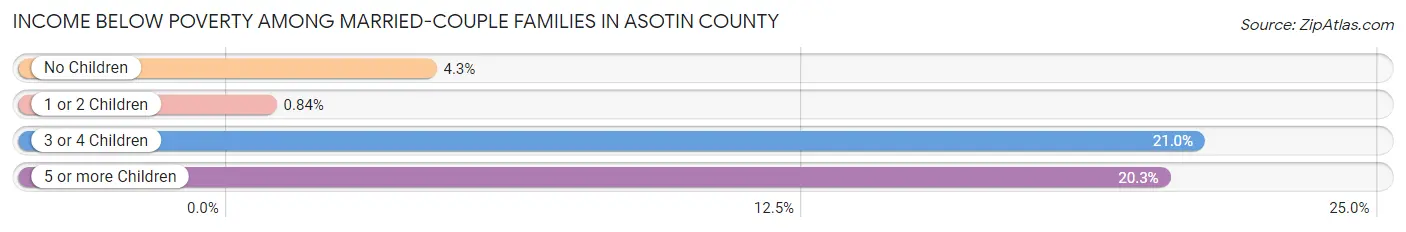
Income Below Poverty Among Married-Couple Families in Asotin County
The poverty statistics for married-couple families in Asotin County show that 5.0% or 210 of the total 4,180 families live below the poverty line. Families with 3 or 4 children have the highest poverty rate of 21.0%, comprising of 65 families. On the other hand, families with 1 or 2 children have the lowest poverty rate of 0.8%, which includes 8 families.
| Children | Above Poverty | Below Poverty |
| No Children | 2,724 (95.7%) | 123 (4.3%) |
| 1 or 2 Children | 947 (99.2%) | 8 (0.8%) |
| 3 or 4 Children | 244 (79.0%) | 65 (21.0%) |
| 5 or more Children | 55 (79.7%) | 14 (20.3%) |
| Total | 3,970 (95.0%) | 210 (5.0%) |
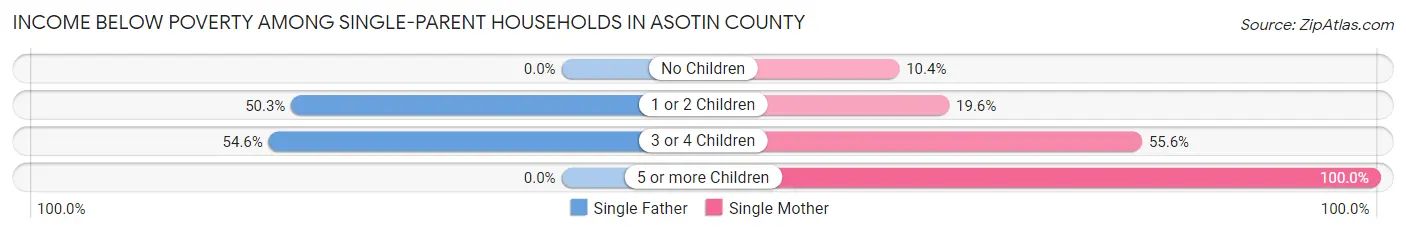
Income Below Poverty Among Single-Parent Households in Asotin County
According to the poverty data in Asotin County, 35.8% or 170 single-father households and 20.7% or 190 single-mother households are living below the poverty line. Among single-father households, those with 3 or 4 children have the highest poverty rate, with 24 households (54.5%) experiencing poverty. Likewise, among single-mother households, those with 5 or more children have the highest poverty rate, with 10 households (100.0%) falling below the poverty line.
| Children | Single Father | Single Mother |
| No Children | 0 (0.0%) | 38 (10.3%) |
| 1 or 2 Children | 146 (50.3%) | 87 (19.6%) |
| 3 or 4 Children | 24 (54.5%) | 55 (55.6%) |
| 5 or more Children | 0 (0.0%) | 10 (100.0%) |
| Total | 170 (35.8%) | 190 (20.7%) |
Income Below Poverty Among Married-Couple vs Single-Parent Households in Asotin County
The poverty data for Asotin County shows that 210 of the married-couple family households (5.0%) and 360 of the single-parent households (25.8%) are living below the poverty level. Within the married-couple family households, those with 3 or 4 children have the highest poverty rate, with 65 households (21.0%) falling below the poverty line. Among the single-parent households, those with 5 or more children have the highest poverty rate, with 10 household (66.7%) living below poverty.
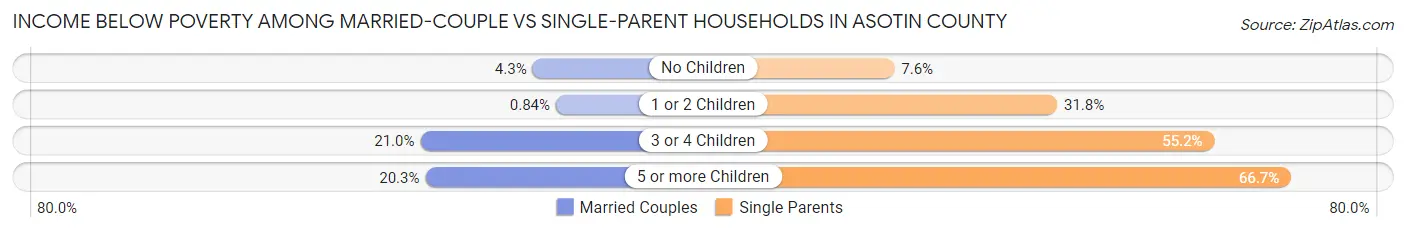
| Children | Married-Couple Families | Single-Parent Households |
| No Children | 123 (4.3%) | 38 (7.5%) |
| 1 or 2 Children | 8 (0.8%) | 233 (31.8%) |
| 3 or 4 Children | 65 (21.0%) | 79 (55.2%) |
| 5 or more Children | 14 (20.3%) | 10 (66.7%) |
| Total | 210 (5.0%) | 360 (25.8%) |
Employment Characteristics in Asotin County
Employment by Class of Employer in Asotin County
Among the 9,300 employed individuals in Asotin County, private company employees (6,284 | 67.6%), self-employed (not incorporated) (722 | 7.8%), and local government employees (719 | 7.7%) make up the most common classes of employment.
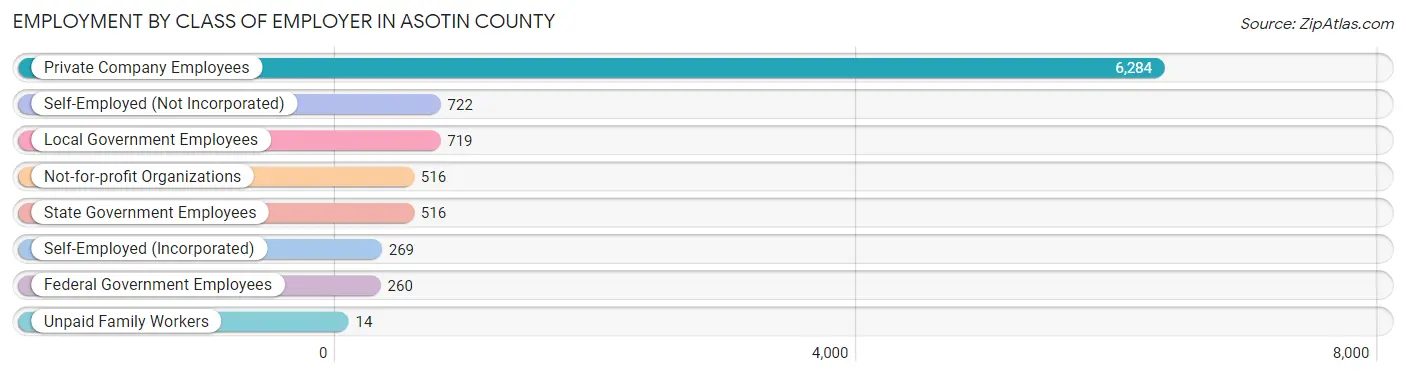
| Employer Class | # Employees | % Employees |
| Private Company Employees | 6,284 | 67.6% |
| Self-Employed (Incorporated) | 269 | 2.9% |
| Self-Employed (Not Incorporated) | 722 | 7.8% |
| Not-for-profit Organizations | 516 | 5.6% |
| Local Government Employees | 719 | 7.7% |
| State Government Employees | 516 | 5.6% |
| Federal Government Employees | 260 | 2.8% |
| Unpaid Family Workers | 14 | 0.2% |
| Total | 9,300 | 100.0% |
Employment Status by Age in Asotin County
According to the labor force statistics for Asotin County, out of the total population over 16 years of age (18,415), 55.6% or 10,239 individuals are in the labor force, with 5.9% or 604 of them unemployed. The age group with the highest labor force participation rate is 20 to 24 years, with 86.0% or 1,097 individuals in the labor force. Within the labor force, the 16 to 19 years age range has the highest percentage of unemployed individuals, with 25.9% or 116 of them being unemployed.
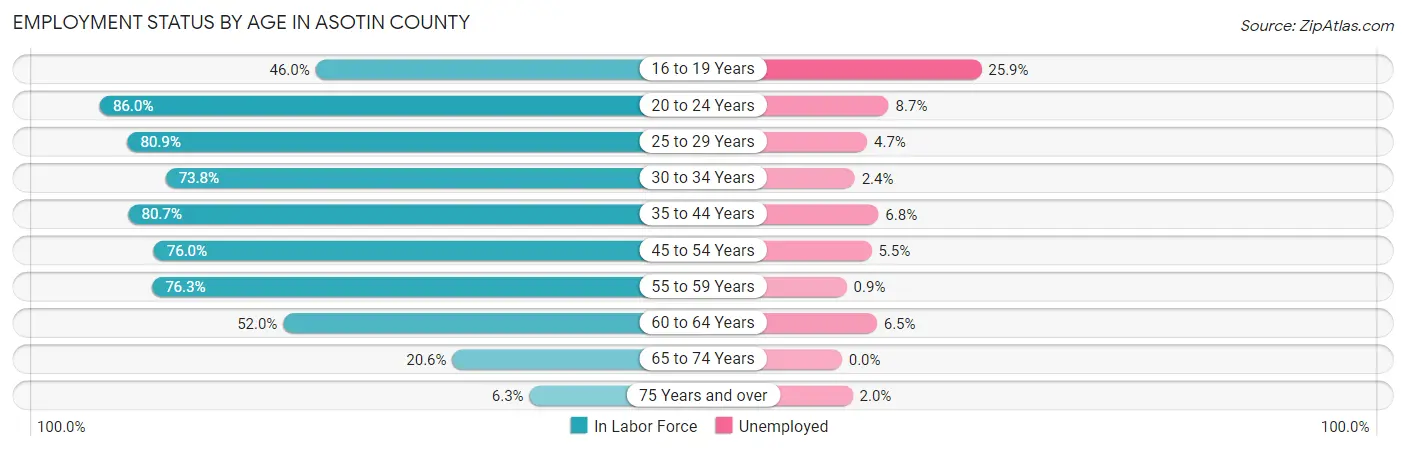
| Age Bracket | In Labor Force | Unemployed |
| 16 to 19 Years | 448 (46.0%) | 116 (25.9%) |
| 20 to 24 Years | 1,097 (86.0%) | 95 (8.7%) |
| 25 to 29 Years | 903 (80.9%) | 42 (4.7%) |
| 30 to 34 Years | 858 (73.8%) | 21 (2.4%) |
| 35 to 44 Years | 2,089 (80.7%) | 142 (6.8%) |
| 45 to 54 Years | 1,997 (76.0%) | 110 (5.5%) |
| 55 to 59 Years | 1,109 (76.3%) | 10 (0.9%) |
| 60 to 64 Years | 979 (52.0%) | 64 (6.5%) |
| 65 to 74 Years | 607 (20.6%) | 0 (0.0%) |
| 75 Years and over | 150 (6.3%) | 3 (2.0%) |
| Total | 10,239 (55.6%) | 604 (5.9%) |
Employment Status by Educational Attainment in Asotin County
According to labor force statistics for Asotin County, 73.3% of individuals (7,940) out of the total population between 25 and 64 years of age (10,832) are in the labor force, with 4.9% or 389 of them being unemployed. The group with the highest labor force participation rate are those with the educational attainment of bachelor's degree or higher, with 84.8% or 2,002 individuals in the labor force. Within the labor force, individuals with college / associate degree education have the highest percentage of unemployment, with 6.4% or 225 of them being unemployed.
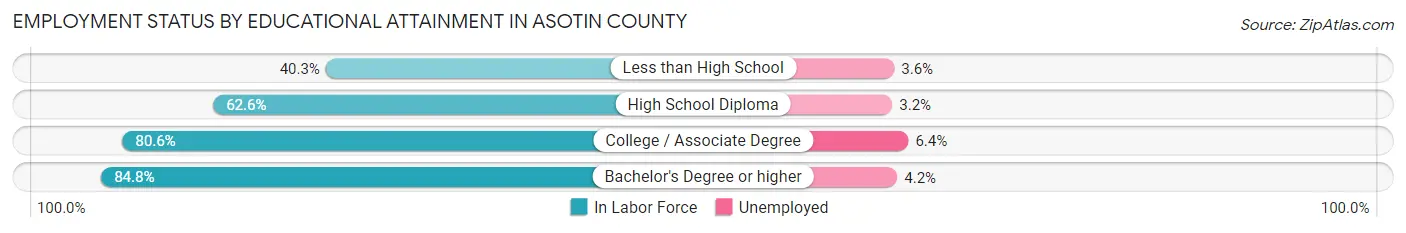
| Educational Attainment | In Labor Force | Unemployed |
| Less than High School | 281 (40.3%) | 25 (3.6%) |
| High School Diploma | 2,136 (62.6%) | 109 (3.2%) |
| College / Associate Degree | 3,515 (80.6%) | 279 (6.4%) |
| Bachelor's Degree or higher | 2,002 (84.8%) | 99 (4.2%) |
| Total | 7,940 (73.3%) | 531 (4.9%) |
Employment Occupations by Sex in Asotin County
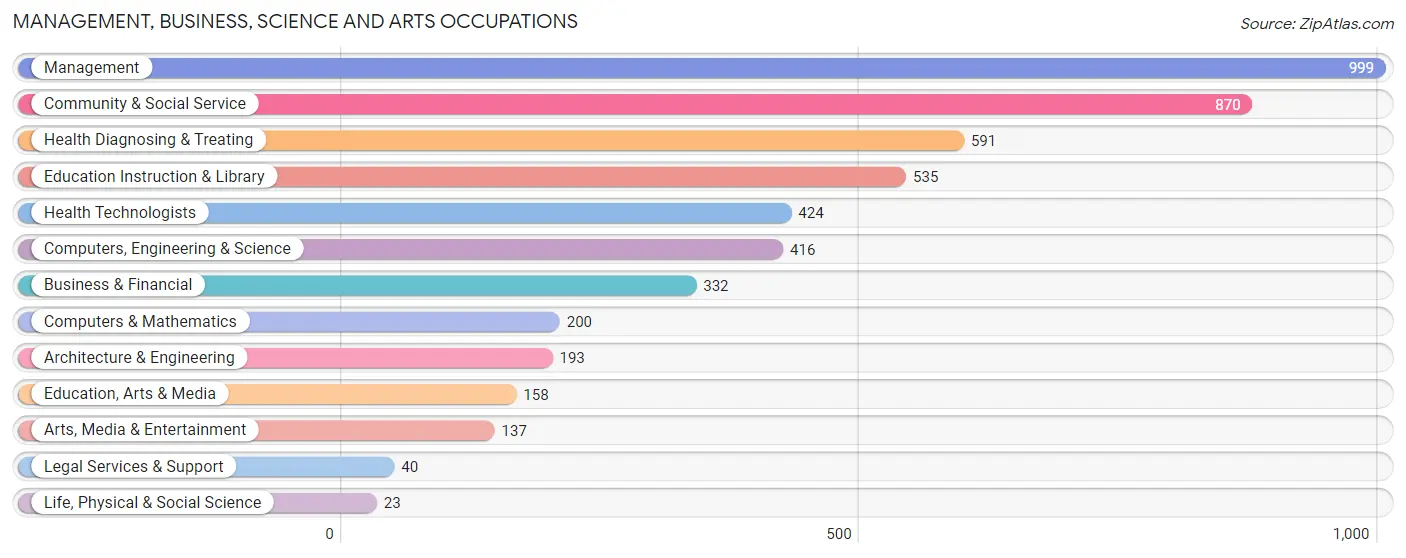
Management, Business, Science and Arts Occupations
The most common Management, Business, Science and Arts occupations in Asotin County are Management (999 | 10.4%), Community & Social Service (870 | 9.0%), Health Diagnosing & Treating (591 | 6.1%), Education Instruction & Library (535 | 5.6%), and Health Technologists (424 | 4.4%).
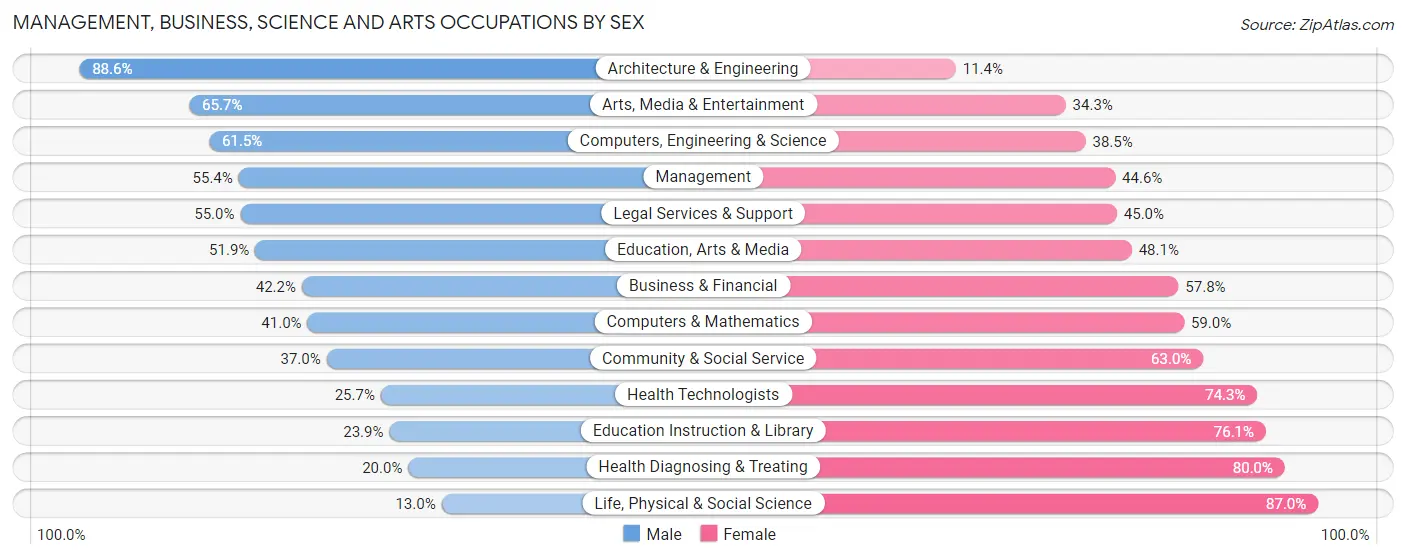
Management, Business, Science and Arts Occupations by Sex
Within the Management, Business, Science and Arts occupations in Asotin County, the most male-oriented occupations are Architecture & Engineering (88.6%), Arts, Media & Entertainment (65.7%), and Computers, Engineering & Science (61.5%), while the most female-oriented occupations are Life, Physical & Social Science (87.0%), Health Diagnosing & Treating (80.0%), and Education Instruction & Library (76.1%).
| Occupation | Male | Female |
| Management | 553 (55.4%) | 446 (44.6%) |
| Business & Financial | 140 (42.2%) | 192 (57.8%) |
| Computers, Engineering & Science | 256 (61.5%) | 160 (38.5%) |
| Computers & Mathematics | 82 (41.0%) | 118 (59.0%) |
| Architecture & Engineering | 171 (88.6%) | 22 (11.4%) |
| Life, Physical & Social Science | 3 (13.0%) | 20 (87.0%) |
| Community & Social Service | 322 (37.0%) | 548 (63.0%) |
| Education, Arts & Media | 82 (51.9%) | 76 (48.1%) |
| Legal Services & Support | 22 (55.0%) | 18 (45.0%) |
| Education Instruction & Library | 128 (23.9%) | 407 (76.1%) |
| Arts, Media & Entertainment | 90 (65.7%) | 47 (34.3%) |
| Health Diagnosing & Treating | 118 (20.0%) | 473 (80.0%) |
| Health Technologists | 109 (25.7%) | 315 (74.3%) |
| Total (Category) | 1,389 (43.3%) | 1,819 (56.7%) |
| Total (Overall) | 4,768 (49.6%) | 4,847 (50.4%) |
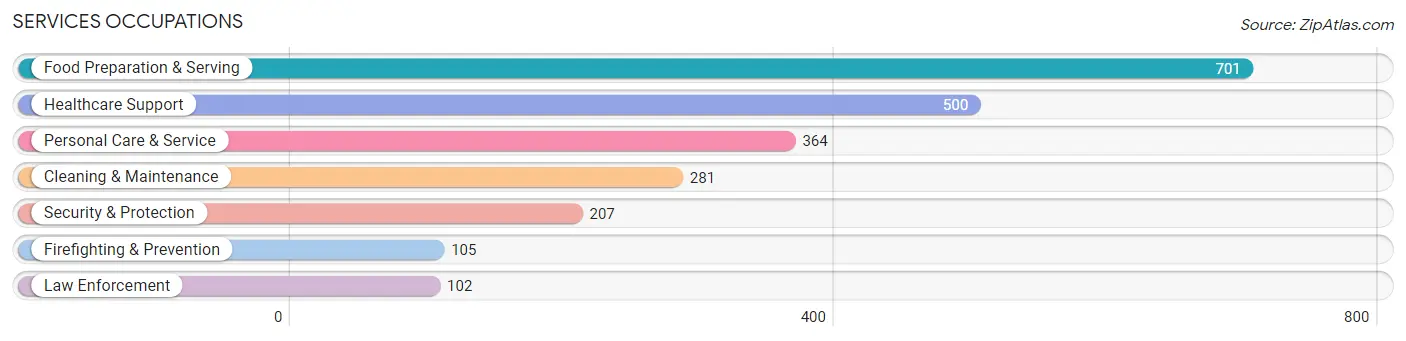
Services Occupations
The most common Services occupations in Asotin County are Food Preparation & Serving (701 | 7.3%), Healthcare Support (500 | 5.2%), Personal Care & Service (364 | 3.8%), Cleaning & Maintenance (281 | 2.9%), and Security & Protection (207 | 2.1%).
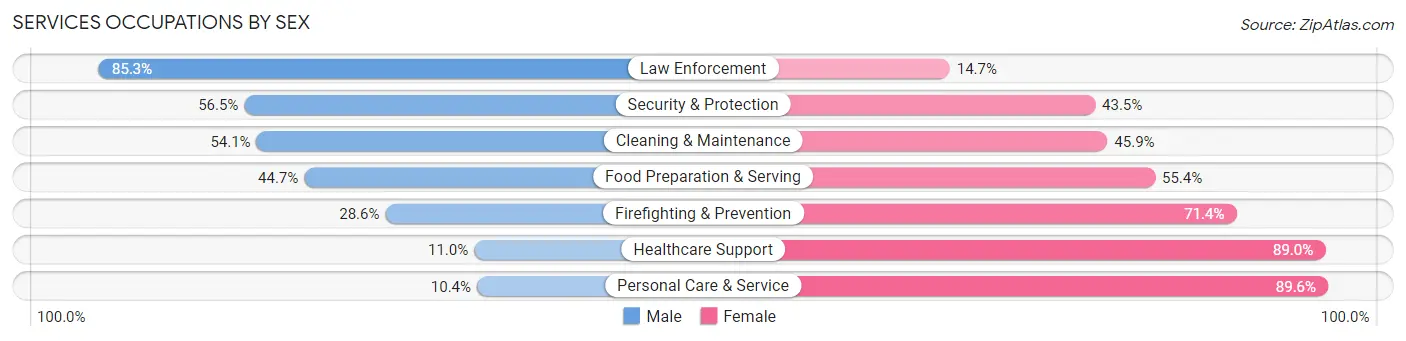
Services Occupations by Sex
Within the Services occupations in Asotin County, the most male-oriented occupations are Law Enforcement (85.3%), Security & Protection (56.5%), and Cleaning & Maintenance (54.1%), while the most female-oriented occupations are Personal Care & Service (89.6%), Healthcare Support (89.0%), and Firefighting & Prevention (71.4%).
| Occupation | Male | Female |
| Healthcare Support | 55 (11.0%) | 445 (89.0%) |
| Security & Protection | 117 (56.5%) | 90 (43.5%) |
| Firefighting & Prevention | 30 (28.6%) | 75 (71.4%) |
| Law Enforcement | 87 (85.3%) | 15 (14.7%) |
| Food Preparation & Serving | 313 (44.7%) | 388 (55.3%) |
| Cleaning & Maintenance | 152 (54.1%) | 129 (45.9%) |
| Personal Care & Service | 38 (10.4%) | 326 (89.6%) |
| Total (Category) | 675 (32.9%) | 1,378 (67.1%) |
| Total (Overall) | 4,768 (49.6%) | 4,847 (50.4%) |
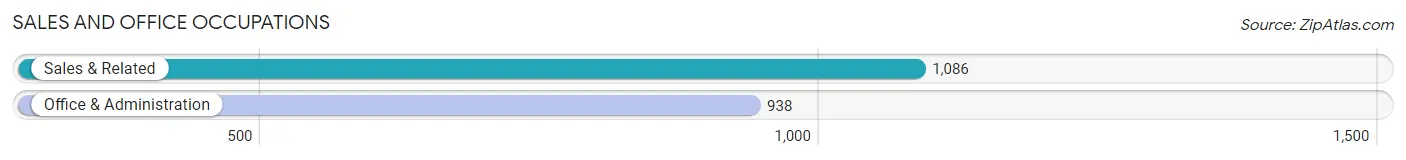
Sales and Office Occupations
The most common Sales and Office occupations in Asotin County are Sales & Related (1,086 | 11.3%), and Office & Administration (938 | 9.8%).
Sales and Office Occupations by Sex
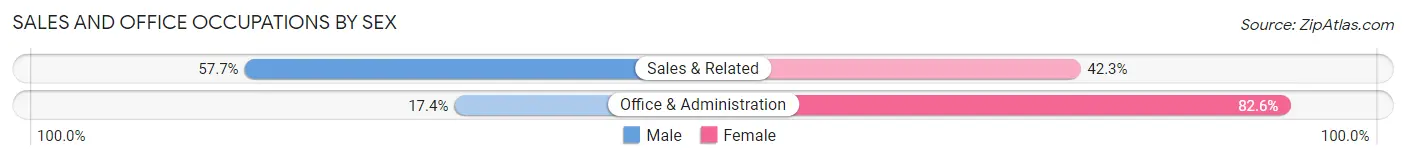
| Occupation | Male | Female |
| Sales & Related | 627 (57.7%) | 459 (42.3%) |
| Office & Administration | 163 (17.4%) | 775 (82.6%) |
| Total (Category) | 790 (39.0%) | 1,234 (61.0%) |
| Total (Overall) | 4,768 (49.6%) | 4,847 (50.4%) |
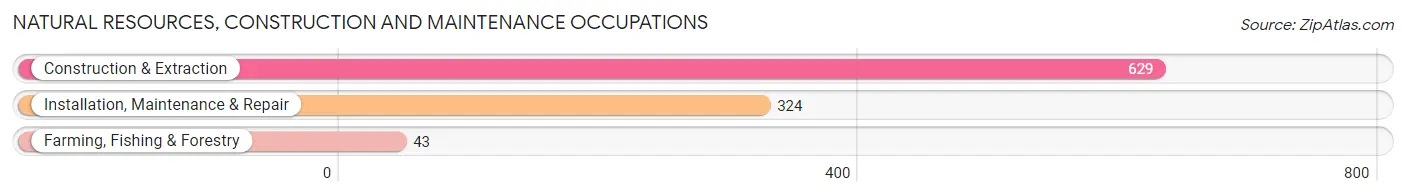
Natural Resources, Construction and Maintenance Occupations
The most common Natural Resources, Construction and Maintenance occupations in Asotin County are Construction & Extraction (629 | 6.5%), Installation, Maintenance & Repair (324 | 3.4%), and Farming, Fishing & Forestry (43 | 0.4%).
Natural Resources, Construction and Maintenance Occupations by Sex
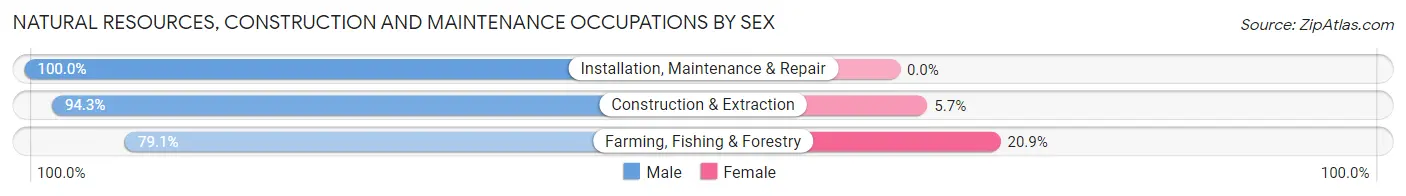
| Occupation | Male | Female |
| Farming, Fishing & Forestry | 34 (79.1%) | 9 (20.9%) |
| Construction & Extraction | 593 (94.3%) | 36 (5.7%) |
| Installation, Maintenance & Repair | 324 (100.0%) | 0 (0.0%) |
| Total (Category) | 951 (95.5%) | 45 (4.5%) |
| Total (Overall) | 4,768 (49.6%) | 4,847 (50.4%) |
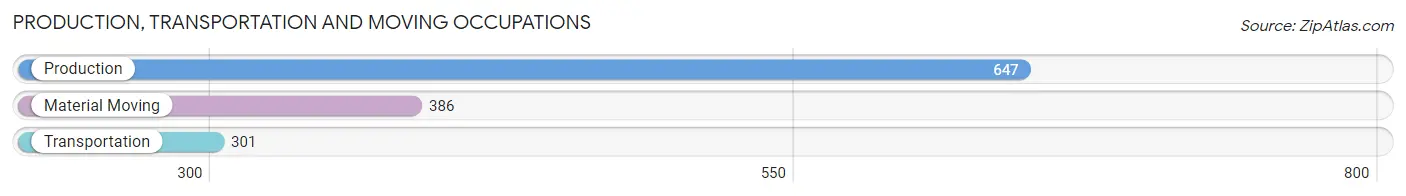
Production, Transportation and Moving Occupations
The most common Production, Transportation and Moving occupations in Asotin County are Production (647 | 6.7%), Material Moving (386 | 4.0%), and Transportation (301 | 3.1%).
Production, Transportation and Moving Occupations by Sex
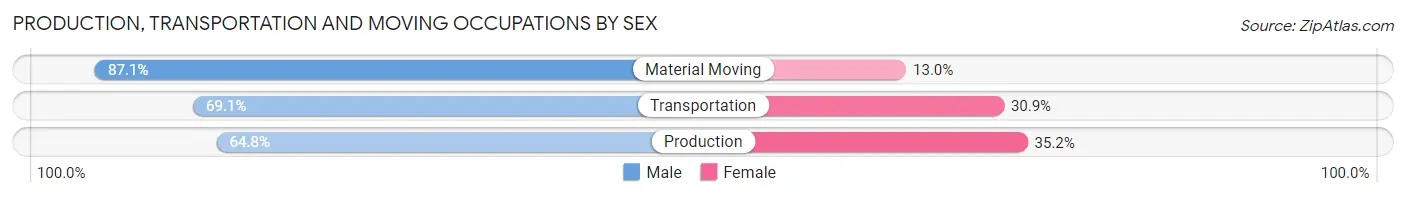
| Occupation | Male | Female |
| Production | 419 (64.8%) | 228 (35.2%) |
| Transportation | 208 (69.1%) | 93 (30.9%) |
| Material Moving | 336 (87.1%) | 50 (13.0%) |
| Total (Category) | 963 (72.2%) | 371 (27.8%) |
| Total (Overall) | 4,768 (49.6%) | 4,847 (50.4%) |
Employment Industries by Sex in Asotin County
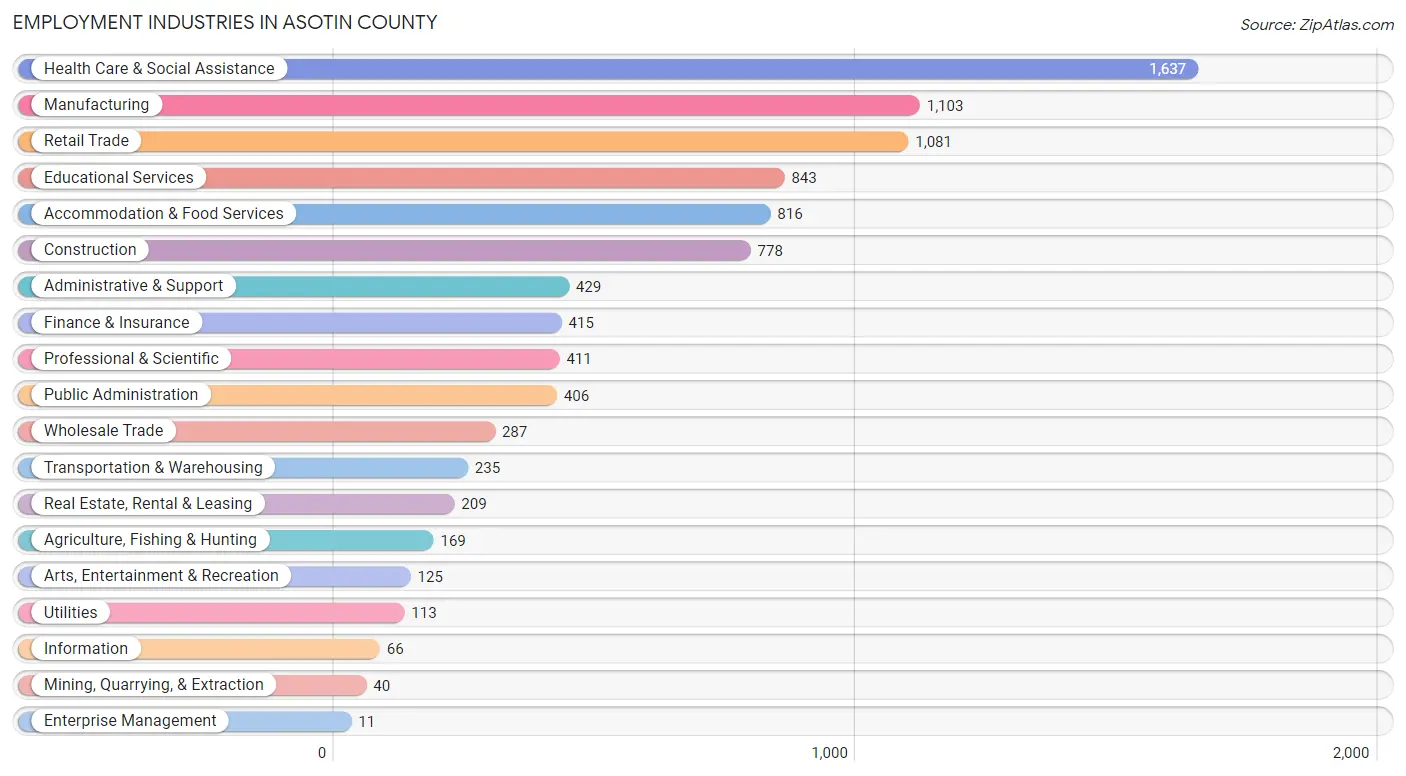
Employment Industries in Asotin County
The major employment industries in Asotin County include Health Care & Social Assistance (1,637 | 17.0%), Manufacturing (1,103 | 11.5%), Retail Trade (1,081 | 11.2%), Educational Services (843 | 8.8%), and Accommodation & Food Services (816 | 8.5%).
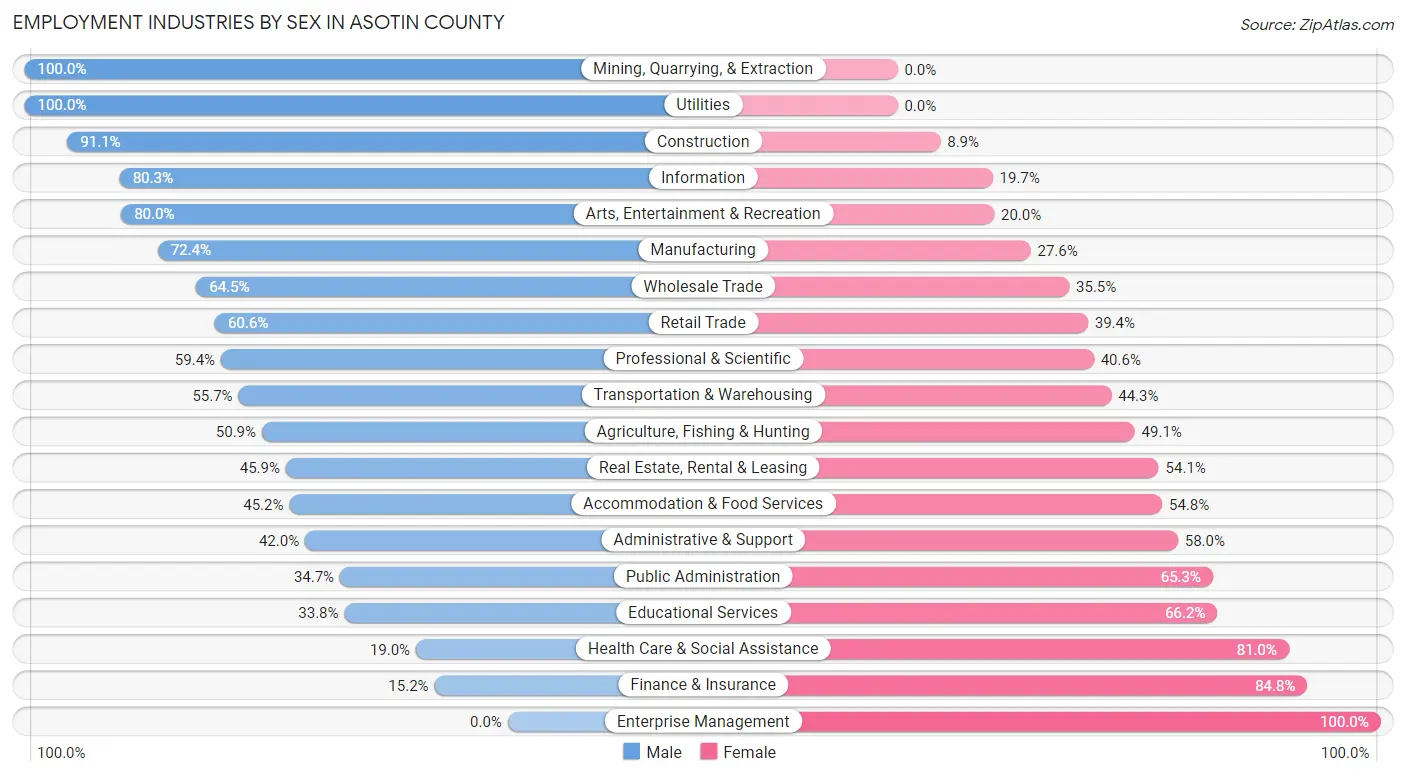
Employment Industries by Sex in Asotin County
The Asotin County industries that see more men than women are Mining, Quarrying, & Extraction (100.0%), Utilities (100.0%), and Construction (91.1%), whereas the industries that tend to have a higher number of women are Enterprise Management (100.0%), Finance & Insurance (84.8%), and Health Care & Social Assistance (81.0%).
| Industry | Male | Female |
| Agriculture, Fishing & Hunting | 86 (50.9%) | 83 (49.1%) |
| Mining, Quarrying, & Extraction | 40 (100.0%) | 0 (0.0%) |
| Construction | 709 (91.1%) | 69 (8.9%) |
| Manufacturing | 799 (72.4%) | 304 (27.6%) |
| Wholesale Trade | 185 (64.5%) | 102 (35.5%) |
| Retail Trade | 655 (60.6%) | 426 (39.4%) |
| Transportation & Warehousing | 131 (55.7%) | 104 (44.3%) |
| Utilities | 113 (100.0%) | 0 (0.0%) |
| Information | 53 (80.3%) | 13 (19.7%) |
| Finance & Insurance | 63 (15.2%) | 352 (84.8%) |
| Real Estate, Rental & Leasing | 96 (45.9%) | 113 (54.1%) |
| Professional & Scientific | 244 (59.4%) | 167 (40.6%) |
| Enterprise Management | 0 (0.0%) | 11 (100.0%) |
| Administrative & Support | 180 (42.0%) | 249 (58.0%) |
| Educational Services | 285 (33.8%) | 558 (66.2%) |
| Health Care & Social Assistance | 311 (19.0%) | 1,326 (81.0%) |
| Arts, Entertainment & Recreation | 100 (80.0%) | 25 (20.0%) |
| Accommodation & Food Services | 369 (45.2%) | 447 (54.8%) |
| Public Administration | 141 (34.7%) | 265 (65.3%) |
| Total | 4,768 (49.6%) | 4,847 (50.4%) |
Education in Asotin County
School Enrollment in Asotin County
The most common levels of schooling among the 4,221 students in Asotin County are high school (1,046 | 24.8%), middle school (972 | 23.0%), and elementary school (965 | 22.9%).
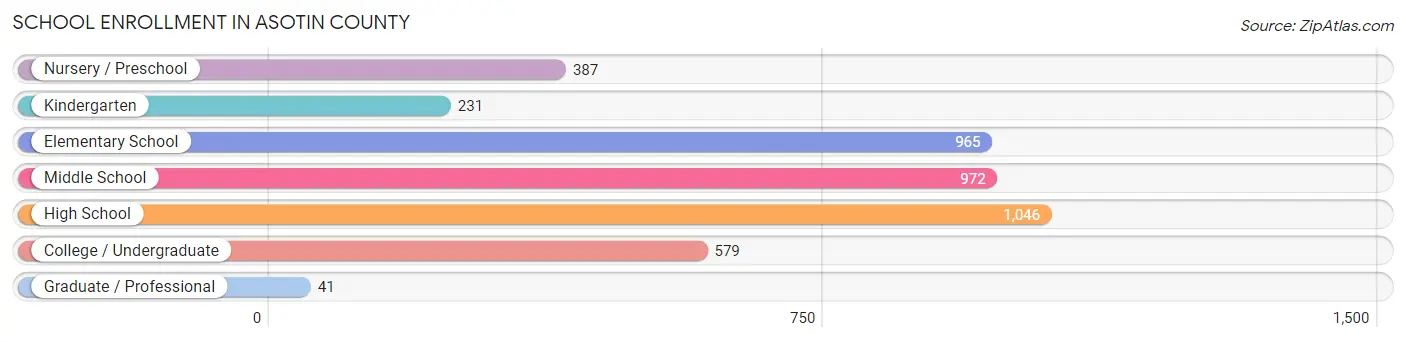
| School Level | # Students | % Students |
| Nursery / Preschool | 387 | 9.2% |
| Kindergarten | 231 | 5.5% |
| Elementary School | 965 | 22.9% |
| Middle School | 972 | 23.0% |
| High School | 1,046 | 24.8% |
| College / Undergraduate | 579 | 13.7% |
| Graduate / Professional | 41 | 1.0% |
| Total | 4,221 | 100.0% |
School Enrollment by Age by Funding Source in Asotin County
Out of a total of 4,221 students who are enrolled in schools in Asotin County, 498 (11.8%) attend a private institution, while the remaining 3,723 (88.2%) are enrolled in public schools. The age group of 3 to 4 year olds has the highest likelihood of being enrolled in private schools, with 100 (33.9% in the age bracket) enrolled. Conversely, the age group of 18 to 19 year olds has the lowest likelihood of being enrolled in a private school, with 187 (97.9% in the age bracket) attending a public institution.
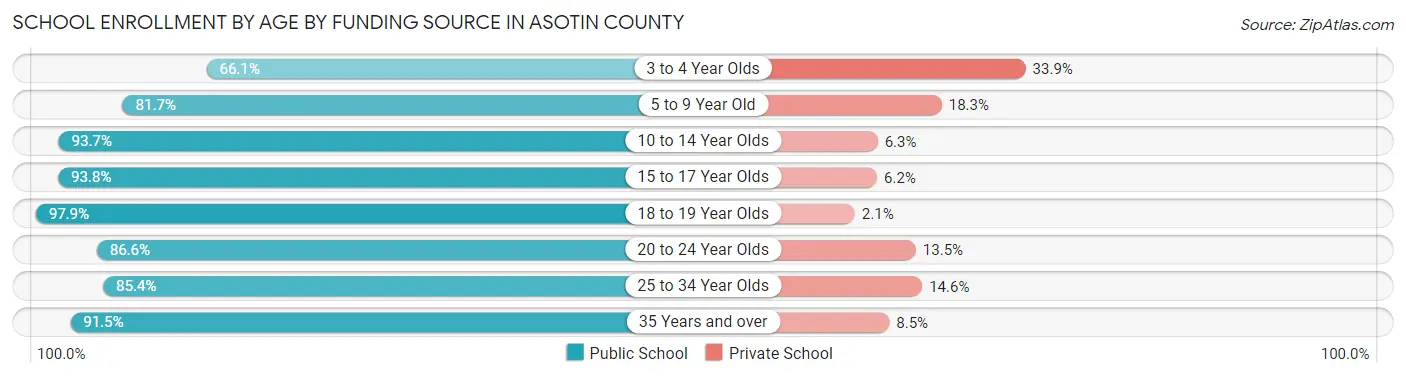
| Age Bracket | Public School | Private School |
| 3 to 4 Year Olds | 195 (66.1%) | 100 (33.9%) |
| 5 to 9 Year Old | 832 (81.7%) | 186 (18.3%) |
| 10 to 14 Year Olds | 1,270 (93.7%) | 86 (6.3%) |
| 15 to 17 Year Olds | 723 (93.8%) | 48 (6.2%) |
| 18 to 19 Year Olds | 187 (97.9%) | 4 (2.1%) |
| 20 to 24 Year Olds | 206 (86.6%) | 32 (13.5%) |
| 25 to 34 Year Olds | 140 (85.4%) | 24 (14.6%) |
| 35 Years and over | 172 (91.5%) | 16 (8.5%) |
| Total | 3,723 (88.2%) | 498 (11.8%) |
Educational Attainment by Field of Study in Asotin County
Education (873 | 21.5%), business (816 | 20.1%), science & technology (416 | 10.2%), arts & humanities (387 | 9.5%), and engineering (358 | 8.8%) are the most common fields of study among 4,068 individuals in Asotin County who have obtained a bachelor's degree or higher.
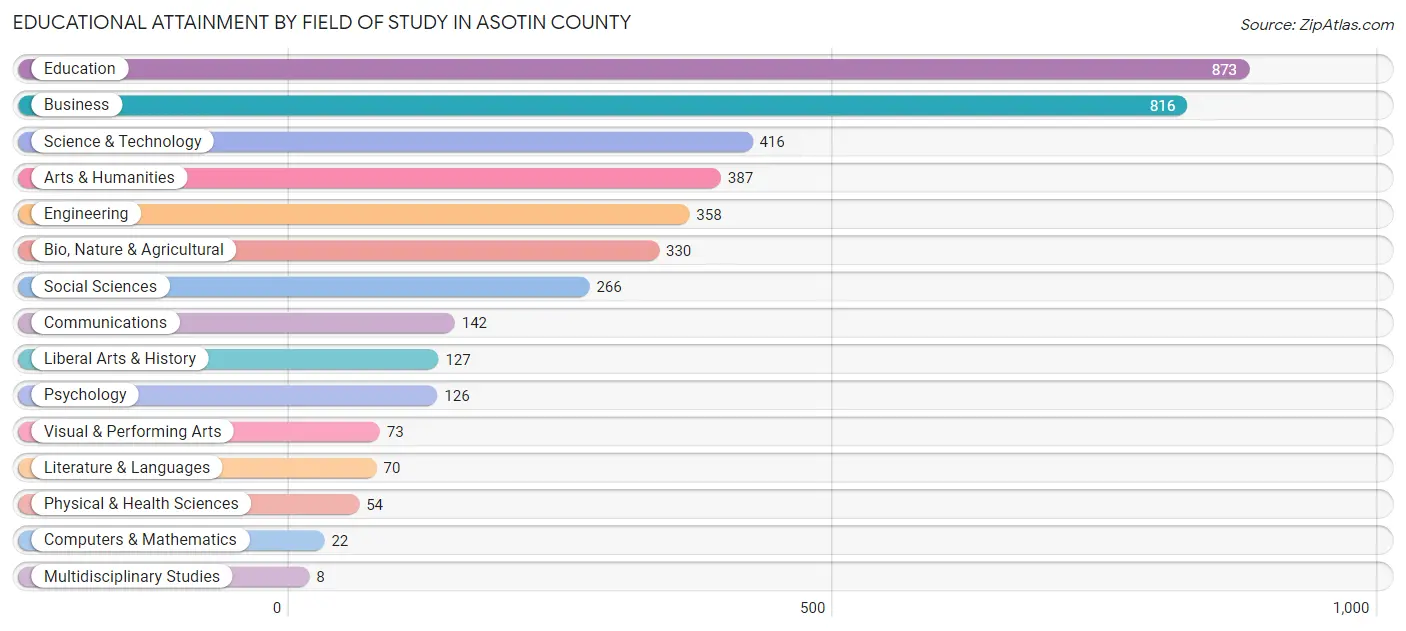
| Field of Study | # Graduates | % Graduates |
| Computers & Mathematics | 22 | 0.5% |
| Bio, Nature & Agricultural | 330 | 8.1% |
| Physical & Health Sciences | 54 | 1.3% |
| Psychology | 126 | 3.1% |
| Social Sciences | 266 | 6.5% |
| Engineering | 358 | 8.8% |
| Multidisciplinary Studies | 8 | 0.2% |
| Science & Technology | 416 | 10.2% |
| Business | 816 | 20.1% |
| Education | 873 | 21.5% |
| Literature & Languages | 70 | 1.7% |
| Liberal Arts & History | 127 | 3.1% |
| Visual & Performing Arts | 73 | 1.8% |
| Communications | 142 | 3.5% |
| Arts & Humanities | 387 | 9.5% |
| Total | 4,068 | 100.0% |
Transportation & Commute in Asotin County
Vehicle Availability by Sex in Asotin County
The most prevalent vehicle ownership categories in Asotin County are males with 2 vehicles (1,532, accounting for 32.8%) and females with 2 vehicles (1,519, making up 33.2%).
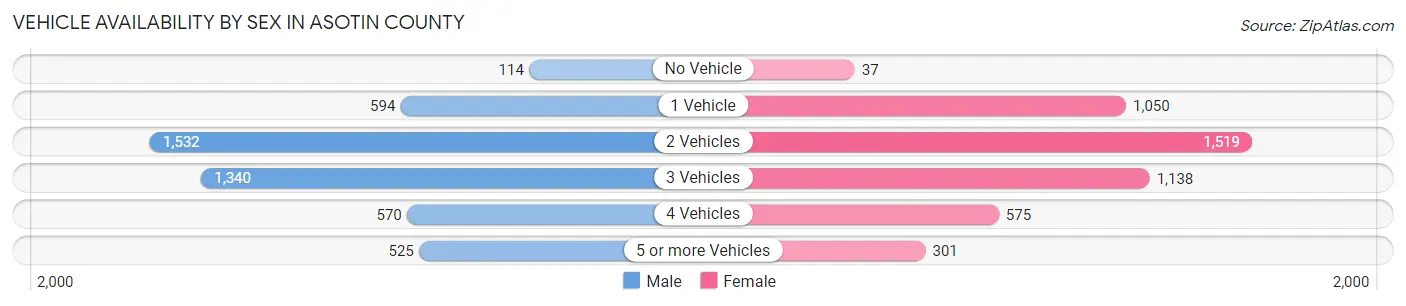
| Vehicles Available | Male | Female |
| No Vehicle | 114 (2.4%) | 37 (0.8%) |
| 1 Vehicle | 594 (12.7%) | 1,050 (22.7%) |
| 2 Vehicles | 1,532 (32.8%) | 1,519 (32.9%) |
| 3 Vehicles | 1,340 (28.7%) | 1,138 (24.6%) |
| 4 Vehicles | 570 (12.2%) | 575 (12.4%) |
| 5 or more Vehicles | 525 (11.2%) | 301 (6.5%) |
| Total | 4,675 (100.0%) | 4,620 (100.0%) |
Commute Time in Asotin County
The most frequently occuring commute durations in Asotin County are 15 to 19 minutes (2,234 commuters, 26.8%), 10 to 14 minutes (2,090 commuters, 25.1%), and 5 to 9 minutes (1,864 commuters, 22.4%).
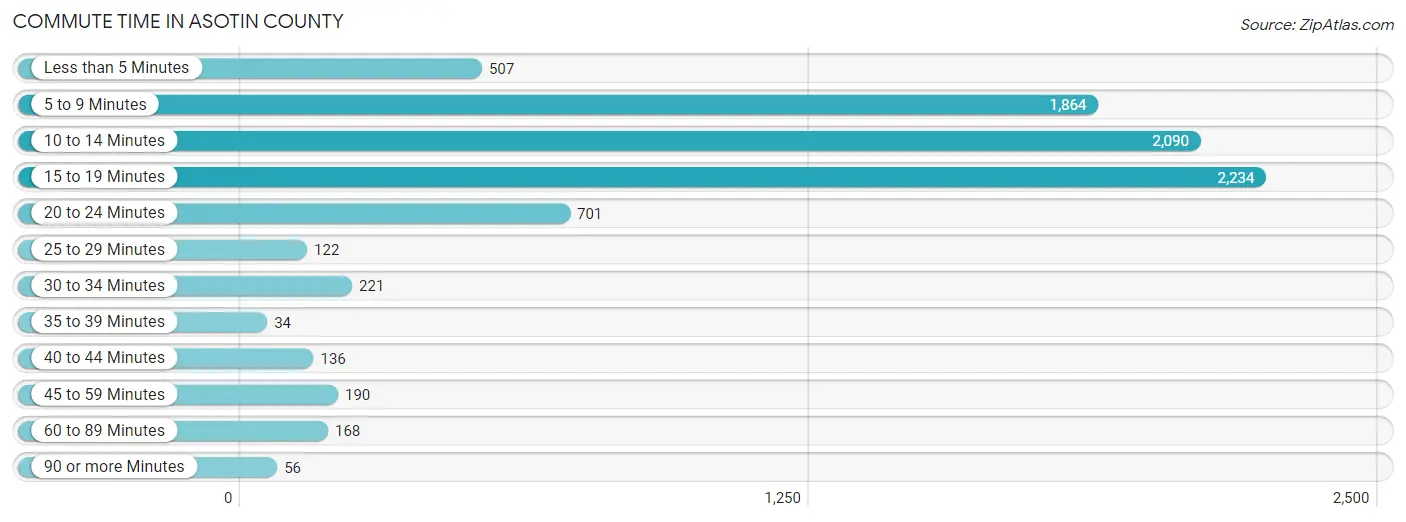
| Commute Time | # Commuters | % Commuters |
| Less than 5 Minutes | 507 | 6.1% |
| 5 to 9 Minutes | 1,864 | 22.4% |
| 10 to 14 Minutes | 2,090 | 25.1% |
| 15 to 19 Minutes | 2,234 | 26.8% |
| 20 to 24 Minutes | 701 | 8.4% |
| 25 to 29 Minutes | 122 | 1.5% |
| 30 to 34 Minutes | 221 | 2.7% |
| 35 to 39 Minutes | 34 | 0.4% |
| 40 to 44 Minutes | 136 | 1.6% |
| 45 to 59 Minutes | 190 | 2.3% |
| 60 to 89 Minutes | 168 | 2.0% |
| 90 or more Minutes | 56 | 0.7% |
Commute Time by Sex in Asotin County
The most common commute times in Asotin County are 15 to 19 minutes (1,307 commuters, 30.1%) for males and 10 to 14 minutes (1,164 commuters, 29.3%) for females.
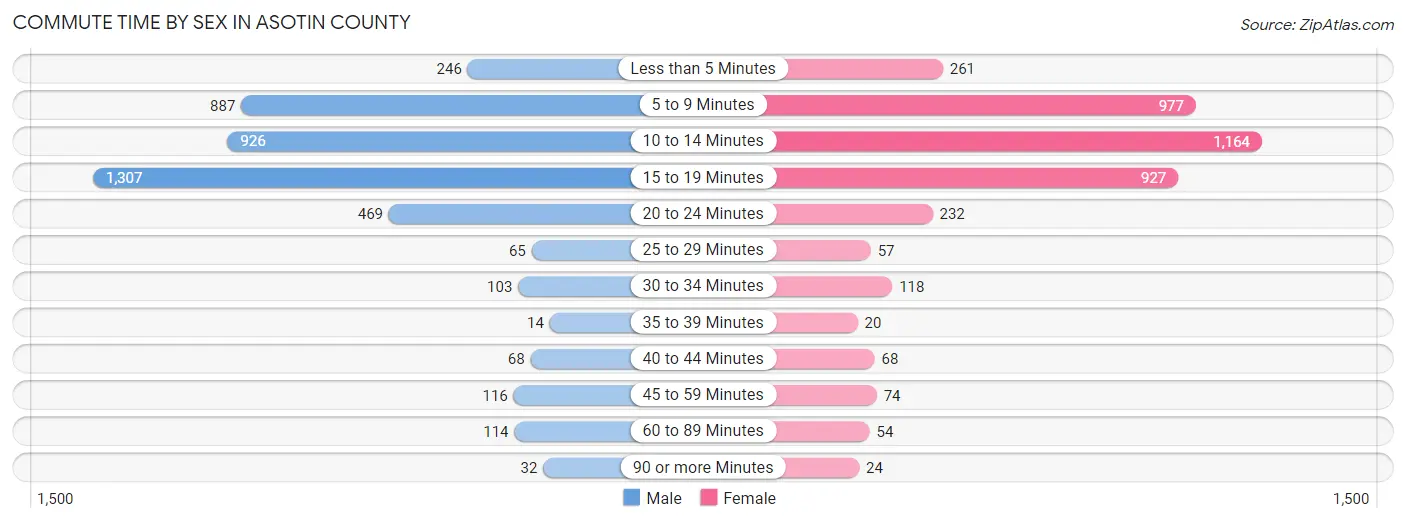
| Commute Time | Male | Female |
| Less than 5 Minutes | 246 (5.7%) | 261 (6.6%) |
| 5 to 9 Minutes | 887 (20.4%) | 977 (24.6%) |
| 10 to 14 Minutes | 926 (21.3%) | 1,164 (29.3%) |
| 15 to 19 Minutes | 1,307 (30.1%) | 927 (23.3%) |
| 20 to 24 Minutes | 469 (10.8%) | 232 (5.8%) |
| 25 to 29 Minutes | 65 (1.5%) | 57 (1.4%) |
| 30 to 34 Minutes | 103 (2.4%) | 118 (3.0%) |
| 35 to 39 Minutes | 14 (0.3%) | 20 (0.5%) |
| 40 to 44 Minutes | 68 (1.6%) | 68 (1.7%) |
| 45 to 59 Minutes | 116 (2.7%) | 74 (1.9%) |
| 60 to 89 Minutes | 114 (2.6%) | 54 (1.4%) |
| 90 or more Minutes | 32 (0.7%) | 24 (0.6%) |
Time of Departure to Work by Sex in Asotin County
The most frequent times of departure to work in Asotin County are 7:00 AM to 7:29 AM (610, 14.0%) for males and 7:30 AM to 7:59 AM (641, 16.1%) for females.
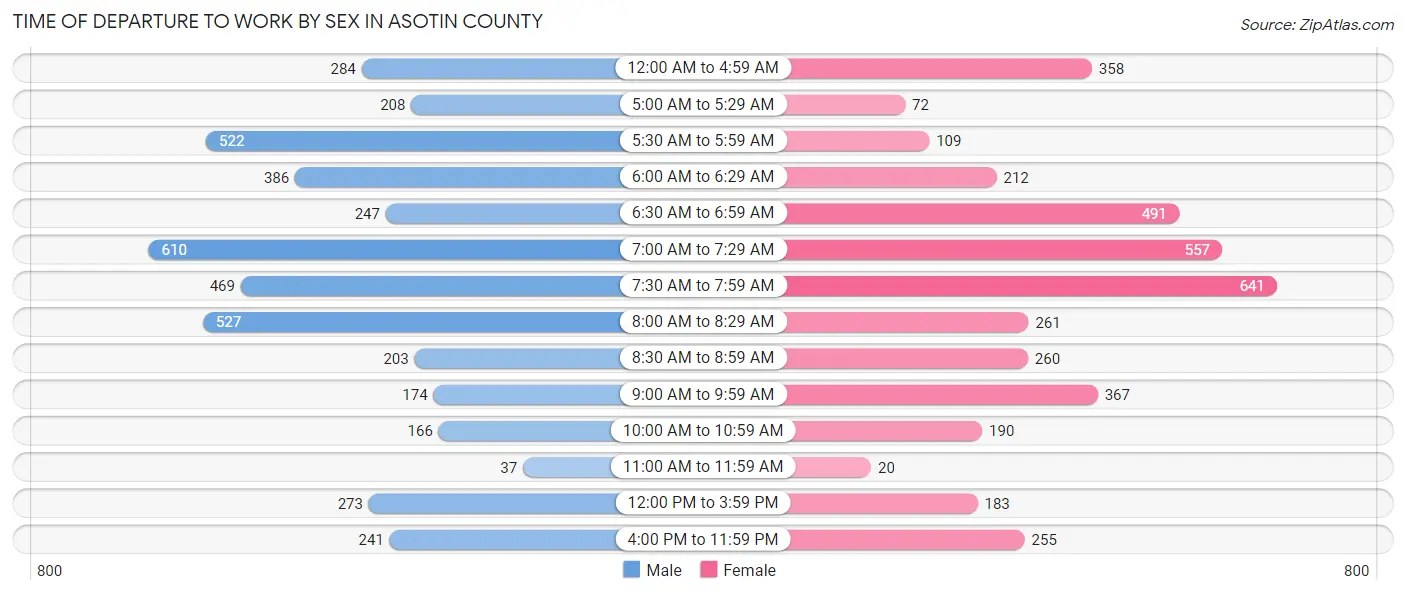
| Time of Departure | Male | Female |
| 12:00 AM to 4:59 AM | 284 (6.5%) | 358 (9.0%) |
| 5:00 AM to 5:29 AM | 208 (4.8%) | 72 (1.8%) |
| 5:30 AM to 5:59 AM | 522 (12.0%) | 109 (2.7%) |
| 6:00 AM to 6:29 AM | 386 (8.9%) | 212 (5.3%) |
| 6:30 AM to 6:59 AM | 247 (5.7%) | 491 (12.3%) |
| 7:00 AM to 7:29 AM | 610 (14.0%) | 557 (14.0%) |
| 7:30 AM to 7:59 AM | 469 (10.8%) | 641 (16.1%) |
| 8:00 AM to 8:29 AM | 527 (12.1%) | 261 (6.6%) |
| 8:30 AM to 8:59 AM | 203 (4.7%) | 260 (6.5%) |
| 9:00 AM to 9:59 AM | 174 (4.0%) | 367 (9.2%) |
| 10:00 AM to 10:59 AM | 166 (3.8%) | 190 (4.8%) |
| 11:00 AM to 11:59 AM | 37 (0.9%) | 20 (0.5%) |
| 12:00 PM to 3:59 PM | 273 (6.3%) | 183 (4.6%) |
| 4:00 PM to 11:59 PM | 241 (5.5%) | 255 (6.4%) |
| Total | 4,347 (100.0%) | 3,976 (100.0%) |
Housing Occupancy in Asotin County
Occupancy by Ownership in Asotin County
Of the total 9,499 dwellings in Asotin County, owner-occupied units account for 6,859 (72.2%), while renter-occupied units make up 2,640 (27.8%).
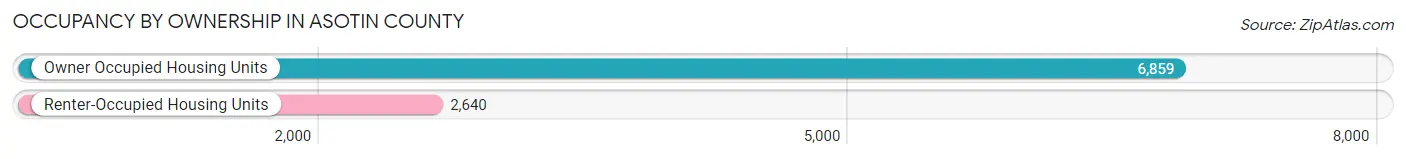
| Occupancy | # Housing Units | % Housing Units |
| Owner Occupied Housing Units | 6,859 | 72.2% |
| Renter-Occupied Housing Units | 2,640 | 27.8% |
| Total Occupied Housing Units | 9,499 | 100.0% |
Occupancy by Household Size in Asotin County
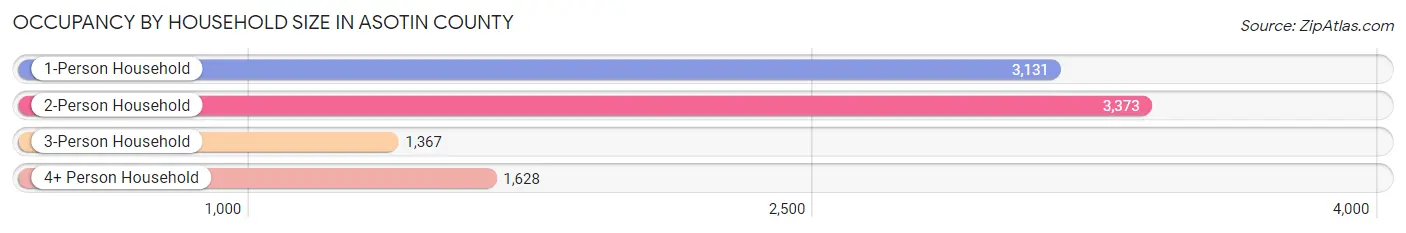
| Household Size | # Housing Units | % Housing Units |
| 1-Person Household | 3,131 | 33.0% |
| 2-Person Household | 3,373 | 35.5% |
| 3-Person Household | 1,367 | 14.4% |
| 4+ Person Household | 1,628 | 17.1% |
| Total Housing Units | 9,499 | 100.0% |
Occupancy by Ownership by Household Size in Asotin County
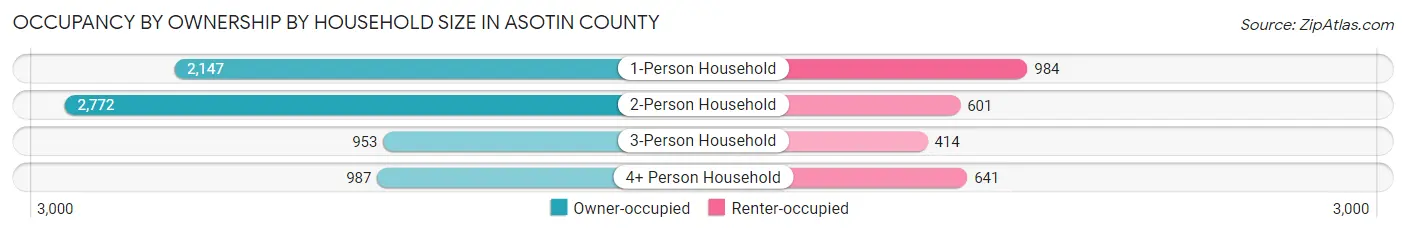
| Household Size | Owner-occupied | Renter-occupied |
| 1-Person Household | 2,147 (68.6%) | 984 (31.4%) |
| 2-Person Household | 2,772 (82.2%) | 601 (17.8%) |
| 3-Person Household | 953 (69.7%) | 414 (30.3%) |
| 4+ Person Household | 987 (60.6%) | 641 (39.4%) |
| Total Housing Units | 6,859 (72.2%) | 2,640 (27.8%) |
Occupancy by Educational Attainment in Asotin County
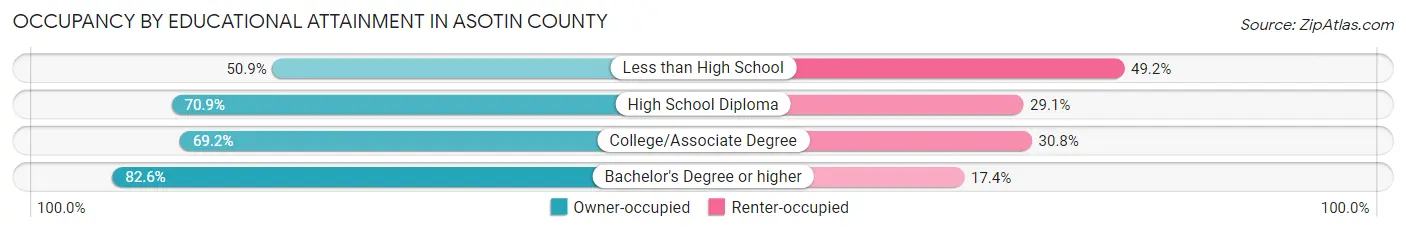
| Household Size | Owner-occupied | Renter-occupied |
| Less than High School | 240 (50.8%) | 232 (49.1%) |
| High School Diploma | 1,875 (70.9%) | 771 (29.1%) |
| College/Associate Degree | 2,711 (69.2%) | 1,208 (30.8%) |
| Bachelor's Degree or higher | 2,033 (82.6%) | 429 (17.4%) |
Occupancy by Age of Householder in Asotin County
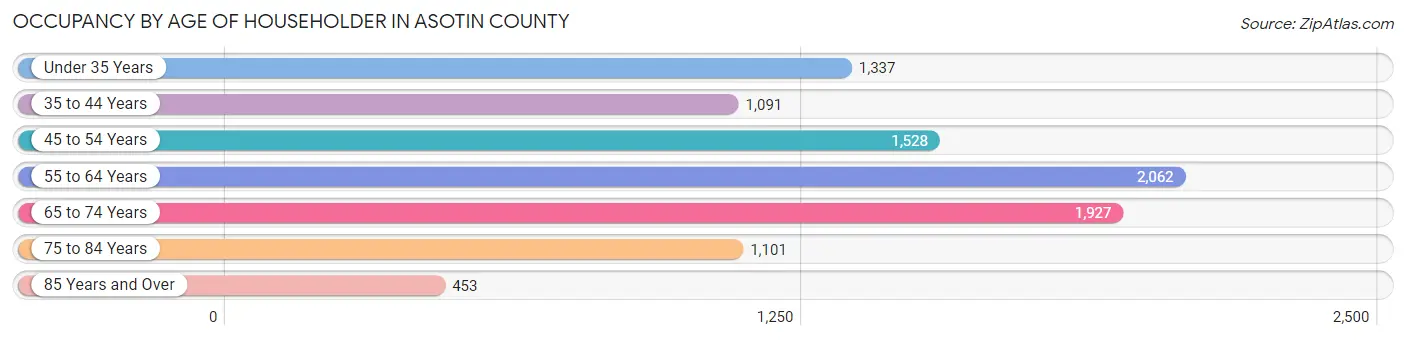
| Age Bracket | # Households | % Households |
| Under 35 Years | 1,337 | 14.1% |
| 35 to 44 Years | 1,091 | 11.5% |
| 45 to 54 Years | 1,528 | 16.1% |
| 55 to 64 Years | 2,062 | 21.7% |
| 65 to 74 Years | 1,927 | 20.3% |
| 75 to 84 Years | 1,101 | 11.6% |
| 85 Years and Over | 453 | 4.8% |
| Total | 9,499 | 100.0% |
Housing Finances in Asotin County
Median Income by Occupancy in Asotin County
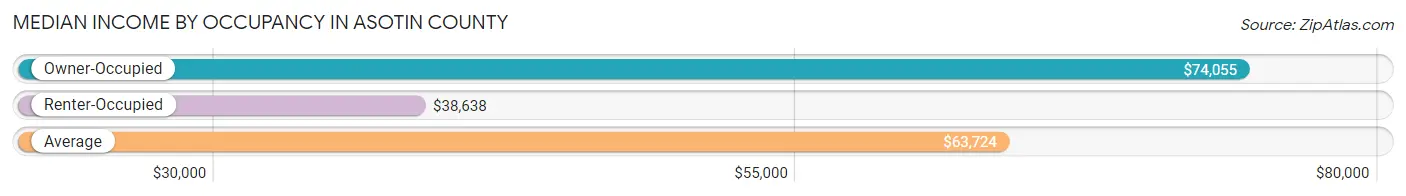
| Occupancy Type | # Households | Median Income |
| Owner-Occupied | 6,859 (72.2%) | $74,055 |
| Renter-Occupied | 2,640 (27.8%) | $38,638 |
| Average | 9,499 (100.0%) | $63,724 |
Occupancy by Householder Income Bracket in Asotin County
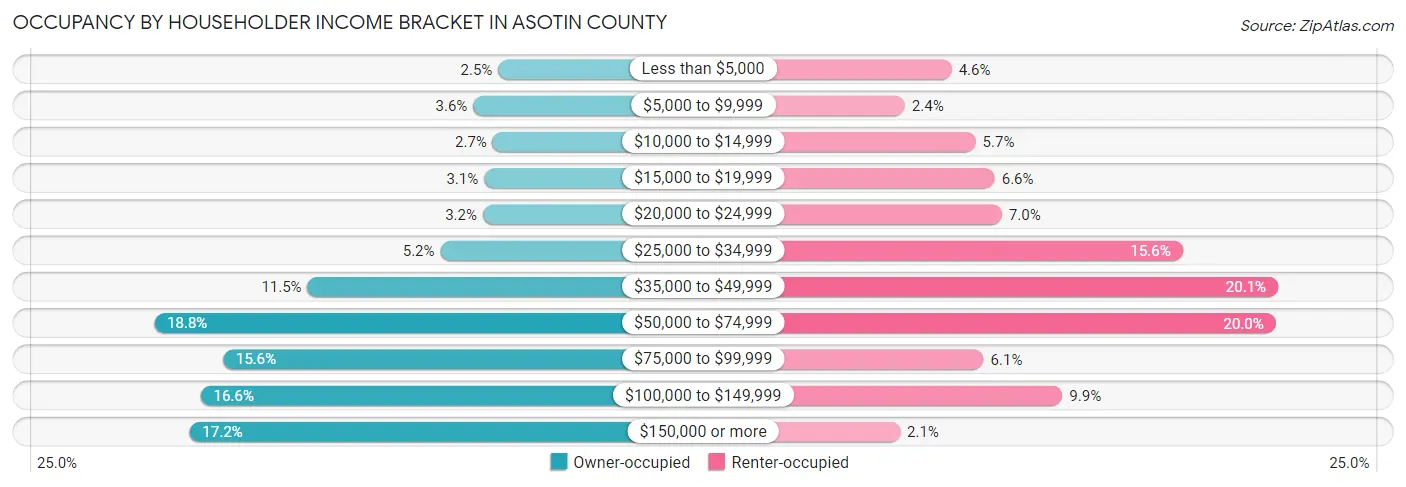
| Income Bracket | Owner-occupied | Renter-occupied |
| Less than $5,000 | 168 (2.5%) | 121 (4.6%) |
| $5,000 to $9,999 | 250 (3.6%) | 62 (2.4%) |
| $10,000 to $14,999 | 186 (2.7%) | 151 (5.7%) |
| $15,000 to $19,999 | 214 (3.1%) | 175 (6.6%) |
| $20,000 to $24,999 | 218 (3.2%) | 184 (7.0%) |
| $25,000 to $34,999 | 357 (5.2%) | 411 (15.6%) |
| $35,000 to $49,999 | 791 (11.5%) | 531 (20.1%) |
| $50,000 to $74,999 | 1,292 (18.8%) | 528 (20.0%) |
| $75,000 to $99,999 | 1,067 (15.6%) | 161 (6.1%) |
| $100,000 to $149,999 | 1,140 (16.6%) | 260 (9.9%) |
| $150,000 or more | 1,176 (17.2%) | 56 (2.1%) |
| Total | 6,859 (100.0%) | 2,640 (100.0%) |
Monthly Housing Cost Tiers in Asotin County
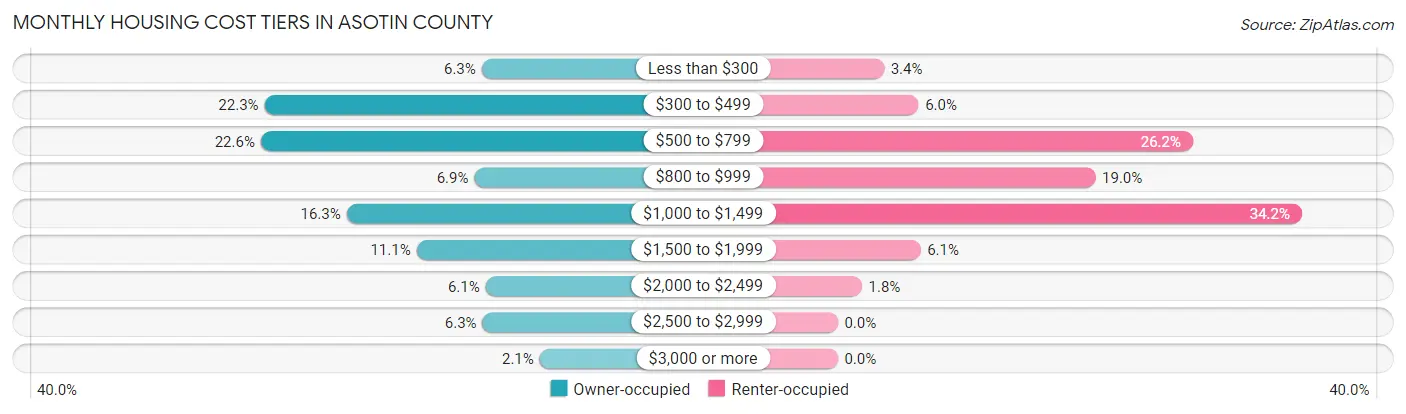
| Monthly Cost | Owner-occupied | Renter-occupied |
| Less than $300 | 435 (6.3%) | 90 (3.4%) |
| $300 to $499 | 1,532 (22.3%) | 157 (5.9%) |
| $500 to $799 | 1,551 (22.6%) | 691 (26.2%) |
| $800 to $999 | 472 (6.9%) | 501 (19.0%) |
| $1,000 to $1,499 | 1,117 (16.3%) | 903 (34.2%) |
| $1,500 to $1,999 | 764 (11.1%) | 161 (6.1%) |
| $2,000 to $2,499 | 415 (6.0%) | 47 (1.8%) |
| $2,500 to $2,999 | 431 (6.3%) | 0 (0.0%) |
| $3,000 or more | 142 (2.1%) | 0 (0.0%) |
| Total | 6,859 (100.0%) | 2,640 (100.0%) |
Physical Housing Characteristics in Asotin County
Housing Structures in Asotin County
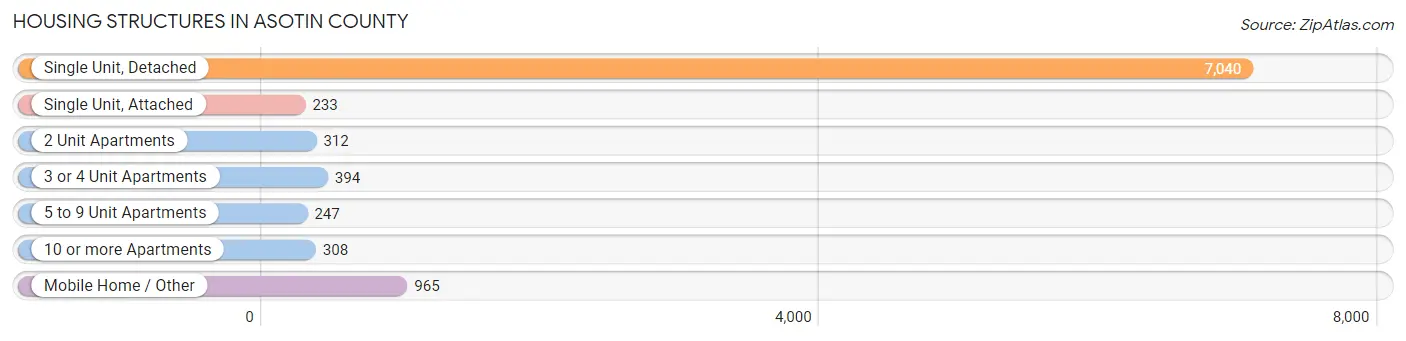
| Structure Type | # Housing Units | % Housing Units |
| Single Unit, Detached | 7,040 | 74.1% |
| Single Unit, Attached | 233 | 2.5% |
| 2 Unit Apartments | 312 | 3.3% |
| 3 or 4 Unit Apartments | 394 | 4.2% |
| 5 to 9 Unit Apartments | 247 | 2.6% |
| 10 or more Apartments | 308 | 3.2% |
| Mobile Home / Other | 965 | 10.2% |
| Total | 9,499 | 100.0% |
Housing Structures by Occupancy in Asotin County
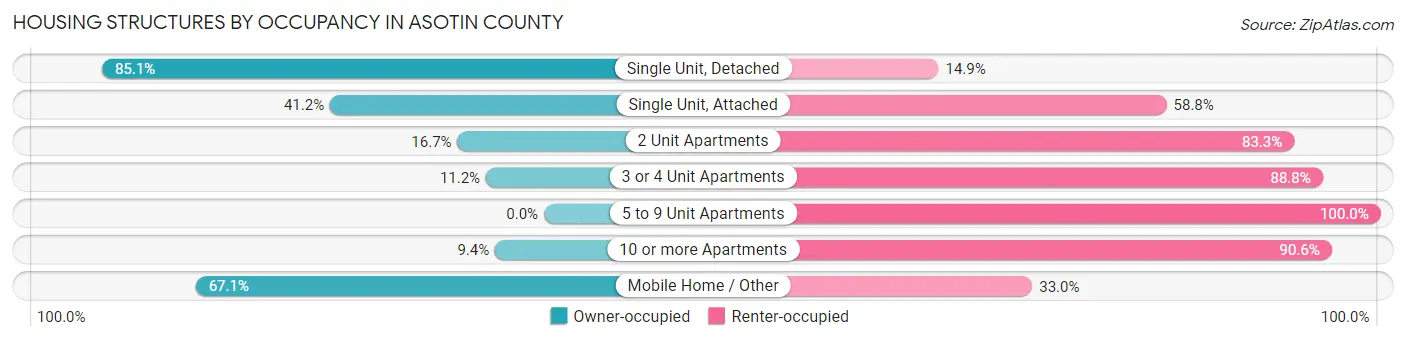
| Structure Type | Owner-occupied | Renter-occupied |
| Single Unit, Detached | 5,991 (85.1%) | 1,049 (14.9%) |
| Single Unit, Attached | 96 (41.2%) | 137 (58.8%) |
| 2 Unit Apartments | 52 (16.7%) | 260 (83.3%) |
| 3 or 4 Unit Apartments | 44 (11.2%) | 350 (88.8%) |
| 5 to 9 Unit Apartments | 0 (0.0%) | 247 (100.0%) |
| 10 or more Apartments | 29 (9.4%) | 279 (90.6%) |
| Mobile Home / Other | 647 (67.0%) | 318 (33.0%) |
| Total | 6,859 (72.2%) | 2,640 (27.8%) |
Housing Structures by Number of Rooms in Asotin County
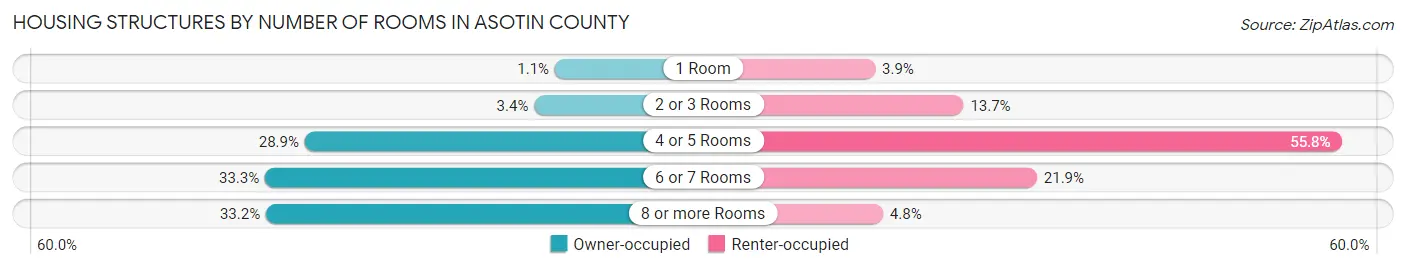
| Number of Rooms | Owner-occupied | Renter-occupied |
| 1 Room | 78 (1.1%) | 103 (3.9%) |
| 2 or 3 Rooms | 236 (3.4%) | 362 (13.7%) |
| 4 or 5 Rooms | 1,982 (28.9%) | 1,472 (55.8%) |
| 6 or 7 Rooms | 2,285 (33.3%) | 577 (21.9%) |
| 8 or more Rooms | 2,278 (33.2%) | 126 (4.8%) |
| Total | 6,859 (100.0%) | 2,640 (100.0%) |
Housing Structure by Heating Type in Asotin County
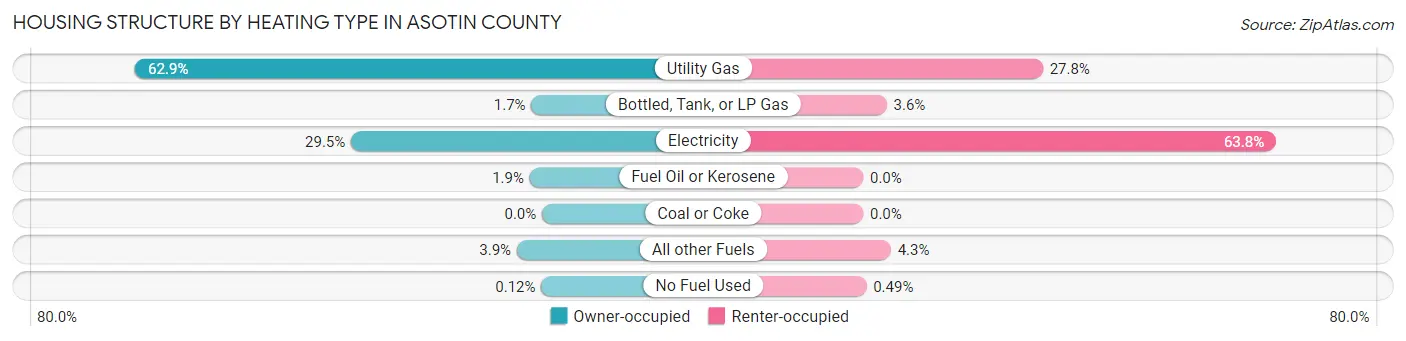
| Heating Type | Owner-occupied | Renter-occupied |
| Utility Gas | 4,316 (62.9%) | 733 (27.8%) |
| Bottled, Tank, or LP Gas | 113 (1.7%) | 96 (3.6%) |
| Electricity | 2,025 (29.5%) | 1,685 (63.8%) |
| Fuel Oil or Kerosene | 130 (1.9%) | 0 (0.0%) |
| Coal or Coke | 0 (0.0%) | 0 (0.0%) |
| All other Fuels | 267 (3.9%) | 113 (4.3%) |
| No Fuel Used | 8 (0.1%) | 13 (0.5%) |
| Total | 6,859 (100.0%) | 2,640 (100.0%) |
Household Vehicle Usage in Asotin County
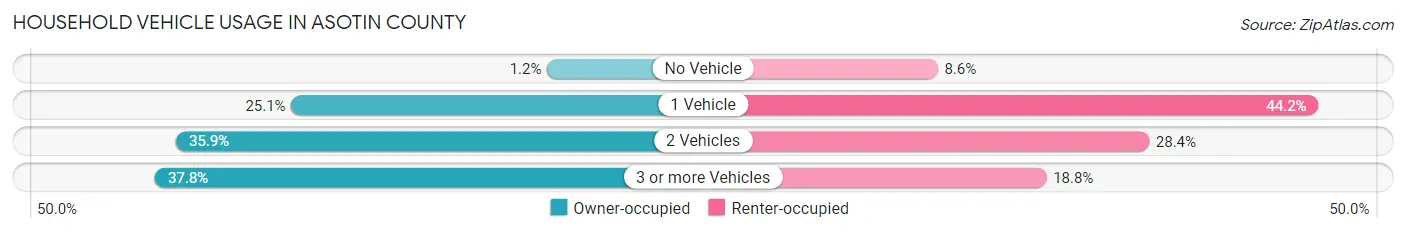
| Vehicles per Household | Owner-occupied | Renter-occupied |
| No Vehicle | 83 (1.2%) | 228 (8.6%) |
| 1 Vehicle | 1,721 (25.1%) | 1,167 (44.2%) |
| 2 Vehicles | 2,460 (35.9%) | 749 (28.4%) |
| 3 or more Vehicles | 2,595 (37.8%) | 496 (18.8%) |
| Total | 6,859 (100.0%) | 2,640 (100.0%) |
Real Estate & Mortgages in Asotin County
Real Estate and Mortgage Overview in Asotin County
| Characteristic | Without Mortgage | With Mortgage |
| Housing Units | 3,213 | 3,646 |
| Median Property Value | $262,700 | $269,000 |
| Median Household Income | $61,505 | $828 |
| Monthly Housing Costs | $459 | $132 |
| Real Estate Taxes | $2,231 | $82 |
Property Value by Mortgage Status in Asotin County
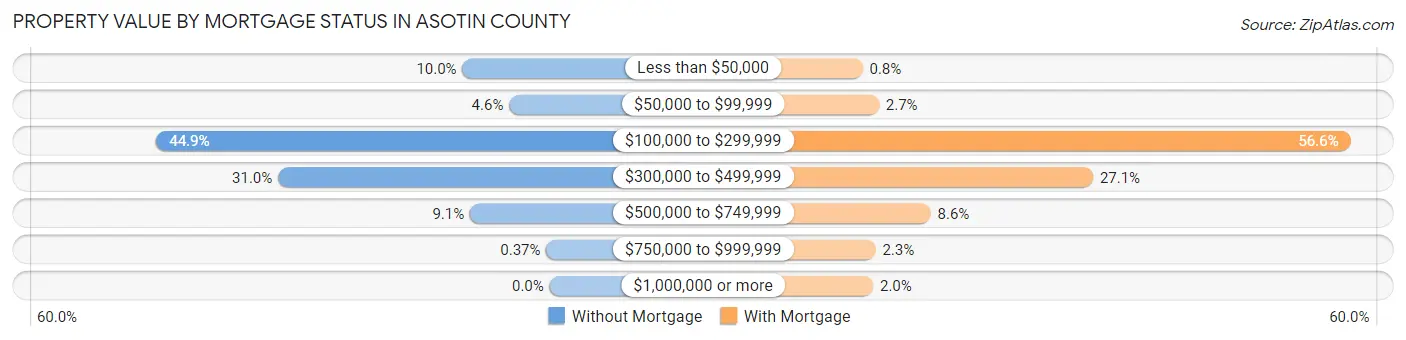
| Property Value | Without Mortgage | With Mortgage |
| Less than $50,000 | 320 (10.0%) | 29 (0.8%) |
| $50,000 to $99,999 | 148 (4.6%) | 97 (2.7%) |
| $100,000 to $299,999 | 1,444 (44.9%) | 2,062 (56.6%) |
| $300,000 to $499,999 | 997 (31.0%) | 989 (27.1%) |
| $500,000 to $749,999 | 292 (9.1%) | 313 (8.6%) |
| $750,000 to $999,999 | 12 (0.4%) | 83 (2.3%) |
| $1,000,000 or more | 0 (0.0%) | 73 (2.0%) |
| Total | 3,213 (100.0%) | 3,646 (100.0%) |
Household Income by Mortgage Status in Asotin County
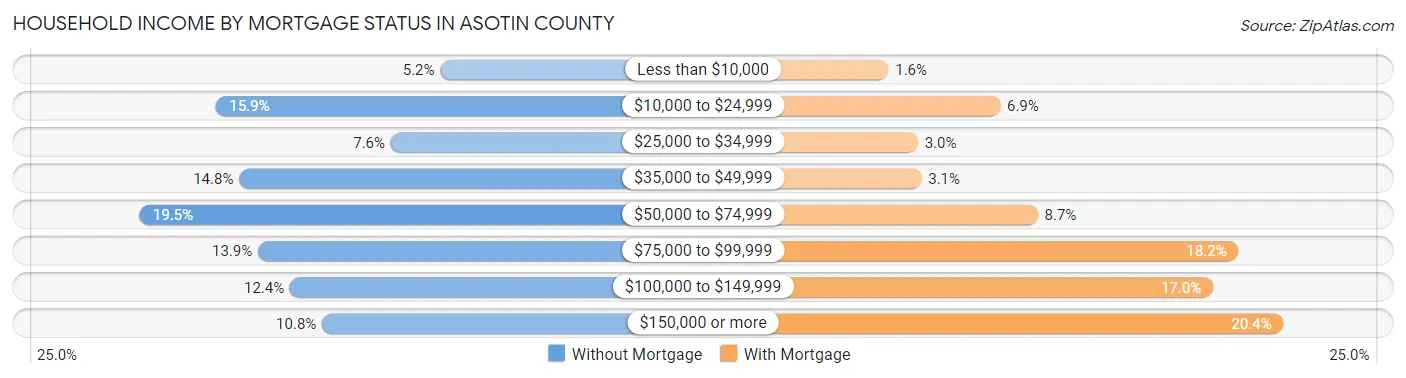
| Household Income | Without Mortgage | With Mortgage |
| Less than $10,000 | 167 (5.2%) | 57 (1.6%) |
| $10,000 to $24,999 | 510 (15.9%) | 251 (6.9%) |
| $25,000 to $34,999 | 243 (7.6%) | 108 (3.0%) |
| $35,000 to $49,999 | 475 (14.8%) | 114 (3.1%) |
| $50,000 to $74,999 | 627 (19.5%) | 316 (8.7%) |
| $75,000 to $99,999 | 446 (13.9%) | 665 (18.2%) |
| $100,000 to $149,999 | 397 (12.4%) | 621 (17.0%) |
| $150,000 or more | 348 (10.8%) | 743 (20.4%) |
| Total | 3,213 (100.0%) | 3,646 (100.0%) |
Property Value to Household Income Ratio in Asotin County
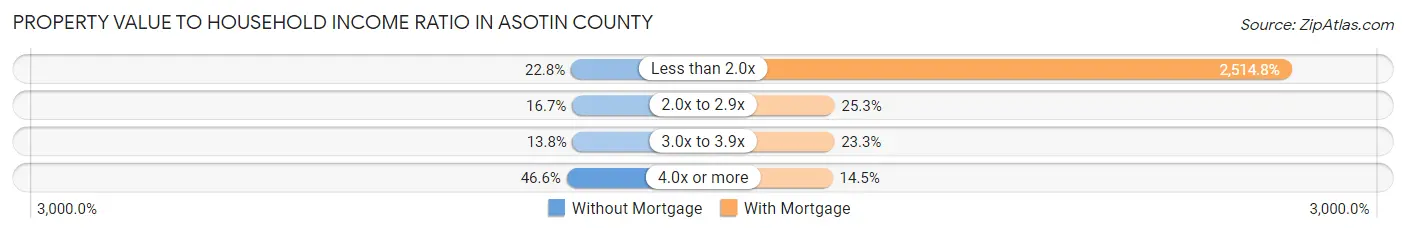
| Value-to-Income Ratio | Without Mortgage | With Mortgage |
| Less than 2.0x | 734 (22.8%) | 91,690 (2,514.8%) |
| 2.0x to 2.9x | 537 (16.7%) | 921 (25.3%) |
| 3.0x to 3.9x | 442 (13.8%) | 851 (23.3%) |
| 4.0x or more | 1,496 (46.6%) | 530 (14.5%) |
| Total | 3,213 (100.0%) | 3,646 (100.0%) |
Real Estate Taxes by Mortgage Status in Asotin County
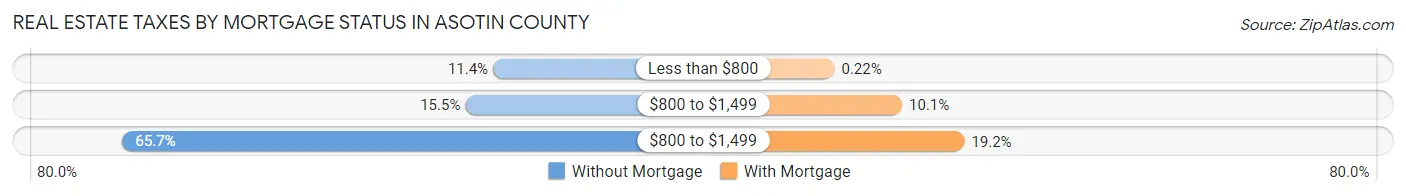
| Property Taxes | Without Mortgage | With Mortgage |
| Less than $800 | 367 (11.4%) | 8 (0.2%) |
| $800 to $1,499 | 497 (15.5%) | 368 (10.1%) |
| $800 to $1,499 | 2,111 (65.7%) | 700 (19.2%) |
| Total | 3,213 (100.0%) | 3,646 (100.0%) |
Health & Disability in Asotin County
Health Insurance Coverage by Age in Asotin County
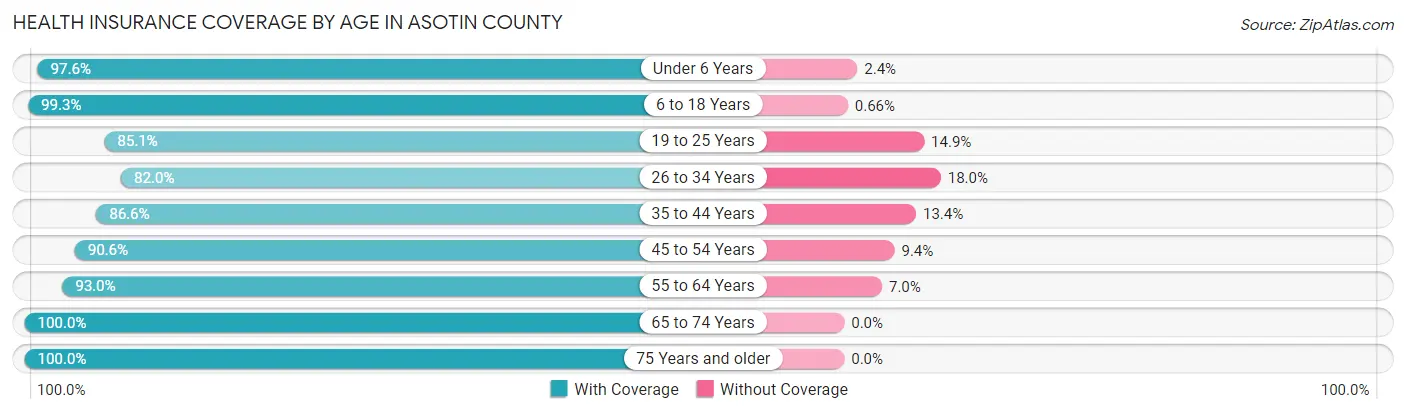
| Age Bracket | With Coverage | Without Coverage |
| Under 6 Years | 1,441 (97.6%) | 36 (2.4%) |
| 6 to 18 Years | 3,170 (99.3%) | 21 (0.7%) |
| 19 to 25 Years | 1,543 (85.1%) | 270 (14.9%) |
| 26 to 34 Years | 1,609 (82.0%) | 353 (18.0%) |
| 35 to 44 Years | 2,233 (86.6%) | 345 (13.4%) |
| 45 to 54 Years | 2,371 (90.6%) | 245 (9.4%) |
| 55 to 64 Years | 3,078 (93.0%) | 233 (7.0%) |
| 65 to 74 Years | 2,920 (100.0%) | 0 (0.0%) |
| 75 Years and older | 2,297 (100.0%) | 0 (0.0%) |
| Total | 20,662 (93.2%) | 1,503 (6.8%) |
Health Insurance Coverage by Citizenship Status in Asotin County
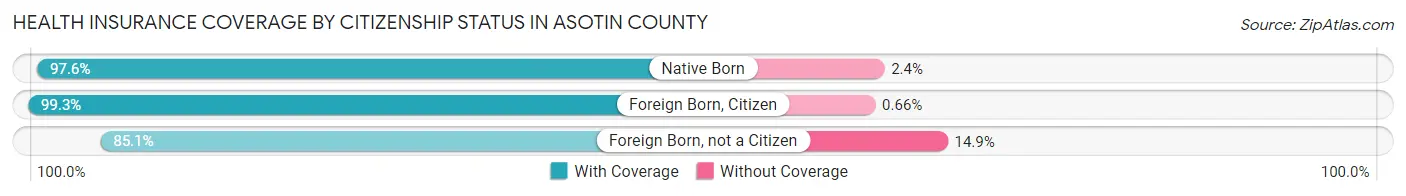
| Citizenship Status | With Coverage | Without Coverage |
| Native Born | 1,441 (97.6%) | 36 (2.4%) |
| Foreign Born, Citizen | 3,170 (99.3%) | 21 (0.7%) |
| Foreign Born, not a Citizen | 1,543 (85.1%) | 270 (14.9%) |
Health Insurance Coverage by Household Income in Asotin County
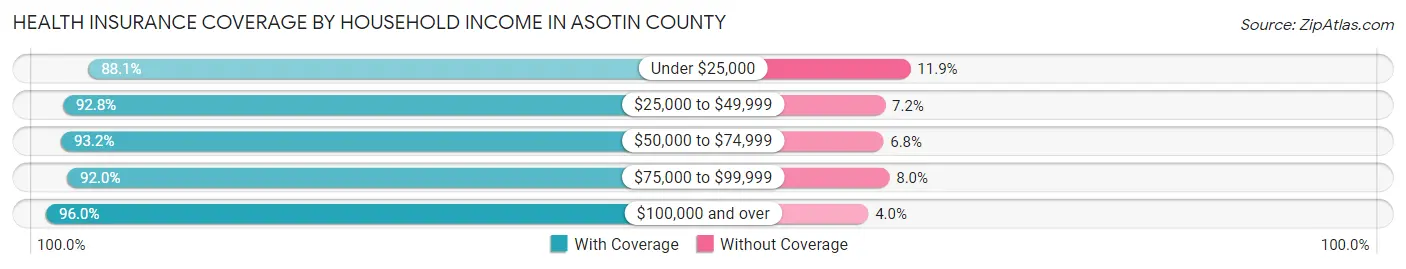
| Household Income | With Coverage | Without Coverage |
| Under $25,000 | 2,527 (88.1%) | 342 (11.9%) |
| $25,000 to $49,999 | 4,021 (92.8%) | 311 (7.2%) |
| $50,000 to $74,999 | 3,881 (93.2%) | 285 (6.8%) |
| $75,000 to $99,999 | 3,030 (92.0%) | 262 (8.0%) |
| $100,000 and over | 7,183 (96.0%) | 301 (4.0%) |
Public vs Private Health Insurance Coverage by Age in Asotin County
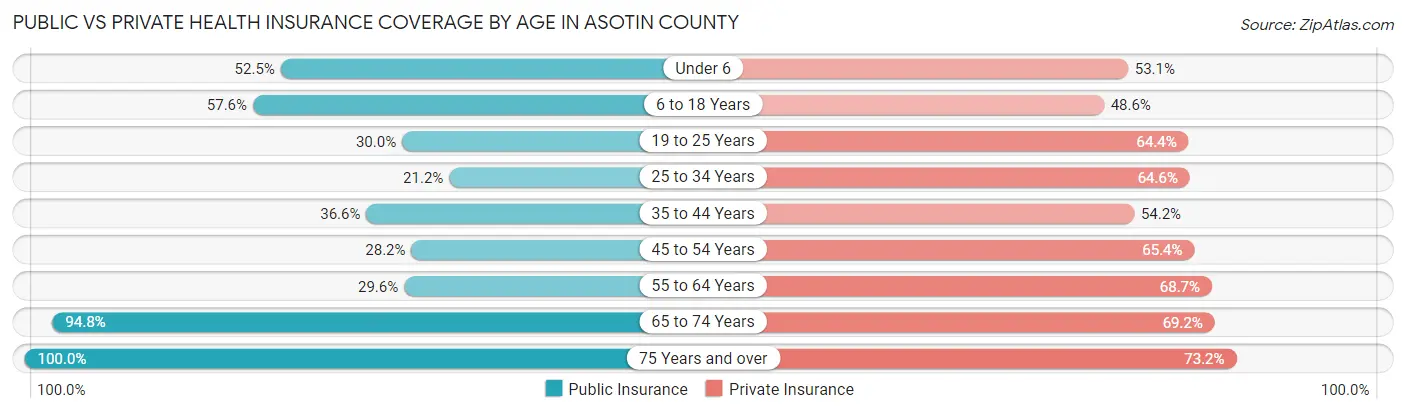
| Age Bracket | Public Insurance | Private Insurance |
| Under 6 | 775 (52.5%) | 784 (53.1%) |
| 6 to 18 Years | 1,839 (57.6%) | 1,551 (48.6%) |
| 19 to 25 Years | 543 (29.9%) | 1,167 (64.4%) |
| 25 to 34 Years | 416 (21.2%) | 1,267 (64.6%) |
| 35 to 44 Years | 943 (36.6%) | 1,398 (54.2%) |
| 45 to 54 Years | 738 (28.2%) | 1,712 (65.4%) |
| 55 to 64 Years | 979 (29.6%) | 2,274 (68.7%) |
| 65 to 74 Years | 2,769 (94.8%) | 2,021 (69.2%) |
| 75 Years and over | 2,297 (100.0%) | 1,682 (73.2%) |
| Total | 11,299 (51.0%) | 13,856 (62.5%) |
Disability Status by Sex by Age in Asotin County
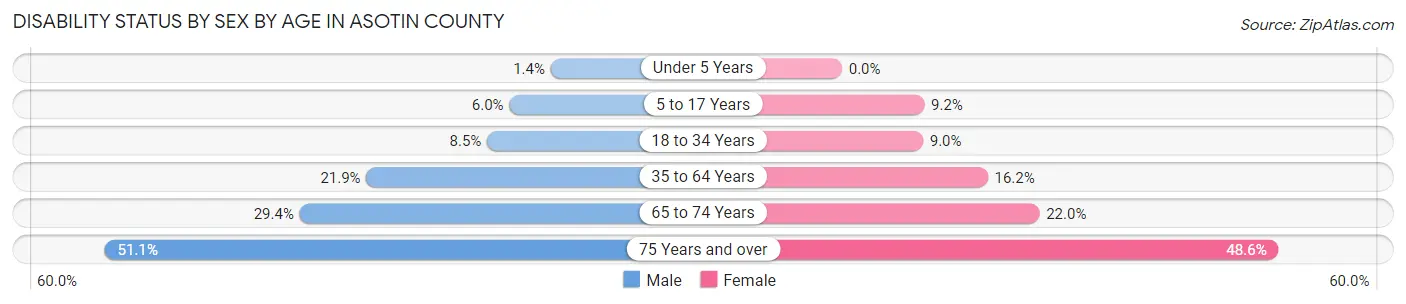
| Age Bracket | Male | Female |
| Under 5 Years | 9 (1.4%) | 0 (0.0%) |
| 5 to 17 Years | 101 (6.0%) | 146 (9.2%) |
| 18 to 34 Years | 166 (8.5%) | 178 (9.0%) |
| 35 to 64 Years | 914 (21.9%) | 704 (16.2%) |
| 65 to 74 Years | 414 (29.4%) | 332 (22.0%) |
| 75 Years and over | 541 (51.1%) | 602 (48.6%) |
Disability Class by Sex by Age in Asotin County
Disability Class: Hearing Difficulty
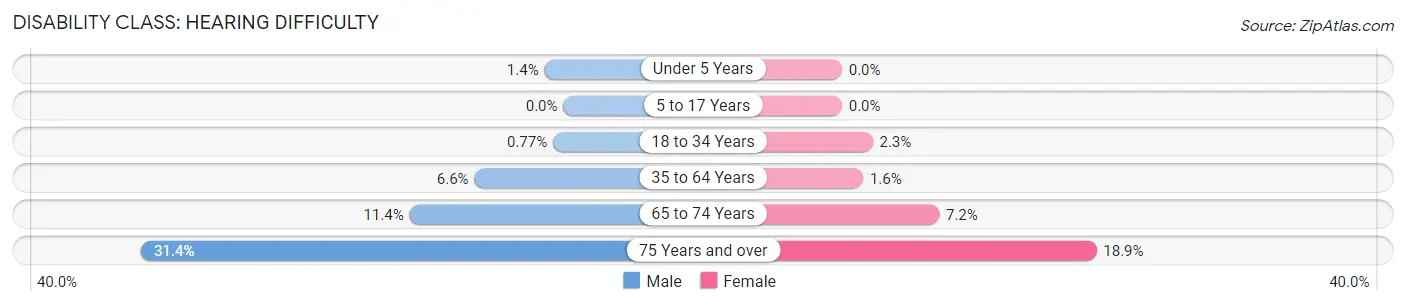
| Age Bracket | Male | Female |
| Under 5 Years | 9 (1.4%) | 0 (0.0%) |
| 5 to 17 Years | 0 (0.0%) | 0 (0.0%) |
| 18 to 34 Years | 15 (0.8%) | 45 (2.3%) |
| 35 to 64 Years | 275 (6.6%) | 68 (1.6%) |
| 65 to 74 Years | 161 (11.4%) | 109 (7.2%) |
| 75 Years and over | 332 (31.4%) | 234 (18.9%) |
Disability Class: Vision Difficulty
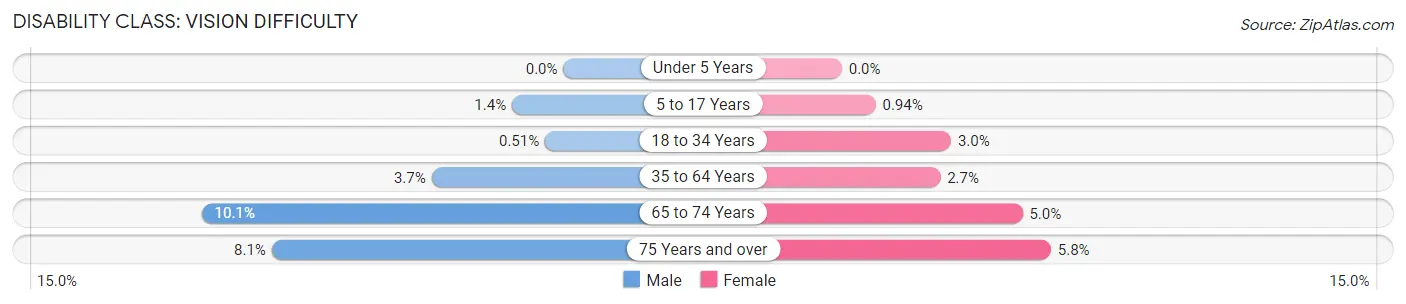
| Age Bracket | Male | Female |
| Under 5 Years | 0 (0.0%) | 0 (0.0%) |
| 5 to 17 Years | 24 (1.4%) | 15 (0.9%) |
| 18 to 34 Years | 10 (0.5%) | 60 (3.0%) |
| 35 to 64 Years | 153 (3.7%) | 119 (2.7%) |
| 65 to 74 Years | 142 (10.1%) | 76 (5.0%) |
| 75 Years and over | 86 (8.1%) | 72 (5.8%) |
Disability Class: Cognitive Difficulty
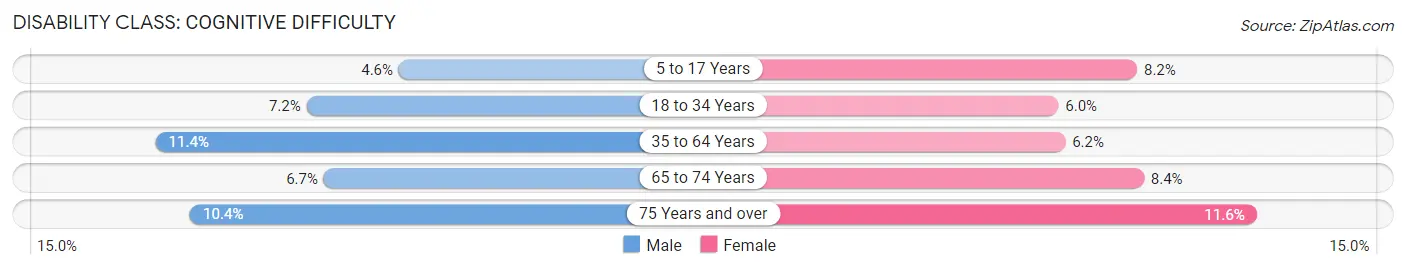
| Age Bracket | Male | Female |
| 5 to 17 Years | 77 (4.6%) | 131 (8.2%) |
| 18 to 34 Years | 140 (7.1%) | 119 (6.0%) |
| 35 to 64 Years | 473 (11.4%) | 270 (6.2%) |
| 65 to 74 Years | 94 (6.7%) | 127 (8.4%) |
| 75 Years and over | 110 (10.4%) | 143 (11.6%) |
Disability Class: Ambulatory Difficulty
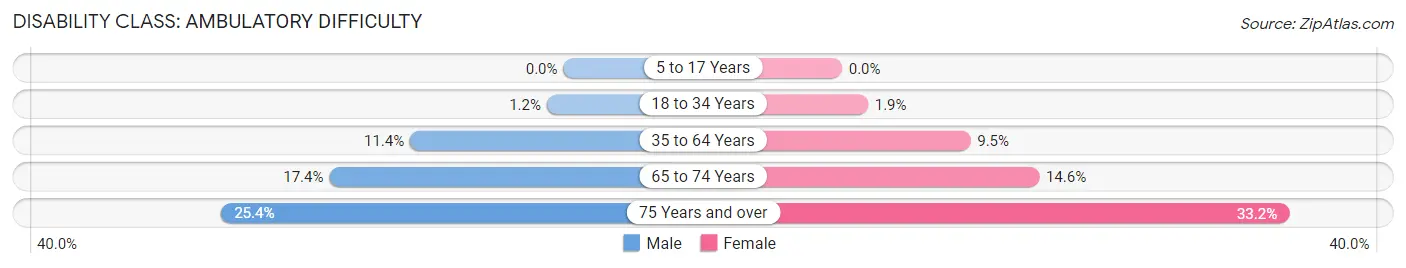
| Age Bracket | Male | Female |
| 5 to 17 Years | 0 (0.0%) | 0 (0.0%) |
| 18 to 34 Years | 24 (1.2%) | 38 (1.9%) |
| 35 to 64 Years | 474 (11.4%) | 414 (9.5%) |
| 65 to 74 Years | 245 (17.4%) | 221 (14.6%) |
| 75 Years and over | 269 (25.4%) | 411 (33.2%) |
Disability Class: Self-Care Difficulty
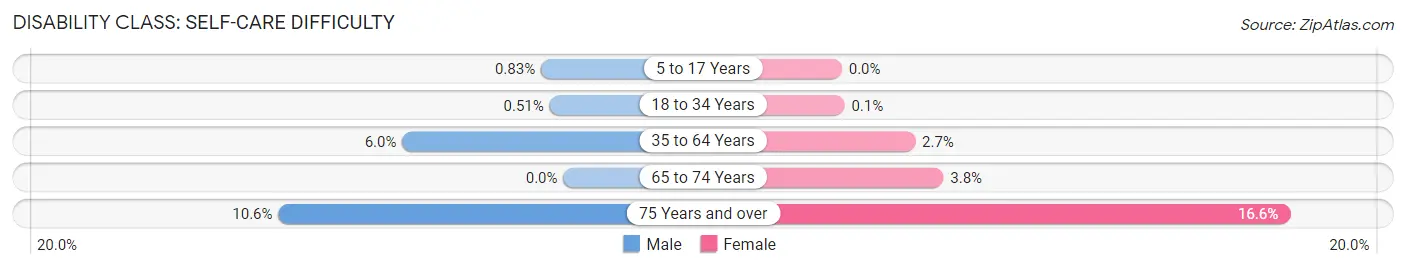
| Age Bracket | Male | Female |
| 5 to 17 Years | 14 (0.8%) | 0 (0.0%) |
| 18 to 34 Years | 10 (0.5%) | 2 (0.1%) |
| 35 to 64 Years | 249 (6.0%) | 118 (2.7%) |
| 65 to 74 Years | 0 (0.0%) | 57 (3.8%) |
| 75 Years and over | 112 (10.6%) | 206 (16.6%) |
Technology Access in Asotin County
Computing Device Access in Asotin County
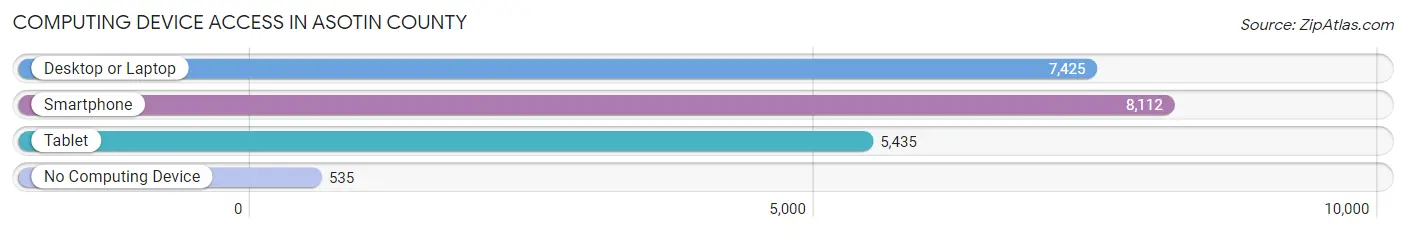
| Device Type | # Households | % Households |
| Desktop or Laptop | 7,425 | 78.2% |
| Smartphone | 8,112 | 85.4% |
| Tablet | 5,435 | 57.2% |
| No Computing Device | 535 | 5.6% |
| Total | 9,499 | 100.0% |
Internet Access in Asotin County
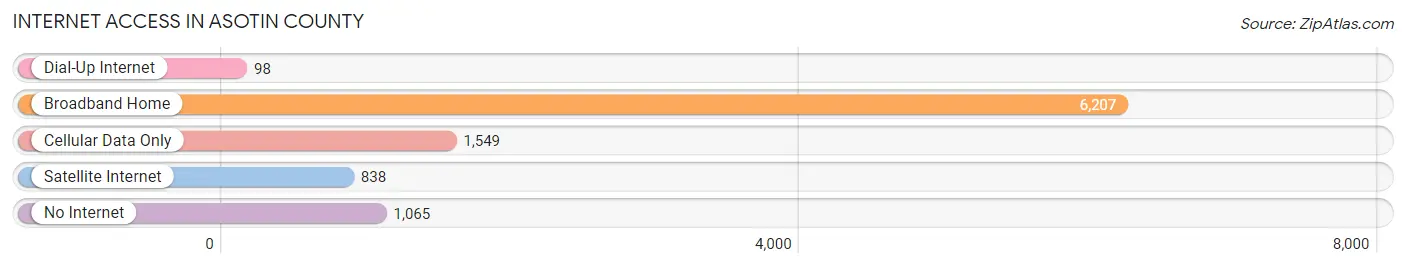
| Internet Type | # Households | % Households |
| Dial-Up Internet | 98 | 1.0% |
| Broadband Home | 6,207 | 65.3% |
| Cellular Data Only | 1,549 | 16.3% |
| Satellite Internet | 838 | 8.8% |
| No Internet | 1,065 | 11.2% |
| Total | 9,499 | 100.0% |
Asotin County Summary
Asotin County is located in the southeastern corner of Washington State, bordered by the Snake River to the east, the Clearwater River to the south, and the Palouse River to the west. It is part of the Palouse region, which is known for its rolling hills and fertile soil. Asotin County covers an area of 1,302 square miles and has a population of 22,919 as of the 2019 census.
History
The area that is now Asotin County was originally inhabited by the Nez Perce tribe. The first white settlers arrived in the area in the early 1800s, and the county was officially established in 1883. The county was named after the Nez Perce chief Asotin, who was known for his peaceful relations with the settlers.
The county was largely agricultural in its early years, with wheat, oats, and barley being the main crops. The county also had a thriving timber industry, with lumber mills located in the towns of Asotin and Clarkston.
Geography
Asotin County is located in the southeastern corner of Washington State, bordered by the Snake River to the east, the Clearwater River to the south, and the Palouse River to the west. The county is part of the Palouse region, which is known for its rolling hills and fertile soil. The county covers an area of 1,302 square miles and has a total population of 22,919 as of the 2019 census.
The county is divided into two distinct regions: the Palouse Hills to the west and the Snake River Plain to the east. The Palouse Hills are characterized by rolling hills and fertile soil, while the Snake River Plain is a flat, arid region. The county is home to several rivers, including the Snake, Clearwater, and Palouse Rivers.
Economy
Asotin County’s economy is largely based on agriculture and timber. Wheat, oats, and barley are the main crops grown in the county, and the timber industry is still a major employer. The county is also home to several manufacturing companies, including a paper mill and a food processing plant.
The county is also home to several tourist attractions, including Hells Gate State Park, the Asotin County Historical Museum, and the Snake River Canyon. Tourism is an important part of the county’s economy, and the county is home to several wineries and breweries.
Demographics
As of the 2019 census, Asotin County had a population of 22,919. The population is largely white (90.3%), with small percentages of Hispanic (3.3%), Asian (2.2%), and African American (1.2%) residents. The median household income is $50,945, and the median age is 40.
The county is home to several small towns, including Asotin, Clarkston, and Anatone. The county seat is Asotin, which is the largest town in the county with a population of 4,845.
Conclusion
Asotin County is located in the southeastern corner of Washington State, bordered by the Snake River to the east, the Clearwater River to the south, and the Palouse River to the west. It is part of the Palouse region, which is known for its rolling hills and fertile soil. The county has a population of 22,919 as of the 2019 census, and its economy is largely based on agriculture and timber. The county is also home to several tourist attractions, including Hells Gate State Park, the Asotin County Historical Museum, and the Snake River Canyon.
Common Questions
What is the Total Population of Asotin County?
Total Population of Asotin County is 22,370.
What is the Total Male Population of Asotin County?
Total Male Population of Asotin County is 11,031.
What is the Total Female Population of Asotin County?
Total Female Population of Asotin County is 11,339.
What is the Ratio of Males per 100 Females in Asotin County?
There are 97.28 Males per 100 Females in Asotin County.
What is the Ratio of Females per 100 Males in Asotin County?
There are 102.79 Females per 100 Males in Asotin County.
What is the Median Population Age in Asotin County?
Median Population Age in Asotin County is 45.4 Years.
What is the Average Family Size in Asotin County
Average Family Size in Asotin County is 2.9 People.
What is the Average Household Size in Asotin County
Average Household Size in Asotin County is 2.3 People.
What is Per Capita Income in Asotin County?
Per Capita income in Asotin County is $36,800.
What is the Median Family Income in Asotin County?
Median Family Income in Asotin County is $74,936.
What is the Median Household income in Asotin County?
Median Household Income in Asotin County is $63,724.
What is Income or Wage Gap in Asotin County?
Income or Wage Gap in Asotin County is 22.8%.
Women in Asotin County earn 77.2 cents for every dollar earned by a man.
What is Family Income Deficit in Asotin County?
Family Income Deficit in Asotin County is $14,286.
Families that are below poverty line in Asotin County earn $14,286 less on average than the poverty threshold level.
What is Inequality or Gini Index in Asotin County?
Inequality or Gini Index in Asotin County is 0.47.
How Large is the Labor Force in Asotin County?
There are 10,239 People in the Labor Forcein in Asotin County.
What is the Percentage of People in the Labor Force in Asotin County?
55.6% of People are in the Labor Force in Asotin County.
What is the Unemployment Rate in Asotin County?
Unemployment Rate in Asotin County is 5.9%.