Zip Codes with the Highest Percentage of Population Employed in Real Estate, Rental & Leasing in Lancaster, TX
RELATED REPORTS & OPTIONS
Real Estate, Rental & Leasing
Lancaster
Compare Zip Codes
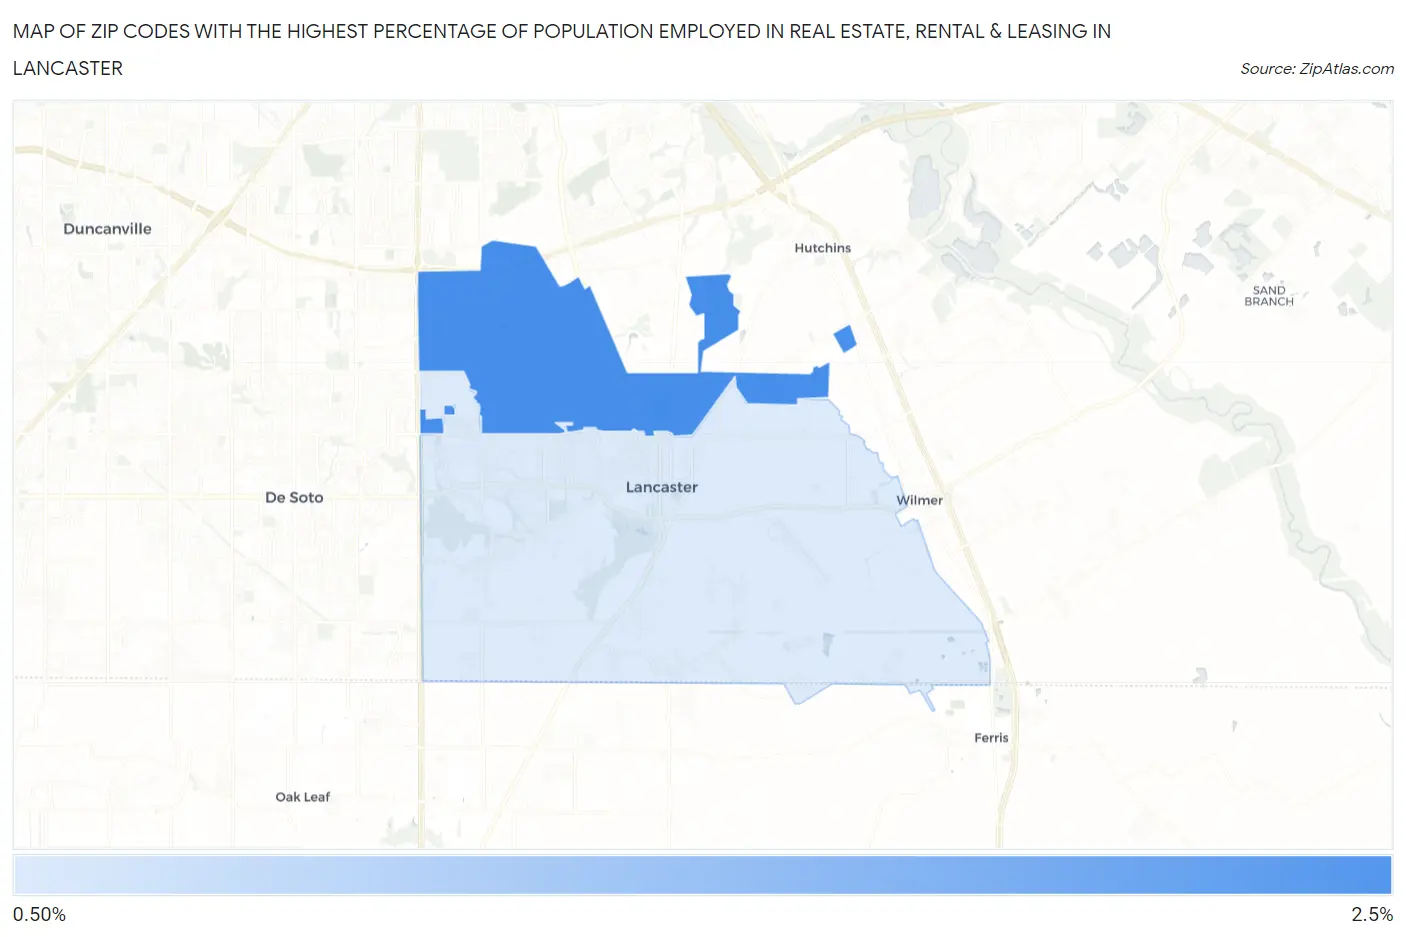
Map of Zip Codes with the Highest Percentage of Population Employed in Real Estate, Rental & Leasing in Lancaster
0.0%
2.5%
Zip Codes with the Highest Percentage of Population Employed in Real Estate, Rental & Leasing in Lancaster, TX
| Zip Code | % Employed | vs State | vs National | |
| 1. | 75134 | 2.1% | 2.0%(+0.135)#519 | 1.9%(+0.251)#7,103 |
| 2. | 75146 | 0.65% | 2.0%(-1.35)#1,173 | 1.9%(-1.24)#17,846 |
1
Common Questions
What are the Top Zip Codes with the Highest Percentage of Population Employed in Real Estate, Rental & Leasing in Lancaster, TX?
Top Zip Codes with the Highest Percentage of Population Employed in Real Estate, Rental & Leasing in Lancaster, TX are:
What zip code has the Highest Percentage of Population Employed in Real Estate, Rental & Leasing in Lancaster, TX?
75134 has the Highest Percentage of Population Employed in Real Estate, Rental & Leasing in Lancaster, TX with 2.1%.
What is the Percentage of Population Employed in Real Estate, Rental & Leasing in Lancaster, TX?
Percentage of Population Employed in Real Estate, Rental & Leasing in Lancaster is 1.4%.
What is the Percentage of Population Employed in Real Estate, Rental & Leasing in Texas?
Percentage of Population Employed in Real Estate, Rental & Leasing in Texas is 2.0%.
What is the Percentage of Population Employed in Real Estate, Rental & Leasing in the United States?
Percentage of Population Employed in Real Estate, Rental & Leasing in the United States is 1.9%.