Zip Codes with the Highest Percentage of Self-Employed / Not Incorporated in Louisiana
RELATED REPORTS & OPTIONS
Self-Employed / Not Incorporated
Louisiana
Compare Zip Codes
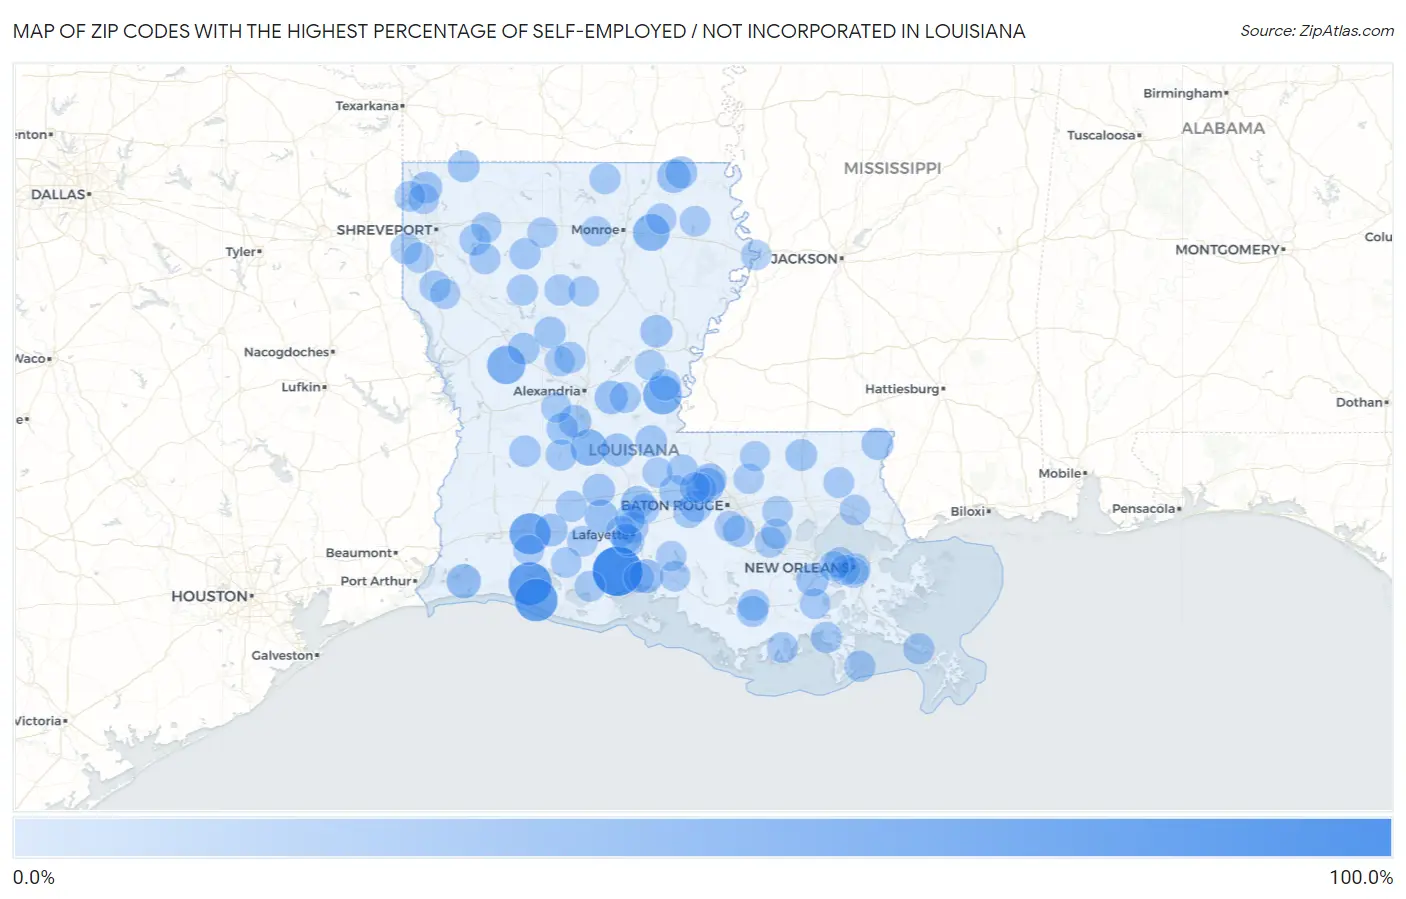
Map of Zip Codes with the Highest Percentage of Self-Employed / Not Incorporated in Louisiana
0.0%
100.0%
Zip Codes with the Highest Percentage of Self-Employed / Not Incorporated in Louisiana
| Zip Code | % Self-Employed / Not Incorporated | vs State | vs National | |
| 1. | 70575 | 100.0% | 6.3%(+93.7)#1 | 5.8%(+94.2)#27 |
| 2. | 70632 | 68.5% | 6.3%(+62.2)#2 | 5.8%(+62.6)#103 |
| 3. | 70643 | 66.7% | 6.3%(+60.4)#3 | 5.8%(+60.9)#108 |
| 4. | 70650 | 58.8% | 6.3%(+52.5)#4 | 5.8%(+52.9)#148 |
| 5. | 71316 | 48.3% | 6.3%(+42.0)#5 | 5.8%(+42.5)#249 |
| 6. | 71468 | 45.5% | 6.3%(+39.2)#6 | 5.8%(+39.7)#293 |
| 7. | 71279 | 39.0% | 6.3%(+32.7)#7 | 5.8%(+33.2)#432 |
| 8. | 70585 | 37.3% | 6.3%(+31.0)#8 | 5.8%(+31.5)#482 |
| 9. | 70631 | 27.4% | 6.3%(+21.1)#9 | 5.8%(+21.6)#932 |
| 10. | 70513 | 25.9% | 6.3%(+19.6)#10 | 5.8%(+20.1)#1,050 |
| 11. | 70729 | 25.9% | 6.3%(+19.6)#11 | 5.8%(+20.1)#1,052 |
| 12. | 71223 | 23.7% | 6.3%(+17.4)#12 | 5.8%(+17.9)#1,283 |
| 13. | 70516 | 22.8% | 6.3%(+16.5)#13 | 5.8%(+17.0)#1,378 |
| 14. | 71323 | 22.8% | 6.3%(+16.5)#14 | 5.8%(+16.9)#1,383 |
| 15. | 71322 | 22.2% | 6.3%(+15.9)#15 | 5.8%(+16.4)#1,454 |
| 16. | 70551 | 22.1% | 6.3%(+15.8)#16 | 5.8%(+16.3)#1,465 |
| 17. | 70736 | 21.9% | 6.3%(+15.6)#17 | 5.8%(+16.1)#1,489 |
| 18. | 70581 | 20.1% | 6.3%(+13.8)#18 | 5.8%(+14.3)#1,794 |
| 19. | 70080 | 20.0% | 6.3%(+13.7)#19 | 5.8%(+14.2)#1,805 |
| 20. | 71430 | 19.6% | 6.3%(+13.4)#20 | 5.8%(+13.8)#1,890 |
| 21. | 71340 | 19.2% | 6.3%(+12.9)#21 | 5.8%(+13.4)#1,980 |
| 22. | 70524 | 18.6% | 6.3%(+12.4)#22 | 5.8%(+12.8)#2,128 |
| 23. | 71250 | 17.2% | 6.3%(+10.9)#23 | 5.8%(+11.4)#2,562 |
| 24. | 70426 | 16.3% | 6.3%(+10.0)#24 | 5.8%(+10.5)#2,864 |
| 25. | 70756 | 16.3% | 6.3%(+10.0)#25 | 5.8%(+10.5)#2,869 |
| 26. | 70436 | 16.0% | 6.3%(+9.75)#26 | 5.8%(+10.2)#2,962 |
| 27. | 71029 | 16.0% | 6.3%(+9.71)#27 | 5.8%(+10.2)#2,973 |
| 28. | 71433 | 15.7% | 6.3%(+9.46)#28 | 5.8%(+9.93)#3,096 |
| 29. | 71456 | 15.7% | 6.3%(+9.41)#29 | 5.8%(+9.89)#3,118 |
| 30. | 71075 | 15.7% | 6.3%(+9.38)#30 | 5.8%(+9.86)#3,130 |
| 31. | 71404 | 15.5% | 6.3%(+9.20)#31 | 5.8%(+9.68)#3,202 |
| 32. | 71369 | 15.5% | 6.3%(+9.19)#32 | 5.8%(+9.67)#3,209 |
| 33. | 70507 | 15.0% | 6.3%(+8.68)#33 | 5.8%(+9.15)#3,437 |
| 34. | 70776 | 14.9% | 6.3%(+8.59)#34 | 5.8%(+9.07)#3,477 |
| 35. | 70772 | 14.7% | 6.3%(+8.37)#35 | 5.8%(+8.84)#3,586 |
| 36. | 70656 | 14.6% | 6.3%(+8.32)#36 | 5.8%(+8.80)#3,603 |
| 37. | 70352 | 14.6% | 6.3%(+8.30)#37 | 5.8%(+8.78)#3,614 |
| 38. | 70356 | 14.3% | 6.3%(+7.99)#38 | 5.8%(+8.47)#3,732 |
| 39. | 71354 | 14.2% | 6.3%(+7.93)#39 | 5.8%(+8.40)#3,791 |
| 40. | 71423 | 14.1% | 6.3%(+7.82)#40 | 5.8%(+8.30)#3,849 |
| 41. | 71463 | 13.9% | 6.3%(+7.60)#41 | 5.8%(+8.07)#3,970 |
| 42. | 71023 | 13.8% | 6.3%(+7.49)#42 | 5.8%(+7.96)#4,025 |
| 43. | 71032 | 13.7% | 6.3%(+7.41)#43 | 5.8%(+7.88)#4,067 |
| 44. | 71008 | 13.7% | 6.3%(+7.41)#44 | 5.8%(+7.88)#4,069 |
| 45. | 70354 | 13.6% | 6.3%(+7.26)#45 | 5.8%(+7.74)#4,149 |
| 46. | 71007 | 13.4% | 6.3%(+7.08)#46 | 5.8%(+7.56)#4,266 |
| 47. | 70041 | 13.4% | 6.3%(+7.06)#47 | 5.8%(+7.54)#4,271 |
| 48. | 71422 | 13.3% | 6.3%(+7.05)#48 | 5.8%(+7.53)#4,280 |
| 49. | 70515 | 13.3% | 6.3%(+7.03)#49 | 5.8%(+7.50)#4,303 |
| 50. | 70358 | 13.2% | 6.3%(+6.91)#50 | 5.8%(+7.38)#4,390 |
| 51. | 70757 | 13.2% | 6.3%(+6.87)#51 | 5.8%(+7.35)#4,415 |
| 52. | 70116 | 12.8% | 6.3%(+6.52)#52 | 5.8%(+7.00)#4,658 |
| 53. | 70752 | 12.5% | 6.3%(+6.25)#53 | 5.8%(+6.73)#4,854 |
| 54. | 71260 | 12.4% | 6.3%(+6.10)#54 | 5.8%(+6.58)#4,973 |
| 55. | 70006 | 12.4% | 6.3%(+6.10)#55 | 5.8%(+6.58)#4,977 |
| 56. | 71068 | 12.2% | 6.3%(+5.88)#56 | 5.8%(+6.35)#5,145 |
| 57. | 70759 | 12.1% | 6.3%(+5.76)#57 | 5.8%(+6.24)#5,248 |
| 58. | 70503 | 11.9% | 6.3%(+5.63)#58 | 5.8%(+6.11)#5,337 |
| 59. | 71070 | 11.9% | 6.3%(+5.60)#59 | 5.8%(+6.08)#5,362 |
| 60. | 71331 | 11.9% | 6.3%(+5.59)#60 | 5.8%(+6.07)#5,364 |
| 61. | 70548 | 11.7% | 6.3%(+5.43)#61 | 5.8%(+5.91)#5,520 |
| 62. | 70512 | 11.7% | 6.3%(+5.41)#62 | 5.8%(+5.89)#5,547 |
| 63. | 70353 | 11.7% | 6.3%(+5.40)#63 | 5.8%(+5.87)#5,554 |
| 64. | 70762 | 11.5% | 6.3%(+5.20)#64 | 5.8%(+5.68)#5,707 |
| 65. | 70437 | 11.4% | 6.3%(+5.12)#65 | 5.8%(+5.60)#5,802 |
| 66. | 70534 | 11.3% | 6.3%(+4.97)#66 | 5.8%(+5.45)#5,931 |
| 67. | 70528 | 11.2% | 6.3%(+4.88)#67 | 5.8%(+5.36)#6,031 |
| 68. | 70583 | 10.9% | 6.3%(+4.64)#68 | 5.8%(+5.12)#6,279 |
| 69. | 70646 | 10.8% | 6.3%(+4.50)#69 | 5.8%(+4.98)#6,430 |
| 70. | 70544 | 10.8% | 6.3%(+4.47)#70 | 5.8%(+4.95)#6,469 |
| 71. | 70471 | 10.7% | 6.3%(+4.36)#71 | 5.8%(+4.84)#6,591 |
| 72. | 71004 | 10.7% | 6.3%(+4.36)#72 | 5.8%(+4.84)#6,599 |
| 73. | 71061 | 10.6% | 6.3%(+4.35)#73 | 5.8%(+4.83)#6,612 |
| 74. | 70355 | 10.5% | 6.3%(+4.21)#74 | 5.8%(+4.68)#6,772 |
| 75. | 70130 | 10.4% | 6.3%(+4.14)#75 | 5.8%(+4.62)#6,845 |
| 76. | 70780 | 10.4% | 6.3%(+4.06)#76 | 5.8%(+4.54)#6,933 |
| 77. | 71237 | 10.3% | 6.3%(+3.96)#77 | 5.8%(+4.44)#7,048 |
| 78. | 71264 | 10.2% | 6.3%(+3.94)#78 | 5.8%(+4.42)#7,088 |
| 79. | 70754 | 10.2% | 6.3%(+3.91)#79 | 5.8%(+4.39)#7,119 |
| 80. | 70778 | 10.1% | 6.3%(+3.84)#80 | 5.8%(+4.32)#7,193 |
| 81. | 70774 | 10.1% | 6.3%(+3.83)#81 | 5.8%(+4.30)#7,211 |
| 82. | 71473 | 10.1% | 6.3%(+3.81)#82 | 5.8%(+4.29)#7,233 |
| 83. | 70542 | 10.0% | 6.3%(+3.74)#83 | 5.8%(+4.21)#7,322 |
| 84. | 71073 | 9.8% | 6.3%(+3.49)#84 | 5.8%(+3.97)#7,646 |
| 85. | 71052 | 9.7% | 6.3%(+3.38)#85 | 5.8%(+3.86)#7,797 |
| 86. | 71225 | 9.6% | 6.3%(+3.33)#86 | 5.8%(+3.80)#7,866 |
| 87. | 70552 | 9.6% | 6.3%(+3.31)#87 | 5.8%(+3.79)#7,884 |
| 88. | 70770 | 9.6% | 6.3%(+3.29)#88 | 5.8%(+3.77)#7,910 |
| 89. | 71417 | 9.5% | 6.3%(+3.22)#89 | 5.8%(+3.69)#8,010 |
| 90. | 70506 | 9.5% | 6.3%(+3.21)#90 | 5.8%(+3.69)#8,013 |
| 91. | 70121 | 9.4% | 6.3%(+3.13)#91 | 5.8%(+3.60)#8,126 |
| 92. | 71343 | 9.3% | 6.3%(+3.05)#92 | 5.8%(+3.53)#8,248 |
| 93. | 70722 | 9.3% | 6.3%(+3.04)#93 | 5.8%(+3.52)#8,267 |
| 94. | 71353 | 9.3% | 6.3%(+3.00)#94 | 5.8%(+3.47)#8,318 |
| 95. | 71275 | 9.2% | 6.3%(+2.95)#95 | 5.8%(+3.43)#8,385 |
| 96. | 71424 | 9.2% | 6.3%(+2.89)#96 | 5.8%(+3.37)#8,490 |
| 97. | 70062 | 9.2% | 6.3%(+2.88)#97 | 5.8%(+3.36)#8,502 |
| 98. | 71047 | 9.1% | 6.3%(+2.84)#98 | 5.8%(+3.32)#8,568 |
| 99. | 71233 | 9.1% | 6.3%(+2.80)#99 | 5.8%(+3.28)#8,644 |
| 100. | 70520 | 9.1% | 6.3%(+2.79)#100 | 5.8%(+3.27)#8,658 |
Common Questions
What are the Top 10 Zip Codes with the Highest Percentage of Self-Employed / Not Incorporated in Louisiana?
Top 10 Zip Codes with the Highest Percentage of Self-Employed / Not Incorporated in Louisiana are:
What zip code has the Highest Percentage of Self-Employed / Not Incorporated in Louisiana?
70575 has the Highest Percentage of Self-Employed / Not Incorporated in Louisiana with 100.0%.
What is the Percentage of Self-Employed / Not Incorporated in the State of Louisiana?
Percentage of Self-Employed / Not Incorporated in Louisiana is 6.3%.
What is the Percentage of Self-Employed / Not Incorporated in the United States?
Percentage of Self-Employed / Not Incorporated in the United States is 5.8%.