Zip Codes with the Highest Percentage of Self-Employed / Not Incorporated in Washington
RELATED REPORTS & OPTIONS
Self-Employed / Not Incorporated
Washington
Compare Zip Codes
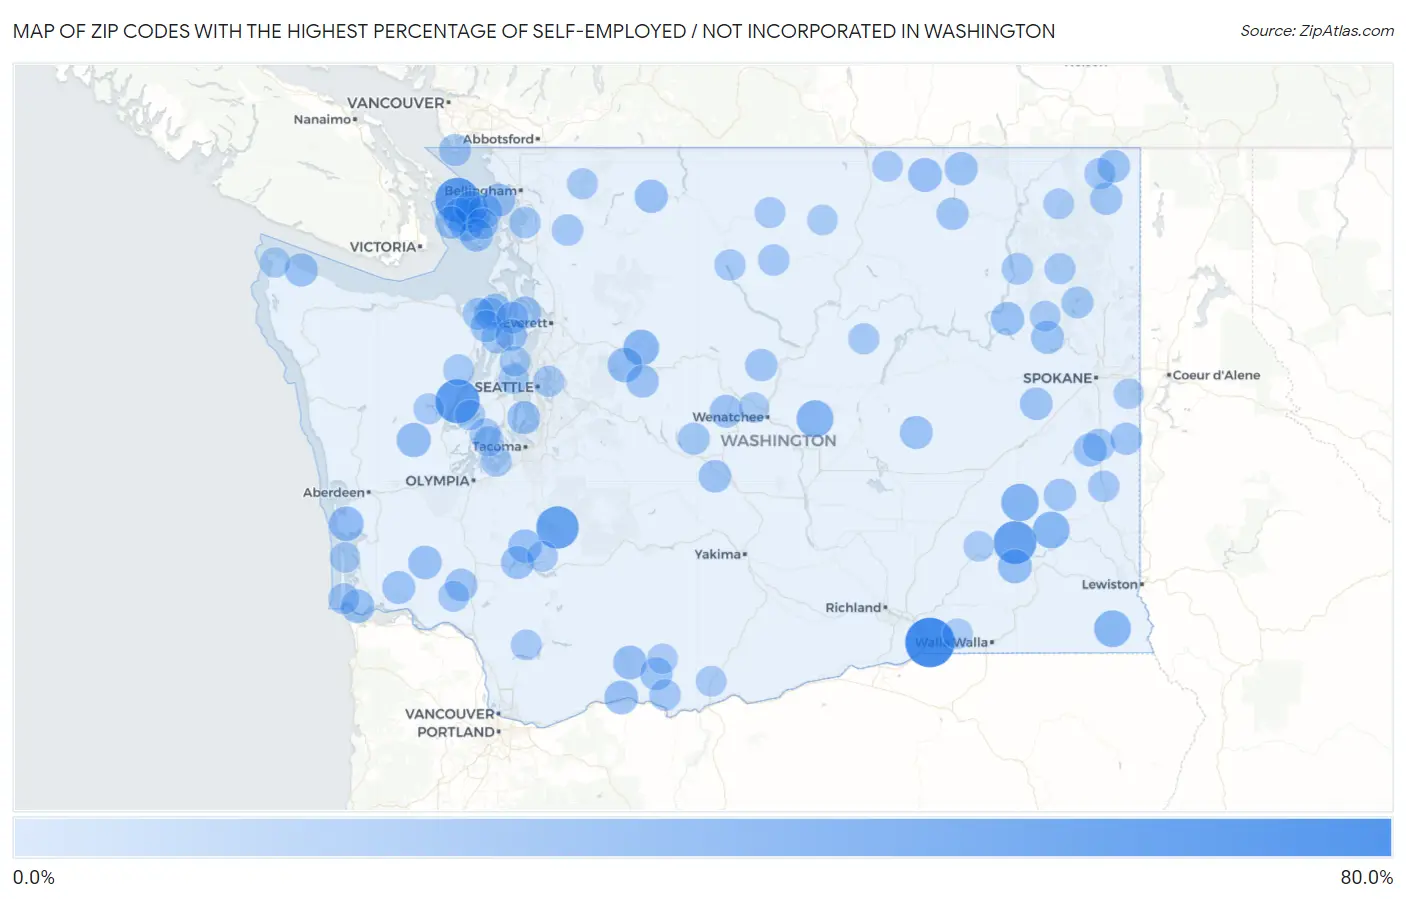
Map of Zip Codes with the Highest Percentage of Self-Employed / Not Incorporated in Washington
0.0%
80.0%
Zip Codes with the Highest Percentage of Self-Employed / Not Incorporated in Washington
| Zip Code | % Self-Employed / Not Incorporated | vs State | vs National | |
| 1. | 99363 | 74.2% | 5.4%(+68.8)#1 | 5.8%(+68.4)#88 |
| 2. | 98297 | 57.1% | 5.4%(+51.7)#2 | 5.8%(+51.3)#156 |
| 3. | 98555 | 55.8% | 5.4%(+50.4)#3 | 5.8%(+50.0)#162 |
| 4. | 99333 | 50.9% | 5.4%(+45.5)#4 | 5.8%(+45.1)#209 |
| 5. | 98330 | 50.0% | 5.4%(+44.6)#5 | 5.8%(+44.2)#232 |
| 6. | 99105 | 33.3% | 5.4%(+27.9)#6 | 5.8%(+27.5)#617 |
| 7. | 98845 | 31.5% | 5.4%(+26.0)#7 | 5.8%(+25.6)#698 |
| 8. | 99401 | 31.0% | 5.4%(+25.6)#8 | 5.8%(+25.2)#717 |
| 9. | 99143 | 31.0% | 5.4%(+25.5)#9 | 5.8%(+25.2)#721 |
| 10. | 98256 | 27.3% | 5.4%(+21.8)#10 | 5.8%(+21.5)#942 |
| 11. | 98286 | 25.5% | 5.4%(+20.1)#11 | 5.8%(+19.7)#1,105 |
| 12. | 98280 | 24.6% | 5.4%(+19.2)#12 | 5.8%(+18.8)#1,192 |
| 13. | 98224 | 24.1% | 5.4%(+18.7)#13 | 5.8%(+18.3)#1,240 |
| 14. | 98547 | 24.0% | 5.4%(+18.5)#14 | 5.8%(+18.1)#1,260 |
| 15. | 98243 | 22.7% | 5.4%(+17.3)#15 | 5.8%(+16.9)#1,387 |
| 16. | 98560 | 22.6% | 5.4%(+17.1)#16 | 5.8%(+16.8)#1,406 |
| 17. | 99359 | 22.2% | 5.4%(+16.8)#17 | 5.8%(+16.4)#1,448 |
| 18. | 98279 | 21.4% | 5.4%(+16.0)#18 | 5.8%(+15.6)#1,570 |
| 19. | 98859 | 21.4% | 5.4%(+16.0)#19 | 5.8%(+15.6)#1,572 |
| 20. | 98650 | 21.1% | 5.4%(+15.7)#20 | 5.8%(+15.3)#1,615 |
| 21. | 98651 | 21.0% | 5.4%(+15.6)#21 | 5.8%(+15.2)#1,637 |
| 22. | 98614 | 20.4% | 5.4%(+15.0)#22 | 5.8%(+14.6)#1,733 |
| 23. | 98533 | 20.4% | 5.4%(+15.0)#23 | 5.8%(+14.6)#1,743 |
| 24. | 99129 | 20.2% | 5.4%(+14.7)#24 | 5.8%(+14.4)#1,775 |
| 25. | 98572 | 20.1% | 5.4%(+14.7)#25 | 5.8%(+14.3)#1,788 |
| 26. | 98245 | 19.8% | 5.4%(+14.4)#26 | 5.8%(+14.0)#1,855 |
| 27. | 98283 | 19.7% | 5.4%(+14.2)#27 | 5.8%(+13.8)#1,883 |
| 28. | 99118 | 19.5% | 5.4%(+14.0)#28 | 5.8%(+13.6)#1,923 |
| 29. | 98261 | 19.3% | 5.4%(+13.8)#29 | 5.8%(+13.4)#1,956 |
| 30. | 98585 | 18.9% | 5.4%(+13.5)#30 | 5.8%(+13.1)#2,065 |
| 31. | 98381 | 18.7% | 5.4%(+13.3)#31 | 5.8%(+12.9)#2,111 |
| 32. | 98832 | 18.6% | 5.4%(+13.2)#32 | 5.8%(+12.8)#2,136 |
| 33. | 99013 | 18.5% | 5.4%(+13.1)#33 | 5.8%(+12.7)#2,171 |
| 34. | 99149 | 18.5% | 5.4%(+13.0)#34 | 5.8%(+12.6)#2,184 |
| 35. | 98070 | 18.3% | 5.4%(+12.9)#35 | 5.8%(+12.5)#2,217 |
| 36. | 98621 | 18.3% | 5.4%(+12.8)#36 | 5.8%(+12.5)#2,239 |
| 37. | 98602 | 18.0% | 5.4%(+12.6)#37 | 5.8%(+12.2)#2,308 |
| 38. | 98847 | 17.9% | 5.4%(+12.4)#38 | 5.8%(+12.1)#2,342 |
| 39. | 98358 | 17.8% | 5.4%(+12.4)#39 | 5.8%(+12.0)#2,359 |
| 40. | 98262 | 17.7% | 5.4%(+12.2)#40 | 5.8%(+11.9)#2,404 |
| 41. | 98288 | 17.3% | 5.4%(+11.9)#41 | 5.8%(+11.5)#2,524 |
| 42. | 98250 | 17.2% | 5.4%(+11.8)#42 | 5.8%(+11.4)#2,550 |
| 43. | 98946 | 17.2% | 5.4%(+11.8)#43 | 5.8%(+11.4)#2,556 |
| 44. | 99008 | 17.2% | 5.4%(+11.7)#44 | 5.8%(+11.4)#2,579 |
| 45. | 98593 | 17.1% | 5.4%(+11.7)#45 | 5.8%(+11.3)#2,588 |
| 46. | 99153 | 17.1% | 5.4%(+11.6)#46 | 5.8%(+11.3)#2,612 |
| 47. | 99170 | 16.8% | 5.4%(+11.4)#47 | 5.8%(+11.0)#2,683 |
| 48. | 99125 | 16.7% | 5.4%(+11.3)#48 | 5.8%(+10.9)#2,711 |
| 49. | 98811 | 16.7% | 5.4%(+11.2)#49 | 5.8%(+10.9)#2,754 |
| 50. | 99139 | 16.1% | 5.4%(+10.7)#50 | 5.8%(+10.3)#2,929 |
| 51. | 99166 | 16.0% | 5.4%(+10.6)#51 | 5.8%(+10.2)#2,960 |
| 52. | 98260 | 15.9% | 5.4%(+10.5)#52 | 5.8%(+10.1)#2,999 |
| 53. | 99018 | 15.9% | 5.4%(+10.4)#53 | 5.8%(+10.1)#3,026 |
| 54. | 98339 | 15.5% | 5.4%(+10.1)#54 | 5.8%(+9.69)#3,195 |
| 55. | 98365 | 15.5% | 5.4%(+10.0)#55 | 5.8%(+9.67)#3,208 |
| 56. | 98281 | 15.3% | 5.4%(+9.89)#56 | 5.8%(+9.51)#3,267 |
| 57. | 98368 | 15.3% | 5.4%(+9.86)#57 | 5.8%(+9.49)#3,281 |
| 58. | 98922 | 15.2% | 5.4%(+9.81)#58 | 5.8%(+9.43)#3,307 |
| 59. | 98325 | 15.1% | 5.4%(+9.65)#59 | 5.8%(+9.27)#3,377 |
| 60. | 98249 | 14.7% | 5.4%(+9.22)#60 | 5.8%(+8.84)#3,587 |
| 61. | 98340 | 14.5% | 5.4%(+9.04)#61 | 5.8%(+8.67)#3,664 |
| 62. | 99148 | 14.5% | 5.4%(+9.02)#62 | 5.8%(+8.64)#3,670 |
| 63. | 99131 | 14.3% | 5.4%(+8.85)#63 | 5.8%(+8.47)#3,754 |
| 64. | 98635 | 13.8% | 5.4%(+8.33)#64 | 5.8%(+7.95)#4,032 |
| 65. | 99152 | 13.6% | 5.4%(+8.20)#65 | 5.8%(+7.82)#4,111 |
| 66. | 98232 | 13.5% | 5.4%(+8.01)#66 | 5.8%(+7.63)#4,215 |
| 67. | 98263 | 13.4% | 5.4%(+7.96)#67 | 5.8%(+7.59)#4,245 |
| 68. | 98856 | 13.3% | 5.4%(+7.90)#68 | 5.8%(+7.52)#4,285 |
| 69. | 99174 | 13.3% | 5.4%(+7.90)#69 | 5.8%(+7.52)#4,293 |
| 70. | 98222 | 12.8% | 5.4%(+7.33)#70 | 5.8%(+6.95)#4,681 |
| 71. | 98320 | 12.6% | 5.4%(+7.19)#71 | 5.8%(+6.81)#4,779 |
| 72. | 98644 | 12.6% | 5.4%(+7.14)#72 | 5.8%(+6.76)#4,825 |
| 73. | 98852 | 12.5% | 5.4%(+7.06)#73 | 5.8%(+6.68)#4,901 |
| 74. | 99109 | 12.3% | 5.4%(+6.88)#74 | 5.8%(+6.50)#5,027 |
| 75. | 98039 | 12.3% | 5.4%(+6.87)#75 | 5.8%(+6.50)#5,031 |
| 76. | 98830 | 12.2% | 5.4%(+6.78)#76 | 5.8%(+6.40)#5,105 |
| 77. | 98581 | 11.9% | 5.4%(+6.43)#77 | 5.8%(+6.05)#5,386 |
| 78. | 98394 | 11.8% | 5.4%(+6.40)#78 | 5.8%(+6.02)#5,409 |
| 79. | 98303 | 11.8% | 5.4%(+6.39)#79 | 5.8%(+6.01)#5,422 |
| 80. | 98244 | 11.7% | 5.4%(+6.27)#80 | 5.8%(+5.89)#5,539 |
| 81. | 98356 | 11.6% | 5.4%(+6.14)#81 | 5.8%(+5.76)#5,638 |
| 82. | 98862 | 11.5% | 5.4%(+6.03)#82 | 5.8%(+5.65)#5,738 |
| 83. | 98603 | 11.3% | 5.4%(+5.82)#83 | 5.8%(+5.44)#5,942 |
| 84. | 98548 | 11.2% | 5.4%(+5.73)#84 | 5.8%(+5.36)#6,029 |
| 85. | 98620 | 11.1% | 5.4%(+5.67)#85 | 5.8%(+5.29)#6,108 |
| 86. | 98844 | 11.1% | 5.4%(+5.67)#86 | 5.8%(+5.29)#6,110 |
| 87. | 99173 | 11.0% | 5.4%(+5.58)#87 | 5.8%(+5.20)#6,191 |
| 88. | 98819 | 10.8% | 5.4%(+5.33)#88 | 5.8%(+4.95)#6,463 |
| 89. | 99114 | 10.7% | 5.4%(+5.29)#89 | 5.8%(+4.91)#6,505 |
| 90. | 98110 | 10.6% | 5.4%(+5.13)#90 | 5.8%(+4.75)#6,694 |
| 91. | 99335 | 10.5% | 5.4%(+5.09)#91 | 5.8%(+4.71)#6,747 |
| 92. | 99360 | 10.5% | 5.4%(+5.03)#92 | 5.8%(+4.65)#6,806 |
| 93. | 98619 | 10.4% | 5.4%(+4.97)#93 | 5.8%(+4.59)#6,883 |
| 94. | 98640 | 10.3% | 5.4%(+4.83)#94 | 5.8%(+4.45)#7,041 |
| 95. | 98342 | 10.2% | 5.4%(+4.73)#95 | 5.8%(+4.35)#7,151 |
| 96. | 98528 | 10.2% | 5.4%(+4.72)#96 | 5.8%(+4.34)#7,169 |
| 97. | 98349 | 10.1% | 5.4%(+4.71)#97 | 5.8%(+4.33)#7,184 |
| 98. | 98836 | 10.0% | 5.4%(+4.56)#98 | 5.8%(+4.18)#7,354 |
| 99. | 98357 | 9.9% | 5.4%(+4.42)#99 | 5.8%(+4.04)#7,536 |
| 100. | 99023 | 9.8% | 5.4%(+4.37)#100 | 5.8%(+3.99)#7,609 |
Common Questions
What are the Top 10 Zip Codes with the Highest Percentage of Self-Employed / Not Incorporated in Washington?
Top 10 Zip Codes with the Highest Percentage of Self-Employed / Not Incorporated in Washington are:
What zip code has the Highest Percentage of Self-Employed / Not Incorporated in Washington?
99363 has the Highest Percentage of Self-Employed / Not Incorporated in Washington with 74.2%.
What is the Percentage of Self-Employed / Not Incorporated in the State of Washington?
Percentage of Self-Employed / Not Incorporated in Washington is 5.4%.
What is the Percentage of Self-Employed / Not Incorporated in the United States?
Percentage of Self-Employed / Not Incorporated in the United States is 5.8%.