Zip Codes with the Highest Percentage of Households Heated by Bottled Gas / Liquid Propane in Odessa, TX
RELATED REPORTS & OPTIONS
Bottled Gas / LP Heating
Odessa
Compare Zip Codes
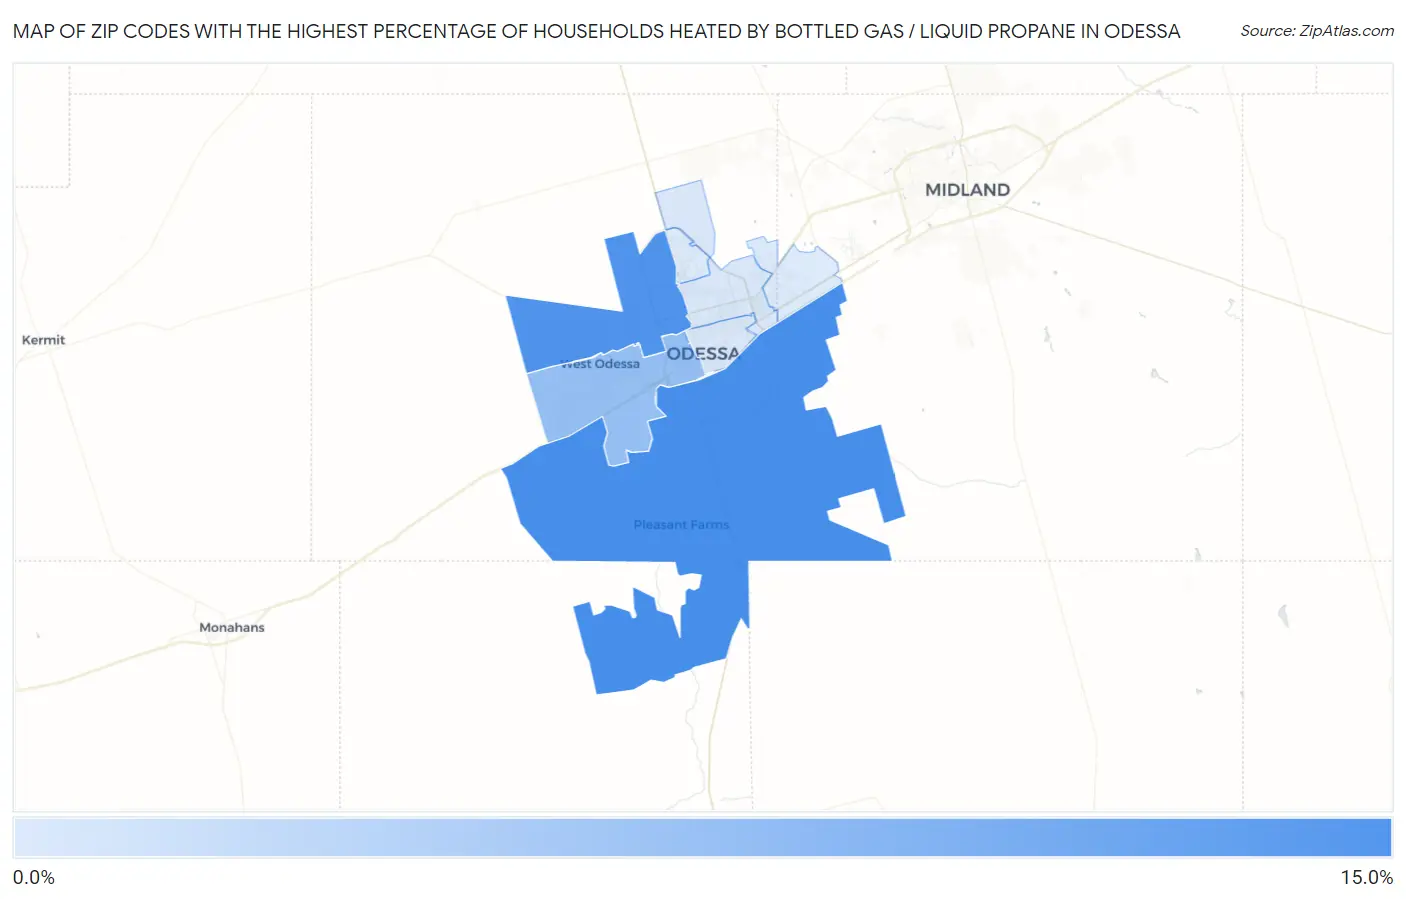
Map of Zip Codes with the Highest Percentage of Households Heated by Bottled Gas / Liquid Propane in Odessa
0.0%
15.0%
Zip Codes with the Highest Percentage of Households Heated by Bottled Gas / Liquid Propane in Odessa, TX
| Zip Code | Bottled Gas / LP Heating | vs State | vs National | |
| 1. | 79766 | 12.5% | 2.9%(+9.60)#409 | 4.9%(+7.60)#12,731 |
| 2. | 79764 | 12.0% | 2.9%(+9.10)#431 | 4.9%(+7.10)#13,066 |
| 3. | 79763 | 5.9% | 2.9%(+3.00)#775 | 4.9%(+1.00)#17,647 |
| 4. | 79762 | 0.60% | 2.9%(-2.30)#1,517 | 4.9%(-4.30)#28,177 |
| 5. | 79761 | 0.40% | 2.9%(-2.50)#1,608 | 4.9%(-4.50)#28,883 |
| 6. | 79765 | 0.30% | 2.9%(-2.60)#1,656 | 4.9%(-4.60)#29,198 |
1
Common Questions
What are the Top 5 Zip Codes with the Highest Percentage of Households Heated by Bottled Gas / Liquid Propane in Odessa, TX?
Top 5 Zip Codes with the Highest Percentage of Households Heated by Bottled Gas / Liquid Propane in Odessa, TX are:
What zip code has the Highest Percentage of Households Heated by Bottled Gas / Liquid Propane in Odessa, TX?
79766 has the Highest Percentage of Households Heated by Bottled Gas / Liquid Propane in Odessa, TX with 12.5%.
What is the Percentage of Households Heated by Bottled Gas / Liquid Propane in Odessa, TX?
Percentage of Households Heated by Bottled Gas / Liquid Propane in Odessa is 0.70%.
What is the Percentage of Households Heated by Bottled Gas / Liquid Propane in Texas?
Percentage of Households Heated by Bottled Gas / Liquid Propane in Texas is 2.9%.
What is the Percentage of Households Heated by Bottled Gas / Liquid Propane in the United States?
Percentage of Households Heated by Bottled Gas / Liquid Propane in the United States is 4.9%.